Embed Size (px)
Citation preview
Hilton Atlanta HotelAtlanta, GA
NASCOLA Annual MeetingDecember 7, 2007
MEETING AGENDA
Executive Secretary & Treasurer Report
NASCOLA Committee ReportsPT & EQA (Dr. Peerschke)Education (Dr. Zehnder)Website (Dr. Hayward)Membership (Dr. Van Cott)QA Program (Dr. Meijer)
“State of Association” (Dr. Hayward)
NASCOLA Executive Secretary
Elizabeth Plumhoff BS, MT(ASCP) CLS(NCA)
2007 Annual Report
2007 Accomplishments and Collaborations
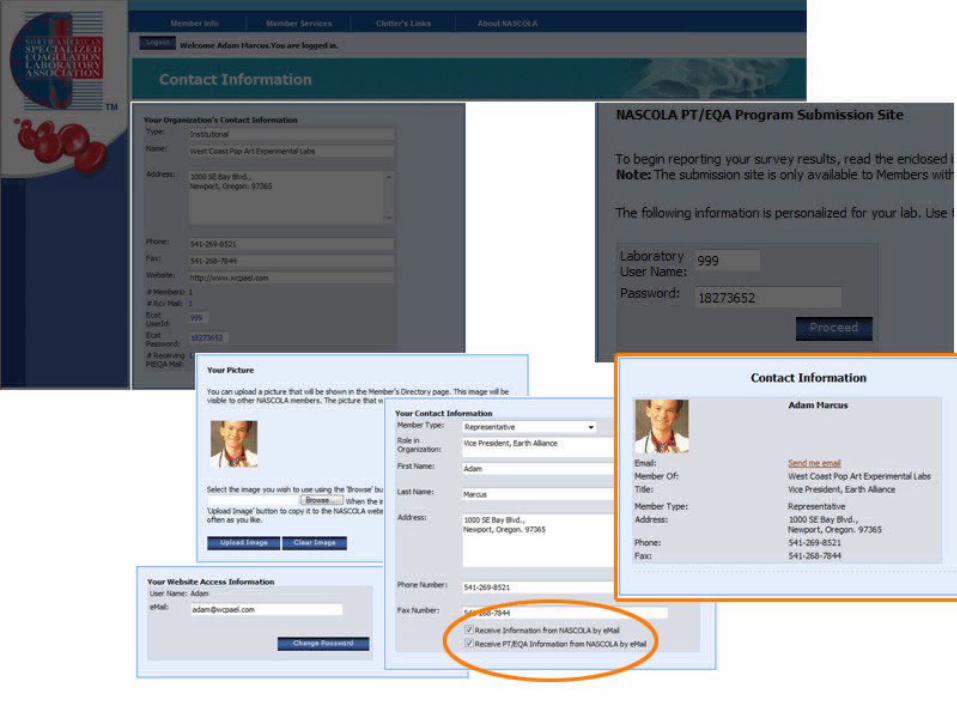
Act as Executive Committee resource – primary contact for NASCOLA membership
Prepare and distribute NASCOLA Newsletter (July 2007) with input from Committee chairs and Executive Officers
Participate in Subcommittee activities and conference calls as directed by Executive Committee
Collaborate with Dr. Cathy Hayward and Dave Hayward on Website design and processes
Maintain accurate membership list and communicate Proficiency Testing program participants to ECAT
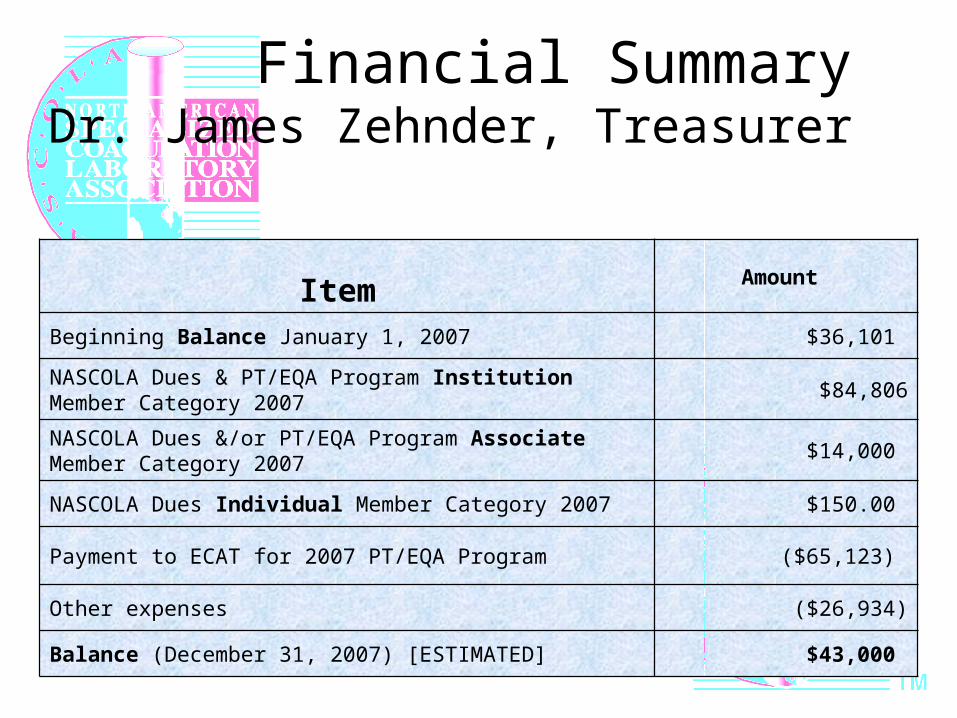
Financial SummaryDr. James Zehnder, Treasurer
Item Amount
Beginning Balance January 1, 2007 $36,101
NASCOLA Dues & PT/EQA Program Institution Member Category 2007
$84,806
NASCOLA Dues &/or PT/EQA Program Associate Member Category 2007
$14,000
NASCOLA Dues Individual Member Category 2007 $150.00
Payment to ECAT for 2007 PT/EQA Program ($65,123)
Other expenses ($26,934)
Balance (December 31, 2007) [ESTIMATED] $43,000
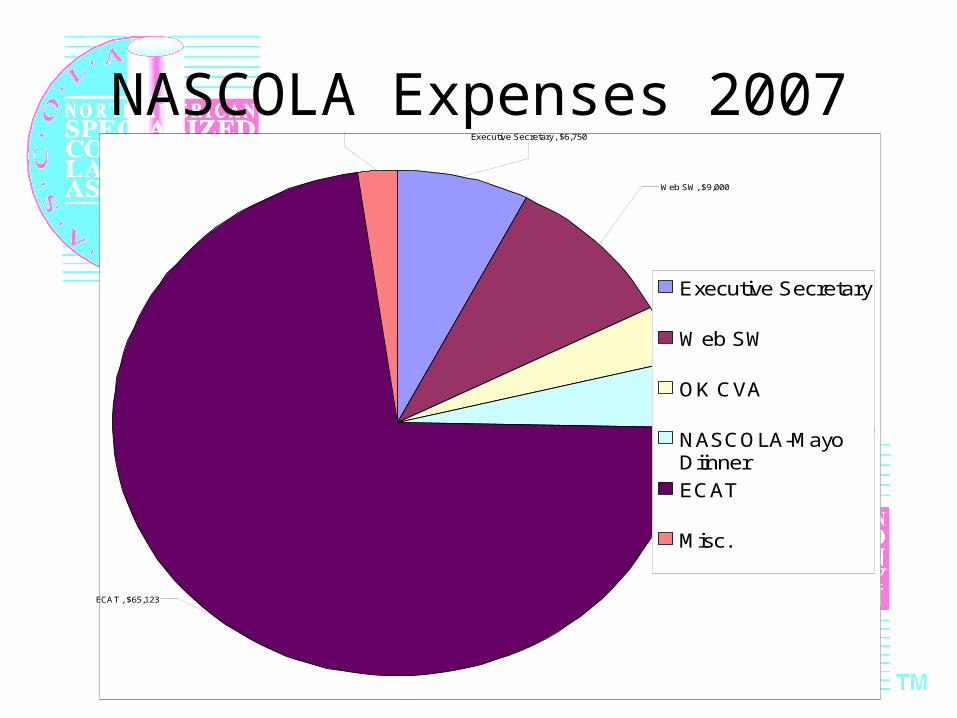
NASCOLA Expenses 2007Executive Secretary, $6,750
Web SW, $9,000
Misc., $1,995
OK CVA, $3,250
NASCOLA-Mayo Diinner, $3,820
ECAT , $65,123
Executive Secretary
Web SW
OK CVA
NASCOLA-MayoDiinner
ECAT
Misc.
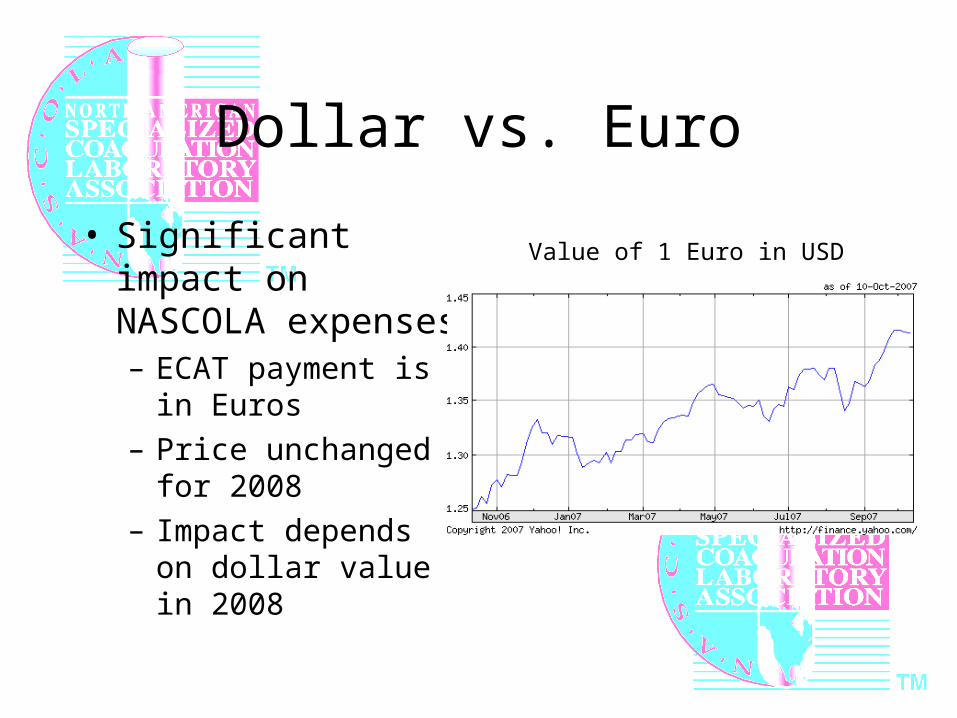
Dollar vs. Euro
• Significant impact on NASCOLA expenses– ECAT payment is in
Euros
– Price unchanged for 2008
– Impact depends on dollar value in 2008
Value of 1 Euro in USD
•
NASCOLA CommitteeReports & Updates
PT & EQA: Dr. PeerschkeEducation: Dr. ZehnderWebsite: Dr. HaywardMembership: Dr. Van CottQA Program: Dr. Marlar
PT EQA
2007 Annual Report
Ellinor I. Peerschke, Chair
Working Groups
Von Willebrand’s Disease
• Wayne Chandler, M.D., Chair
• Ken Friedman, M.D.
• Donna D. Castellone, M.A., MT (ASCP) SH
• Ellinor I. Peerschke, Ph.D.
FACTORS
• George Rodgers, M.D., Chair
• David Chance, M.T. (ASCP)
Thrombophilia Subcommittee• Elizabeth Van Cott, M.D., Chair• John Heit, M.D. • Stephen Johnson, M.T.• Rita Selby, M.D.
Lupus Anticoagulant Subcommittee • Chuck Eby, M.D., Chair• Agnes Aysola, M.D.• Larry Brace, Ph.D.• Joan Mattson, M.D.• Kandice Kottke-Marchant, MD,
Ph.D
Marlies Ledford-Kraemer, MBA, BS, MT(ASCP)SH - ECAT liason
Activities
• Thrombophilia Testing– Report on ATIII testing presented at Mayo-NASCOLA
meeting: Rita Selby• VWF Multimer Analysis
– Report on Multimer Analysis presented at Mayo-NASCOLA meeting: Wayne Chandler
• Lupus Anticoagulant Testing– Chuck Eby: new subcommittee chair
• Factor VIII Inhibitor Survey Results– Overview presented at this meeting: Ellinor Peerschke,
Donna Castellone, Marlies Ledford-Kraemer
2008 Goals
• Develop guidelines for F VIII inhibitor testing (Ellinor Peerschke)
• Develop questionnaire to better understand interpretation and reporting of VWF test results (Wayne Chandler) in North America
• Evaluate functional APCR testing by NASCOLA laboratories (Betsy VanCott)


•
Education Committee
Dr. James Zehnder, Chair
NASCOLA Education Committee Update
• HIT Survey - in press, Thrombosis and Haemostasis– ECAT Survey– Proficiency testing
• HTRS/NASCOLA conference April 2008• Mayo/NASCOLA conference 2009• Pediatric Subcommittee - Anthony Chan
Catherine Hayward, MD, PhDWebsite Committee Chair
Website Committee UpdateNASCOLA Annual Meeting
December 7, 2007

•
Membership Committee
Dr. Elizabeth Van Cott, Chair
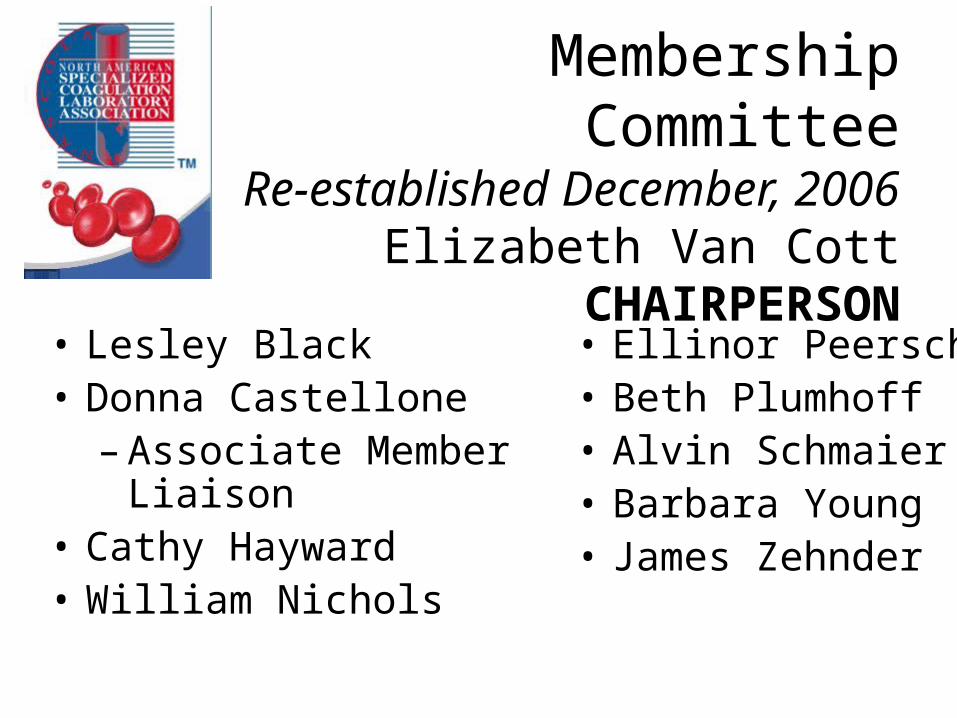
Membership CommitteeRe-established December, 2006
Elizabeth Van CottCHAIRPERSON
• Lesley Black• Donna Castellone
– Associate Member Liaison• Cathy Hayward• William Nichols
• Ellinor Peerschke• Beth Plumhoff• Alvin Schmaier• Barbara Young• James Zehnder
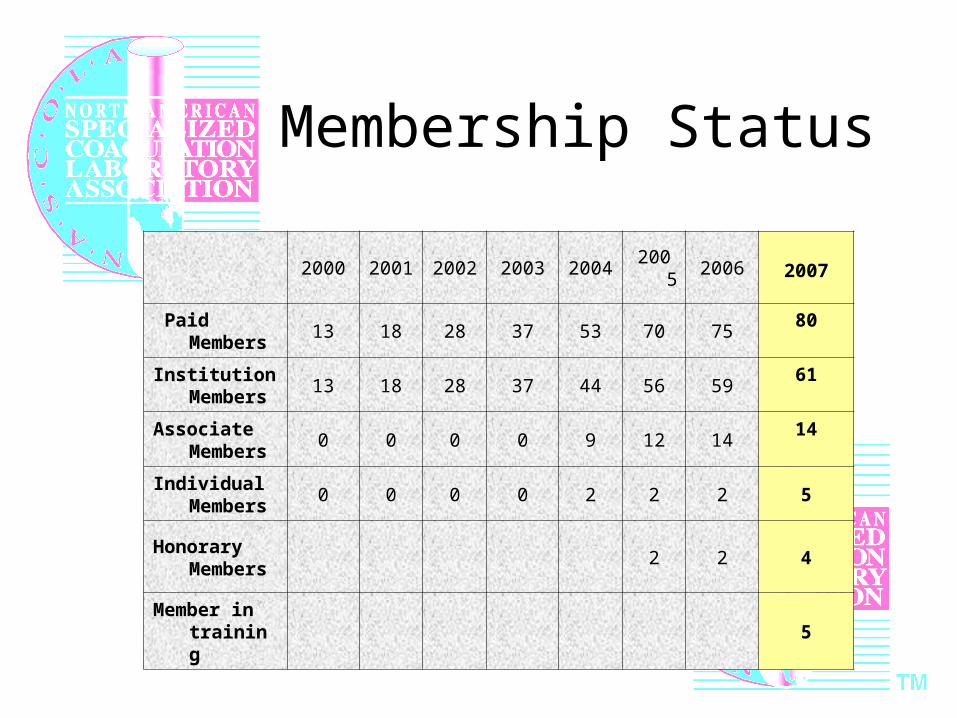
Membership Status
2000 2001 2002 2003 2004 2005 2006 2007
Paid Members
13 18 28 37 53 70 7580
Institution Members
13 18 28 37 44 56 5961
Associate Members
0 0 0 0 9 12 1414
Individual Members
0 0 0 0 2 2 2 5
Honorary Members
2 2 4
Member in training
5
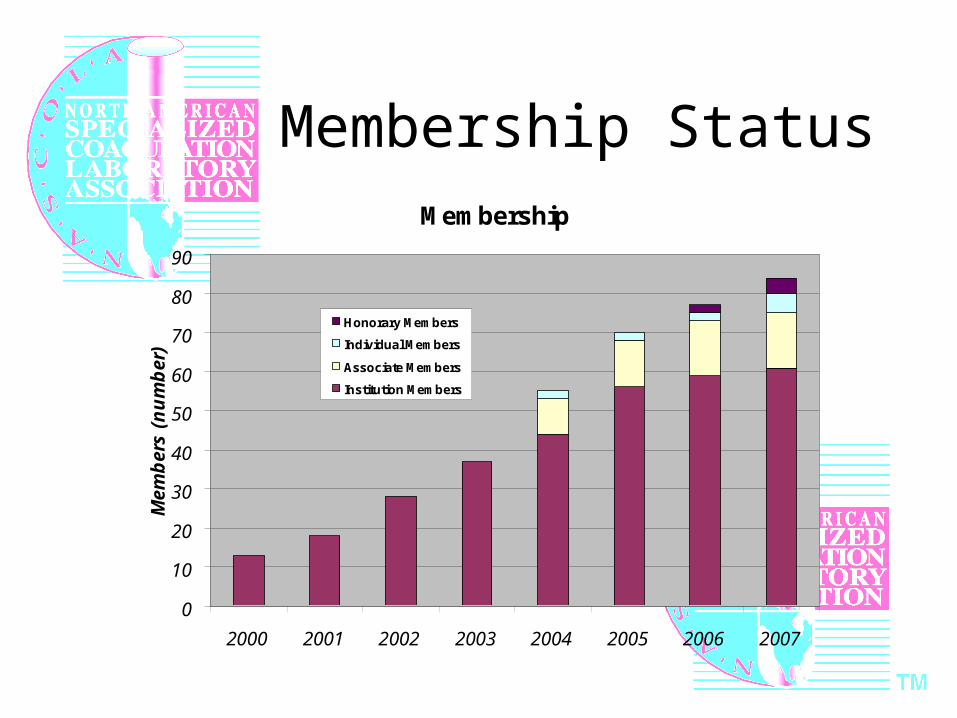
Membership StatusMembership
0
10
20
30
40
50
60
70
80
90
2000 2001 2002 2003 2004 2005 2006 2007
Mem
ber
s (n
um
ber
)
Honorary Members
Individual Members
Associate Members
Institution Members
Every Year NASCOLA Associate Members
Thank you!
• Precision Biologic• Chrono-log Corporation• Dade Behring• Diagnostica Stago• DiaPharma• George King Bio-Medical
Membership CommitteeGoals and Activities
• Recruitment of new associate members and institutional members– Invitation letters written by committee– Special thank you to Cathy Hayward, Lesley
Black, Barbara Young and Betsy Van Cott for contracting potential institutional members in 2007
– Special thank you to Donna Castellone for her role as Associate Member Liaison

Membership CommitteeGoals and Activities
• Recruitment, continued:– “Top 10 Reasons to Join NASCOLA” assembled:
quotes from current members
http://nascola.org/Testimonials.aspx
Submit your own quote, if you want
Membership CommitteeGoals and Activities
• Assist Executive Committee with databases and financial analysis/decisions about membership fees
• Communication to NASCOLA membership– Newsletter to membership sent summer 2007
(compiled by Beth Plumhoff)– Information sent in response to inquiries about
joining NASCOLA (Beth Plumhoff and others)
Membership CommitteeGoals and Activities
• Develop new benefits of membership– Associate Member Awards Program (requested by
Associate Members): Sponsorship of NASCOLA institutional member dues and proficiency costs (recipient/s chosen by Associate Member); acknowledge Associate Member on website
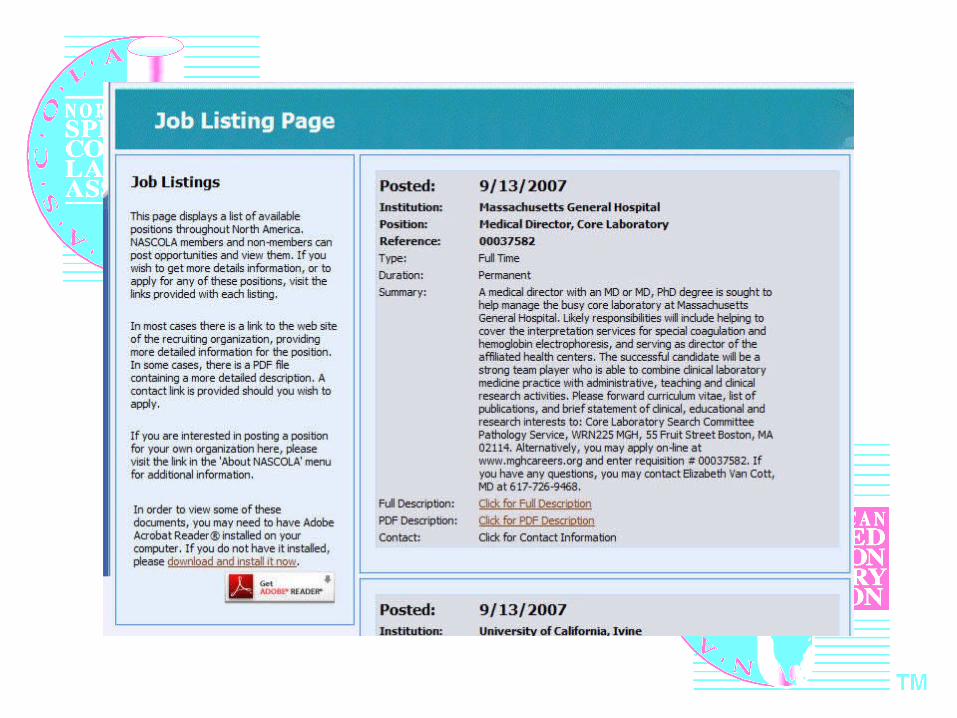
– Members hosting a meeting can post announcement on NASCOLA website
Membership CommitteeGoals and Activities
• Develop new benefits of membership, continued
– Associate Member Educational Programs: Associate Members offered to sponsor educational conferences with NASCOLA
– Members can have NASCOLA logo and link on their website

Membership Committee
• Contact us with your ideas about increasing the values of membership
• Feel free to tell others about the value of being part of NASCOLA
• Feel free to submit a quote/comment/vignette for the “Top 10 Reasons to Join NASCOLA” list
•
NASCOLA QualityAssessment Program
Dr. Richard Marlar, Director
NASCOLA Quality Assessment Program Highlights
• Total member participants = 62
– Complete Programs = 43
– Partial Programs = 19
NASCOLA Quality Assessment Program Highlights
• New Modules for 2007
–Thrombin Generation Test
–HIT testing Pilot
NASCOLA Quality Assessment Program Highlights
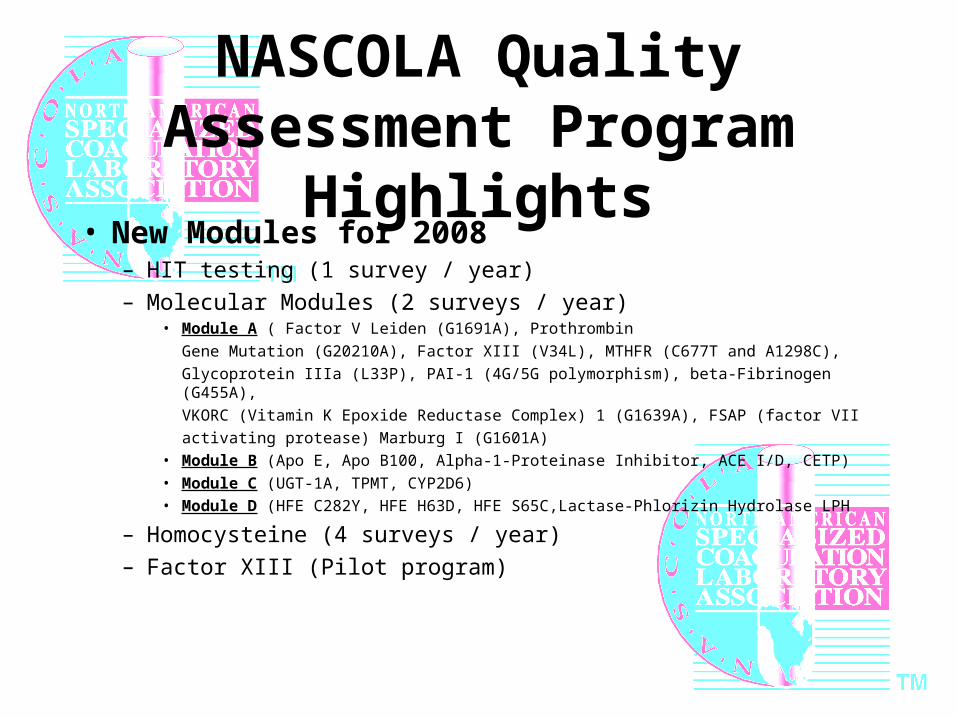
• New Modules for 2008– HIT testing (1 survey / year)
– Molecular Modules (2 surveys / year)• Module A ( Factor V Leiden (G1691A), Prothrombin
Gene Mutation (G20210A), Factor XIII (V34L), MTHFR (C677T and A1298C),
Glycoprotein IIIa (L33P), PAI-1 (4G/5G polymorphism), beta-Fibrinogen (G455A),
VKORC (Vitamin K Epoxide Reductase Complex) 1 (G1639A), FSAP (factor VII
activating protease) Marburg I (G1601A)
• Module B (Apo E, Apo B100, Alpha-1-Proteinase Inhibitor, ACE I/D, CETP)
• Module C (UGT-1A, TPMT, CYP2D6)
• Module D (HFE C282Y, HFE H63D, HFE S65C,Lactase-Phlorizin Hydrolase LPH
– Homocysteine (4 surveys / year)
– Factor XIII (Pilot program)
Catherine Hayward, MD, PhDNASCOLA President 2007-2009
“State of the Association - 2007”NASCOLA Annual Meeting
December 7, 2007
NASCOLA 2007 Highlights
•Elizabeth Plumhoff - Executive Secretary (3/06)•Alvin Schmaier – Immediate Past President•Membership Committee (Betsy Van Cott)
Many new initiatives, including “testimonials” on website•Memberships as of November 2007
Institutional members 61 (from 59 as of 12/06) Associate members 14 Individual members 5*Honorary members 4*Trainee memberships introduced - now 5
•Associate Membership Liaison (Donna Castellone)*new!
•PT Survey Program (Director: Richard Marlar)•Continued collaboration with ECAT (Piet Meijer)•New surveys piloted•Expanded survey menu options for 2008•ECAT Liaison (Marlies Ledford-Kraemer)
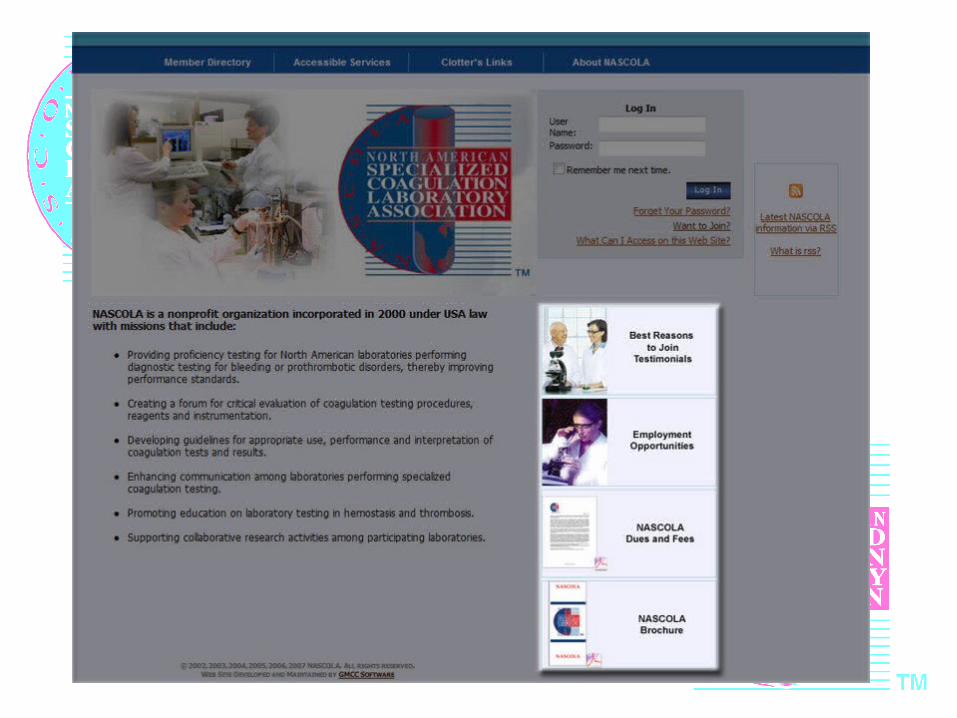
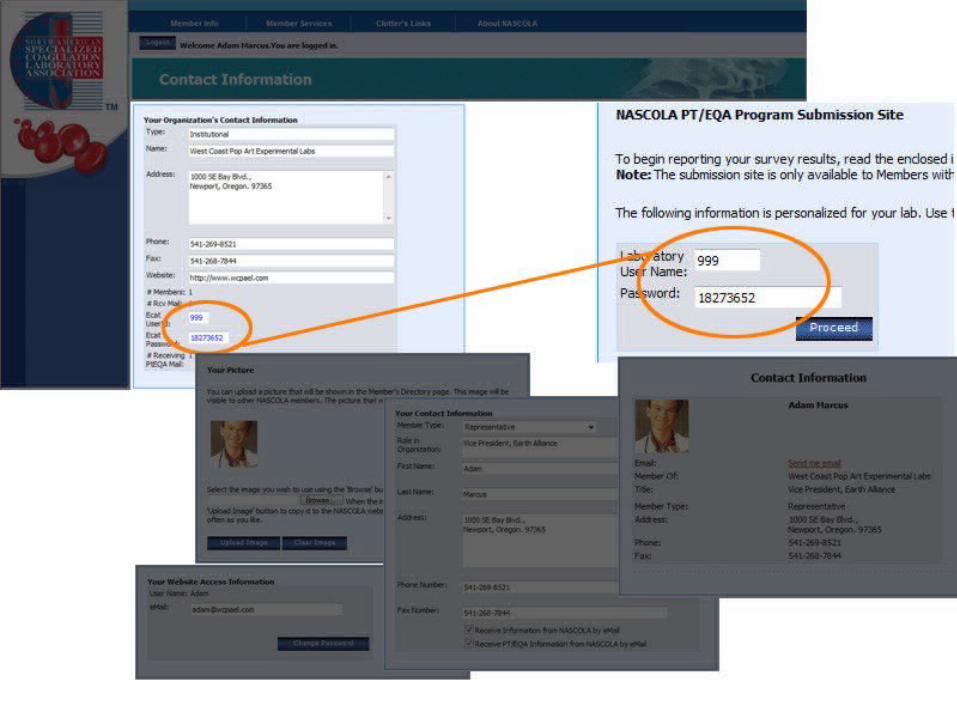
•Major NASCOLA Website Redesign (Catherine & David Hayward)
•Migration to new site, introduction of many new features
NASCOLA 2007 Highlights
NASCOLA 2007 Highlights
•On-line questionnaires and meetings on SurveyMonkey(Karen Moffat)
•PT & EQA survey analysis (Ellinor Peerschke)•Treasurer - Financial solvency (Jim Zehnder)•NASCOLA Secretary (Dot Adcock)•New Reporting Committee (Dot Adcock)•Education Committee (Jim Zehnder)
More NASCOLA publications and studies!NASCOLA-Mayo Conference April 26-28th, 2007 Education Liaison (Bill Nichols)
NASCOLA 2007 Highlights
• Other Initiatives
Discussions with College of American Pathologistson potential collaborations
Discussions with Hemophilia Thrombosis Research Society on educational meeting collaboration for 2008
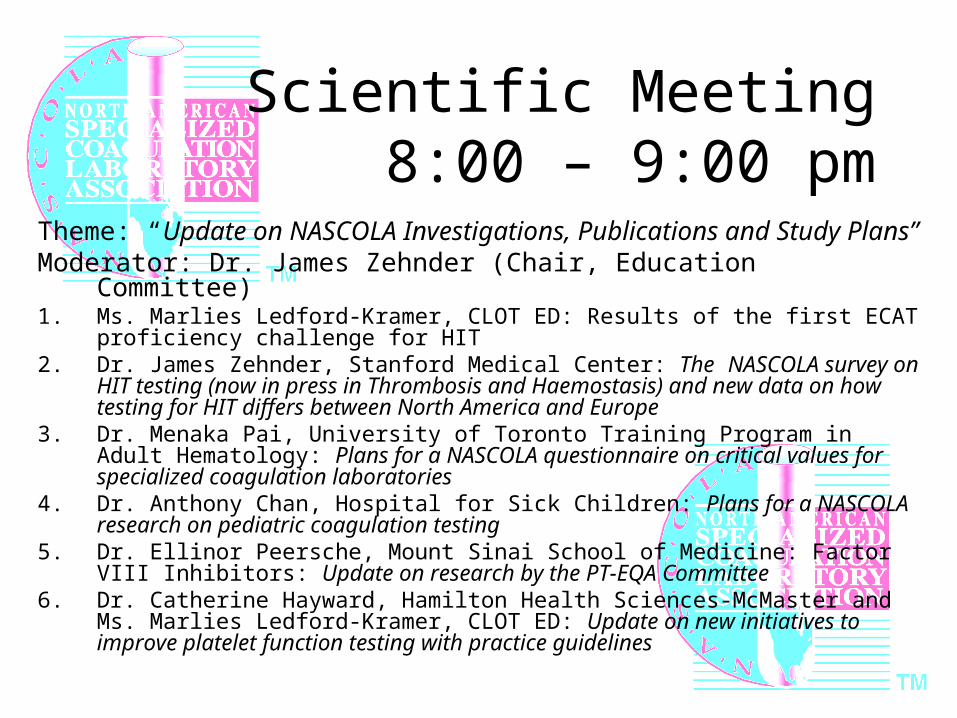
Scientific Meeting8:00 – 9:00 pm
Theme: “Update on NASCOLA Investigations, Publications and Study Plans”Moderator: Dr. James Zehnder (Chair, Education Committee)1. Ms. Marlies Ledford-Kramer, CLOT ED: Results of the first ECAT proficiency
challenge for HIT2. Dr. James Zehnder, Stanford Medical Center: The NASCOLA survey on HIT testing
(now in press in Thrombosis and Haemostasis) and new data on how testing for HIT differs between North America and Europe
3. Dr. Menaka Pai, University of Toronto Training Program in Adult Hematology: Plans for a NASCOLA questionnaire on critical values for specialized coagulation laboratories
4. Dr. Anthony Chan, Hospital for Sick Children: Plans for a NASCOLA research on pediatric coagulation testing
5. Dr. Ellinor Peersche, Mount Sinai School of Medicine: Factor VIII Inhibitors: Update on research by the PT-EQA Committee
6. Dr. Catherine Hayward, Hamilton Health Sciences-McMaster and Ms. Marlies Ledford-Kramer, CLOT ED: Update on new initiatives to improve platelet function testing with practice guidelines
Results of the first ECAT proficiency challenge for HIT
Ms. Marlies Ledford-Kramer, CLOT-ED, Inc
NASCOLA/ECAT Liaison
ECAT Foundation www.ecat.nlInternational EQA Programme in Thrombosis and Haemostasis
Inter-laboratory comparison of laboratory testing of Heparin Induced Thrombocytopenia (HIT).
Preliminary results of a pilot study
Piet Meijer, PhDDirectorECAT FoundationLeiden, The Netherlands
Presented by:Marlies Ledford-KraemerCLOT-ED, IncNASCOLA/ECAT Liaison
ECAT Foundation www.ecat.nlInternational EQA Programme in Thrombosis and Haemostasis
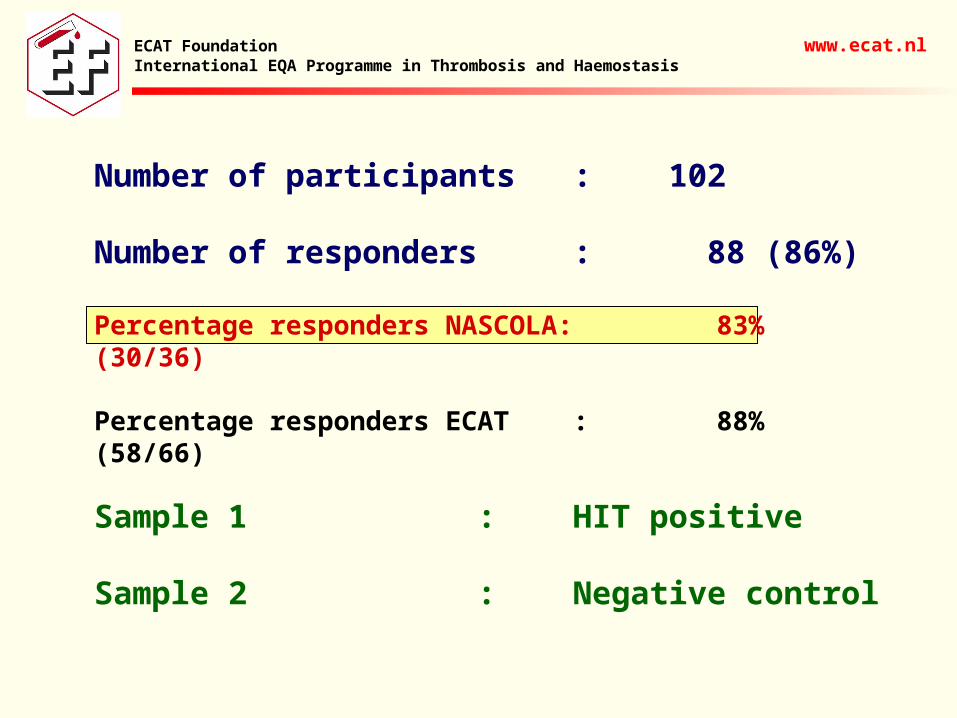
Number of participants : 102
Number of responders : 88 (86%)
Percentage responders NASCOLA: 83% (30/36)
Percentage responders ECAT : 88% (58/66)
Sample 1 : HIT positive
Sample 2 : Negative control
Methods
ECAT Foundation www.ecat.nlInternational EQA Programme in Thrombosis and Haemostasis
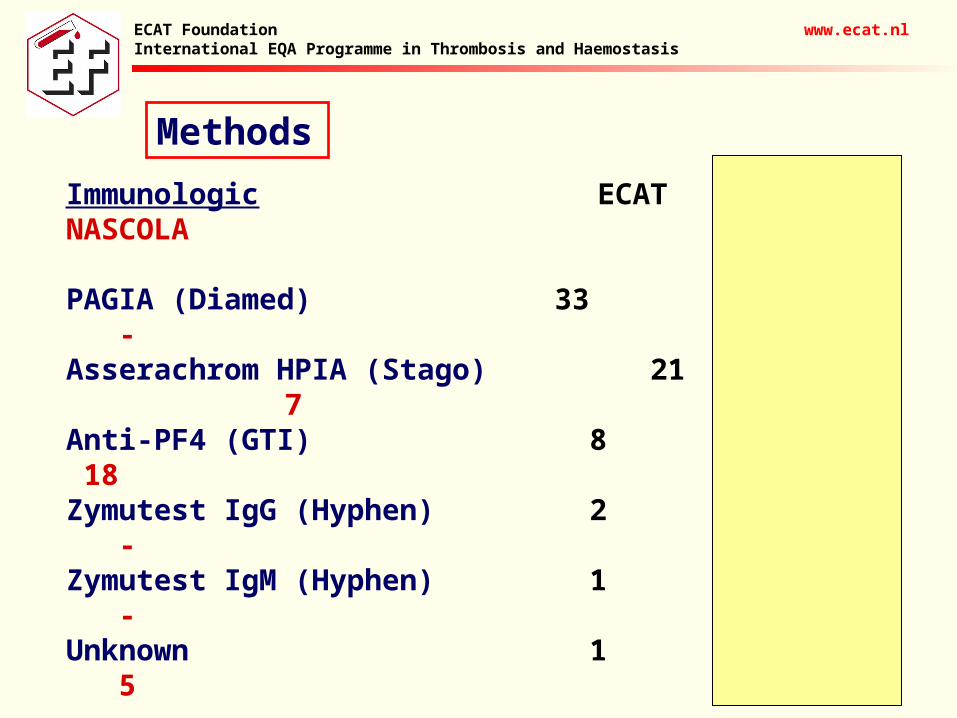
Immunologic ECAT NASCOLA
PAGIA (Diamed) 33 -Asserachrom HPIA (Stago) 21 7Anti-PF4 (GTI) 8 18Zymutest IgG (Hyphen) 2 -Zymutest IgM (Hyphen) 1 -Unknown 1 5
Functional
Platelet aggregation 18 2Platelet activation 2 -Serotonin Release Assay 1 2Flowcytometry 1 -
Results
ECAT Foundation www.ecat.nlInternational EQA Programme in Thrombosis and Haemostasis
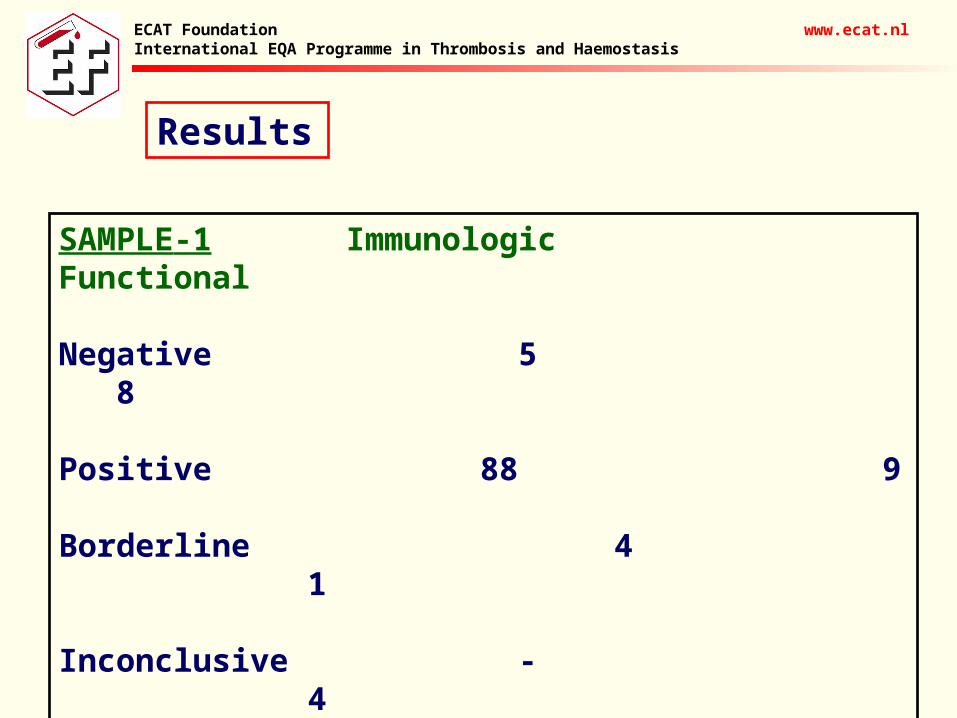
SAMPLE-1 Immunologic Functional
Negative 5 8
Positive 88 9
Borderline 4 1
Inconclusive - 4
Results
ECAT Foundation www.ecat.nlInternational EQA Programme in Thrombosis and Haemostasis
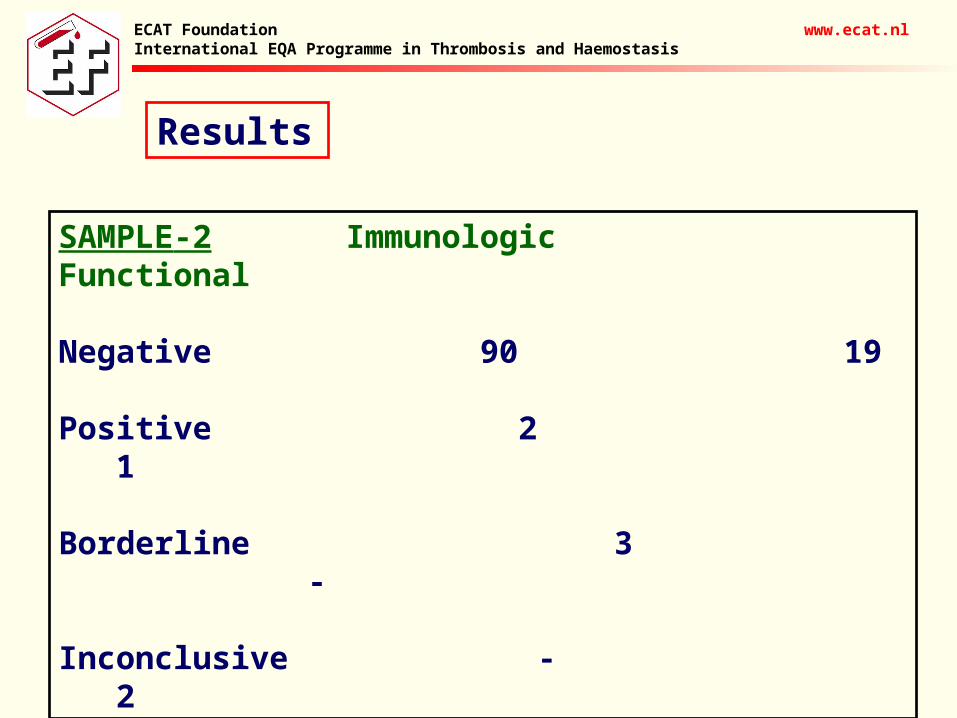
SAMPLE-2 Immunologic Functional
Negative 90 19
Positive 2 1
Borderline 3 -
Inconclusive - 2
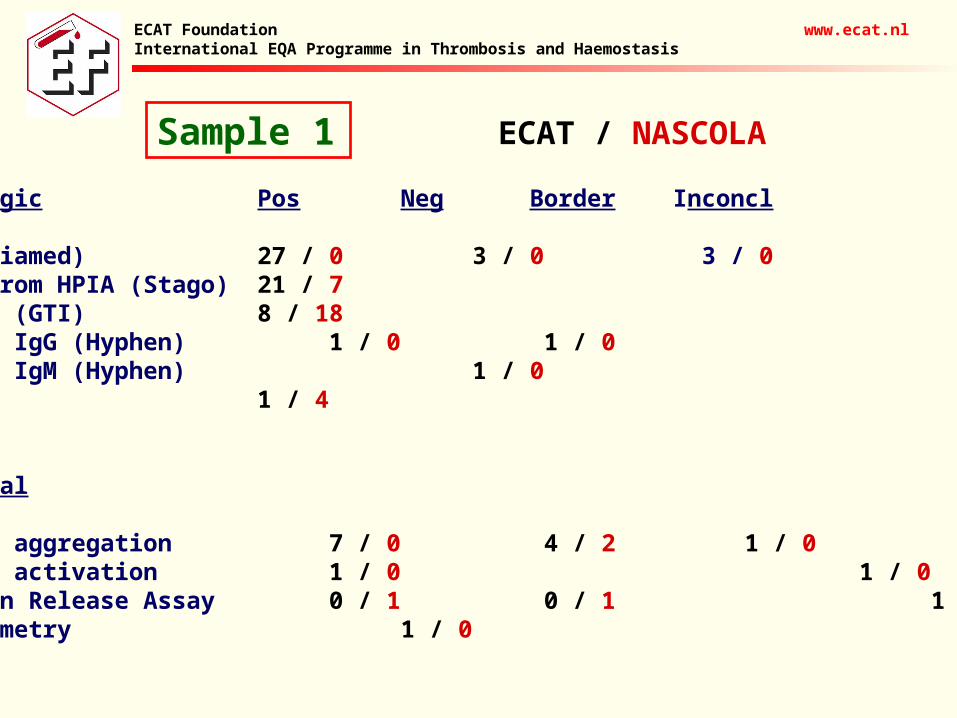
Sample 1
ECAT Foundation www.ecat.nlInternational EQA Programme in Thrombosis and Haemostasis
Immunologic Pos Neg Border Inconcl
PAGIA (Diamed) 27 / 0 3 / 0 3 / 0Asserachrom HPIA (Stago) 21 / 7Anti-PF4 (GTI) 8 / 18Zymutest IgG (Hyphen) 1 / 0 1 / 0Zymutest IgM (Hyphen) 1 / 0Unknown 1 / 4
Functional
Platelet aggregation 7 / 0 4 / 2 1 / 0 2 / 0Platelet activation 1 / 0 1 / 0Serotonin Release Assay 0 / 1 0 / 1 1 / 0Flowcytometry 1 / 0
ECAT / NASCOLA
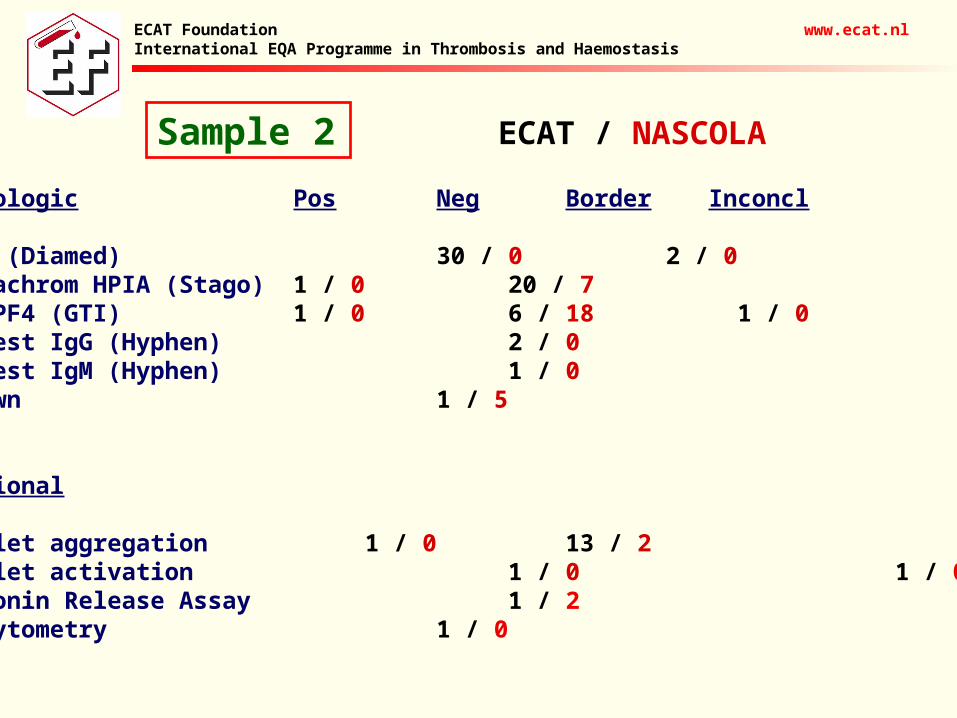
Sample 2
ECAT Foundation www.ecat.nlInternational EQA Programme in Thrombosis and Haemostasis
Immunologic Pos Neg Border Inconcl
PAGIA (Diamed) 30 / 0 2 / 0Asserachrom HPIA (Stago) 1 / 0 20 / 7Anti-PF4 (GTI) 1 / 0 6 / 18 1 / 0Zymutest IgG (Hyphen) 2 / 0Zymutest IgM (Hyphen) 1 / 0Unknown 1 / 5
Functional
Platelet aggregation 1 / 0 13 / 2 1 / 0Platelet activation 1 / 0 1 / 0Serotonin Release Assay 1 / 2 Flowcytometry 1 / 0
ECAT / NASCOLA
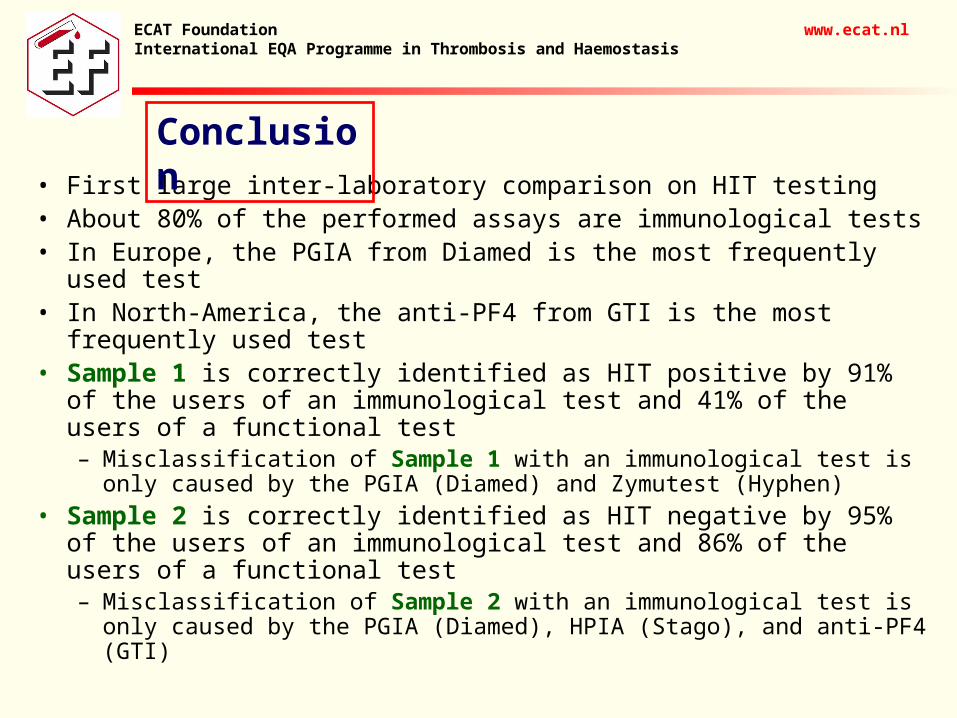
• First large inter-laboratory comparison on HIT testing• About 80% of the performed assays are immunological tests• In Europe, the PGIA from Diamed is the most frequently used test• In North-America, the anti-PF4 from GTI is the most frequently
used test• Sample 1 is correctly identified as HIT positive by 91% of the
users of an immunological test and 41% of the users of a functional test– Misclassification of Sample 1 with an immunological test is only
caused by the PGIA (Diamed) and Zymutest (Hyphen)
• Sample 2 is correctly identified as HIT negative by 95% of the users of an immunological test and 86% of the users of a functional test– Misclassification of Sample 2 with an immunological test is only
caused by the PGIA (Diamed), HPIA (Stago), and anti-PF4 (GTI)
Conclusion
ECAT Foundation www.ecat.nlInternational EQA Programme in Thrombosis and Haemostasis
The NASCOLA survey on HIT testing and new data on how testing for HIT differs between North America and Europe
Dr. James Zehnder
Stanford Medical Center
NASCOLA Treasurer
NASCOLA Education Committee Chair
HIT Practices Survey: ECAT Results
Jim Zehnder, M.D.
Stanford University
December 7, 2007
Heparin-Induced Thrombocytopenia
• Serious complication of heparin therapy
• Clinico-pathologic entity
• Laboratory practices have important role in diagnosing or excluding HIT
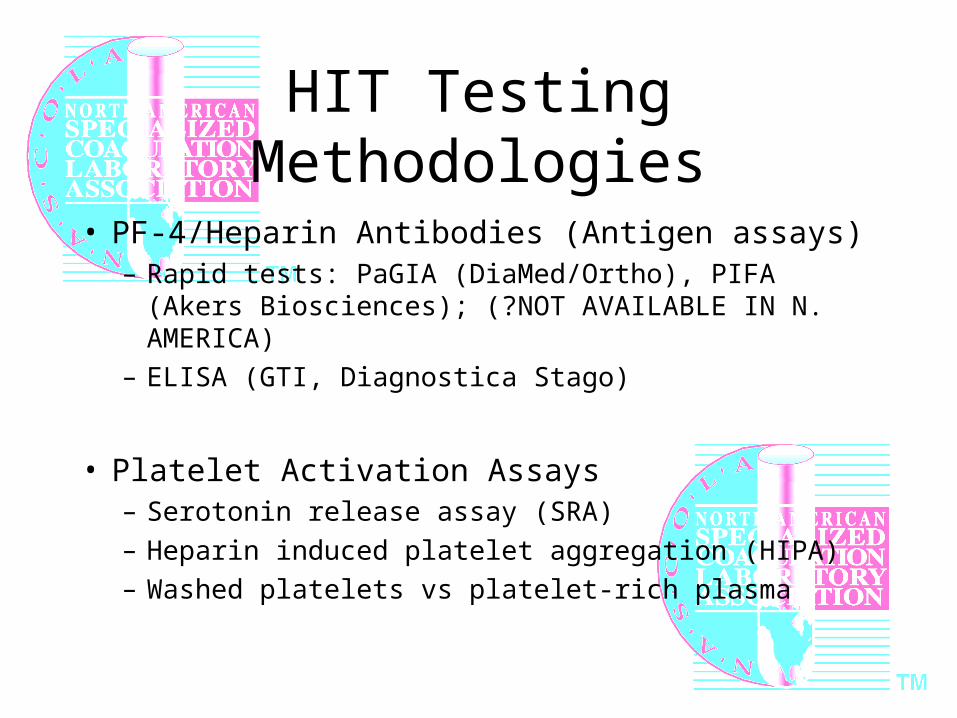
HIT Testing Methodologies
• PF-4/Heparin Antibodies (Antigen assays)– Rapid tests: PaGIA (DiaMed/Ortho), PIFA (Akers
Biosciences); (?NOT AVAILABLE IN N. AMERICA)
– ELISA (GTI, Diagnostica Stago)
• Platelet Activation Assays– Serotonin release assay (SRA)
– Heparin induced platelet aggregation (HIPA)
– Washed platelets vs platelet-rich plasma
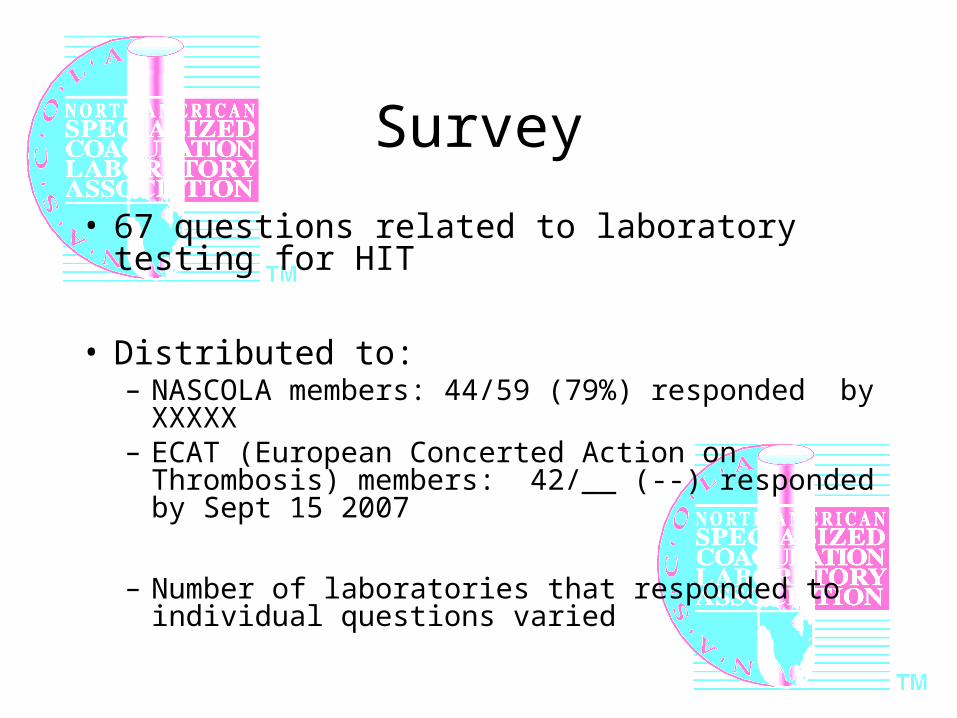
Survey
• 67 questions related to laboratory testing for HIT
• Distributed to:– NASCOLA members: 44/59 (79%) responded by
XXXXX– ECAT (European Concerted Action on Thrombosis)
members: 42/__ (--) responded by Sept 15 2007
– Number of laboratories that responded to individual questions varied
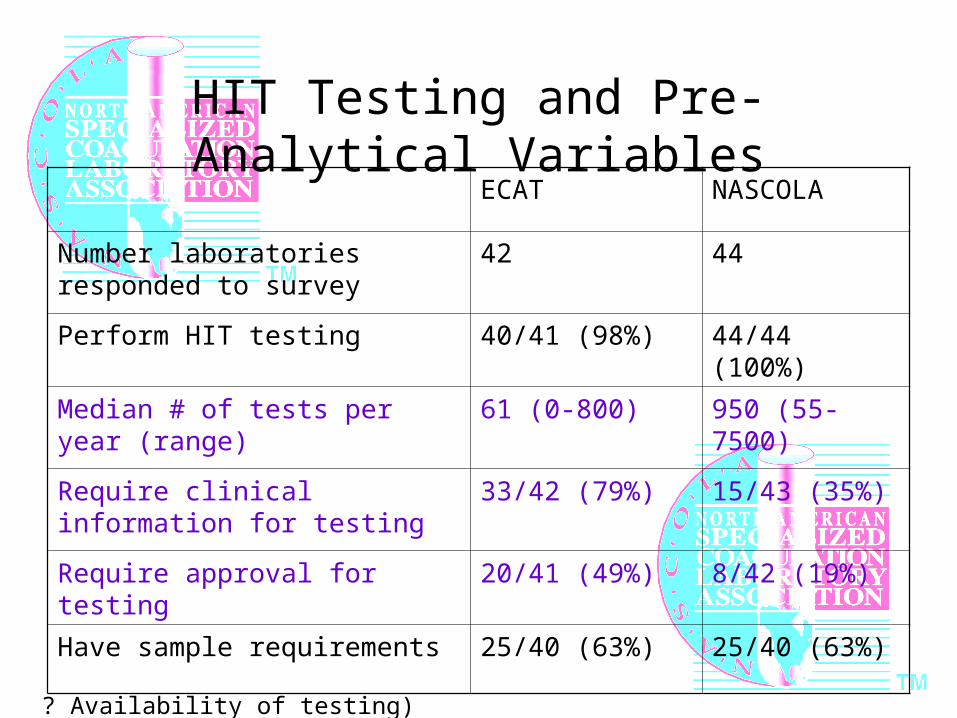
HIT Testing and Pre-Analytical Variables
ECAT NASCOLA
Number laboratories responded to survey
42 44
Perform HIT testing 40/41 (98%) 44/44 (100%)
Median # of tests per year (range) 61 (0-800) 950 (55-7500)
Require clinical information for testing
33/42 (79%) 15/43 (35%)
Require approval for testing 20/41 (49%) 8/42 (19%)
Have sample requirements 25/40 (63%) 25/40 (63%)
? Availability of testing)
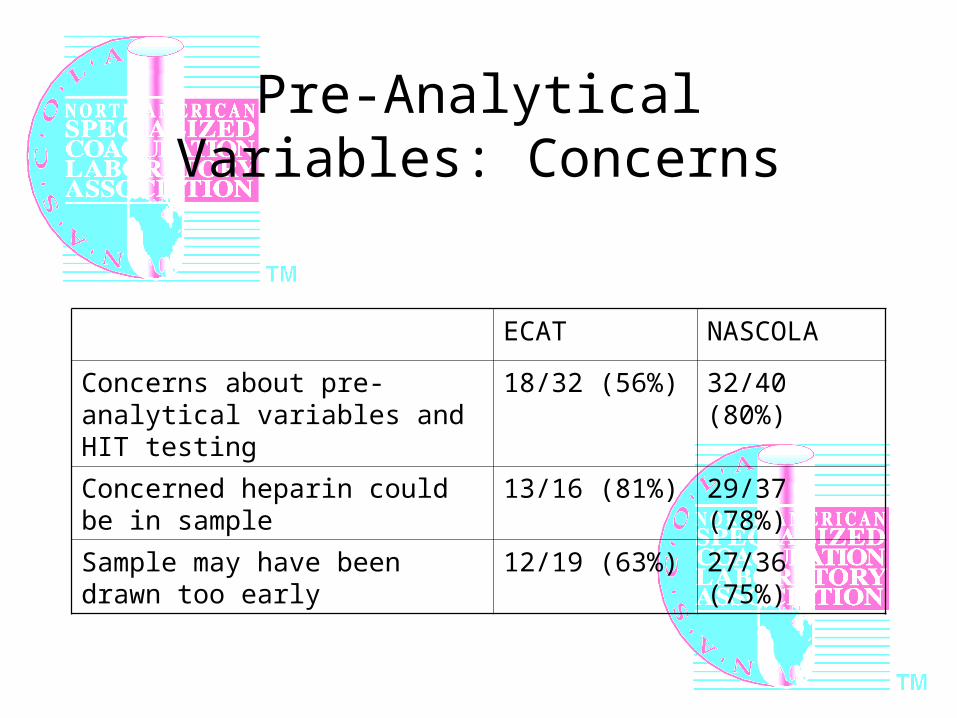
Pre-Analytical Variables: Concerns
ECAT NASCOLA
Concerns about pre-analytical variables and HIT testing
18/32 (56%) 32/40 (80%)
Concerned heparin could be in sample
13/16 (81%) 29/37 (78%)
Sample may have been drawn too early
12/19 (63%) 27/36 (75%)
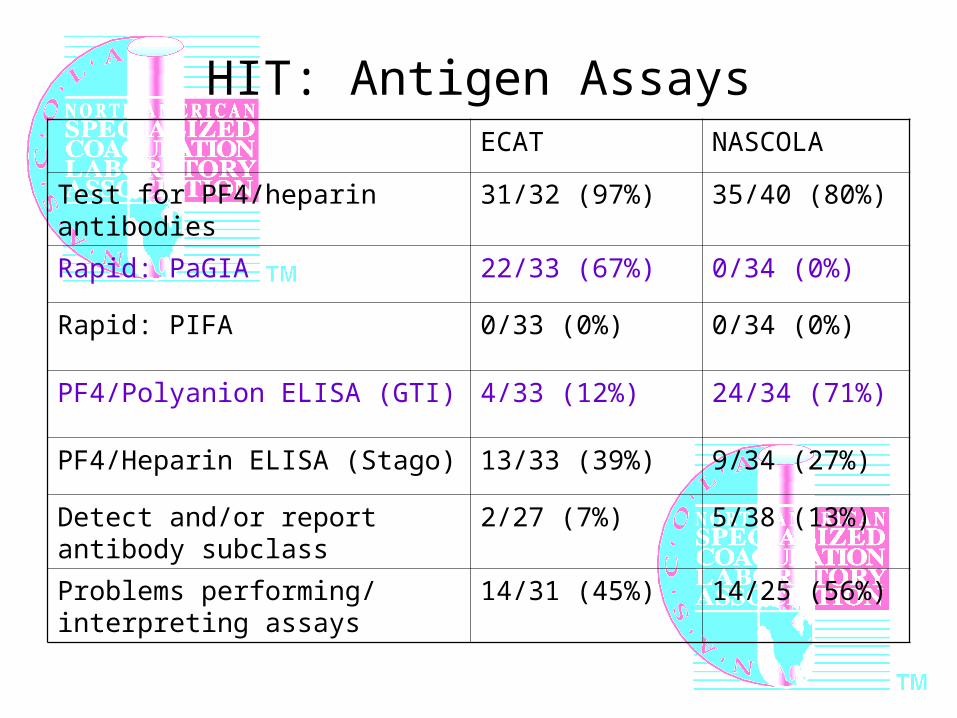
HIT: Antigen AssaysECAT NASCOLA
Test for PF4/heparin antibodies 31/32 (97%) 35/40 (80%)
Rapid: PaGIA 22/33 (67%) 0/34 (0%)
Rapid: PIFA 0/33 (0%) 0/34 (0%)
PF4/Polyanion ELISA (GTI) 4/33 (12%) 24/34 (71%)
PF4/Heparin ELISA (Stago) 13/33 (39%) 9/34 (27%)
Detect and/or report antibody subclass
2/27 (7%) 5/38 (13%)
Problems performing/ interpreting assays
14/31 (45%) 14/25 (56%)
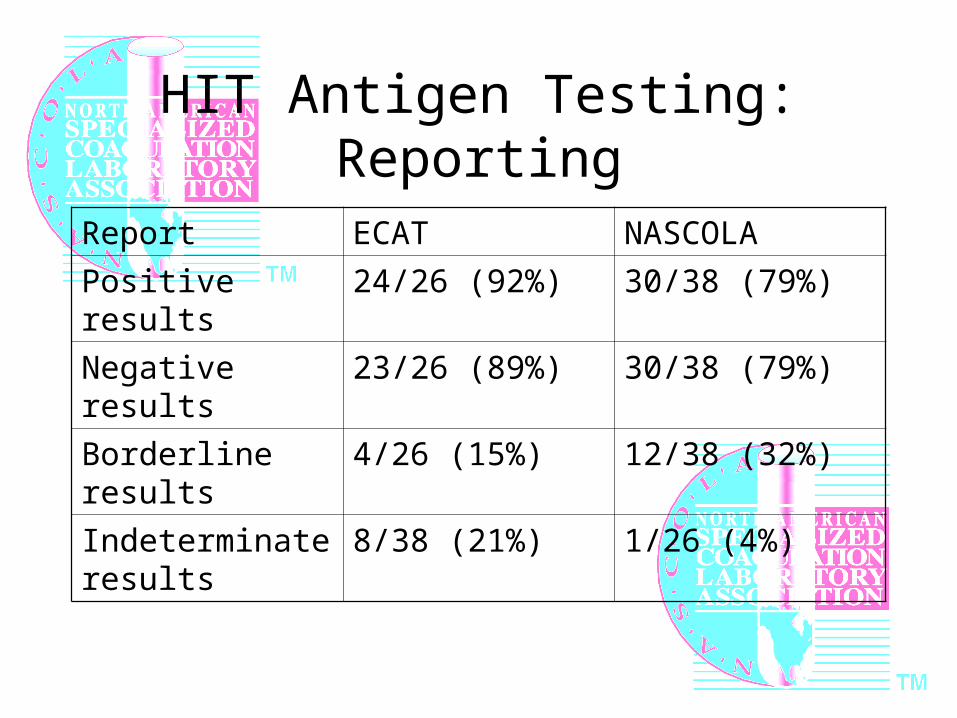
HIT Antigen Testing: Reporting
Report ECAT NASCOLA
Positive results 24/26 (92%) 30/38 (79%)
Negative results 23/26 (89%) 30/38 (79%)
Borderline results 4/26 (15%) 12/38 (32%)
Indeterminate results
8/38 (21%) 1/26 (4%)
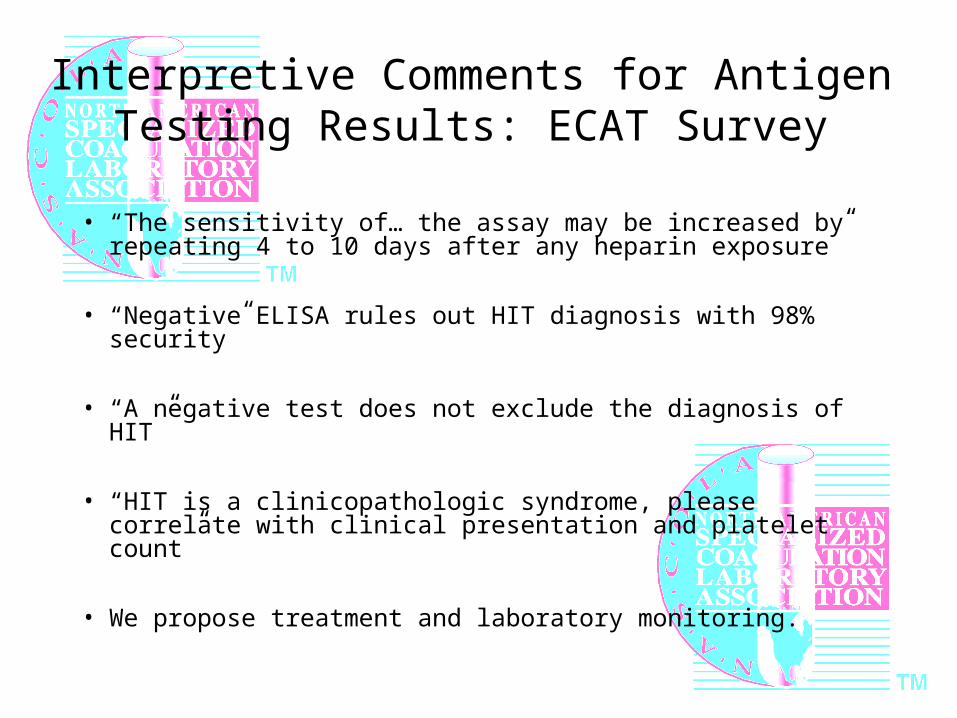
Interpretive Comments for Antigen Testing Results: ECAT Survey
• “The sensitivity of… the assay may be increased by repeating 4 to 10 days after any heparin exposure”
• “Negative ELISA rules out HIT diagnosis with 98% security”
• “A negative test does not exclude the diagnosis of HIT”
• “HIT is a clinicopathologic syndrome, please correlate with clinical presentation and platelet count”
• We propose treatment and laboratory monitoring.
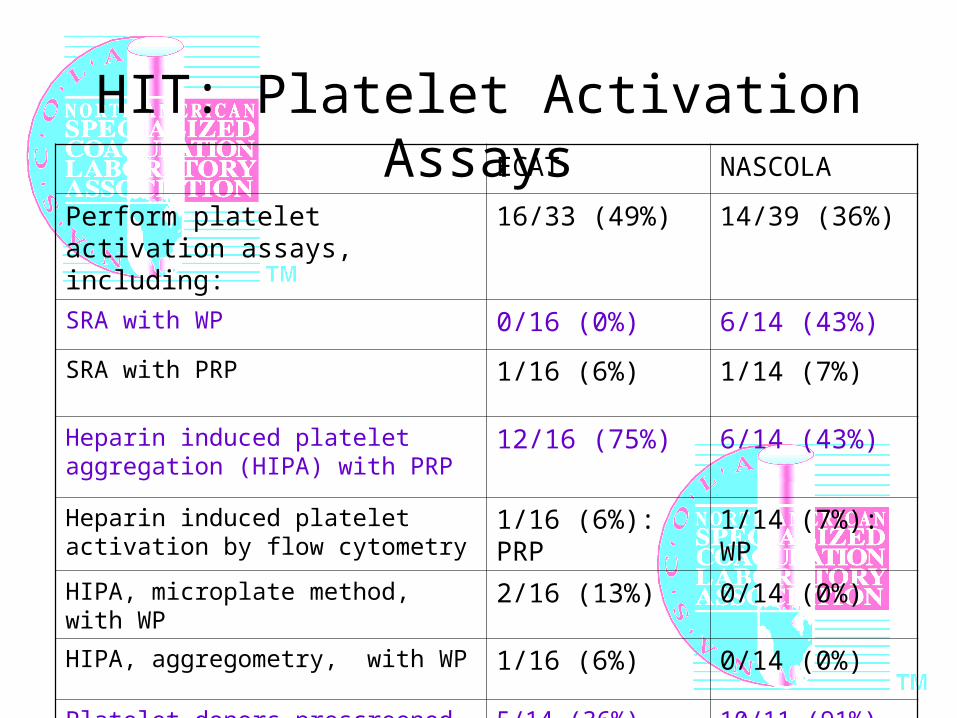
HIT: Platelet Activation AssaysECAT NASCOLA
Perform platelet activation assays, including:
16/33 (49%) 14/39 (36%)
SRA with WP 0/16 (0%) 6/14 (43%)
SRA with PRP 1/16 (6%) 1/14 (7%)
Heparin induced platelet aggregation (HIPA) with PRP
12/16 (75%) 6/14 (43%)
Heparin induced platelet activation by flow cytometry
1/16 (6%): PRP 1/14 (7%): WP
HIPA, microplate method, with WP 2/16 (13%) 0/14 (0%)
HIPA, aggregometry, with WP 1/16 (6%) 0/14 (0%)
Platelet donors prescreened for HIT reactivity
5/14 (36%) 10/11 (91%)
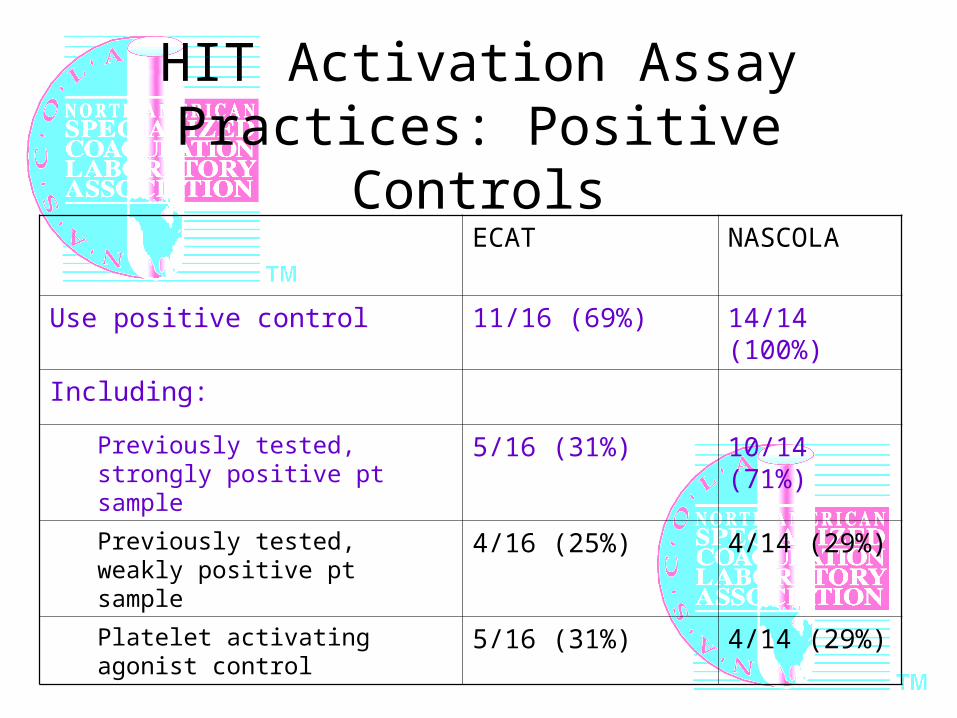
HIT Activation Assay Practices: Positive Controls
ECAT NASCOLA
Use positive control 11/16 (69%) 14/14 (100%)
Including:
Previously tested, strongly positive pt sample
5/16 (31%) 10/14 (71%)
Previously tested, weakly positive pt sample
4/16 (25%) 4/14 (29%)
Platelet activating agonist control 5/16 (31%) 4/14 (29%)
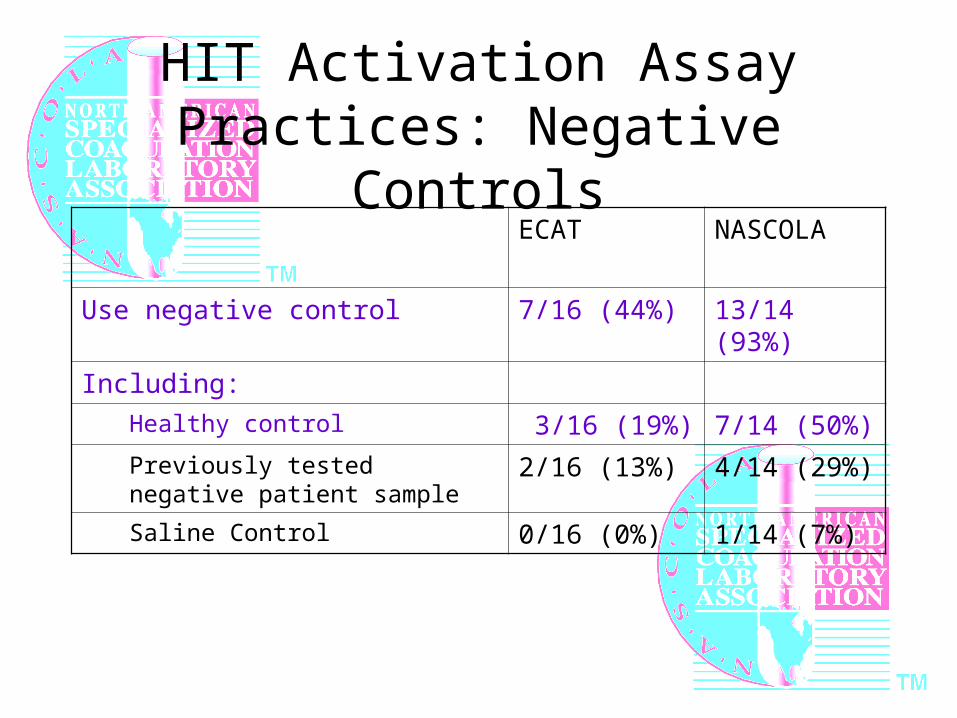
HIT Activation Assay Practices: Negative Controls
ECAT NASCOLA
Use negative control 7/16 (44%) 13/14 (93%)
Including:
Healthy control 3/16 (19%) 7/14 (50%)
Previously tested negative patient sample
2/16 (13%) 4/14 (29%)
Saline Control 0/16 (0%) 1/14 (7%)
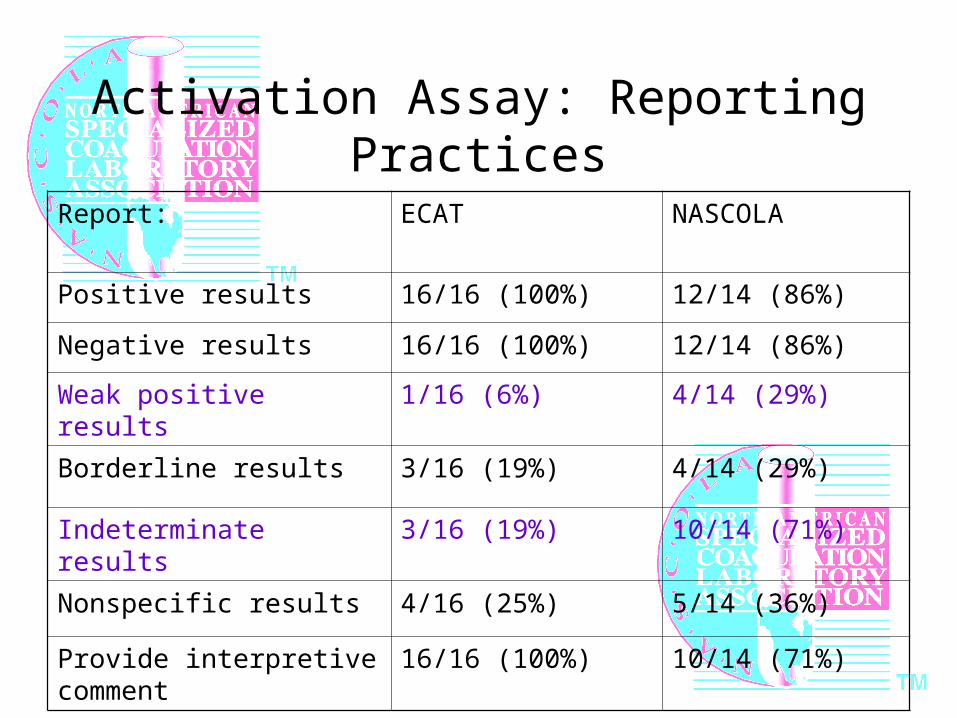
Activation Assay: Reporting Practices
Report: ECAT NASCOLA
Positive results 16/16 (100%) 12/14 (86%)
Negative results 16/16 (100%) 12/14 (86%)
Weak positive results 1/16 (6%) 4/14 (29%)
Borderline results 3/16 (19%) 4/14 (29%)
Indeterminate results 3/16 (19%) 10/14 (71%)
Nonspecific results 4/16 (25%) 5/14 (36%)
Provide interpretive comment 16/16 (100%) 10/14 (71%)
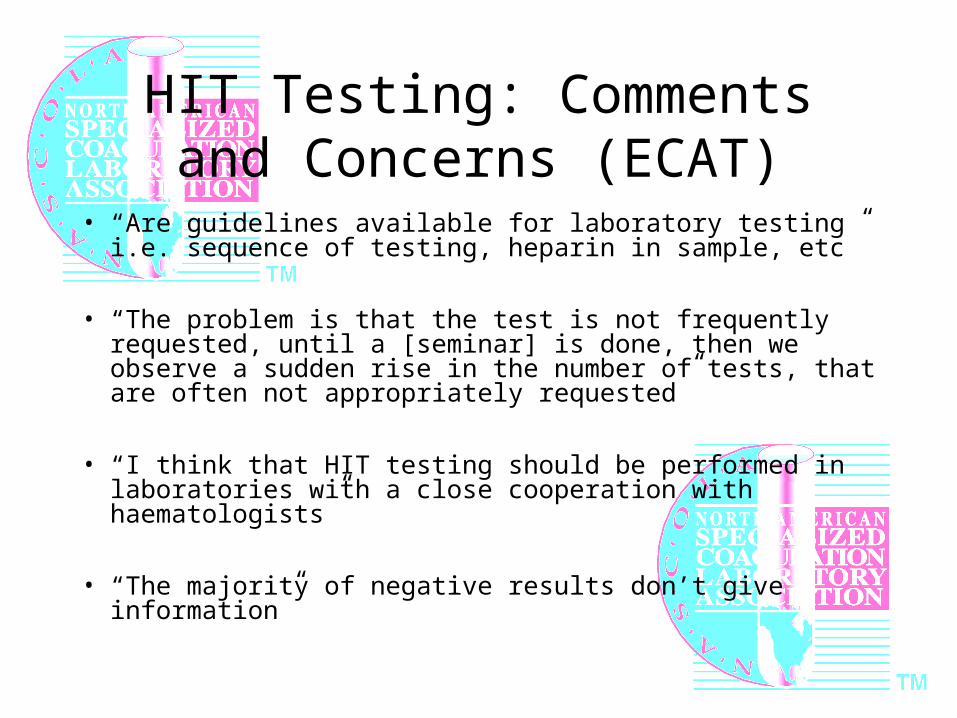
HIT Testing: Comments and Concerns (ECAT)
• “Are guidelines available for laboratory testing i.e. sequence of testing, heparin in sample, etc”
• “The problem is that the test is not frequently requested, until a [seminar] is done, then we observe a sudden rise in the number of tests, that are often not appropriately requested”
• “I think that HIT testing should be performed in laboratories with a close cooperation with haematologists”
• “The majority of negative results don’t give information”
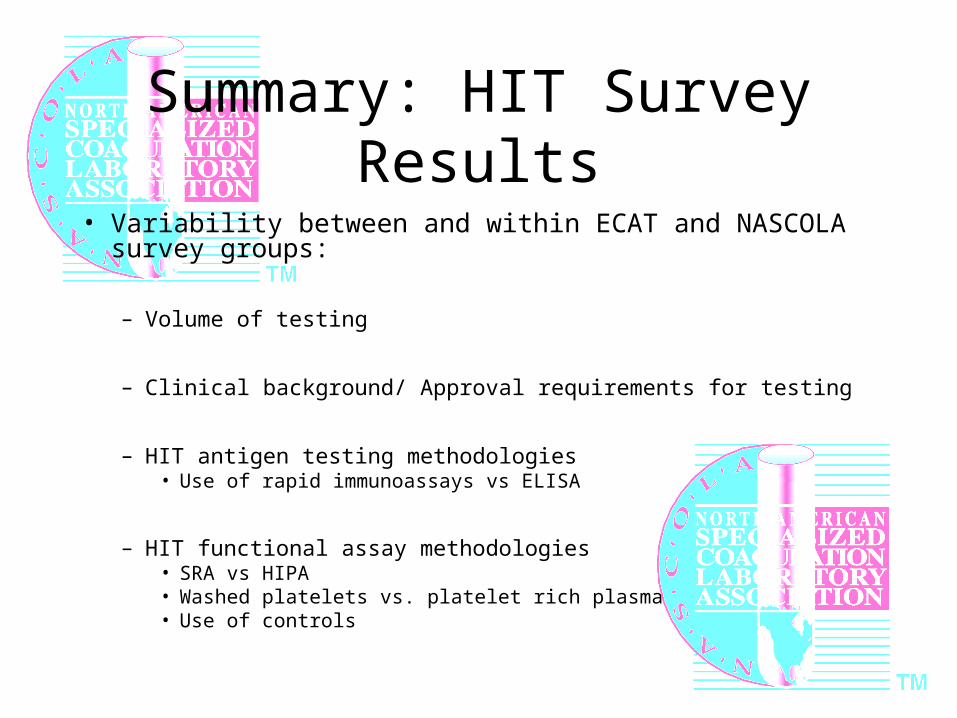
Summary: HIT Survey Results
• Variability between and within ECAT and NASCOLA survey groups:
– Volume of testing
– Clinical background/ Approval requirements for testing
– HIT antigen testing methodologies• Use of rapid immunoassays vs ELISA
– HIT functional assay methodologies• SRA vs HIPA• Washed platelets vs. platelet rich plasma• Use of controls
Summary, Continued
• Variability in testing has important clinical consequences
• Many laboratories report problems or concerns related to testing
• Supports finding of NASCOLA survey for need for proficiency testing to drive international consensus regarding HIT testing
Plans for a NASCOLA questionnaire on critical values for specialized coagulation laboratories
Dr. Menaka Pai
University of Toronto Training Program in Adult Hematology
CRITICAL VALUES IN THE COAGULATION LAB:A PROPOSED NASCOLA MEMBER SURVEY
By Menaka Pai, BSc MD FRCPCChief Hematology Resident, University of Toronto

What is a Critical Value?
First defined by George Lundberg in 1972 at the Los Angeles County USC Medical Center
“A pathophysiologic state at such variance with normal as to be life-threatening unless something is done promptly and for which corrective action can be taken.”
Lundberg GD. When to panic over abnormal values. Med Lab Obs. 1972;4:47-54.
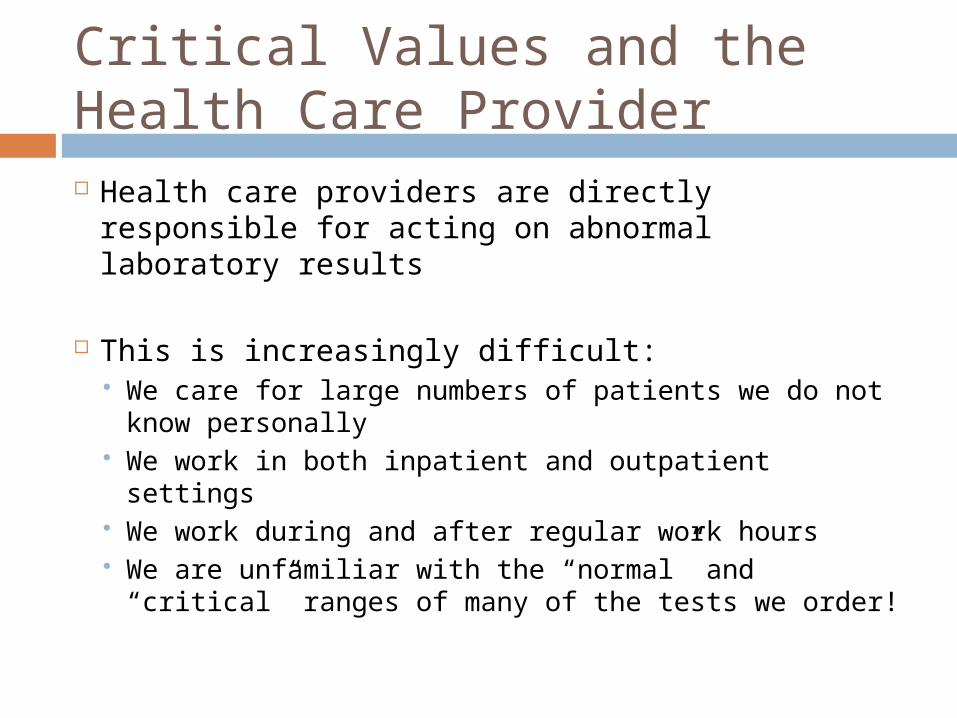
Critical Values and theHealth Care Provider Health care providers are directly responsible
for acting on abnormal laboratory results
This is increasingly difficult: We care for large numbers of patients we do not
know personally We work in both inpatient and outpatient
settings We work during and after regular work hours We are unfamiliar with the “normal” and
“critical” ranges of many of the tests we order!
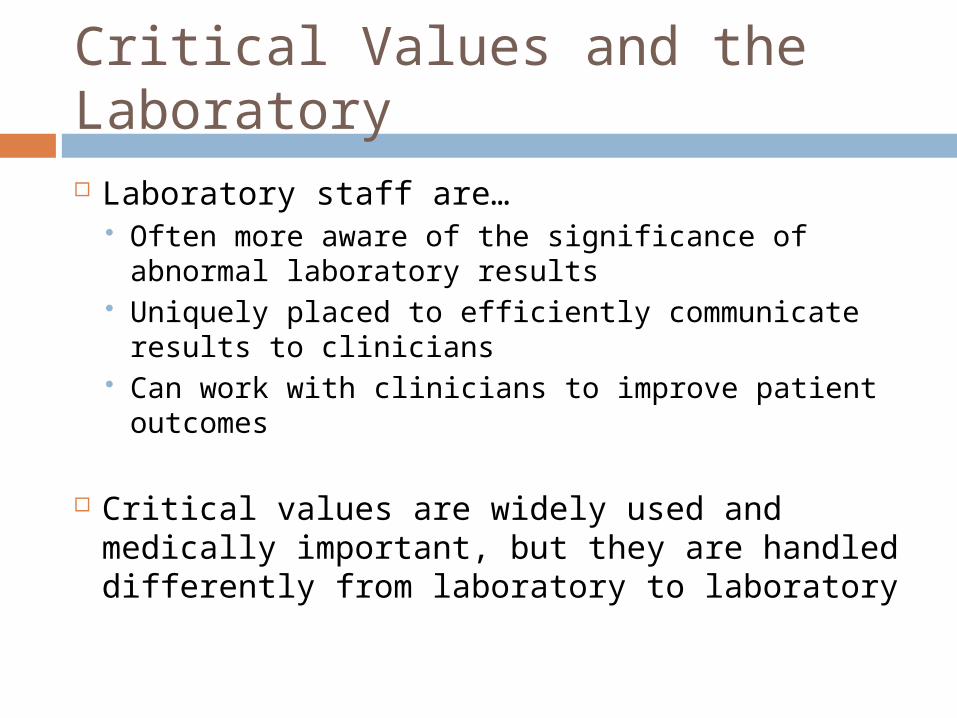
Critical Values and the Laboratory Laboratory staff are…
Often more aware of the significance of abnormal laboratory results
Uniquely placed to efficiently communicate results to clinicians
Can work with clinicians to improve patient outcomes
Critical values are widely used and medically important, but they are handled differently from laboratory to laboratory
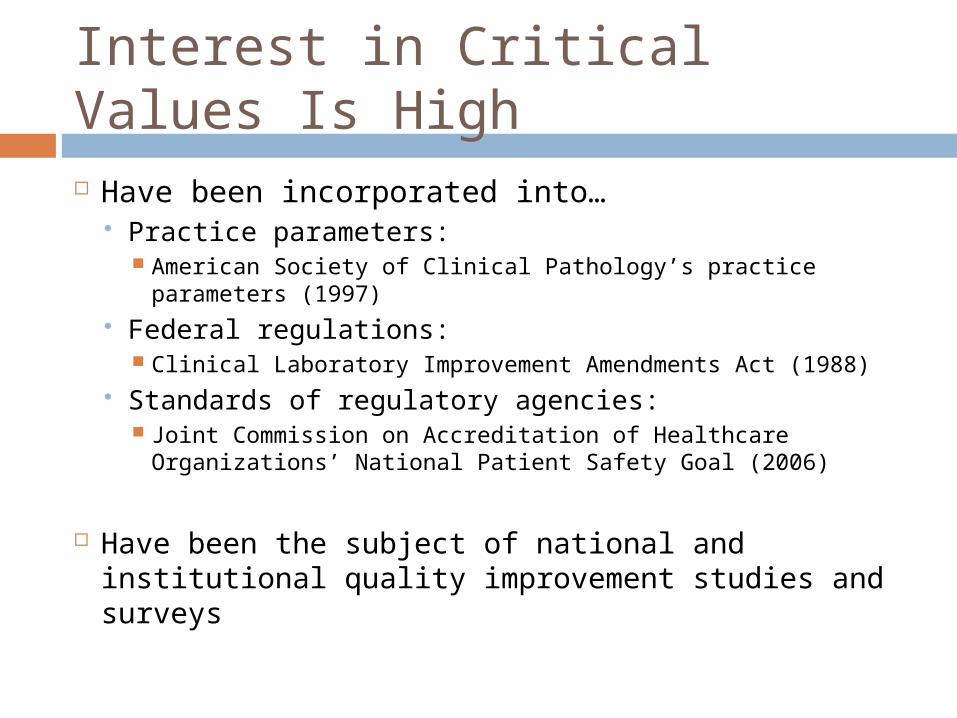
Interest in Critical Values Is High Have been incorporated into…
Practice parameters: American Society of Clinical Pathology’s practice parameters
(1997) Federal regulations:
Clinical Laboratory Improvement Amendments Act (1988) Standards of regulatory agencies:
Joint Commission on Accreditation of Healthcare Organizations’ National Patient Safety Goal (2006)
Have been the subject of national and institutional quality improvement studies and surveys

The Role of Critical Values in the Coagulation Laboratory
Recent review of the literature found… Several publications discussing critical
values in biochemistry, microbiology and hematology laboratories
No publications discussing critical values in coagulation laboratories!
We would like to find out what YOU think about critical values!
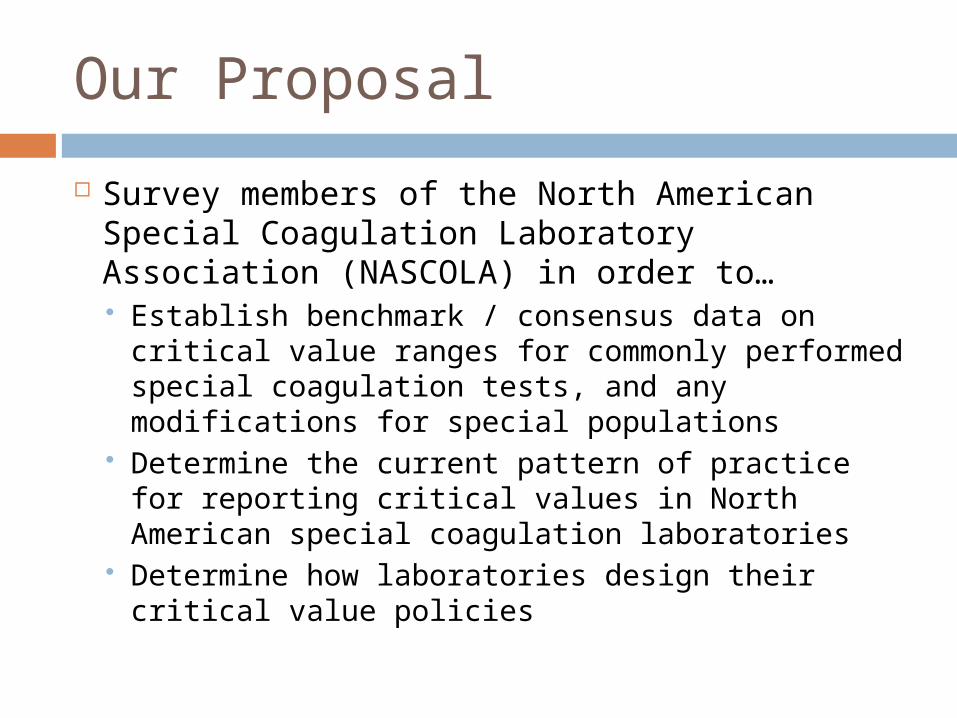
Our Proposal
Survey members of the North American Special Coagulation Laboratory Association (NASCOLA) in order to… Establish benchmark / consensus data on critical
value ranges for commonly performed special coagulation tests, and any modifications for special populations
Determine the current pattern of practice for reporting critical values in North American special coagulation laboratories
Determine how laboratories design their critical value policies
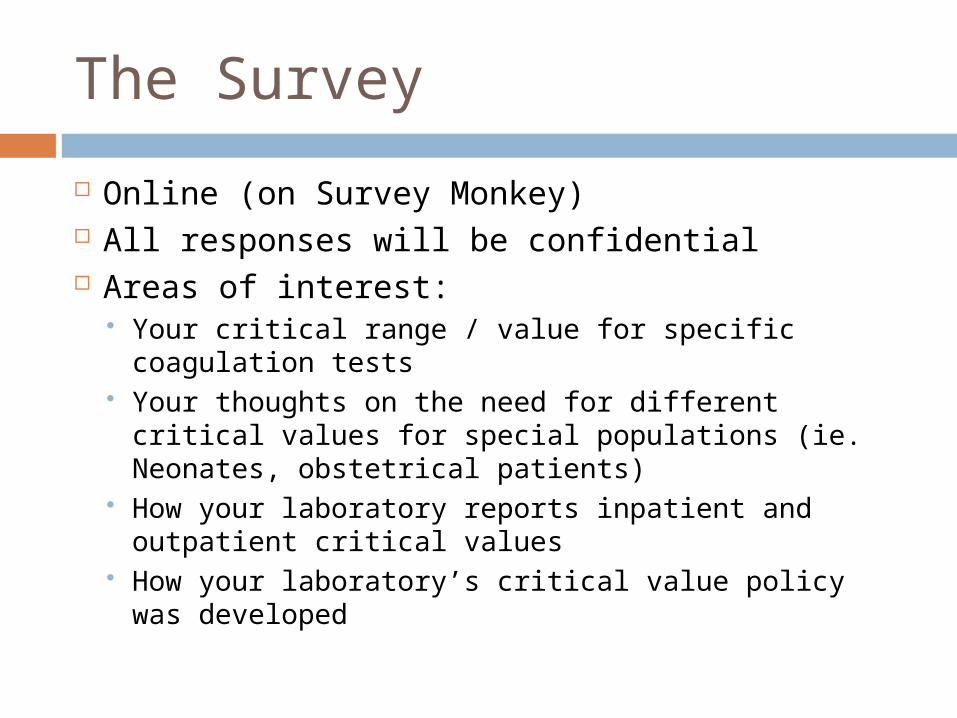
The Survey
Online (on Survey Monkey) All responses will be confidential Areas of interest:
Your critical range / value for specific coagulation tests
Your thoughts on the need for different critical values for special populations (ie. Neonates, obstetrical patients)
How your laboratory reports inpatient and outpatient critical values
How your laboratory’s critical value policy was developed
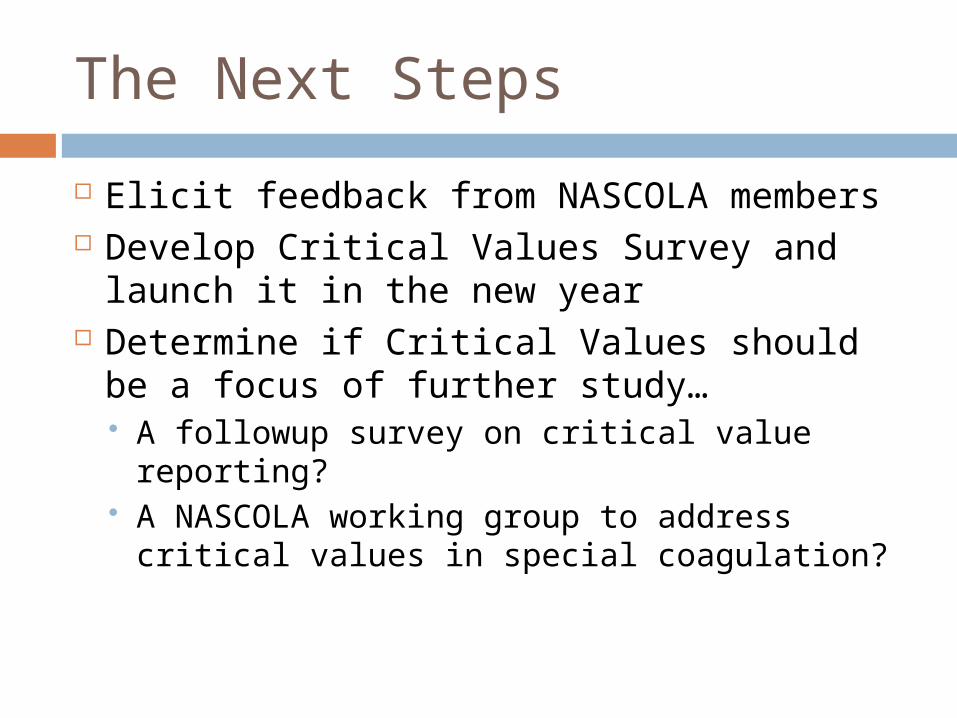
The Next Steps
Elicit feedback from NASCOLA members Develop Critical Values Survey and
launch it in the new year Determine if Critical Values should be a
focus of further study… A followup survey on critical value
reporting? A NASCOLA working group to address
critical values in special coagulation?

And thank you to… Dr. Catherine Hayward
Ms. Karen Moffat
Dr. Dot Adcock
Please contact me with further questions or concerns! [email protected]
Thank you for considering this initiative!
Plans for a NASCOLA research onpediatric coagulation testing
Dr.Anthony Chan
Hospital for Sick Children
Factor VIII Inhibitors: Updateon research by the PT-EQA Committee
Dr. Ellinor Peerschke
Mount Sinai Medical Center
NASCOLA PT/EQA Committee Chair
84
Performance Summary: Factor VIII Inhibitor TestingNASCOLA PT/EQA
Ellinor I. PeerschkeDonna D. CastelloneMarlies Ledford-Kraemer2007
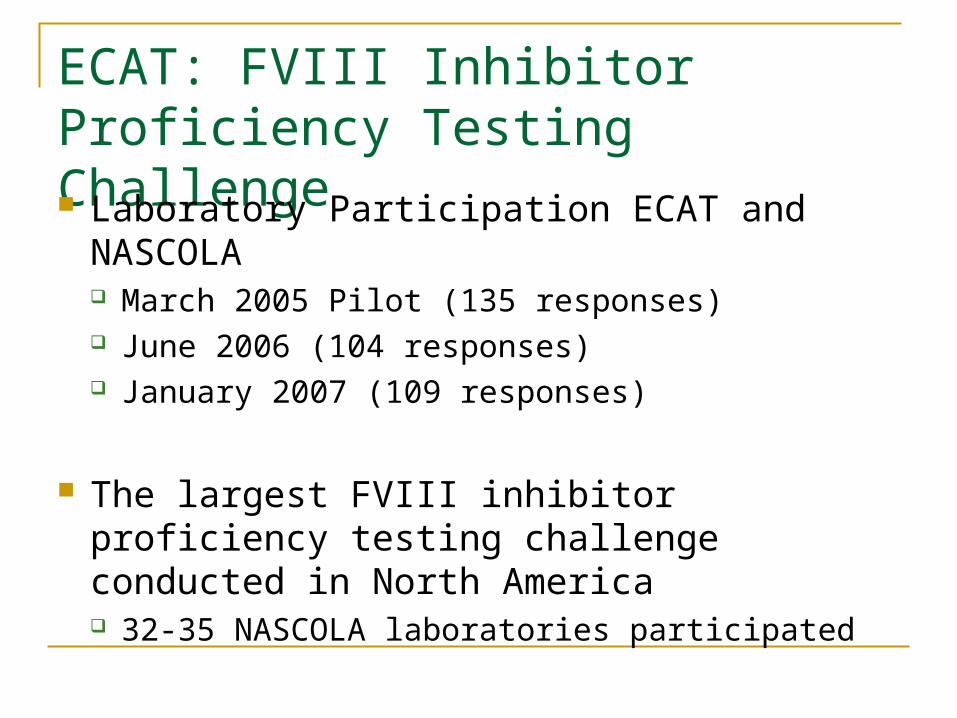
ECAT: FVIII InhibitorProficiency Testing Challenge Laboratory Participation ECAT and
NASCOLA March 2005 Pilot (135 responses) June 2006 (104 responses) January 2007 (109 responses)
The largest FVIII inhibitor proficiency testing challenge conducted in North America 32-35 NASCOLA laboratories participated
Purpose
Investigate methods used in clinical laboratories for FVIII inhibitor quantification
Examine between laboratory variation Identify possible determinants for inter-
laboratory variation
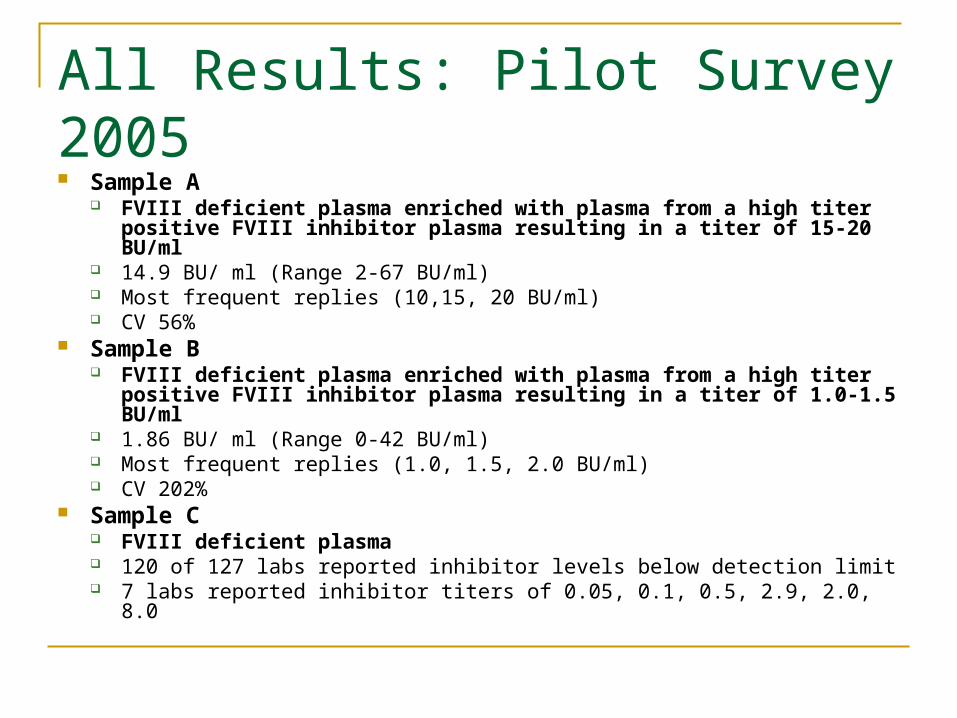
All Results: Pilot Survey 2005 Sample A
FVIII deficient plasma enriched with plasma from a high titer positive FVIII inhibitor plasma resulting in a titer of 15-20 BU/ml
14.9 BU/ ml (Range 2-67 BU/ml) Most frequent replies (10,15, 20 BU/ml) CV 56%
Sample B FVIII deficient plasma enriched with plasma from a high titer positive
FVIII inhibitor plasma resulting in a titer of 1.0-1.5 BU/ml 1.86 BU/ ml (Range 0-42 BU/ml) Most frequent replies (1.0, 1.5, 2.0 BU/ml) CV 202%
Sample C FVIII deficient plasma 120 of 127 labs reported inhibitor levels below detection limit 7 labs reported inhibitor titers of 0.05, 0.1, 0.5, 2.9, 2.0, 8.0
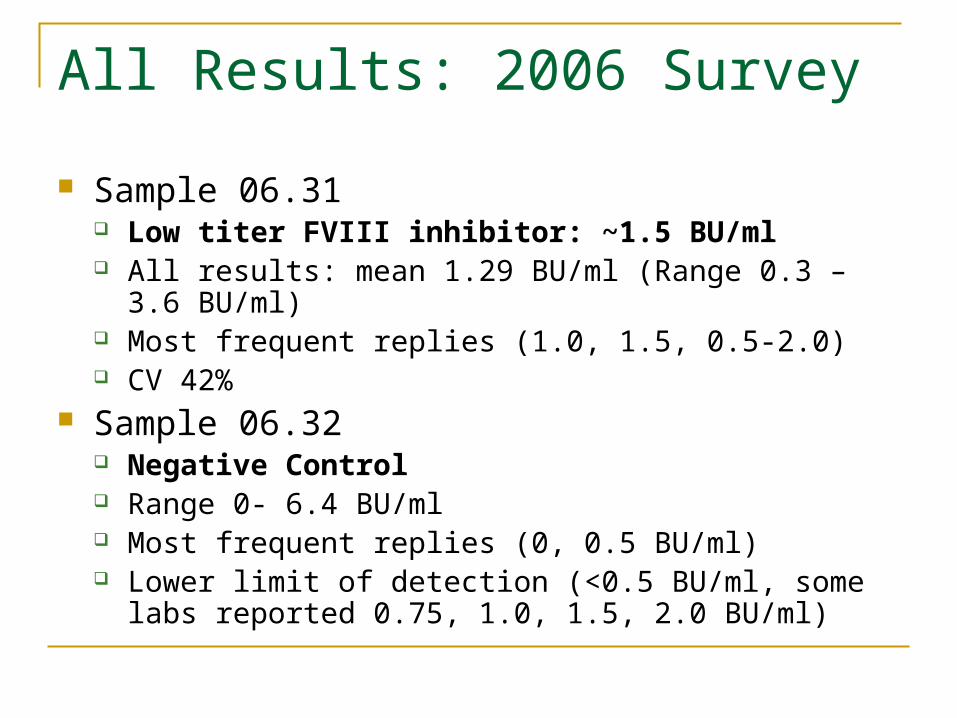
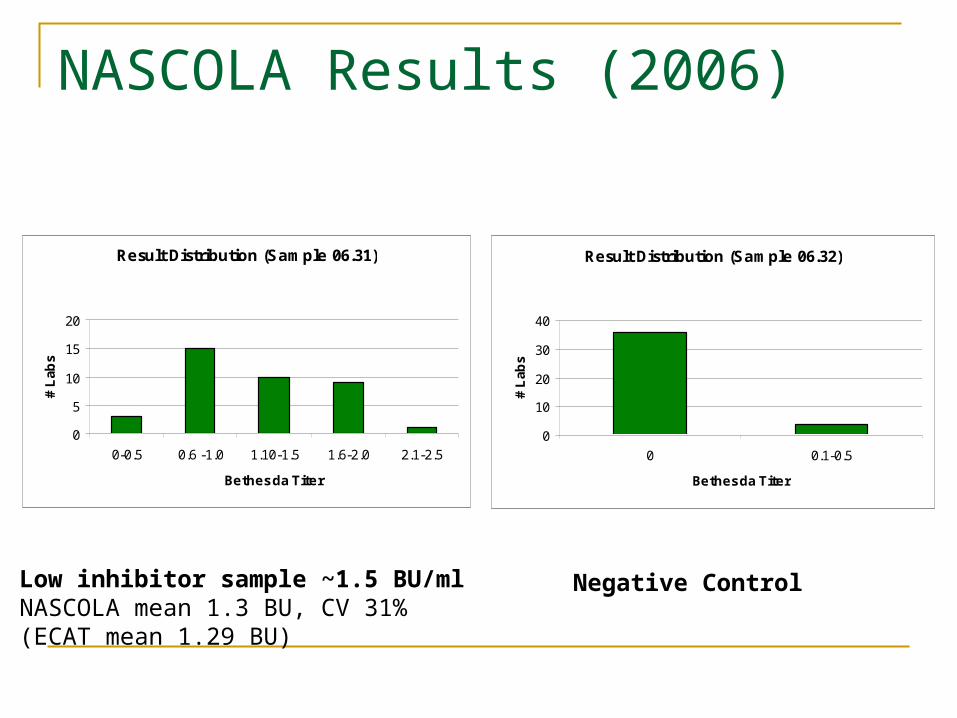
All Results: 2006 Survey
Sample 06.31 Low titer FVIII inhibitor: ~1.5 BU/ml All results: mean 1.29 BU/ml (Range 0.3 – 3.6 BU/ml) Most frequent replies (1.0, 1.5, 0.5-2.0) CV 42%
Sample 06.32 Negative Control Range 0- 6.4 BU/ml Most frequent replies (0, 0.5 BU/ml) Lower limit of detection (<0.5 BU/ml, some labs reported
0.75, 1.0, 1.5, 2.0 BU/ml)
NASCOLA Results (2006)
Result Distribution (Sample 06.31)
0
5
10
15
20
0-0.5 0.6 -1.0 1.10-1.5 1.6-2.0 2.1-2.5
Bethesda Titer
# L
abs
Result Distribution (Sample 06.32)
0
10
20
30
40
0 0.1-0.5
Bethesda Titer
# L
abs
Low inhibitor sample ~1.5 BU/mlNASCOLA mean 1.3 BU, CV 31%(ECAT mean 1.29 BU)
Negative Control
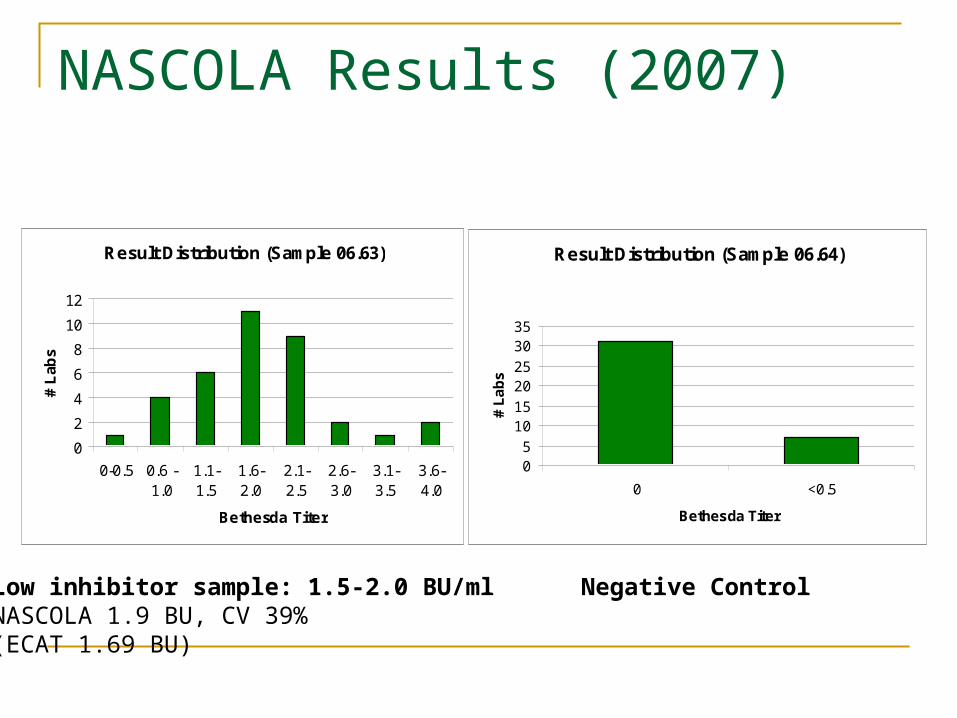
All Results: 2007 Survey
Sample 06.63 Negative control Most labs reported BU below detection limit or 0 BU/ml Highest reported result 2.2 BU/ml
Sample 06.64 Low titer inhibitor (1.5 – 2.0 BU/ml) 1.69 BU/ml (Range 0.4 – 6.1 BU/ml) Most frequent replies (1.0, 1.5, followed by 0.5 and 2.0) CV 51.5%
NASCOLA Results (2007)
Result Distribution (Sample 06.63)
0
2
4
6
8
10
12
0-0.5 0.6 -1.0
1.1-1.5
1.6-2.0
2.1-2.5
2.6-3.0
3.1-3.5
3.6-4.0
Bethesda Titer
# L
abs
Result Distribution (Sample 06.64)
05
1015
2025
3035
0 <0.5
Bethesda Titer#
La
bs
Low inhibitor sample: 1.5-2.0 BU/mlNASCOLA 1.9 BU, CV 39%(ECAT 1.69 BU)
Negative Control
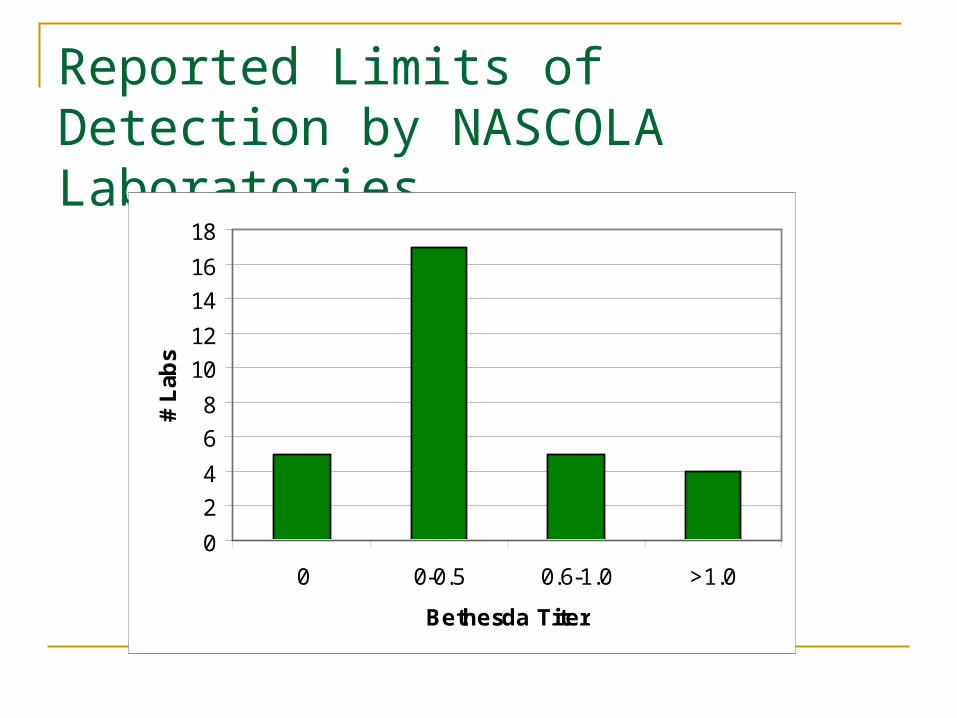
Reported Limits of Detection by NASCOLA Laboratories
0
2
4
6
8
10
12
14
16
18
0 0-0.5 0.6-1.0 >1.0
Bethesda Titer
# L
abs
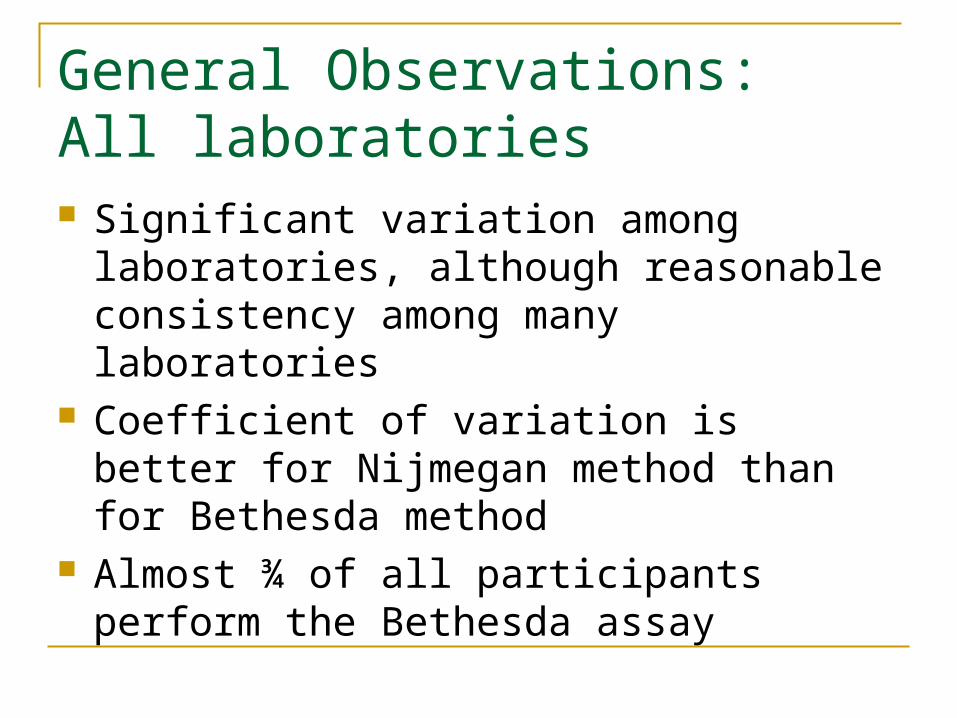
General Observations: All laboratories Significant variation among laboratories,
although reasonable consistency among many laboratories
Coefficient of variation is better for Nijmegan method than for Bethesda method
Almost ¾ of all participants perform the Bethesda assay
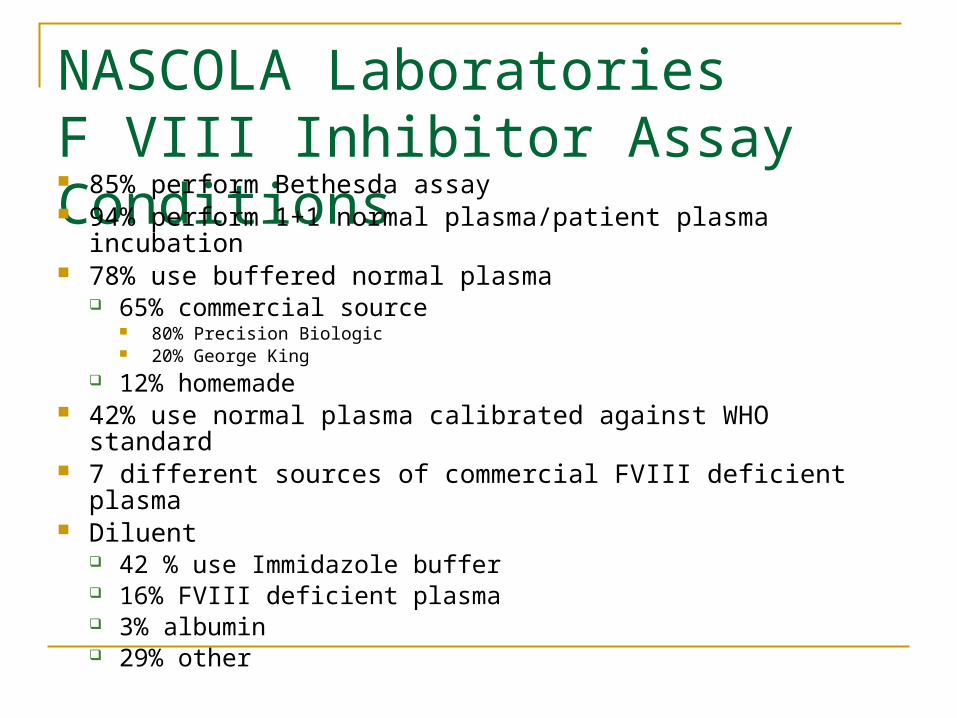
NASCOLA LaboratoriesF VIII Inhibitor Assay Conditions 85% perform Bethesda assay 94% perform 1+1 normal plasma/patient plasma incubation 78% use buffered normal plasma
65% commercial source 80% Precision Biologic 20% George King
12% homemade 42% use normal plasma calibrated against WHO standard 7 different sources of commercial FVIII deficient plasma Diluent
42 % use Immidazole buffer 16% FVIII deficient plasma 3% albumin 29% other
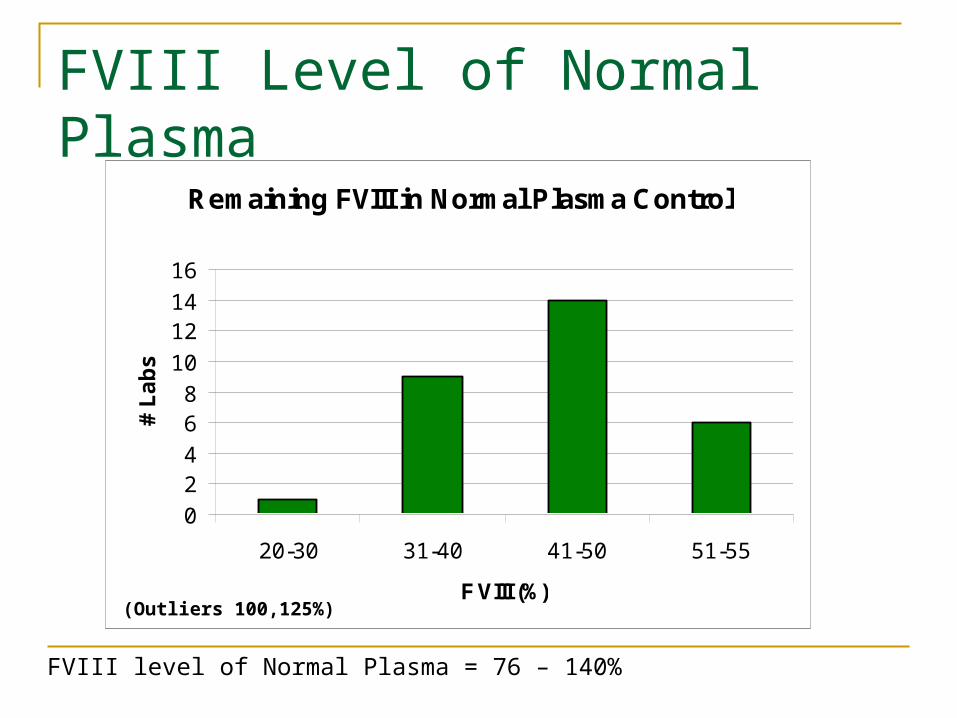
FVIII Level of Normal Plasma
FVIII level of Normal Plasma = 76 – 140%
Remaining FVIII in Normal Plasma Control
0
24
68
10
1214
16
20-30 31-40 41-50 51-55
F VIII (%)
# L
ab
s
(Outliers 100,125%)
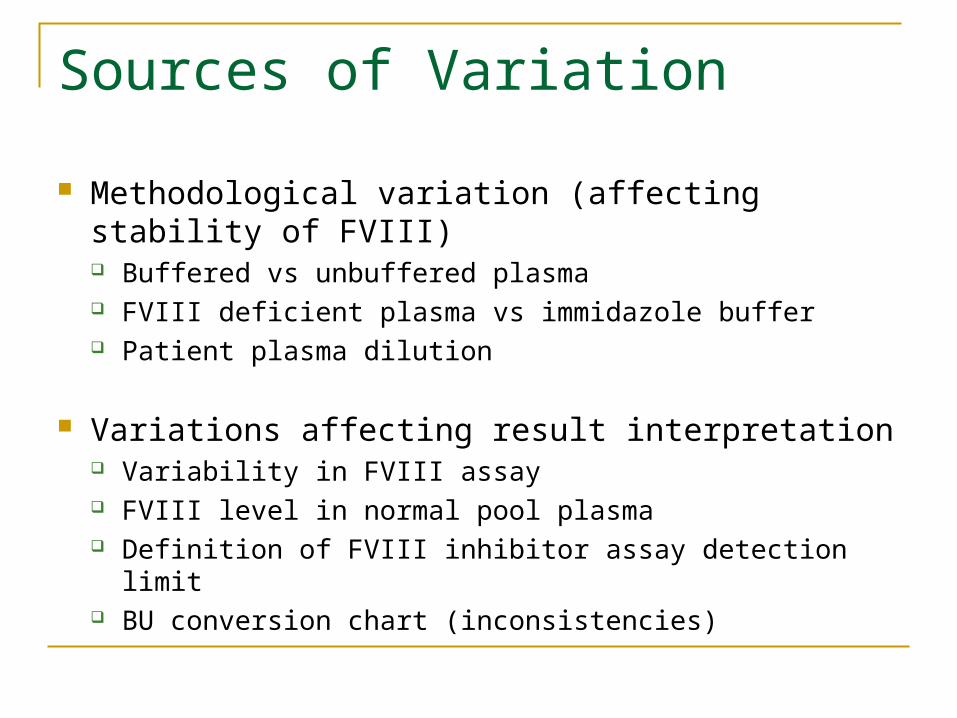
Sources of Variation
Methodological variation (affecting stability of FVIII) Buffered vs unbuffered plasma FVIII deficient plasma vs immidazole buffer Patient plasma dilution
Variations affecting result interpretation Variability in FVIII assay FVIII level in normal pool plasma Definition of FVIII inhibitor assay detection limit BU conversion chart (inconsistencies)
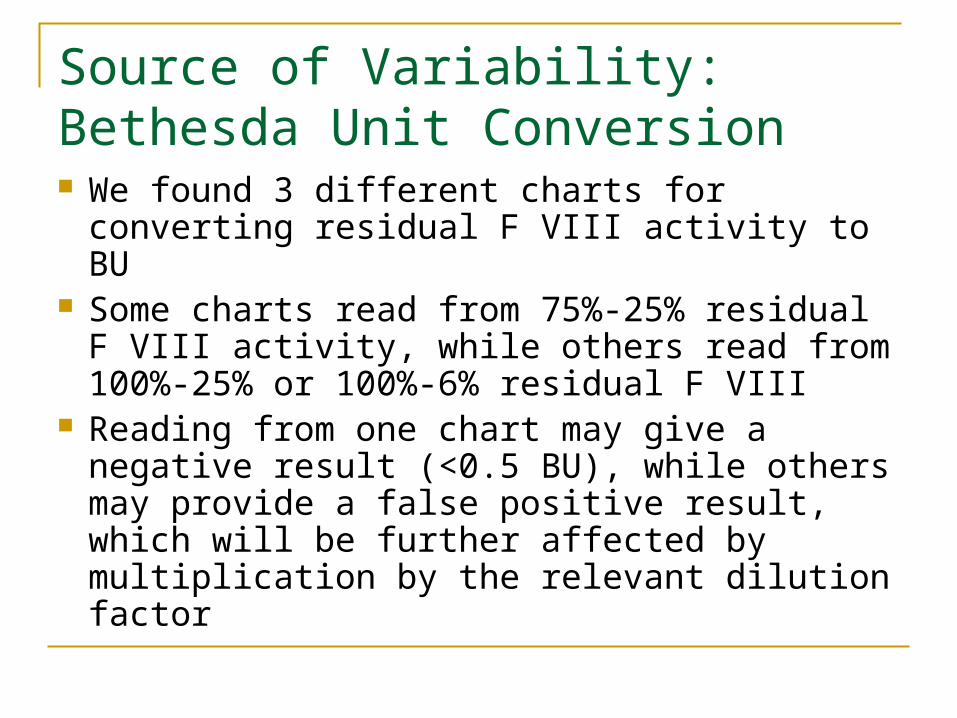
Source of Variability: Bethesda Unit Conversion We found 3 different charts for converting
residual F VIII activity to BU Some charts read from 75%-25% residual F
VIII activity, while others read from 100%-25% or 100%-6% residual F VIII
Reading from one chart may give a negative result (<0.5 BU), while others may provide a false positive result, which will be further affected by multiplication by the relevant dilution factor
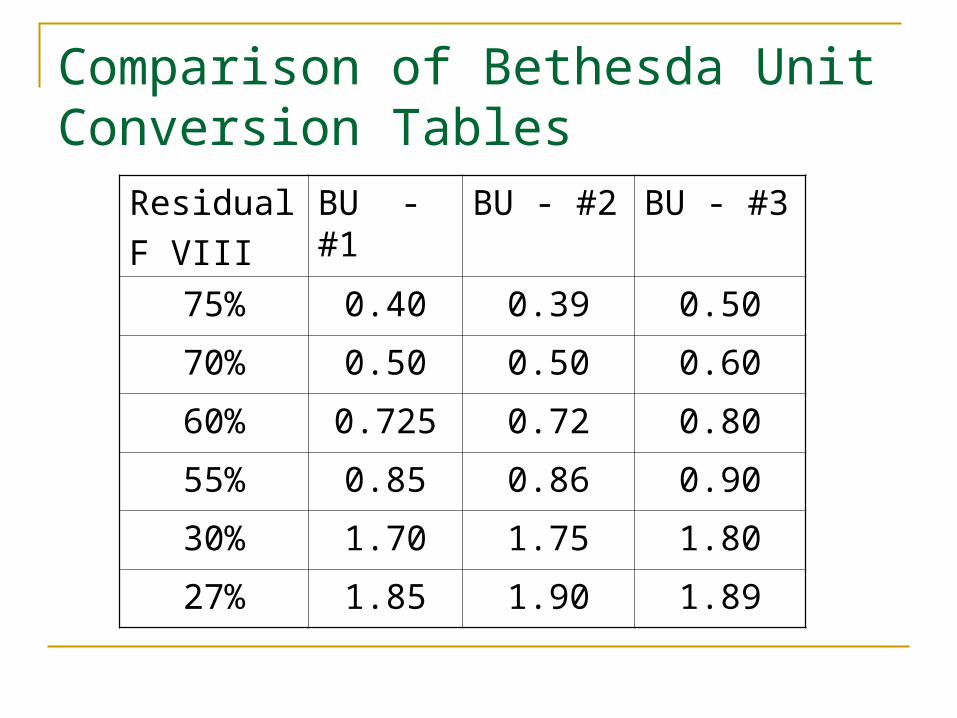
Comparison of Bethesda Unit Conversion Tables
Residual
F VIII
BU - #1
BU - #2 BU - #3
75% 0.40 0.39 0.50
70% 0.50 0.50 0.60
60% 0.725 0.72 0.80
55% 0.85 0.86 0.90
30% 1.70 1.75 1.80
27% 1.85 1.90 1.89
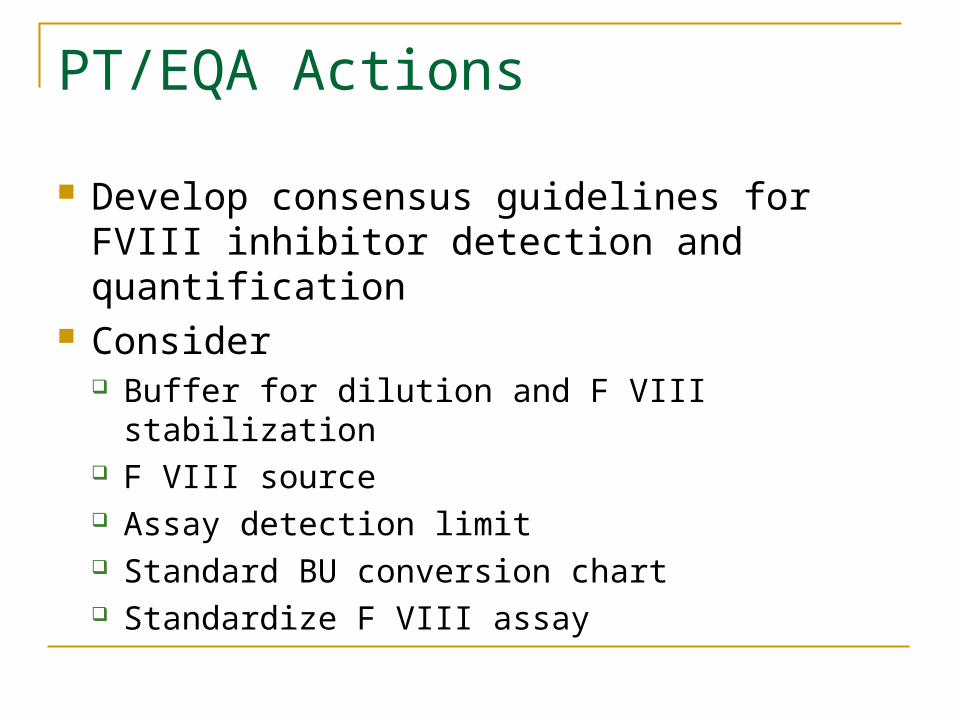
PT/EQA Actions
Develop consensus guidelines for FVIII inhibitor detection and quantification
Consider Buffer for dilution and F VIII stabilization F VIII source Assay detection limit Standard BU conversion chart Standardize F VIII assay

Update on new initiatives to improve platelet function testing with practice guidelines
Dr. Catherine Hayward
Hamilton Health Science-McMaster
NASCOLA President, Website Committee Chair
Ms. Marlies Ledford-Kramer, CLOT-ED, Inc
NASCOLA/ECAT Liaison
Standardization of Platelet Function TestingCLSI Guideline H58-P
Platelet Function Testing by Aggregometry
Marlies Ledford-KraemerMBA, BS, MT(ASCP)SH
CLOT-ED, Inc
Conflict of Interest
• None to disclose
Clinical and LaboratoryStandards Institute (CLSI)
• Global, nonprofit, standards-developing organization that promotes the development and use of voluntary consensus standards and guidelines within the healthcare community
• Based on the principle that consensus is an efficient and cost-effective way to improve patient testing and services
• Committee members for the development of consensus guidelines consist of individuals from industry, academia, and government
Members:Subcommittee on Platelet Function Testing
(Area Committee on Hematology)
• Douglas Christie, PhD: Dade Behring - Chairman• Leonthena Carrington, MBA, MT(ASCP): FDA Center for Devices• Eli Cohen, PhD: Haemoscope Corporation• Paul Harrison, PhD: Churchill Hospital, Oxford, UK• Thomas Kickler, MD: Johns Hopkins University• Marlies Ledford-Kraemer, MBA, MT(ASCP)SH: CLOT-ED, Inc.• Kandice Kottke-Marchant, MD, PhD: Cleveland Clinic • Alvin Schmaier, MD: Case Western Reserve University• Melanie McCabe White: Univ of Tennessee Health Science Cntr• David Sterry, MT(ASCP): CLSI Staff Liaison
Advisors to Subcommittee
• Kenneth Ault, MD: Maine Medical Center• Thrity Avari, MS: Chronolog Corporation• Barbara DeBiase: Sienco, Inc.• Richard Marlar, PhD: Oklahoma City VA Medical Center• Margaret Rand, PhD: The Hospital for Sick Children, Toronto• Ravindra Sarode, MD: UT Southwestern Medical Center• Jun Teruya, MD: Baylor College of Medicine• William Trolio: Bio/Data Corporation
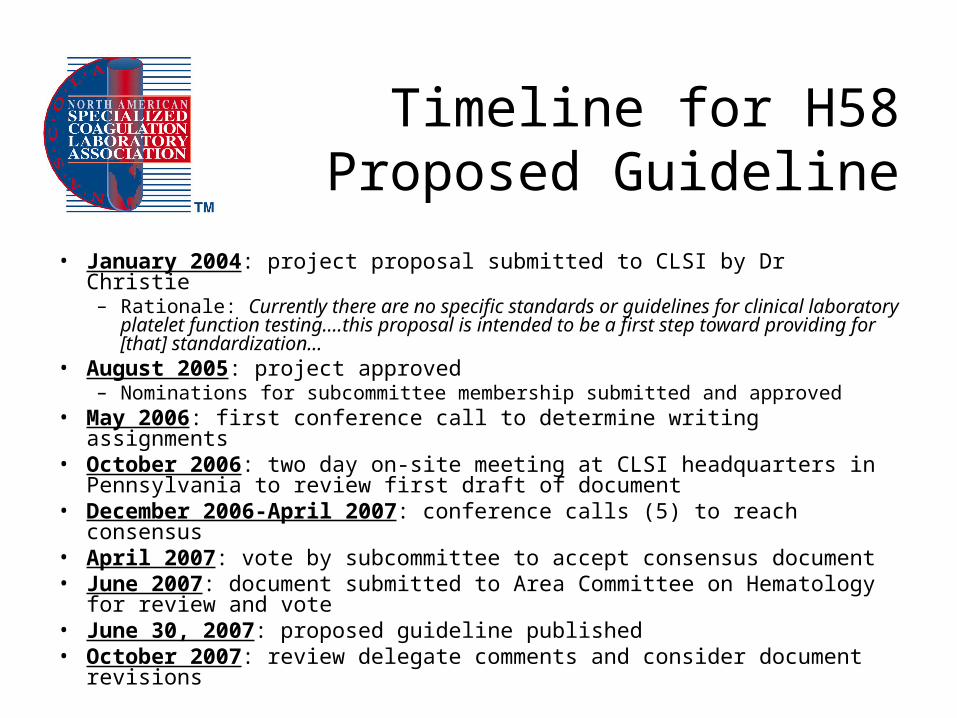
Timeline for H58Proposed Guideline
• January 2004: project proposal submitted to CLSI by Dr Christie– Rationale: Currently there are no specific standards or guidelines for clinical
laboratory platelet function testing….this proposal is intended to be a first step toward providing for [that] standardization…
• August 2005: project approved– Nominations for subcommittee membership submitted and approved
• May 2006: first conference call to determine writing assignments • October 2006: two day on-site meeting at CLSI headquarters in
Pennsylvania to review first draft of document• December 2006-April 2007: conference calls (5) to reach consensus• April 2007: vote by subcommittee to accept consensus document• June 2007: document submitted to Area Committee on Hematology for
review and vote• June 30, 2007: proposed guideline published• October 2007: review delegate comments and consider document
revisions
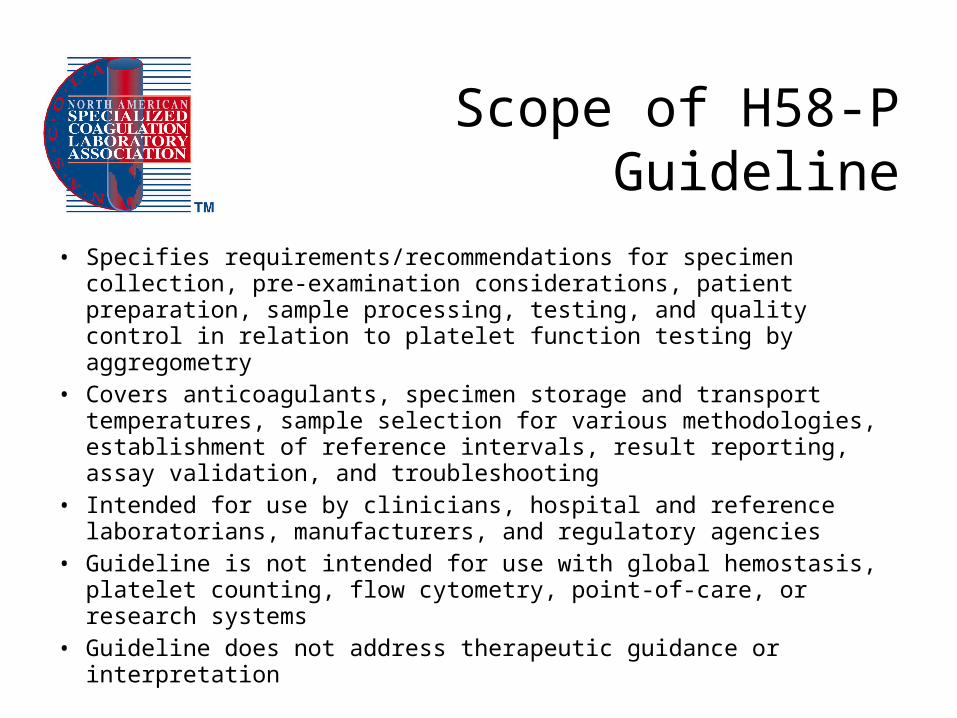
Scope of H58-P Guideline
• Specifies requirements/recommendations for specimen collection, pre-examination considerations, patient preparation, sample processing, testing, and quality control in relation to platelet function testing by aggregometry
• Covers anticoagulants, specimen storage and transport temperatures, sample selection for various methodologies, establishment of reference intervals, result reporting, assay validation, and troubleshooting
• Intended for use by clinicians, hospital and reference laboratorians, manufacturers, and regulatory agencies
• Guideline is not intended for use with global hemostasis, platelet counting, flow cytometry, point-of-care, or research systems
• Guideline does not address therapeutic guidance or interpretation

Guideline Chapters and Writing Assignments
• Introduction– Paul Harrison
• Specimen collection and processing– Marlies Ledford-Kraemer
• Light transmission aggregometry using platelet rich plasma (PRP)– Alvin Schmaier and Melanie White
• Impedance aggregometry using whole blood– Thrity Avari and Lee Carrington
• High shear device (platelet function analyzer)– Doug Christie
• Quality control– Tom Kickler and Barb DeBiase
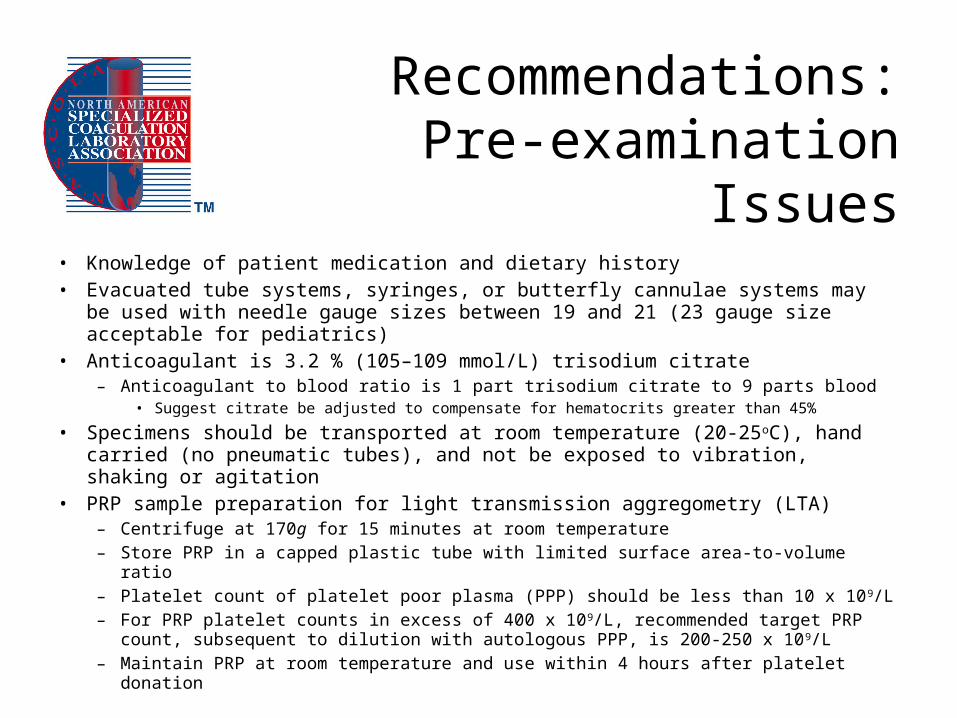
Recommendations:Pre-examination Issues
• Knowledge of patient medication and dietary history• Evacuated tube systems, syringes, or butterfly cannulae systems may be used with
needle gauge sizes between 19 and 21 (23 gauge size acceptable for pediatrics)• Anticoagulant is 3.2 % (105–109 mmol/L) trisodium citrate
– Anticoagulant to blood ratio is 1 part trisodium citrate to 9 parts blood• Suggest citrate be adjusted to compensate for hematocrits greater than 45%
• Specimens should be transported at room temperature (20-25oC), hand carried (no pneumatic tubes), and not be exposed to vibration, shaking or agitation
• PRP sample preparation for light transmission aggregometry (LTA)– Centrifuge at 170g for 15 minutes at room temperature– Store PRP in a capped plastic tube with limited surface area-to-volume ratio– Platelet count of platelet poor plasma (PPP) should be less than 10 x 109/L– For PRP platelet counts in excess of 400 x 109/L, recommended target PRP count,
subsequent to dilution with autologous PPP, is 200-250 x 109/L – Maintain PRP at room temperature and use within 4 hours after platelet donation
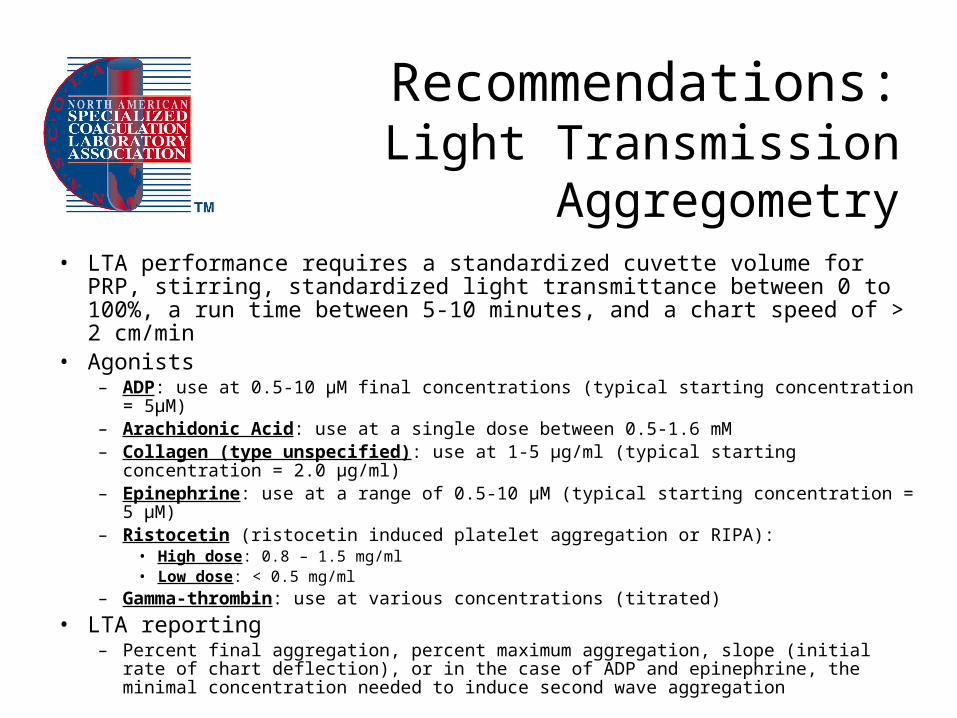
Recommendations:Light Transmission Aggregometry
• LTA performance requires a standardized cuvette volume for PRP, stirring, standardized light transmittance between 0 to 100%, a run time between 5-10 minutes, and a chart speed of > 2 cm/min
• Agonists– ADP: use at 0.5-10 μM final concentrations (typical starting concentration = 5μM)– Arachidonic Acid: use at a single dose between 0.5-1.6 mM– Collagen (type unspecified): use at 1-5 μg/ml (typical starting concentration = 2.0 μg/ml)– Epinephrine: use at a range of 0.5-10 μM (typical starting concentration = 5 μM)– Ristocetin (ristocetin induced platelet aggregation or RIPA):
• High dose: 0.8 – 1.5 mg/ml• Low dose: < 0.5 mg/ml
– Gamma-thrombin: use at various concentrations (titrated)
• LTA reporting– Percent final aggregation, percent maximum aggregation, slope (initial rate of chart
deflection), or in the case of ADP and epinephrine, the minimal concentration needed to induce second wave aggregation
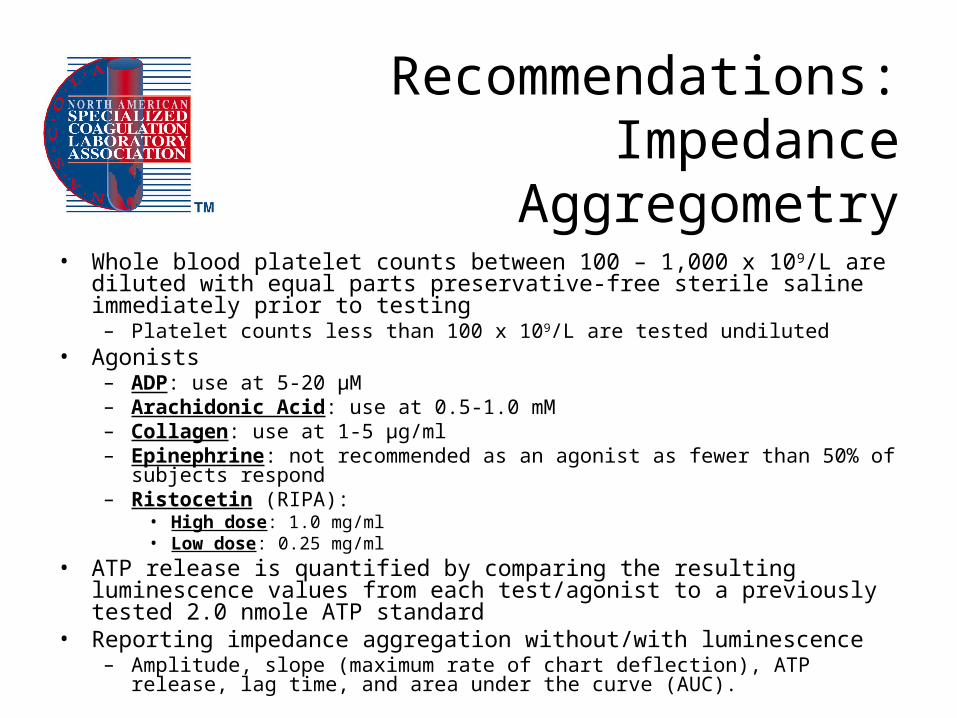
Recommendations:Impedance Aggregometry
• Whole blood platelet counts between 100 – 1,000 x 109/L are diluted with equal parts preservative-free sterile saline immediately prior to testing
– Platelet counts less than 100 x 109/L are tested undiluted• Agonists
– ADP: use at 5-20 µM– Arachidonic Acid: use at 0.5-1.0 mM– Collagen: use at 1-5 µg/ml– Epinephrine: not recommended as an agonist as fewer than 50% of subjects respond– Ristocetin (RIPA):
• High dose: 1.0 mg/ml• Low dose: 0.25 mg/ml
• ATP release is quantified by comparing the resulting luminescence values from each test/agonist to a previously tested 2.0 nmole ATP standard
• Reporting impedance aggregation without/with luminescence– Amplitude, slope (maximum rate of chart deflection), ATP release, lag time, and area
under the curve (AUC).
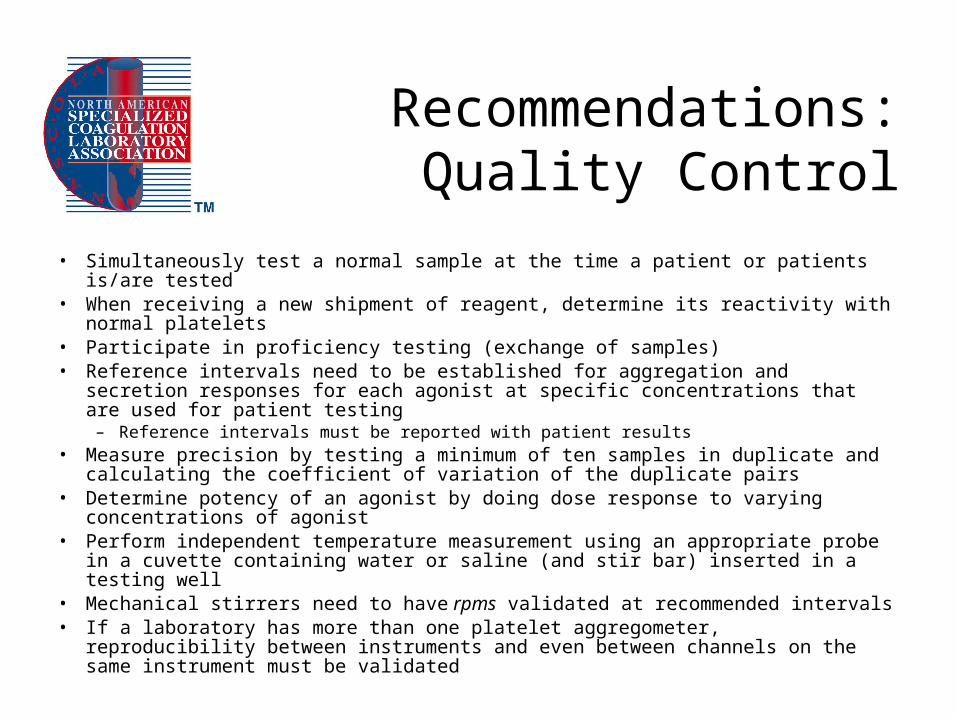
Recommendations:Quality Control
• Simultaneously test a normal sample at the time a patient or patients is/are tested• When receiving a new shipment of reagent, determine its reactivity with normal
platelets• Participate in proficiency testing (exchange of samples)• Reference intervals need to be established for aggregation and secretion responses
for each agonist at specific concentrations that are used for patient testing– Reference intervals must be reported with patient results
• Measure precision by testing a minimum of ten samples in duplicate and calculating the coefficient of variation of the duplicate pairs
• Determine potency of an agonist by doing dose response to varying concentrations of agonist
• Perform independent temperature measurement using an appropriate probe in a cuvette containing water or saline (and stir bar) inserted in a testing well
• Mechanical stirrers need to have rpms validated at recommended intervals• If a laboratory has more than one platelet aggregometer, reproducibility between
instruments and even between channels on the same instrument must be validated
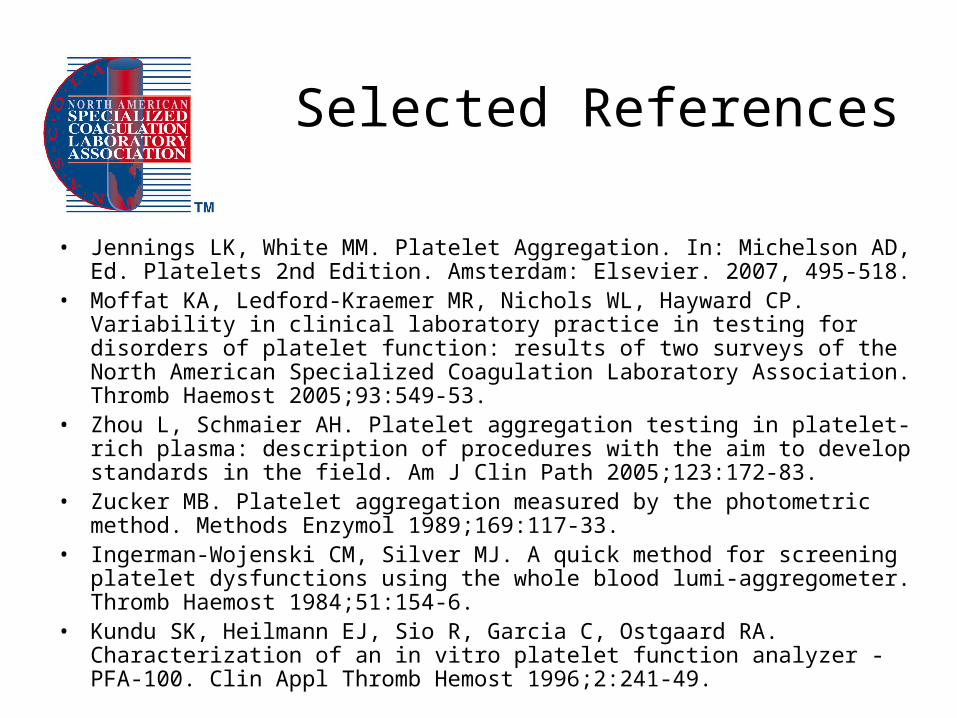
Selected References
• Jennings LK, White MM. Platelet Aggregation. In: Michelson AD, Ed. Platelets 2nd Edition. Amsterdam: Elsevier. 2007, 495-518.
• Moffat KA, Ledford-Kraemer MR, Nichols WL, Hayward CP. Variability in clinical laboratory practice in testing for disorders of platelet function: results of two surveys of the North American Specialized Coagulation Laboratory Association. Thromb Haemost 2005;93:549-53.
• Zhou L, Schmaier AH. Platelet aggregation testing in platelet-rich plasma: description of procedures with the aim to develop standards in the field. Am J Clin Path 2005;123:172-83.
• Zucker MB. Platelet aggregation measured by the photometric method. Methods Enzymol 1989;169:117-33.
• Ingerman-Wojenski CM, Silver MJ. A quick method for screening platelet dysfunctions using the whole blood lumi-aggregometer. Thromb Haemost 1984;51:154-6.
• Kundu SK, Heilmann EJ, Sio R, Garcia C, Ostgaard RA. Characterization of an in vitro platelet function analyzer - PFA-100. Clin Appl Thromb Hemost 1996;2:241-49.
ISTH 2007 SurveyClinical Laboratory Responses
• Clinical laboratory responses = 245
• NASCOLA respondents = 43 (18% of total)
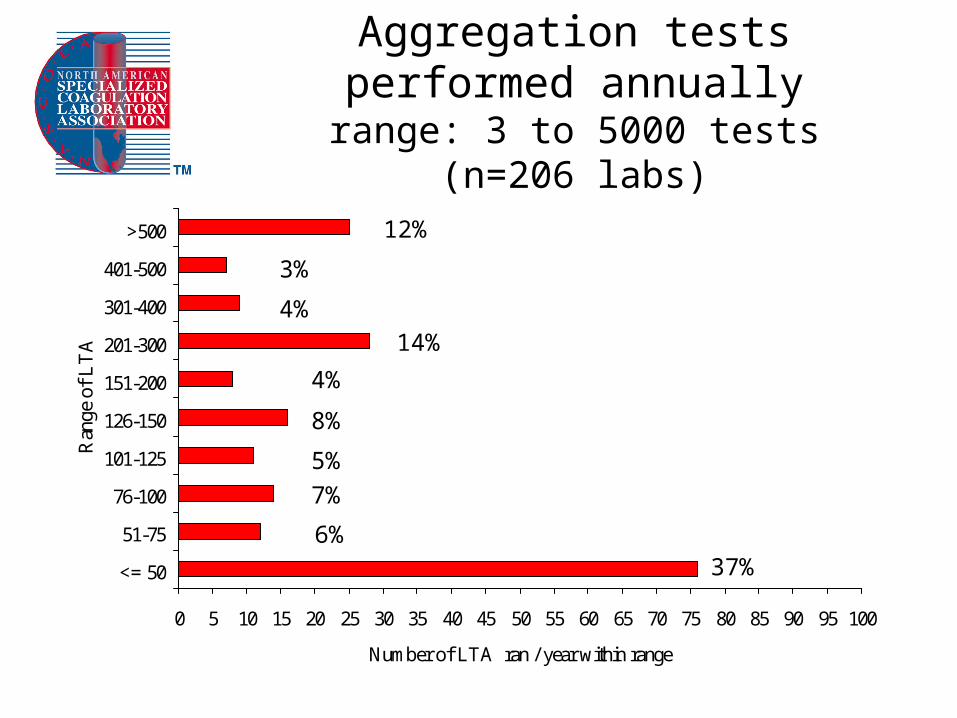
Aggregation tests performed annuallyrange: 3 to 5000 tests
(n=206 labs)
0 5 10 15 20 25 30 35 40 45 50 55 60 65 70 75 80 85 90 95 100
<= 50
51-75
76-100
101-125
126-150
151-200
201-300
301-400
401-500
>500
Ran
ge o
f L
TA
Number of LTA ran / year within range
37%6%
7%
5%
8%
4%
14%
4%
3%
12%
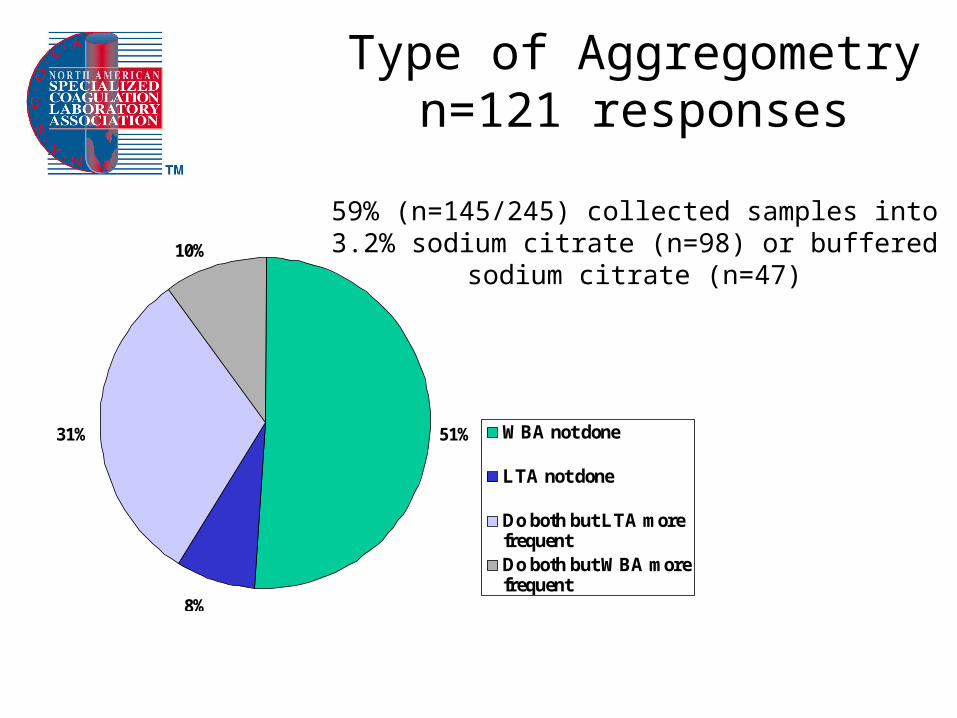
Type of Aggregometryn=121 responses
59% (n=145/245) collected samples into 3.2% sodium citrate (n=98) or buffered sodium citrate (n=47)
51%
8%
31%
10%
WBA not done
LTA not done
Do both but LTA morefrequentDo both but WBA morefrequent
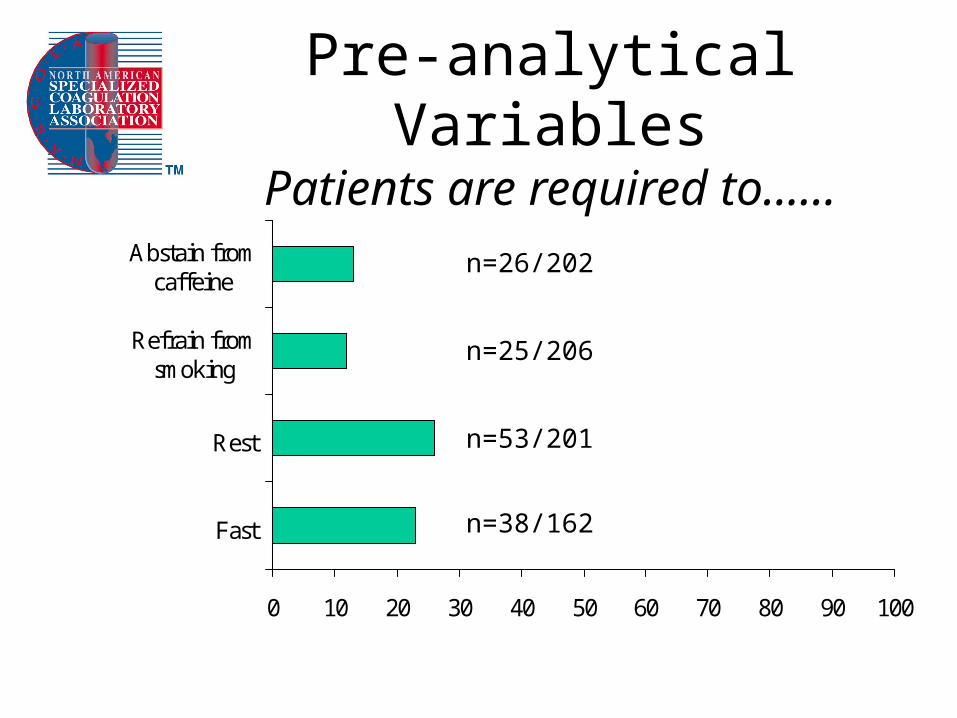
Pre-analytical VariablesPatients are required to……
0 10 20 30 40 50 60 70 80 90 100
Fast
Rest
Refrain fromsmoking
Abstain fromcaffeine
n=38/162
n=53/201
n=25/206
n=26/202
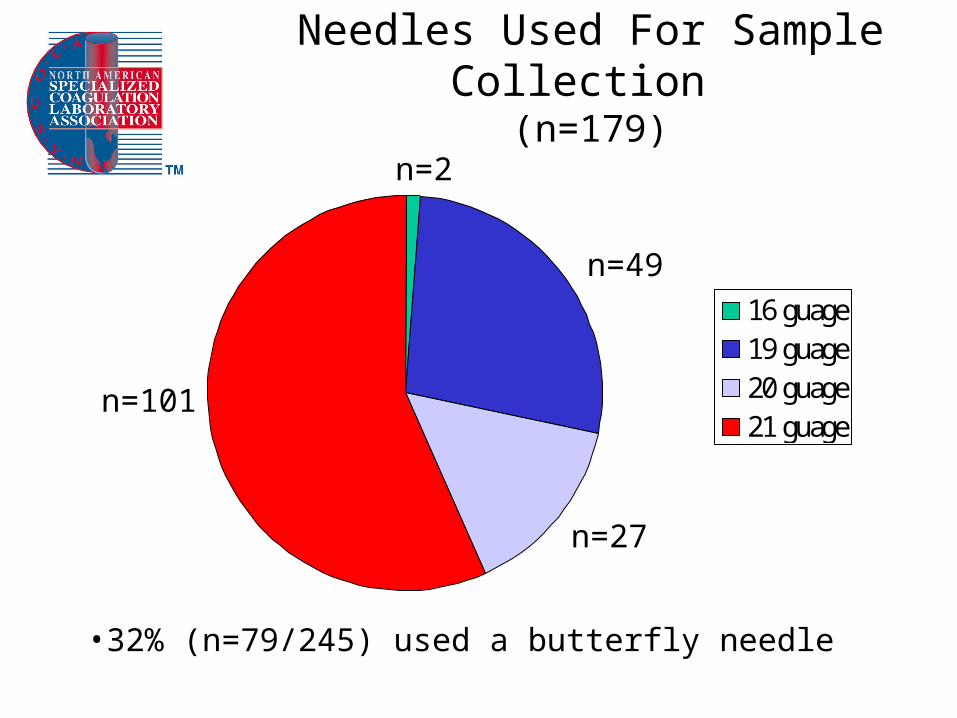
Needles Used For Sample Collection (n=179)
16 guage19 guage20 guage21 guage
n=2
n=49
n=27
n=101
•32% (n=79/245) used a butterfly needle
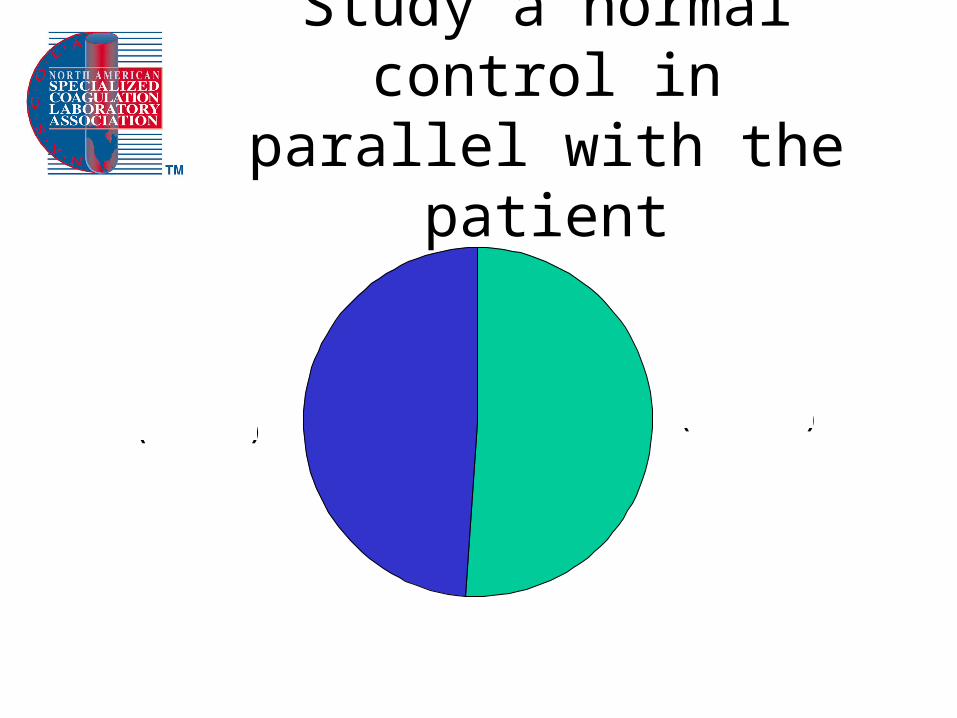
Study a normal control in parallel with the patient
Yes 51%(n=105 / 204)
No 49%(n=99 / 204)
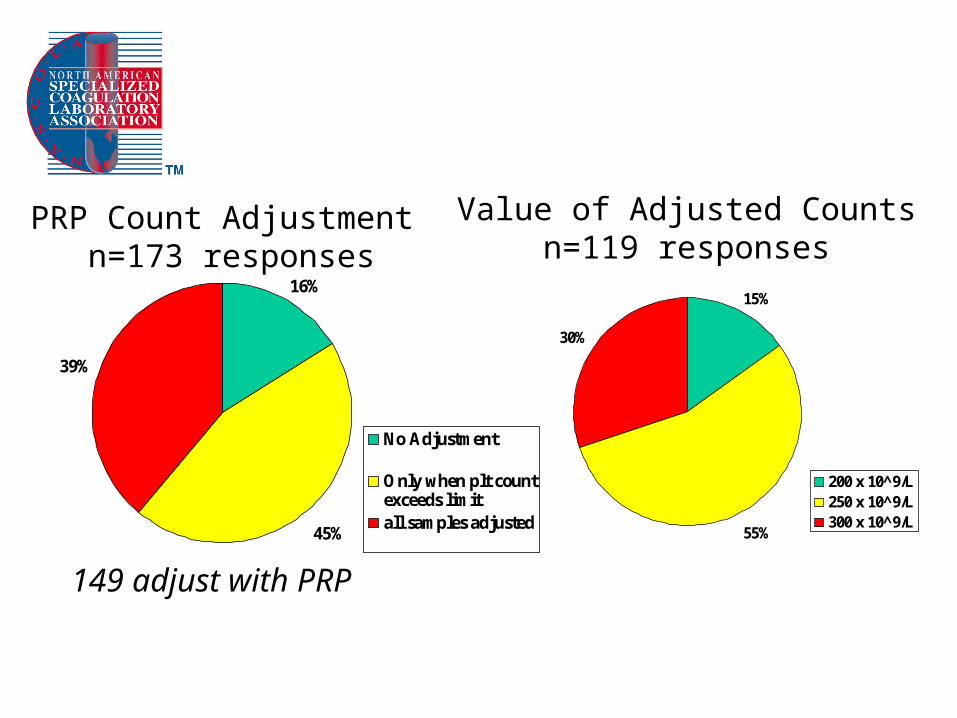
PRP Count Adjustment n=173 responses
16%
45%
39%
No Adjustment
Only when plt countexceeds limitall samples adjusted
149 adjust with PRP
15%
55%
30%
200 x 10^9/L250 x 10^9/L300 x 10^9/L
Value of Adjusted Countsn=119 responses
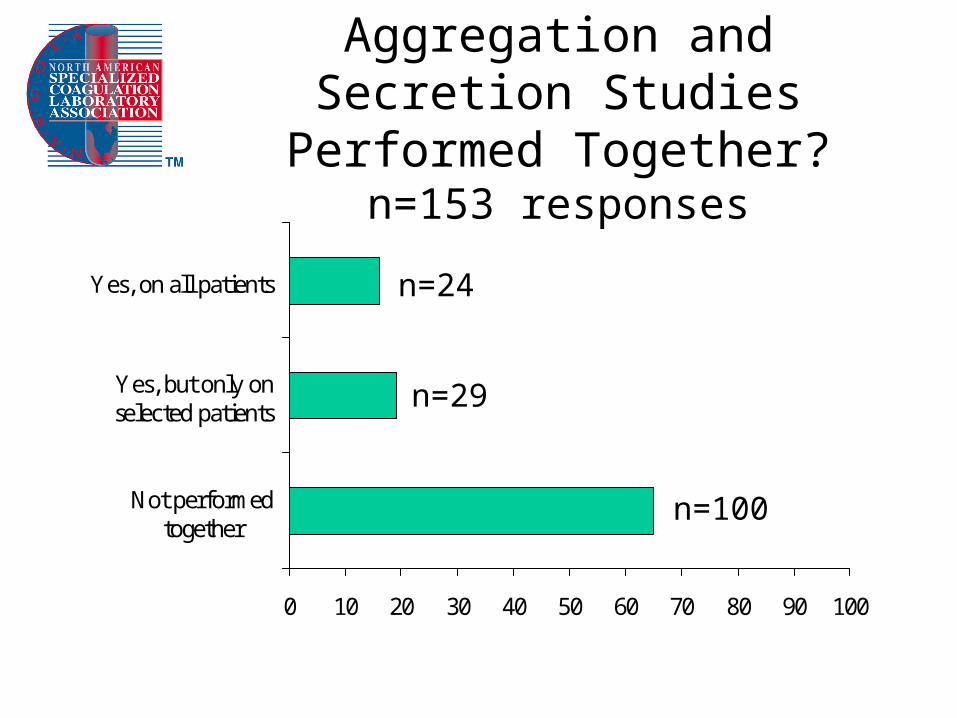
Aggregation and Secretion Studies Performed Together?
n=153 responses
0 10 20 30 40 50 60 70 80 90 100
Not performedtogether
Yes, but only onselected patients
Yes, on all patients
n=100
n=29
n=24
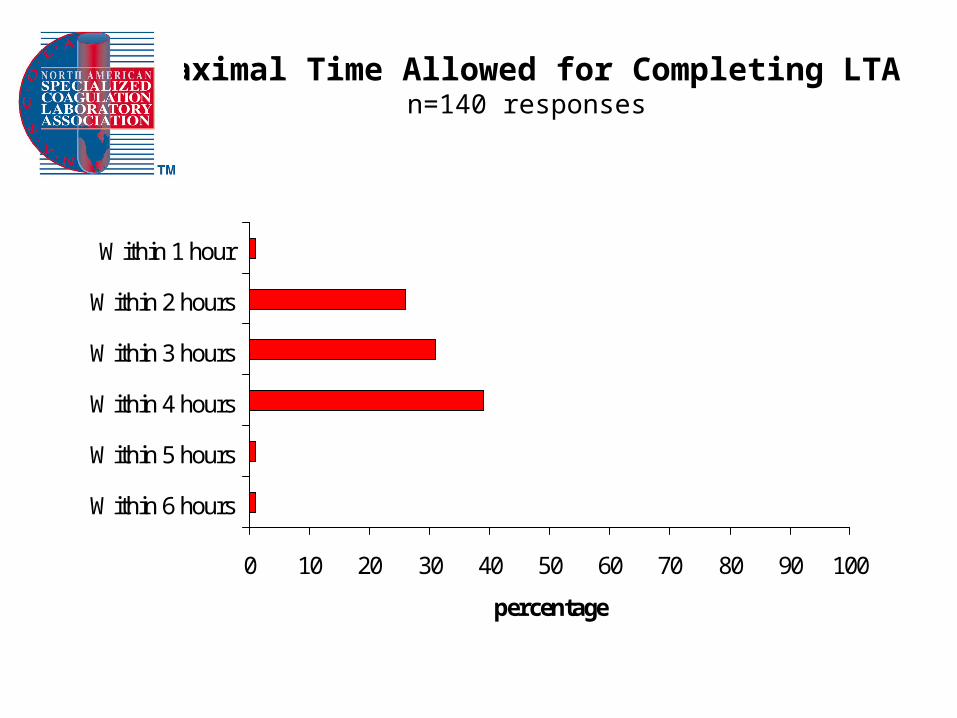
Maximal Time Allowed for Completing LTAn=140 responses
0 10 20 30 40 50 60 70 80 90 100
Within 6 hours
Within 5 hours
Within 4 hours
Within 3 hours
Within 2 hours
Within 1 hour
percentage
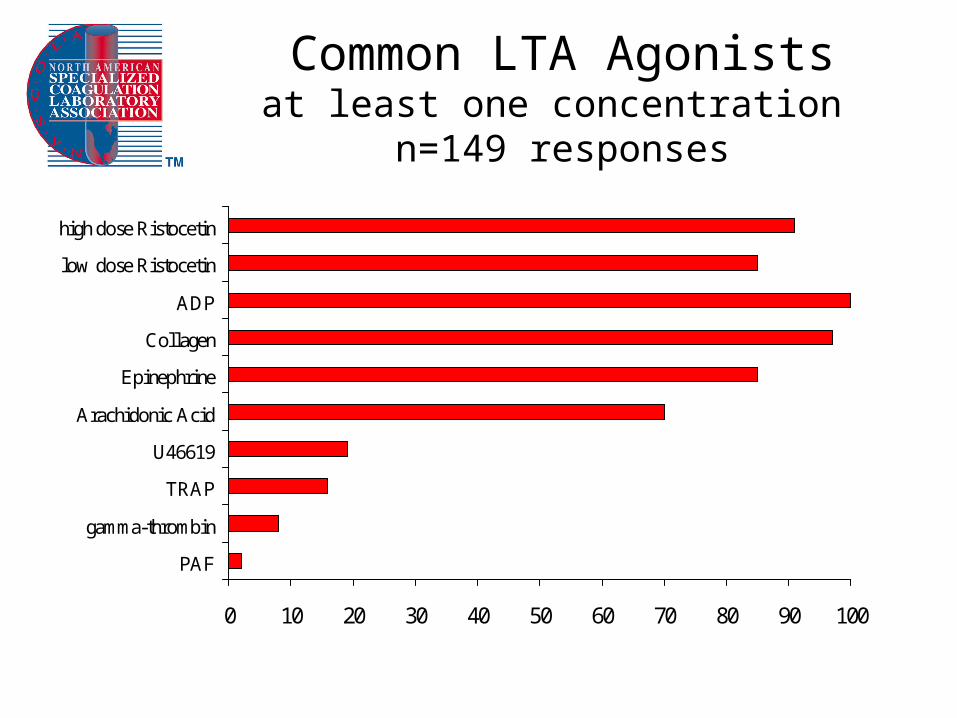
Common LTA Agonistsat least one concentration
n=149 responses
0 10 20 30 40 50 60 70 80 90 100
PAF
gamma-thrombin
TRAP
U46619
Arachidonic Acid
Epinephrine
Collagen
ADP
low dose Ristocetin
high dose Ristocetin
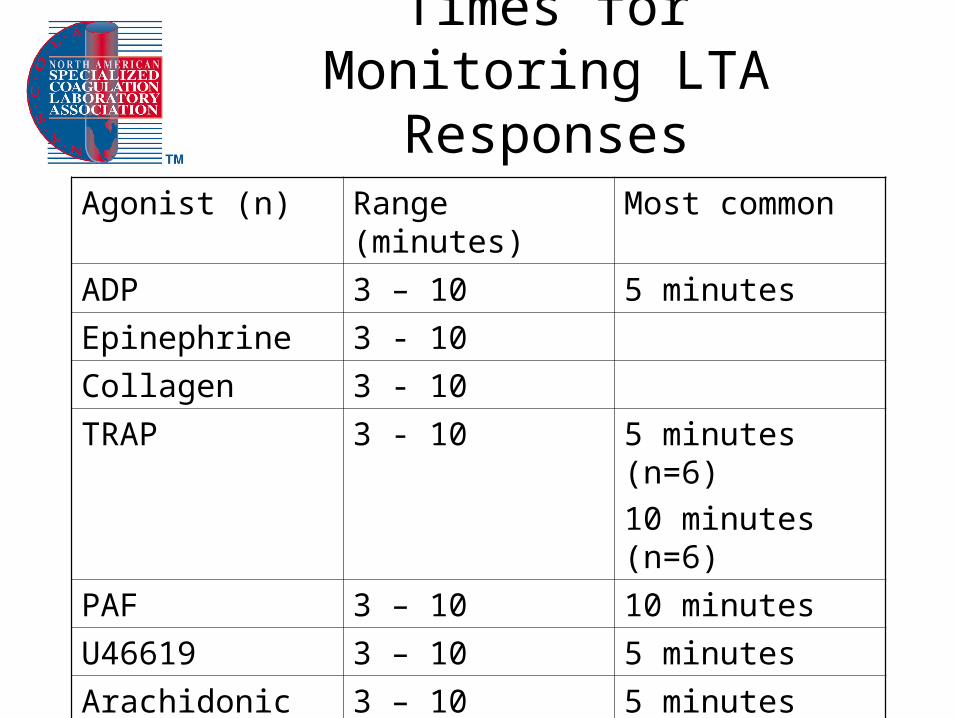
Times for Monitoring LTA Responses
Agonist (n) Range (minutes) Most common
ADP 3 – 10 5 minutes
Epinephrine 3 - 10
Collagen 3 - 10
TRAP 3 - 10 5 minutes (n=6)
10 minutes (n=6)
PAF 3 – 10 10 minutes
U46619 3 – 10 5 minutes
Arachidonic Acid 3 – 10 5 minutes
Gamma-thrombin 3 - 10 10 minutes
Ristocetin 3 – 10 5 minutes
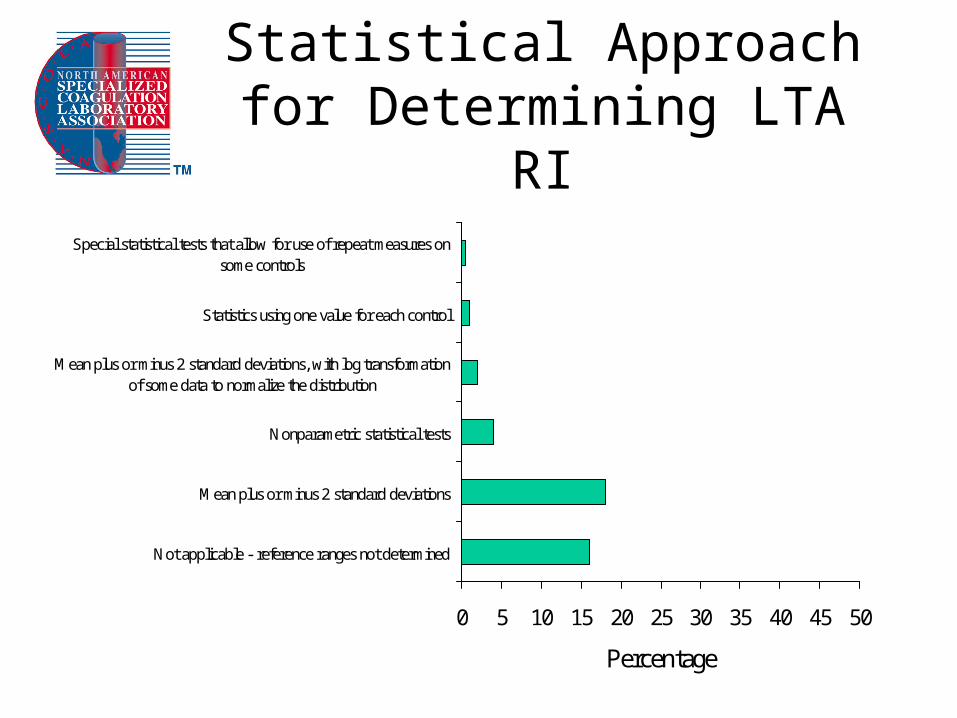
Statistical Approach for Determining LTA RI
0 5 10 15 20 25 30 35 40 45 50
Not applicable - reference ranges not determined
Mean plus or minus 2 standard deviations
Nonparametric statistical tests
Mean plus or minus 2 standard deviations, with log transformationof some data to normalize the distribution
Statistics using one value for each control
Special statistical tests that allow for use of repeat measures onsome controls
Percentage Note scale
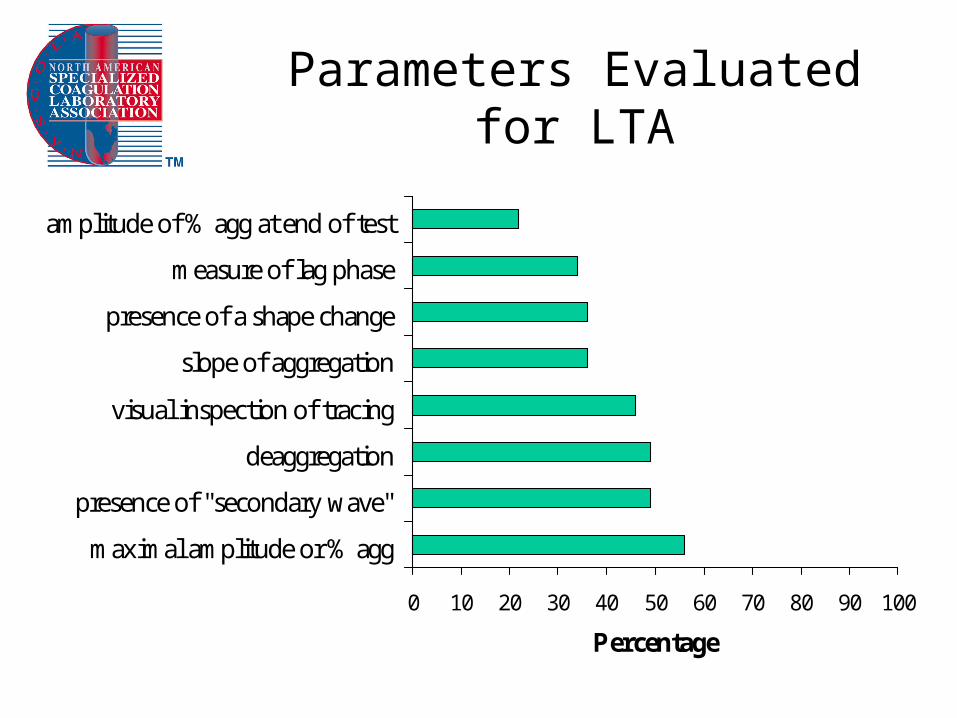
Parameters Evaluated for LTA
0 10 20 30 40 50 60 70 80 90 100
maximal amplitude or % agg
presence of "secondary wave"
deaggregation
visual inspection of tracing
slope of aggregation
presence of a shape change
measure of lag phase
amplitude of % agg at end of test
Percentage
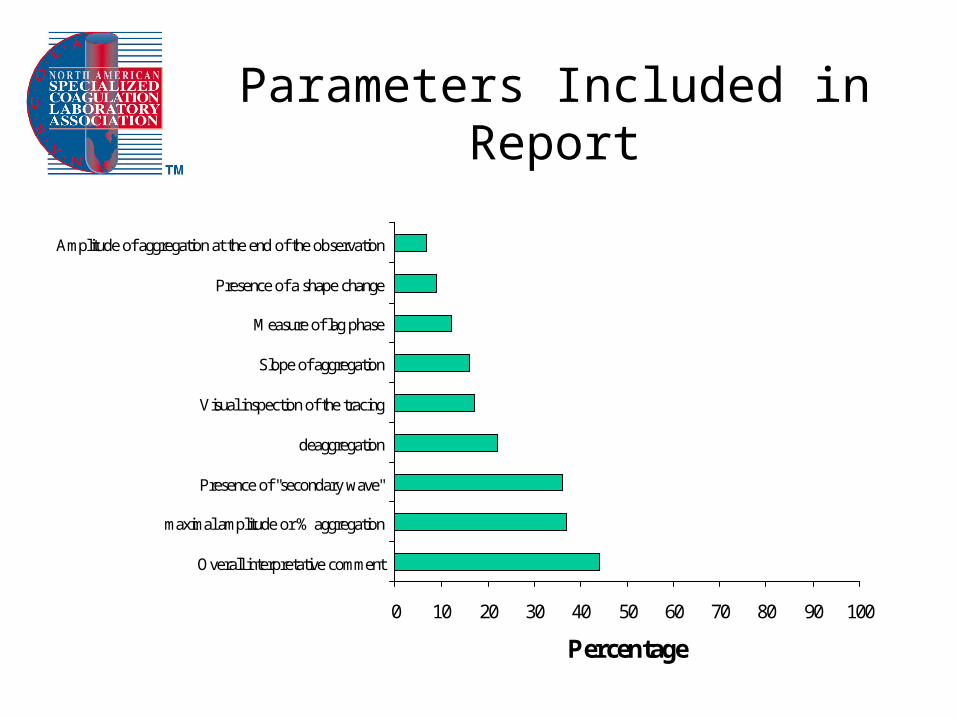
Parameters Included in Report
0 10 20 30 40 50 60 70 80 90 100
Overall interpretative comment
maximal amplitude or % aggregation
Presence of "secondary wave"
deaggregation
Visual inspection of the tracing
Slope of aggregation
Measure of lag phase
Presence of a shape change
Amplitude of aggregation at the end of the observation
Percentage

•