Embed Size (px)
Citation preview

NBER WORKING PAPER SERIES
IS A WIC START A BETTER START? EVALUATING WIC’S IMPACT ON INFANTHEALTH USING PROGRAM INTRODUCTION
Hilary W. HoynesMarianne E. PageAnn Huff Stevens
Working Paper 15589http://www.nber.org/papers/w15589
NATIONAL BUREAU OF ECONOMIC RESEARCH1050 Massachusetts Avenue
Cambridge, MA 02138December 2009
This work was supported by USDA FANRP Project 235 “Impact of Food Stamps and WIC on Healthand Long Run Economic Outcomes.” Ankur Patel and Rebecca Reed-Arthurs provided excellent researchassistance. The views expressed herein are those of the author(s) and do not necessarily reflect theviews of the National Bureau of Economic Research.
NBER working papers are circulated for discussion and comment purposes. They have not been peer-reviewed or been subject to the review by the NBER Board of Directors that accompanies officialNBER publications.
© 2009 by Hilary W. Hoynes, Marianne E. Page, and Ann Huff Stevens. All rights reserved. Shortsections of text, not to exceed two paragraphs, may be quoted without explicit permission providedthat full credit, including © notice, is given to the source.

Is a WIC Start a Better Start? Evaluating WIC’s Impact on Infant Health Using Program IntroductionHilary W. Hoynes, Marianne E. Page, and Ann Huff StevensNBER Working Paper No. 15589December 2009JEL No. I1,I38
ABSTRACT
The goal of federal food and nutrition programs in the United States is to improve the nutritional well-beingand health of low income families. A large body of literature evaluates the extent to which the SupplementalProgram for Women Infants and Children (WIC) has accomplished this goal, but most studies havebeen based on research designs that compare program participants to non-participants. If selectioninto these programs is non-random then such comparisons will lead to biased estimates of the program’strue effects. In this study we use the rollout of the WIC program across counties to estimate the impactof the program on infant health. We find that the implementation of WIC lead to an increase in averagebirthweight and a decrease in the fraction of births that are classified as low birthweight. We find noevidence that these estimates are driven by changes in fertility. Back-of-the-envelope calculationssuggest that the initiation of WIC lead to a ten percent increase in the birthweight of infants born toparticipating mothers.
Hilary W. HoynesDepartment of EconomicsUniversity of California, DavisOne Shields Ave.Davis, CA 95616-8578and [email protected]
Marianne E. PageDepartment of EconomicsUniversity of California, DavisDavis, CA 95616-8578and [email protected]
Ann Huff StevensDepartment of EconomicsOne Shields AvenueUniversity of California, DavisDavis, CA 95616and [email protected]

1
1. Introduction
The goal of the Supplemental Nutrition Program for Women, Infants, and Children
(WIC) is to improve the nutritional well-being of low income pregnant and postpartum women,
infants, and children under the age of five. Many studies show that pregnant women who
participate in WIC give birth to healthier infants than those who do not, and this has contributed
to broad support for the program: since its inception in the mid 1970s, the number of WIC
participants has grown to 8.7 million, at an annual cost of 6.2 billion dollars.1
Recently, however, the validity of existing studies—most of which use comparisons
between participants and non-participants to estimate WIC’s effects—has come under question.
Several researchers (Besharov and Germanis, 2001; Bitler and Currie, 2005; Brien and Swann,
2001; Chatterji et al., 2002; Kowaleski-Jones and Duncan, 2002) have drawn attention to the fact
that selection into the WIC program is non-random. If pregnant women who participate in WIC
are healthier, more motivated, or have better access to health care than other eligible women,
then comparisons between the children of participants and non-participants could produce
positive program estimates even if the true effect is zero. Conversely, if WIC participants are
more disadvantaged then other mothers, such comparisons may understate the program’s impact.
Recent studies have used several different approaches to address this problem. Bitler and
Currie (2005), Joyce et. al. (2005, 2008), and Figlio et. al. (2009) compare outcomes among
more narrowly defined treatment and control groups; Brien and Swann (2001), Chatterji et al.
(2002), and Kowaleski-Jones and Duncan (2002), include maternal fixed effects in their
regression analyses; and Brien and Swann (2001) and Chatterji et al. (2002) utilize limited state
variation in WIC program parameters. These approaches yield smaller WIC estimates, yet they,
1 For a recent summary of the extensive WIC literature see Currie (2003). WIC program information available on USDA website, see http://www.fns.usda.gov/pd/wisummary.htm.
2
too, suffer from identification problems. For example, even estimates based on comparisons of
observationally similar participants and non-participants may suffer from omitted variables bias.
Likewise, within family estimates may be driven by changes in family circumstances between
births. And while evaluations of other programs aimed at helping disadvantaged families—
including AFDC/TANF and Medicaid—commonly leverage significant variation in eligibility
and benefit rules across states, the parameters of the WIC program, like other food and nutrition
programs in the United States, exhibit little geographic variation. Ultimately, as noted in a recent
review of WIC studies by Ludwig and Miller (2005), WIC analyses are challenged by the
absence of a “clearly exogenous source of identifying variation (that is, a randomized or natural
experiment that drives variation across low-income women in WIC enrollment).”2
This study addresses this problem by exploiting variation in WIC program introduction
across geographic areas and over time. WIC was first established as a pilot program in 1972,
and WIC sites were established in different counties and in different years between 1972 and
1979. This feature of the program’s introduction allows us to perform a difference-in-differences
analysis, in which we compare changes in infant health within a set of “treatment” counties
(those adopting WIC in a given year) to changes within a set of “control” counties (those who
have not yet adopted WIC).
We find that when WIC is made available by the third trimester, average birth weight in
the county increases by approximately 2 grams. This estimated effect is driven by women with
low levels of education and women living in high poverty counties—precisely the women who
are most likely to be eligible for program benefits. Among women with low levels of education,
WIC increases average birth weight by 7 grams and reduces the fraction of births that are
classified as low birthweight by 1.4 percent. Using estimates of WIC participation rates, these 2 Ludwig and Miller (2005).
3
results for low educated women suggest a 10 (11) percent increase (decrease) in average birth
weight (fraction low birth weight) of children born to WIC participants. Since we find no
evidence that WIC affects fertility, our estimates are unlikely to be generated by indirect effects
on selection into birth.
In the next section we provide a brief description and history of the WIC program and in
Section 3 we review the prior WIC literature. In Section 4 we present our research design and in
Section 5 we describe our data. We present our results in Section 6 and we conclude in Section 7.
2. Background
The goal of the WIC program is to increase nutritional well-being among low-income
pregnant/post-partum women, infants and young children by providing food packages and
nutritional counseling. Five types of individuals are eligible for WIC: pregnant women, post-
partum women with a child under six months, breastfeeding women with a child under 12
months, infants and children under age five. Participants must live in households with family
incomes below 185 percent of the poverty line or become eligible through participation in
another welfare program such as Medicaid, Temporary Assistance to Needy Families, or Food
Stamps. They must also be certified to be at nutritional risk, but virtually all financially eligible
persons appear to satisfy this requirement (Ver Ploeg and Betson, 2003). Food packages are
typically provided in the form of vouchers that can be used to purchase specific items from
participating supermarkets. WIC maintains a list of approved foods, which must contain protein,
calcium, iron, and Vitamins A and C.3 Post-partum women have access to free infant formula
and (in later years of the program) breastfeeding services.
3 WIC approved foods include juice, fortified cereal, eggs, cheese, milk, dried beans, tuna, carrots, and iron-fortified infant formula.

4
The WIC program was first established as a pilot program in 1972, and became
permanent in 1975. The program was developed in direct response to policy recommendations
highlighting health deficits among low-income individuals that might be reduced by improving
their access to food. It was further recognized that, by providing food at “critical times” to
pregnant and lactating women and young children, it might be possible to prevent a variety of
health problems (Oliveira, et al, 2002).
WIC sites were established in different counties between 1972 and 1979, with legislation
requiring that the program be implemented first in “areas most in need of special supplemental
food” (Oliveira, et al. 2002). The first WIC program office was established in January 1974 in
Kentucky, and had expanded to include counties in 45 states by the end of that year. WIC was
intended to supplement food stamp benefits and the authorizing legislation specifically did not
preclude a person from WIC participation if they were already receiving food stamps.4
We have obtained data on the year the first WIC programs were implemented in a county.
These data were assembled from five documents listing all active WIC programs as of 1974,
1975, 1978, 1979, and 1989 and are more fully described in Section 5 and the data appendix.
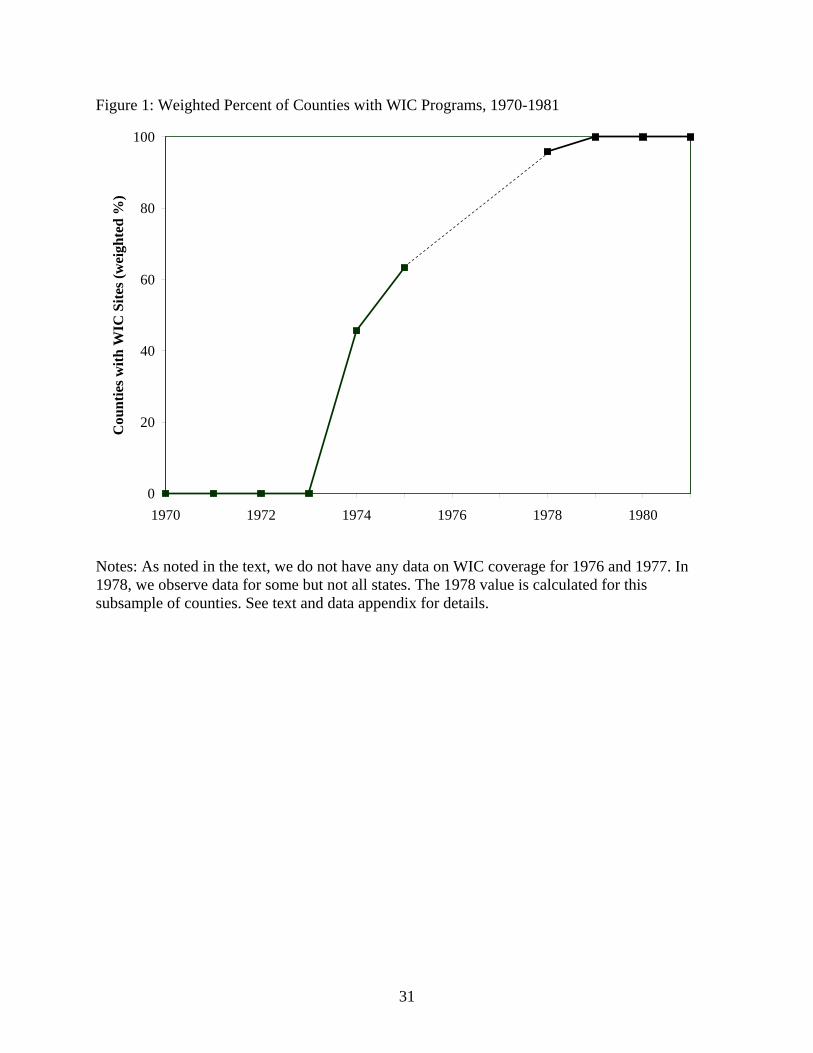
Figure 1 documents the aggregate rollout of WIC by presenting the fraction of counties
(weighted by 1970 population) that had WIC programs in place in each year. The figure clearly
shows that there was a dramatic increase in exposure to the program between 1974 and 1979.5
Figure 2 presents a map of the U.S. counties in 1974, 1975, 1978 and 1979. In each
panel, black counties identify those counties that had a WIC program in place. White counties
did not have a WIC program. Gray counties are counties for which we have no information. As
is clear from these figures, there is a considerable amount of geographic variation in the timing
4 Participation in the commodity distribution program, however, disqualifies individuals from WIC participation (Oliveira, et al., 2002) 5 Note that 1976 and 1977 are omitted because we have no information for those years.
5
of WIC implementation, both within and across regions. Our identification strategy hinges on
this county level variation in WIC “treatment.”
3. Existing Literature
There are many studies that examine the impact of WIC on birth outcomes,
breastfeeding, and nutritional intake (see Currie, 2003 for a review of the literature), and most
find that women who participate in WIC give birth to healthier infants than non-participants
(Currie, 2003; Devaney, et al., 1990). At issue, however, is the extent to which such studies
provide information about the program’s true causal effect. If WIC recipients differ from non-
recipients in other ways, then some of the difference in children’s outcomes may reflect
differences in the mothers’ characteristics. For example, if pregnant women who participate in
WIC are healthier, more motivated, or have better access to health care than other eligible
women, comparisons between the children of participants and non-participants could produce
positive program estimates even if the true effect is zero (Besharov and Germanis, 2001; Brien
and Swann, 2001; Chatterji et al 2002; Kowaleski-Jones and Duncan, 2002). Conversely, if WIC
participants are more disadvantaged than other mothers, such comparisons may understate the
program’s impact. A detailed examination of participating vs. non-participating mothers’
characteristics suggests that WIC mothers are negatively selected from the pool of eligibles
(Bitler and Currie, 2005).
In the wake of these concerns, a new wave of WIC studies has recently emerged that
employs alternative estimation strategies. One approach taken is to compare outcomes among
more narrowly defined treatment and control groups (e.g., Bitler and Currie 2005, Joyce et. al.
2005, 2008, and Figlio et. al. 2009). For example, Bitler and Currie (2005) create a control group

6
based on Medicaid funded births, and employ selection correction models. Figlio et. al (2009)
also create more narrowly defined treatment and control groups by focusing on those whose
income puts them on just either side of the eligibility cutoff. These approaches make some
progress on the problem, but because differences between participants and non-participants
remain, they do not fully eliminate selection concerns.
Another set of studies controls for unobserved family background characteristics by
comparing outcomes among siblings who participated in WIC to outcomes among those who did
not (Brien and Swann 2001, Chatterji et al 2002, Kowaleski-Jones and Duncan 2002). There are
several drawbacks to this approach: first, it is well known that within-family comparisons are
likely to exacerbate measurement-error problems that bias estimates towards zero (Griliches,
1979). Second, there may be spill-over effects from the participating sibling to the non-
participating sibling, which will lead to underestimates of the program’s true effect. Finally,
between birth changes in economic or health conditions of other family members may be
correlated with between sibling differences in program participation. In such cases, selection
biases will not be eliminated.
In the larger program evaluation literature, these selection problems can often be avoided
by comparing individuals living in states with different program parameters. Many studies of the
old AFDC program, for example, are based on this type of identification strategy (Moffitt 1992,
Blank 2002). Unfortunately, WIC is a federal program for which there is very little geographic
variation in either eligibility criteria or benefit levels. Brien and Swann (2001) and Chatterji et.
al. (2002) compare infant health outcomes across states with different program rules,6 but the
variation in program rules turns out to have limited power in predicting WIC participation.
6 States have had some scope to set WIC eligibility and policies including: income allowances, processes for declaring income, linkages with other programs, and specifics of eligible food items.

7
The estimation strategy employed by Rush, et al. (1988) comes closest to our own. Like
our study, Rush et. al. use county-level variation during the early years of WIC, but instead of
focusing on program implementation, the authors identify the effects of WIC using variation in
WIC penetration—roughly the fraction of eligible women participating in each county between
1972 and 1980. Since this variable captures both the presence of a program in the county and
county-level participation rates, non-random selection remains a potential concern.
In summary, the literature to date is dominated by studies that are subject to selection
bias. The magnitude of WIC’s effects is thus largely unknown, even though this knowledge is
crucial to determining whether the program is a success. We are able to make significant inroads
on this problem by comparing within county changes in infant health across treatment and
control counties. The gains from our methodological improvements outweigh the disadvantages
of studying an earlier period. To be sure, the United States has experienced many demographic,
social, and economics changes since the inception of WIC, but our results will still be
informative to today’s policy debates because to date, no one has been able to separately estimate
the causal effects of the program from the effects of individual characteristics that might
independently affect their health.
4. Research Design
Cross-county variation in WIC initiation forms the basis of our estimation strategy.
Similar strategies have been used in recent studies of social programs such as the food stamp
program (Almond, Hoynes and Schanzenbach 2009, Currie and Morretti 2008, Hoynes and
Schanzenbach 2009), Head Start (Ludwig and Miller, 2007), Medicare (Finkelstein and
McKnight, 2008), family planning programs (Bailey 2009), Title I (Cascio, Gordon, Lewis and

8
Reber forthcoming), and a larger literature examining impacts of the Great Society and Civil
Rights era (for example see Almond, Chay and Greenstone 2006). Our basic regression model
is:
yct = α + δWICct + γ1Zc t + γ2GTct + ηc + λt + θst + εct
where yct is an outcome variable measured for county c in year t, and ηc and λt are county and
year fixed effects. WICct is the WIC treatment variable, which is equal to one if county c has a
WIC program in place in year t. We match births occurring in the first quarter of the calendar
year with program and other county-level variables for the previous year, based on evidence that
the third trimester is the most important in determining birth weight (Almond, Hoynes, and
Schanzenbach 2009).
Equation (1) includes both county and year fixed effects, so that identification comes
from cross-county variation in the timing of program introduction. An unbiased estimate of the
program impact requires that there are no contemporaneous county level trends that are
correlated with WIC introduction and infant health. The introduction of WIC took place during a
period of tremendous expansion in cash and noncash transfer programs, as the War on Poverty
and Great Society programs expanded. County-level variation in WIC roll-out is key to
disentangling WIC from these other programs. We control for possible confounders by
including two sets of county level control variables. First, to account for possible changes in
other social programs, we include three measures of per capita government transfers GTct (cash
public assistance, medical care, and retirement and disability programs), which are measured
annually at the county level (U.S. Bureau of Economic Analysis 2007).7 We also include an
indicator for food stamp program (FSP) availability in the county-year. These data have been
7 Most of these programs (such as Aid to Families with Dependent Children, Medicaid, Medicare, and Social Security) are federal or state-administered programs and, therefore, we expect their impacts will be absorbed by the state-year fixed effects.

9
previously collected by Hoynes and Schanzenbach (2009).
Following Hoynes and Schanzenbach’s work on the implementation of the food stamp
program, we also include a set of county level variables, Zc, that might be correlated with
program introduction. Hoynes and Schanzenbach (2009) find that counties that adopted the food
stamp program early were also counties with a relatively high fraction of elderly, young, black,
and low income residents, whereas counties that adopted later were more likely to be rural.
These county characteristics explain very little of the variation in food stamp adoption dates, but
because we wish to adopt a conservative approach we include them in our analyses.
Specifically, we include 1970 (pre-treatment) measures of the above variables and interact them
with a time trend.8 We also directly estimate the relationship between these variables and the
probability that WIC is adopted. The results of this exercise are discussed in Section 6. Because
most means tested programs are administered at the state level, we also include a full set of state-
year dummies θst . This helps avoid possible contamination from coincident timing in the
implementation or expansion of other means-tested programs.
All estimates are weighted using the number of births in the county-year cell and standard
error estimates are clustered at the county level. To further protect against estimation problems
that might be associated with thinness in the data, we drop all county-year cells where there are
fewer than 25 births. The results are not sensitive to this sample selection.
We focus on two dependent variables: mean birth weight (in grams) and the fraction of
newborns classified as “low birth weight” (less than 2,500 grams). In some analyses we also
look at how the introduction of WIC affected the birthrate among women between the ages of 15
and 44. Our choice of dependent variables is largely dictated by the availability of county-level
8 The vector Zc includes county variables measured prior to WIC, and is non time varying. Any fixed characteristics of the county will be captured by the county fixed effects. But by interacting the county characteristics with time the goal is to control for possible differences in trends across counties.
10
time-varying measures of infant health, and the lack of comparable data on other health or
nutritional outcomes for women, older infants, or children. Nevertheless, pregnant women have
always been a key part of the WIC target population, and towards the end of our sample period
(1978) approximately 20% of WIC participants were pregnant or postpartum women (Oliveira et
al 2002).9 The program goal of improving nutrition among this group suggests that infant health
should be a key outcome for evaluating WIC efficacy. Birthweight outcomes are both important
in their own right and predictive of later health and socioeconomic success (Currie and Hyson
1999, Black, Devereux and Salvanes 2007 and Oreopolous, Stabile, Roos and Walld 2006).
Our “program implementation” research design identifies the impact of WIC on the
population, where the relevant population is the particular sample used in the regression. This is
different from (but related to) typical estimators in the WIC literature, where researchers have
estimated the impact of individual participation in WIC on individual outcomes. To make our
estimates comparable, we scale our estimates up by the fraction of the population that
participates in the program. This is the usual manipulation from the “intent-to-treat” effect to the
average effect of the “treatment on the treated.”
5. Data
A. WIC program data
Our key treatment is the year that each county first implemented WIC. Since the date
that each county first began WIC services is not available from a unified source, we compile
information from several directories and congressional filings that provide lists of local agencies
that directly provided WIC services. More details, including the full names of these directories,
9 Recently, the fraction of children participating in WIC has grown. In 2007 pregnant women made up just 11% of WIC recipients (Oliveira and Frazao, 2009).

11
are included in the data appendix. In short, we have county-level information on WIC local
agencies for the years 1974, 1975, 1978, 1979, and 1989. These years span the period over which
the WIC program expanded. The first WIC office was opened in Kentucky in 1974 and by the
end of that year WIC served approximately 88,000 women and infants. Five years later, in 1979,
the program served 1.5 million women, infants and children.10
Our main analyses are based on data from 1971 through 1975, and 1978 through 1982.
We do not include 1976 and 1977 because we have no information on which counties began
offering WIC services during those years. In addition, our information for 1978 is incomplete--
we have county-level information on WIC for only 13 states that participated in a WIC migrant
study. If, in 1978, a county is not in one of the 13 states, but is known to have offered WIC
services in a previous year, we retain that county in the sample. The WIC implementation
variable is set to missing for the other counties that are in the 37 states not covered in the 1978
directory, and they are not included in our regressions.11 Our results are robust to the exclusion
of 1978.
We focus on the set of counties that had established a local WIC agency by 1979 because
our next available data source is ten years later (1989). Our sample includes about two thirds of
all counties in the United States (2,059 out of 3,100) and covers 86 percent of the 1970
population (85 percent of births). Figure 2 shows that the counties that had not adopted WIC by
1979 were dispersed throughout the U.S. Table 1 presents characteristics of our sample counties
compared to those excluded from the analysis. Sample counties are more urban and populous,
with a smaller share of farm residents. Average income is also somewhat higher in our sample,
and a smaller fraction of the population is below the poverty line. On the other hand, there is
10 For program data see http://www.fns.usda.gov/pd/wisummary.htm. 11 This explains the greater number of counties in 1978 that are shaded grey in Figure 2.

12
little difference in 1970 infant health outcomes between the included and excluded counties.
B. Vital Statistics Natality Data
Our birth outcomes are taken from vital statistics records, which are coded from birth
certificates and available beginning in 1968. Depending on the state and year, the data represent
either a 100 percent or 50 percent sample of births, and include about 2 million observations per
year. Reported birth outcomes include birth weight, gender, plurality, and (in some state-years)
gestational length. The dataset also includes (limited) information on the age and race of the
mother, maternal education (in some state-years), and each infant’s county and year of birth.
This information allows us to link individual natality outcomes to our WIC indicator, and to
collapse the data into county-year cells covering 1971-1975 and 1978-1982. Our dependent
variables are the mean birthweight in each county-year cell, and the fraction of infants in each
county-year who are classified as low birthweight. Our observation period ends in 1982, two
years after all counties in our sample have adopted the program.
C. Other controls
County Population Data: The CANCER-SEER population data provide estimates of the
population of women ages 15-44 by county-year.12 These are used together with the natality data
to construct fertility rates—defined as births per 1,000 women ages 15-44. In some analyses, we
use these fertility rates as an additional dependent variable.
County Control Variables: We have obtained a number of pre-treatment economic and
demographic control variables from the 1970 IPUMS. These variables include the percent of the
1970 population that: lives in an urban area, on a farm, is black, is less than 5, is 65 or over, or is
poor. The IPUMS also provides a measure of the county population in 1970, which we include 12 See National Cancer Institute http://seer.cancer.gov/popdata/download.html.
13
in log form. We also include measures of annual, county real per capita income and government
transfers including cash public assistance benefits (Aid to Families with Dependent Children
AFDC, Supplemental Security Income SSI, and General Assistance), medical spending
(Medicare and Military health care), and cash retirement and disability payments using data from
The Bureau of Economic Analysis, Regional Economic Information System (REIS).
6. Results
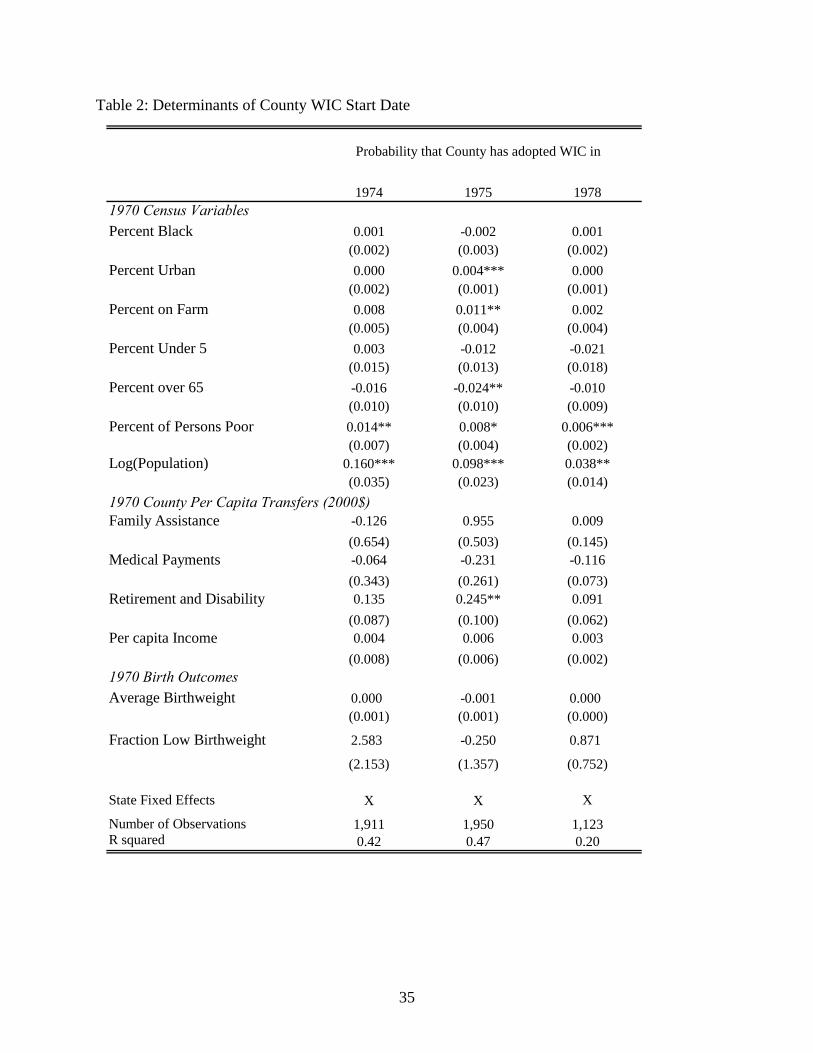
6.1. County Adoption of WIC
The validity of our research design hinges on the exogeniety of county WIC start dates.
Thus, we begin by empirically investigating the determinants of county implementation. The
written history of WIC provides little intuition as to which types of counties were likely to be
early adopters, so, as described in Section 5, we have simply gathered data on as many pre-
treatment county characteristics as we could, and estimate the relationship between these
characteristics and WIC initiation. We estimate three separate cross-county regressions. In the
first regression, the dependent variable is equal to 1 if the county had a WIC program in place by
1974, and 0 otherwise. In the second regression, the dependent variable is an indicator for
whether the county had adopted WIC by 1975. In the third regression, the dependent variable is
an indicator for whether WIC was in place by 1978. The regressors of interest are the county
level variables described above. Each regression includes state fixed effects, and is weighted by
the 1970 county population.
Table 2 shows that few of these variables have any predictive power. Notably, there is no
association between 1970 county-level infant health outcomes and the timing of WIC start-up.
We do find that counties with a larger population and a higher poverty rate are more likely to
14
implement WIC programs earlier, but taken as a whole, the quantitative importance of these
predictors is small. For example, the negative and significant coefficients on the fraction poor in
a county suggest that counties in the highest quartile of poverty rates are between one-half and
one percentage point more likely to adopt WIC in a given year than those in the lowest quartile
of poverty rates. This is a very small effect relative to the 60% of counties that had implemented
WIC by 1975.
Table 2 makes clear that most of the variation in the timing of WIC implementation is
unexplained, and this may be related to some early difficulties in getting the program launched.
Historical documents suggest that, during the program’s initial years, there was excess demand
for WIC services (U.S. Congress, 1976), and that several lawsuits were filed by individual
communities attempting to get the program started. This is consistent with relatively
idiosyncratic factors determining both which counties started WIC programs first, and which
individuals received initial program services. Nonetheless, in order to control for possible
differences in county-level trends that might be spuriously correlated with the county treatment
effect, our main regressions include all of our 1970 county variables interacted with time trends.
6.2. Effects of WIC on Infant Health
Table 3 provides our main estimates of the effect of WIC on infant health. The first two
columns of Table 3 show the estimated relationship between WIC and average birthweight, and
the second two columns show the estimated effect of WIC on the fraction of births that are
classified as low birthweight. All of the estimates are based on regressions that control for
county fixed effects, 1970 county-level variables interacted with a time trend, and the time-
varying county-level variables described in Section 5. The second column in each panel adds
state by year fixed effects, which helps control for the possibility that changes in state-level

15
social programs might be correlated with provision of WIC services.
The first column of Table 3 shows that WIC availability increased average birthweight by
a statistically significant 2.7 grams. Adding state-year fixed effects to the regression changes the
estimate only slightly, to 2.3 grams. Both estimate are statistically significant. These are small
effects on the overall population, indicating an increase in birthweight of one-tenth of one
percent of the mean (labeled as “Coeff/Mean” on this and future tables), but recall that most
pregnant women are not eligible for WIC and would not have been affected by the program’s
implementation. The remaining columns in the table suggest that the small increase in
birthweight does not appear to occur around the 2500 gram margin.
What we really care about, however, is WIC’s impact on the population that actually
receives assistance. In order to appropriately scale our estimates, we need an estimate of the
fraction of births that were to women receiving WIC during the 1970s. Unfortunately,
information on early WIC participation is not sufficiently detailed to calculate this statistic. In
particular, we do not have detailed information on how many participants were women, infants,
and children in the earliest years of het program. We know that in 1980, 411,000 women
participated in WIC representing about 20 percent of the total caseload. We estimate that of that
total, approximately 289,000 participated as pregnant women (U.S. House of Representatives
1991 and USDA 2001). We also know that there were 3.6 million births in that year. When we
combine these two statistics, we obtain an estimated WIC participation rate of 8 percent.13 We
use this participation rate to convert our overall estimates into estimates of the effect of treatment
13 Specifically, we estimate the 8 percent participation rate as follows. The National Survey of WIC Participants reports that in 1998 pregnant women were 13%, breastfeeding women were 3%, and post-partum women were 6% of the total caseload (USDA 2001). We use this to estimate that in 1980 (before breastfeeding women were eligible for WIC) roughly two-thirds of all women (13 percent compared to 13 + 6 percent) on WIC were pregnant. Taking 2/3 of the 411,000 participating women gives us an estimated 289,000 pregnant women participants, compared with 3.6 million total births, for a participation rate among pregnant women of 8 percent.

16
on the treated. Thus, the overall estimate in column 2 of Table 3 implies average birthweight
increases to WIC participants of approximately 29 grams. This estimate is smaller than most
previous estimates. Devaney et al. (1992), for example, produce estimates that range from 51 to
113 grams across several states. Bitler and Currie (2005) estimate that WIC increases average
birthweight among WIC participants by 62 grams, even after including observable controls for
selection. Interestingly, Rush, et al. (1988) which also focuses on the early years of the WIC
program (but is still subject to selection bias) finds that state WIC availability increases average
birthweight by 23 grams, which is close to our estimate.
Since WIC is a means tested program we expect its impact to be concentrated among
families with low incomes. Although the vital statistics birth certificate data does not include
data on family income, it does include information on maternal education, which we use to
identify groups that are more or less likely to be affected by WIC. We present results by
maternal education in Table 4, where we collapse our data by county, year, and maternal
education based on three categories: less than high school, high school, and greater than high
school.14 We find that among women with less than a high school education, the availability of
WIC in the county of birth increases average birth weight by a statistically significant 7.0 grams.
We also estimate a 1.4 percent (not statistically significant) decrease in the probability of being
born with low birth weight. Moving down the rows of Table 4 we see that as the education of the
mother increases, the magnitude of the estimated treatment effects moves towards zero. As
expected, we see that the estimated impact of WIC on mothers with more than a high school
degree is very small and statistically insignificant.
Our estimates for women with less than a high school education can be translated into a
14 State reporting of maternal education varies during the 1970s. In 1977, for example, about 80 percent of births were in states that provided maternal education. For this analysis, we drop state-years missing data on education.

17
treatment on the treated effect by using a WIC participation rate specific to women with less than
a high school education. Since direct estimates of participation by education level are not
available during the early years of the program, we use the distribution of WIC participants in
1998 (USDA 2001), combined with the number of pregnant women participating in 1980, to
estimate a participation rate among pregnant women with less than a high school education. The
estimated participation rate is 12.3 percent.15 Thus, the implied effect on WIC participants is
approximately 57 grams. This is, of course, larger than our overall estimate, but still on the low
end of estimates that are based on comparisons between participants and non-participants. Our
estimated effect of WIC on the fraction of infants with low birth weight (-.0014) implies an
effect on participants of 1 percentage point, or roughly an 11% increase in the probability.
Currie’s (2003) review summarizes earlier studies as finding effects on the probability of low
birth weight of 10 to 43%. Bitler and Currie (2004) estimate that WIC reduces the probability
that a baby is classified as low birthweight by 29%. Among low educated women, our results for
WIC’s impact on the probability of a low birthweight are again below many previously
published estimates.
We show the results of a similar exercise in Table 5, where we stratify our sample
according to the fraction poor in 1970. We present results for counties whose 1970 poverty rates
were in the top quartile (where the average poverty rate is 20 percent) and the bottom quartile
(where the average poverty rate is 4 percent).16 We expect that, given that WIC is means tested,
counties with higher poverty rates should be more affected by the initiation of the program.
15 Specifically, we estimate the 12.3 percent participation rate as follows. The National Survey of WIC Participants provides characteristics of WIC participants in 1998, including counts of pregnant recipients by maternal education. We use this, combined with counts of number of births by maternal education in 1998 to construct participation rates by maternal education. To get 1980 WIC participation rates by education, we scale the 1998 rates by the ratio of the overall sample participation rates for the two years. 16 Poverty quartiles are assigned using the 1970 population as weights. In Table 5, the larger number of observations in the high poverty quartile regressions reflects the fact that smaller counties (in 1970) had higher poverty rates.

18
Table 5 shows that among counties with the highest poverty rates, WIC adoption raised average
birth weight by a statistically significant 7 grams and reduced the fraction born with low
birthweight by an insignificant 0.6 percent of the mean. The estimated impacts in low poverty
counties (where we would expect very low WIC participation rates) have signs opposite of the
expected effects for WIC participants and are not significantly different from zero.
Taken together, Tables 4 and 5 provide further evidence that we are truly identifying the
impact of WIC implementation. Our estimated impacts appear to be concentrated among groups
where WIC participation should be highest. We find no impacts within groups where WIC
participation is expected to be low.
WIC’s nutritional benefits are targeted on pregnant women with the aim of improving
fetal development and reducing the incidence of low birth weight. Our point estimates suggest
that WIC reduces the percent of births below 2,500 grams, but the estimates are not statistically
significant. To further investigate the impact of WIC on the distribution of birth weight, we estimate
a series of models relating the introduction of WIC to the probability that birth weight is below a
given gram threshold, specifically: 1500, 2000, 2500, 3000, 3250, 3500, 3750, and 4000. Our
regressions include state-year fixed effects and are estimated for two groups: births to mothers with
less than a high school education and births to mothers living in the highest poverty quartile counties.
The results are presented in Figure 3 where we plot percent impacts—the estimated coefficient
divided by the mean of the dependent variable. We find that the largest percent reduction in
probability of birth weight below a certain threshold occurs at the bottom of the birthweight
distribution. The impacts become gradually smaller as the birth weight threshold is increased, and
reaches near zero for births below 3,750 grams.
7. Robustness Checks

19
Our results are robust to several specification checks. They do not hinge on the inclusion of
data from 1978, where WIC status can only be directly observed for a small sample of counties. They
are also robust to the exclusion of our county-level control variables. Further, as shown in Table 3,
our estimates are similar whether or not we include state-year fixed effects. As might be expected,
controlling for county and time fixed effects is important. Further, we provided placebo tests in
Tables 4 and 5, showing small (but imprecisely estimated) results for groups with lower probabilities
of being impacted by WIC.
One worry is that the same forces that lead to the association between WIC and better birth
outcomes, also lead to a change in the composition of births. In particular, if improvements in fetal
health lead to fewer fetal deaths, there could be a negative compositional effect on birth weight from
higher likelihood that “marginal” fetuses survive. In addition, WIC may lead to increased fertility
among disadvantaged women if children are a normal good.17 Both these factors might lead to
endogeneous sample selection and contribute towards downward biased estimates. To evaluate this
possibility, we estimate the impact of WIC on total births and the characteristics of mothers giving
birth. The results of this exercise are shown in Table 6. The first two columns presents estimates of
the impact of WIC implementation on the fertility rate, which is defined as total births per 1000
women ages 15-44. The estimates are very small and statistically insignificant effects for both the
full sample and the counties in the highest poverty quartile.18 The remaining columns of the table
relate county WIC implementation to observable maternal characteristics. WIC access appears to
have no impact on the percent of births that are to mothers with less than a high school education or
on the fraction of births to minority mothers. We do find, however, that WIC access is associated
with a statistically significant increase (decrease) in the share of births to mothers with a high school
17 The existing literature suggests that the elasticity of fertility with respect to additional transfers from income support programs is very small (Moffitt 1998). 18 Note that we can not estimate fertility models by education group because the county population does not break out education groups.

20
(greater than a high school) education.
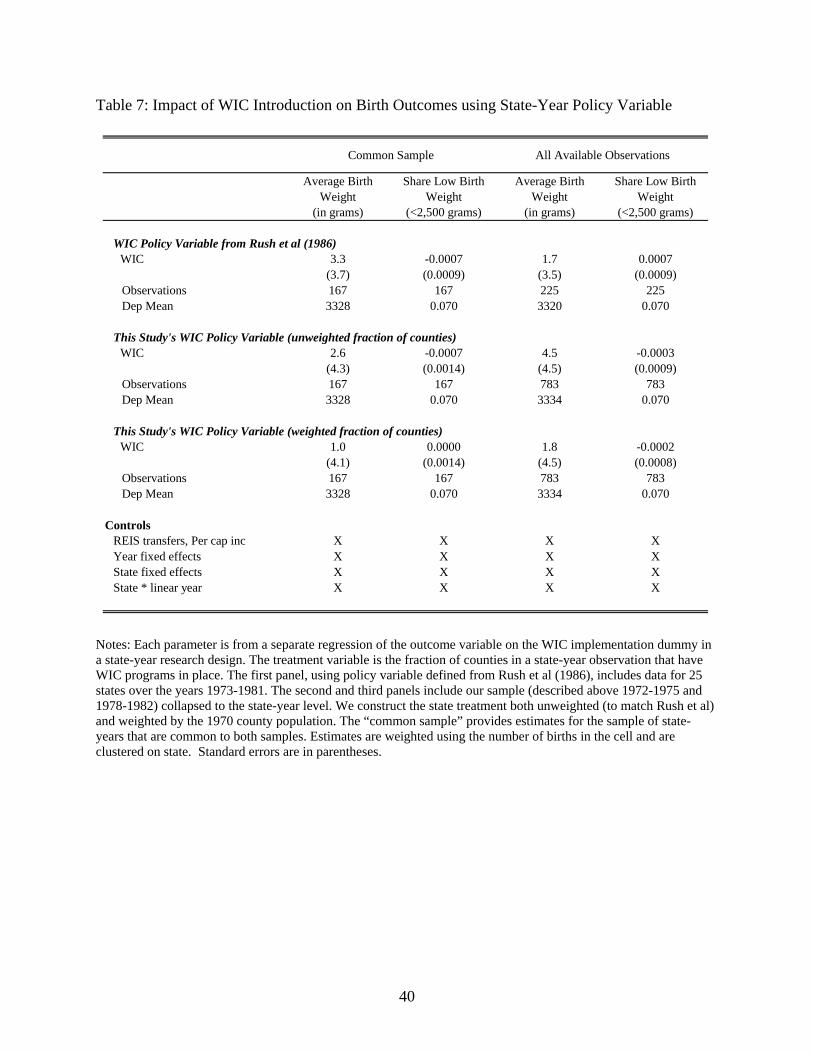
Our final robustness table is a check on our WIC policy variable. Rush et al (1986), in
their national WIC evaluation, include a tabulation of the number of counties served, by year and
state, for 1973 to 1981 for the 25 states includes in the study (see appendix for list of covered
states). We can use this, in a state-year research design, to provide indirect evidence on our WIC
policy variable. To implement this robustness check, we collapse our data to the state-year level.
We estimate models similar to those presented above and control for state and year fixed effects,
state specific linear time trends, state real per capita income and state real per capita government
transfers. We present estimates using three alternative WIC policy variables: (1) Rush et al’s
fraction of counties in the state that have WIC programs in place, (2) the fraction of counties in
the state with WIC programs in place from our data, and (3) the weighted fraction (using 1970
population) of counties in the state with WIC in place from our data. Because neither our data
nor the Rush et al data covers all states, we present estimates for a common sample followed by
all available observations. In all models we weight by the state population. The results, in Table
7, show that when we limit the analysis to the common sample, our unweighted state WIC
implementation variable and the comparable variable from Rush et al (1986) provide very
similar results. Note that our precision is reduced significantly when we move from the county to
the state identification strategy. The state-year approach is useful in comparing our data on WIC
implementation with the data used by Rush et al, and the results are broadly comparable, but
only by using our main county-level approach can we identify treatment effects with the
necessary degree of precision to draw strong conclusions.

21
7. Conclusion
This paper presents new evidence on the effect of the WIC program on infant health.
Because the parameters of the WIC program have not varied tremendously over time and exhibit
relatively little geographic variation, it has proven difficult to identify the program’s effects.
Until recently, most WIC studies have compared participants’ outcomes to the outcomes of non-
participants, leading to biased estimates. Attempts to control for non-random selection into WIC
have confirmed that participation is unlikely to be random. We overcome this problem by
exploiting county-level variation in the original adoption of the program between 1974 and 1979.
We use the gradual roll-out feature of WIC implementation at the county level to identify the
effect of WIC separately from the effect of other policy changes that occurred during the late
1970s and early 1980s. This research design provides an important contribution to the WIC
evaluation literature, which is free of bias due to non-random participation decisions.
We find that the introduction of this transfer program improved birth outcomes, and that
the effects were largest among populations most likely to be eligible for the program. Among
women with less than a high school education, for example, the availability of WIC in the county
of birth increases average birth weight by approximately 7 grams, implying a treatment on the
treated effect of approximately 57 grams. Similar birth weight increases are observed in high
poverty counties. In contrast, estimated effects for more highly educated mothers and low
poverty counties are small and statistically insignificant. The shift in birth weights is larger at
the bottom of the birth weight distribution, where birth weight is more closely linked to other
long-run outcomes.
Although the United States has experienced many demographic changes since the
inception of the program, and the program itself has grown significantly, our results are an

22
important addition to current policy debates. We provide the most credible evidence to date that
there are measurable health benefits associated with the WIC program. Furthermore, given the
well documented correlations between infant health, family income, and later socioeconomic
status, the positive early life cycle impacts of WIC that we document may well persist into
adulthood.

23
References
Almond. Douglas, Kenneth Chay and Michael Greenstone (2006). “Civil Rights, the War on Poverty, and Black-White Convergence in Infant Mortality in Mississippi.” Almond, Douglas, Hilary Hoynes and Diane Whitmore Schanzenbach (2009) “Inside the War on Poverty: The Impact of the Food Stamp Program on Birth Outcomes” August 2009. Bailey, Martha (2009). “The Impact of U.S. Family Planning Programs: Evidence from the War on Poverty and Title X,” September 2009. Besharov, D.J. and D. Germanis (2001). “Rethinking WIC: An Evaluation of the Women, Infants, and Children program.” Washington, DC: AEI Press. Bitler, M.P., J. Currie, and J.K. Scholz (2003). “WIC Eligibility and Participation.” Journal of Human Resources, Vol. 38, 1139-1179. Bitler, P. and J. Currie (2005). “Does WIC Work? The Effects of WIC on Pregnancy and Birth Outcomes.” Journal of Policy Analysis and Management, Vol. 24, No. 1, 73-91. Black, Sandra, Paul Devereux and Kjell Salvanes (2007). “From the Cradle to the Labor Market: The Effect of Birth Weight on Adult Outcomes,” Quarterly Journal of Economics, March. Blank, Rebecca (2002). “Evaluating Welfare Reform in the United States” The Journal of Economic Literature, Vol. 40, No. 4, December 2002. Brien, M.J. and C.A. Swann (2001). “Prenatal WIC Participation and Infant Health: Selection and Maternal Fixed Effects,” Manuscript, SUNY-Stony Brook Department of Economics. Cascio, Elizabeth, Nora Gordon, Ethan Lewis and Sarah Reber (2010). “Paying for Progress: Conditional Grants and the Desegregation of Southern Schools.” Forthcoming, Quarterly Journal of Economics. Center for Budget and Policy Priorities (1989). “WIC Directory of Special Supplemental Food Programs for Women, Infants, and Children.” Center of Budget and Policy Priorities, Washington DC. Chatterji, P., K. Bonuck, S. Dhawan, and N. Deb (2002). “WIC Participation and the Initiation and Duration of Breastfeeding.” Institute for Research on Poverty Discussion Paper 1246-02. Children’s Foundation (1975). “Women and Children First or Last - Report on the Special Supplemental Food Program for Women Infants and Children,” Children’s Foundation, Washington DC. Children’s Foundation (1979). “Directory of Special Supplemental Food Programs for Women, Infants and Children.” Children’s Foundation, Washington DC.

24
Currie, Janet (2003). “U.S. Food and Nutrition Programs.” in Means-tested Transfer Programs in the U.S., Cambridge, MA, NBER. Currie, Janet and Rosemary Hyson. (1999). “Is the Impact of Health Shocks Cushioned by Socioeconomic Status? The Case of Birth Weight,” American Economic Review 89(2): 245-250.
Currie, Janet and Enrico Moretti (2008). “Did the Introduction of Food Stamps Affect Birth Outcomes in California?” in Making Americans Healthier: Social and Economic Policy as Health Policy, R. Schoeni, J. House, G. Kaplan, and H. Pollack, editors, Russell Sage Press. Devaney, B., L. Bilheimer and J. Schore (1990). “The Savings in Medicaid Costs for Newborns and the Mothers from Prenatal WIC Paricipation in the WIC Program.” Executive Summary and Vol 1. Alexanderia, VA: Food and Nutrition Service, U.S. Department of Agriculture. Figlio, David, Sarah Hamersma and Jeffrey Roth (2009). “Does Prenatal WIC Participation Improve Birth Outcomes? New Evidence From Florida” Journal of Public Economics 93 (2009) 235–245. Finkelstein, Amy and Robin McKnight (2008). “What Did Medicare Do (And Was It Worth It?)” Journal of Public Economics 92, July 2008, 1644-1668. Griliches, Zvi (1979). “Sibling Models and Data in Economics: Beginnings of a Survey.” Journal of Political Economy. Part 2, October 1979; 87(5):S37-64. Hoynes, Hilary W. and Diane Whitmore Schanzenbach (2009). “Consumption Responses to In-Kind Transfers: Evidence from the Introduction of the Food Stamp Program,” American Economic Journal: Applied Economics 1(4). Joyce, Ted, Diane Gibson and Silvie Colman (2005). “The Changing Association Between Prenatal Participation In WIC And Birth Outcomes In New York City” Journal of Policy Analysis and Management 24 (4), 661–685. Joyce, Ted, Andrew Racine and Cristina Yunzal-Butler (2008). “Reassessing The WIC Effect: Evidence From The Pregnancy Nutrition Surveillance System” Journal of Policy Analysis and Management 27 (2), 277–303. Kowaleski-Jones, Lori, and Greg Duncan (2002). “Effects of Participation in the WIC Program on Birth weight: Evidence from the National Longitudinal Survey of Youth.” American Journal of Public Health, 92(5), 799-804. Ludwig, Jens and Matthew Miller (2005). “Interpreting the WIC Debate” Journal of Policy Analysis and Management 24 (4), 691–701. Ludwig, Jens and Douglas L. Miller (2007). “Does Head Start Improve Children’s Life Chances? Evidence from a Regression Discontinuity Design.” Quarterly Journal of Economics. 122: 159-208.

25
Moffitt, Robert (1998). “The Effect of Welfare on Marriage and Fertility”, in Robert Moffitt ed, Welfare, the Family, and Reproductive Behavior, National Research Council. Moffitt, Robert (1992). “Incentive Effects of the US Welfare System” Journal of Economic Literature, Vol 30, pp. 1-61. Oliveira, Victor, Elizabeth Racine, Jennifer Olmsted, and Linda Ghelfi (2002). “The WIC Program: Background, Trends, and Issues.” USDA Economic Research Service, Food Assistance and Nutrition Research Report Number 27. Oliveira, Victor, and Elizabeth Frazao (2009). “The WIC Program: Background, Trends, and Economis Issues, 2009 Edition.” USDA Economic Research Service, Economic Research Report Number 73. April. Oreopoulos, Philip, Mark Stabile, Leslie Roos, and Randy Walld (2006). “Short, Medium, and Long-run Effects of Poor Infant Health: An Analysis Using Siblings and Twins,” NBER Working Paper #11998. Rush, David et al (1986). “Evaluation of the Special Supplemental Food Program for Women, Infants and Children, 5-Volumes.,” Report to USDA as part of National WIC Evaluation Study. Rush, David et al (1988). “Historical Study of Pregnancy Outcomes.” American Journal of Clinical Nutrition Volume 48, pp. 412-428. U.S. Bureau of Economic Analysis (2007). “Regional Economic Accounts,” http://www.bea.gov/bea/regional/reis/ U.S. Congress (1974). “Hearings Before the Selection Committee on Nutrition and Human Needs - Part 3 - Oversight: WIC program”, December 28, 1974. U.S. Congress (1976). “Hearings Before the Selection Committee on Nutrition and Human Needs – on WIC and Commodity Supplemental Food Programs”, March 30, 1976. U.S. Congress (1981). Better Health for Our Children: A National Strategy. The Report of the Select Panel for the Promotion of Child Health to the United States Congress and the Secretary of Health and Human Services. Volume II: Analysis and Recommendations for Selected Federal Programs. http://www.eric.ed.gov/ERICDocs/data/ericdocs2sql/content_storage_01/0000019b/80/39/86/87.pdf U.S. Department of Agriculture (1978). “Special Supplemental Food Program for Women, Infant, and Children: WIC Program Directory of Local Agencies.” Food and Nutrition Service, Supplemental Food Programs Division, Washington. U.S. Department of Agriculture (2001). “National Survey of WIC Participants: Final Report.” Food and Nutrition Service, Office of Analysis, Nutrition and Evaluation. Nutritional Assistance Program Report Series No. WIC-01-NSWP.

26
U.S. House of Representatives (1991). Background Material and Data On The Programs Within The Jurisdiction Of The Committee On Ways And Means, U.S. Government Printing Office: Washington DC. Ver Ploeg, M. and David Betson (2003). “Estimating Eligibility and Participation for the WIC Program: Final Report,” Report of the Panel to Evaluate the USDA’s Methodology for Estimating Eligibility for and Participation in the WIC Program, National Academies Press.

27
Data Appendix: WIC County Implementation
This paper uses data on the geographic rollout of WIC to identify the program’s impacts on birth outcomes. In particular, our regressions use a binary variable equaling one if the county has a WIC program in place in year t. The date of the initial implementation of WIC services in each county is not available from a single unified source. As such, we make use of several directories and congressional filings that each provide a list of local agencies that directly provided WIC services (hereafter “local agencies”) operating at a particular moment in time. We compile this information into a single database which indicates when WIC services were provided in each county.19 The following is a list of our primary data sources:
Source Contents
“Hearings Before the Select Committee on Nutrition and Human Needs - Part 3 - Oversight: WIC program”, December 28, 1974.
List of local agencies that had been approved for operation by the USDA as of December 1974.
“Women and Children First or Last - Report on the Special Supplemental Food Program for Women Infants and Children,” Children’s Foundation, 1975.
List of local agencies approved prior to April 1975, as well as a list of the additional agencies that were approved on April 1, 1975.
“Special Supplemental Food Program for Women, Infant, and Children: WIC Program Directory of Local Agencies,” USDA, Food and Nutrition Service, Supplemental Food Programs Division, Washington. 1978.
List of counties served by the WIC program as of March 1978 in the 13 states (Colorado, Illinois, Indiana, Iowa, Kansas, Michigan, Minnesota, Missouri, Nebraska, North Dakota, Ohio, Texas, and Wisconsin) that participated in the Migrant WIC program.
“Directory of Special Supplemental Food Programs for Women, Infants and Children,” Children’s Foundation, Washington DC, 1979.
List of local agencies operating in the United States in 1979.
“WIC Directory of Special Supplemental Food Programs for Women, Infants, and Children,” Center of Budget and Policy Priorities, Washington D.C, 1989
List of local agencies operating in the United States in 1989.
“Evaluation of the Special Supplemental Food Program for Women, Infants and Children, 5-Volumes.,” Report to USDA by Rush, D. et al. 1986.
Count of counties served by state and year from 1973 to 1981 for 25 states in the National WIC Evaluation. (Unfortunately, it does not list these counties.)
We assign county-level WIC implementation primarily using the first four sources in the
table above. Our first list of WIC agencies comes from a document generated as part of congressional hearings on food and nutrition programs (U.S. Congress 1974). This provides a list of 216 local agencies; we assign 1974 as the implementation year for these programs.20 Our second source is a report by the Children’s Foundation which provided a list of local agencies established prior to April 1975 as well as a list of 45 additional agencies that were approved by the USDA on April 1, 1975 (Children’s Foundation, 1975). We assign 1975 as the
19 We have had numerous conversations with WIC program administrators at the USDA. It appears that this information was not tracked by USDA. Thus, we relied on the congressional reports and WIC program directories described in the text to construct our measure. 20 The vast majority (at least 207) of these agencies were scheduled to open by or before April 1974, the date of the Committee report (U.S. Congress 1974, page 345).

28
implementation year for the (new) agencies that appear in this document. Our third source documents WIC agencies in 1978 in the thirteen states (Colorado, Illinois, Indiana, Iowa, Kansas, Michigan, Minnesota, Missouri, Nebraska, North Dakota, Ohio, Texas, and Wisconsin) that were included in the Migrant WIC Study (USDA 1978). We assign 1978 as the implementation date for the new WIC agencies that appear in this document. Finally, we use the WIC directory published by the Children’s Foundation in 1979 to identify new WIC agencies as of 1979 (Children’s Foundation 1979).21
Matching WIC Agencies to Counties
According to national regulations, “local WIC programs may be administered by any health, welfare, or private non-profit agency meeting the statutory requirements” (US Congress 1981). In practice the majority of early local agencies were health departments or clinics, but a number of welfare and community action programs administered WIC programs and subcontracted out the provision of health services (U.S. Congress 1981).
Local WIC agencies can be further subdivided by their geographical scope or mandate.
During the 1974 to 1979 period, the majority of local agencies served a designated county (e.g. The Jefferson County Health Department) or group of counties (e.g. Tri-County District Health Service: Morgan, Limestone and Lawrence Counties). Occasionally district or regional agencies were listed without an explicit list of member counties. Under these circumstances the county membership is assumed to be the same as the membership for said regional agency in the closest year for which we have membership information. (For example, the North Health District in Georgia was listed without member counties in 1974. Member counties were listed for this agency in 1975, so we use this 1975 list in our 1974 data.) In a handful of occasions, regional membership was not given in any of the directories. In this case, we attempt to establish historical membership using online sources.
Local agencies not specifically affiliated with a particular county or group of counties,
were often affiliated with a particular city (e.g. The Oakland Children’s Hospital) or with an independent welfare agency operating in some regional area (e.g. The Lewis & Clark Children & Youth Project, Helena). In these cases, state and city information was used to determine in which county the local agency was located.22 Such agencies were assumed to cover the county in which they were located. Local agencies affiliated with Native American tribes or military bases were assumed to cover the county which contained the appropriate reservation or base.
Main Sample In our empirical work, we limit our analysis to the set of counties that have a local WIC agency in place by 1979 and include 2,059 of the 3,100 counties. This sample accounts for more
21 There were many references to Children’s Foundation Directories for other years. Unfortunately, we were not able to locate these documents. 22 This was generally done by typing the city and state names and the word “county” into Google and scanning the resultant government, Wikipedia, or city-data.com listings. At times, this process was automated using a web scraping tool and the website http://www.townsusa.org.

29
than 86 percent of the U.S. population in 1970 (and 85% of births in 1970). We construct the sample in this way because our next source for WIC agencies is ten years later, in 1989. Other Details
We assume that once a WIC agency is open, it stays open for the rest of our sample period. Our sources sometimes indicate that an agency covers only part of the county; possibilities include serving a subset of the population (military, Native Americans, migrants) or some other unspecified partial coverage. Given that the number of counties indicating partial coverage is relatively small, we choose here to assign these counties to have a program in place.
We do not have any information on WIC agencies in 1976 or 1977. Hence we drop births
in the natality data in 1976 and 1977. In 1978, our source is limited to the 13 states participating in the WIC migrant study. If a county is in one of the 37 other states, and we have already observed a WIC agency from our earlier sources, we keep that county in the sample. However, for the remaining counties in the 37 states not included in the 1978 data, we set the WIC implementation variable to missing.
The table below summarizes our WIC implementation variable. In particular, we tabulate
the number of counties by WIC implementation status for the four years (1974, 1975, 1978, and 1979) when we observe WIC agencies:
Number of Counties by WIC Implementation Status23
Year No WIC
program in place
WIC program in place
Missing24 Never
observed by 1979
Total
1975 1690 349 0 1039 3078 1975 1491 578 0 1038 3077 1978 154 1038 847 1039 3078 1979 0 2059 0 1041 3100 For all counties in all years prior to 1974, we set the WIC policy variable to 0. For all counties in all years 1979 and later, we set the WIC policy variable to 1.
All coverage data was compared against secondary sources including the National WIC Evaluation (Rush et al 1986) and, where available, individual state filings. The National WIC Evaluation includes a tabulation of the number of counties served, by year and state, from 1973 to 1981 for the 25 states includes in the study.25 We compare county counts from these tables
23 The number of counties varies slightly from one year to the next because of missing data for either the Census or REIS data that is merged with our Natality sample. This occurs only for very small counties accounting for a very small number of births. The results are unaffected by their exclusion. Balancing the panel of counties also has no impact on the results. 24 As noted in the text, a county is missing in 1978 if it is not included in the 1978 data source and there is no WIC agency that appears in that county in either of the earlier years (1974, 1975). 25 The states in the Rush et al (1986) table include Arizona, Colorado, Connecticut, DC, Delaware, Florida, Georgia, Idaho, Illinois, Iowa, Kansas, Kentucky, Louisiana, Maine, Michigan, Mississippi, Missouri, New York, North Carolina, Oregon, Pennsylvania, Rhode Island, South Dakota, Utah and Washington.

30
with those from our dataset and find them to be generally consistent. Further, in extensions to our main models, we use a state-year identification strategy and compare results from our WIC policy variable to those constructed using the National WIC Evaluation study. We find very similar results for the two sets of policy variables, which give us additional confidence in our archival work.
31
Figure 1: Weighted Percent of Counties with WIC Programs, 1970-1981
0
20
40
60
80
100
1970 1972 1974 1976 1978 1980
Cou
nti
es w
ith
WIC
Sit
es (
wei
ghte
d %
)
Notes: As noted in the text, we do not have any data on WIC coverage for 1976 and 1977. In 1978, we observe data for some but not all states. The 1978 value is calculated for this subsample of counties. See text and data appendix for details.

32
Figure 2: WIC Implementation by County in 1974, 1975, 1978, and 1979
Notes: Black denotes a county with a WIC program, white denotes a county without a WIC program in place, and grey denotes a county with missing information. In 1978 we have more counties with missing information because our source for that year only covers a subset of states. See text and data appendix for details.

33
Figure 3 Effects of WIC Implementation on Distribution of Birth Weight, Percent Impacts (Coef/Mean)
-4.0%
-3.0%
-2.0%
-1.0%
0.0%
1.0%
2.0%
1,500 2,000 2,500 3,000 3,250 3,500 3,750 4,000
Mother's Educ<12
High Poverty County
Notes: The graph plots the coefficient on the WIC implementation dummy in a model where the dependent variable is the fraction of births in the county-year that is below each specified number of grams. The specification is given by column (2) in Tables 4 and 5.

34
Table 1 Mean Characteristics of Counties Included and Excluded in Sample
Included Counties Excluded Counties
1970 Census VariablesPopulation 242,707 79,753Percent Black 11.0 10.0
(10.8) (15.6)Percent Urban 78.2 59.5
(25.4) (28.3)Percent on Farm 2.6 6.0
(5.4) (7.6)Percent Under 5 8.6 8.4
(1.0) (1.1)Percent over 65 9.6 10.4
(2.9) (3.7)Percent of Persons Poor 9.9 11.3
(6.9) (8.2)
1970 County Per Capita Transfers (2000$)Family Assistance $116 $63
(100) (55)Medical Payments $300 $230
(170) (111)Retirement and Disability $742 $757
(203) (218)Per capita Income $18,563 $16,865
(4150) (4013)
1970 Birth OutcomesAverage Birthweight 3275 3294
(61) (76)Fraction Low Birthweight 0.079 0.076
(0.017) (0.020)
Number of Counties 2,059 1,041Fraction of the population (1970) 0.86 0.14Fraction of births (1970) 0.85 0.15
35
Table 2: Determinants of County WIC Start Date
1974 1975 19781970 Census VariablesPercent Black 0.001 -0.002 0.001
(0.002) (0.003) (0.002)
Percent Urban 0.000 0.004*** 0.000(0.002) (0.001) (0.001)
Percent on Farm 0.008 0.011** 0.002(0.005) (0.004) (0.004)
Percent Under 5 0.003 -0.012 -0.021(0.015) (0.013) (0.018)
Percent over 65 -0.016 -0.024** -0.010(0.010) (0.010) (0.009)
Percent of Persons Poor 0.014** 0.008* 0.006***(0.007) (0.004) (0.002)
Log(Population) 0.160*** 0.098*** 0.038**(0.035) (0.023) (0.014)
1970 County Per Capita Transfers (2000$)Family Assistance -0.126 0.955 0.009
(0.654) (0.503) (0.145)Medical Payments -0.064 -0.231 -0.116
(0.343) (0.261) (0.073)Retirement and Disability 0.135 0.245** 0.091
(0.087) (0.100) (0.062)Per capita Income 0.004 0.006 0.003
(0.008) (0.006) (0.002)1970 Birth OutcomesAverage Birthweight 0.000 -0.001 0.000
(0.001) (0.001) (0.000)
Fraction Low Birthweight 2.583 -0.250 0.871
(2.153) (1.357) (0.752)
State Fixed Effects X X X
Number of Observations 1,911 1,950 1,123R squared 0.42 0.47 0.20
Probability that County has adopted WIC in

36
Table 3: Impacts of WIC Introduction on Birth Outcomes, Full Sample
WIC Implementation 2.7** 2.3* 0.0000 0.0001(1.22) (1.21) (0.0004) (0.0004)
Observations 18517 18517 18517 18517R-squared 0.91 0.92 0.77 0.78Mean of dependent variable 3316 3316 0.072 0.072Coeff / Mean 0.1% 0.1% -0.1% 0.0%
Controls1970 County Char * Time X X X XREIS transfers, Per capita income X X X XYear fixed effects X X X XCounty fixed effects X X X XState * year fixed effects X X
Average Birth Weight (in grams)
Share Low Birth Weight (<2,500 grams)
Notes: Each parameter is from a separate regression of the outcome variable on the WIC implementation dummy. The sample includes county-year means for years 1972-1975 and 1978-1982 where cells with less than 25 births are dropped. Data for 1976 and 1977, and for many states in 1978, are missing due to incomplete WIC data. In addition to the fixed effects, controls include 1970 county variables (log of population, percent of population black, poor, urban, on farm, age<5, age>65) each interacted with a linear time trend, per capita county transfer income (cash assistance, medical care, and retirement and disability benefits), and county real per capita income. Estimates are weighted using the number of births in the cell and are clustered on county. Standard errors are in parentheses.

37
Table 4: Impacts of WIC Introduction on Birth Outcomes, by Maternal Education
Average Birth Weight (in grams)
Share Low Birth Weight (<2,500 grams)
Less Than High SchoolWIC Implementation 7.0*** -0.0014
(2.50) (0.0010)Coeff / Mean 0.2% -1.4%Observations 14,831 14,831Mean of dependent variable 3205 0.102
High SchoolWIC Implementation 1.6 -0.0003
(1.75) (0.0007)Coeff / Mean 0.0% -0.4%Observations 16,022 16,022Mean of dependent variable 3329 0.069
More than High SchoolWIC Implementation 0.0 0.0005
(2.00) (0.0008)Coeff / Mean 0.0% 1.0%Observations 13,773 13,773Mean of dependent variable 3388 0.054
Controls1970 County Char * Time X XREIS transfers, Per capita income X XYear fixed effects X XCounty fixed effects X XState * year fixed effects X X
Notes: Each parameter is from a separate regression of the outcome variable on the WIC implementation dummy. The sample includes county-year means for years 1972-1975 and 1978-1982 where cells with less than 25 births are dropped. Data for 1976 and 1977, and for many states in 1978, are missing due to incomplete WIC data. In addition to the fixed effects, controls include 1970 county variables (log of population, percent of population black, poor, urban, on farm, age<5, age>65) each interacted with a linear time trend, per capita county transfer income (cash assistance, medical care, and retirement and disability benefits), and county real per capita income. Estimates are weighted using the number of births in the cell and are clustered on county. Standard errors are in parentheses.

38
Table 5: Impacts of WIC Introduction on Birth Outcomes, by Quartiles of 1970 County Poverty
Average Birth Weight (in grams)
Share Low Birth Weight
(<2,500 grams)
Highest Poverty QuartileWIC Implementation 7.1 -0.0005
(2.35)*** (0.0010)Coeff / Mean 0.2% -0.6%Observations 10,464 10,464Mean of dependent variable 3286 0.080
Lowest Poverty QuartileWIC Implementation -0.2 0.0011
(2.87) (0.00089)Coeff / Mean 0.0% 1.7%Observations 1,632 1,632Mean of dependent variable 3348 0.064
Controls1970 County Char * Time X X
REIS transfers, Per capita income X X
Year fixed effects X X
County fixed effects X X
State * year fixed effects X X
Notes: Each parameter is from a separate regression of the outcome variable on the WIC implementation dummy. The sample includes county-year means for years 1972-1975 and 1978-1982 where cells with less than 25 births are dropped. Data for 1976 and 1977, and for many states in 1978, are missing due to incomplete WIC data. In addition to the fixed effects, controls include 1970 county variables (log of population, percent of population black, poor, urban, on farm, age<5, age>65) each interacted with a linear time trend, per capita county transfer income (cash assistance, medical care, and retirement and disability benefits), and county real per capita income. Estimates are weighted using the number of births in the cell and are clustered on county. Standard errors are in parentheses. Quartiles are assigned using 1970 county poverty rates (weighted using county population).

39
Table 6: Impact of WIC Introduction on Fertility and Maternal Characteristics
All Highest quartile poverty Educ<12 Educ=12 Educ>12
Educ Missing
White BlackRace
Missing
WIC Implementation -0.3 0.5 -0.001 0.006 -0.005 0.003 0.001 -0.001 0.001(0.21) (0.44) (0.002) (0.003)** (0.002)** (0.003) (0.001) (0.001) (0.001)
Observations 18517 10464 16,247 16,247 16,247 18,549 18,502 18,502 18,549R-squared 0.91 0.90 0.93 0.76 0.85 0.99 0.99 0.99 0.97Mean of dep var 71.41 80.87 0.26 0.44 0.30 0.27 0.84 0.16 0.03
Controls1970 County Char * Time X X X X X X X X XREIS transfers, Per capita income X X X X X X X X XYear fixed effects X X X X X X X X XCounty fixed effects X X X X X X X X XState * year fixed effects X X X X X X X X X
Characteristics of Mother's in Natality SampleFertility (Births per 1000 women 15-44)
Notes: Each parameter is from a separate regression of the outcome variable on the WIC implementation dummy. The sample includes county-year means for years 1972-1975 and 1978-1982 where cells with less than 25 births are dropped. Data for 1976 and 1977, and for many states in 1978, are missing due to incomplete WIC data. In addition to the fixed effects, controls include 1970 county variables (log of population, percent of population black, poor, urban, on farm, age<5, age>65) each interacted with a linear time trend, per capita county transfer income (cash assistance, medical care, and retirement and disability benefits), and county real per capita income. Estimates are weighted using the number of births in the cell and are clustered on county. Standard errors are in parentheses. Quartiles are assigned using 1970 county poverty rates (weighted using county population). The shares by education group and race are means among the sample of nonmissing observations.
40
Table 7: Impact of WIC Introduction on Birth Outcomes using State-Year Policy Variable
Average Birth Weight
(in grams)
Share Low Birth Weight
(<2,500 grams)
Average Birth Weight
(in grams)
Share Low Birth Weight
(<2,500 grams)
WIC Policy Variable from Rush et al (1986) WIC 3.3 -0.0007 1.7 0.0007
(3.7) (0.0009) (3.5) (0.0009)Observations 167 167 225 225Dep Mean 3328 0.070 3320 0.070
This Study's WIC Policy Variable (unweighted fraction of counties) WIC 2.6 -0.0007 4.5 -0.0003
(4.3) (0.0014) (4.5) (0.0009)Observations 167 167 783 783Dep Mean 3328 0.070 3334 0.070
This Study's WIC Policy Variable (weighted fraction of counties) WIC 1.0 0.0000 1.8 -0.0002
(4.1) (0.0014) (4.5) (0.0008)Observations 167 167 783 783Dep Mean 3328 0.070 3334 0.070
ControlsREIS transfers, Per cap inc X X X XYear fixed effects X X X XState fixed effects X X X XState * linear year X X X X
All Available ObservationsCommon Sample
Notes: Each parameter is from a separate regression of the outcome variable on the WIC implementation dummy in a state-year research design. The treatment variable is the fraction of counties in a state-year observation that have WIC programs in place. The first panel, using policy variable defined from Rush et al (1986), includes data for 25 states over the years 1973-1981. The second and third panels include our sample (described above 1972-1975 and 1978-1982) collapsed to the state-year level. We construct the state treatment both unweighted (to match Rush et al) and weighted by the 1970 county population. The “common sample” provides estimates for the sample of state-years that are common to both samples. Estimates are weighted using the number of births in the cell and are clustered on state. Standard errors are in parentheses.