Embed Size (px)
Citation preview

ILRI Livestock projects - FA 1
Hikuepi (Epi) Katjiuongua
Global Agenda of Action. The Agenda, Focus Area 1 Meeting: 19-20 Sept. 2013. Rome, Italy

ILRI
700 staff
130 scientists and
researchers
30+ scientific disciplines
70% research in SSA
Two large campuses
(Kenya, Ethiopia).
Budget: USD 60 million
ILRI works with a range of
partners.
offices: Kampala, Uganda;
Harare, Zimbabwe
ILRI •a member of the CGIAR Consortium which conducts food and environmental research
to help alleviate poverty and increase food security, while protecting the natural resource base.
Mali
Nigeria
Mozambique
Kenya
Ethiopia
India
Sri
Lanka
China
Laos
Vietnam
Thailand
ILRI vision A world made better for poor people in developing countries by
improving agricultural systems in which livestock are important. 2

Outline
1. Institutional approach – Value chain approach
2. Focus: smallholder production systems
3. Research programs/projects – FA1
1. Michael Blummel: Detailed project presentation
3

Traditional approach: piecemeal
Value chain approach
Inputs & Services Production Processing Marketing Consumers
Inputs & Services Production Processing Marketing Consumers
...in Country A
Inputs & Services Production Processing Marketing Consumers
Inputs & Services Production Processing Marketing Consumers
...in Country D
...in Country C
...in Country B
4

Value chain approach
A value chain is the set of actors, transactions, information flows, and institutions that enable value to be delivered to the customer (Baker, 2007)
5

• Address the whole value chain
Value chain analysis approach
Strategic livestock and fish Cross-cutting Platforms
• Technology Generation
• Market Innovation
• Targeting & Impact
Inputs & Services Production Trader/distributor Processing Marketing Consumers
Value chain development team + research partners
GLOBAL RESEARCH PUBLIC
GOODS
INTERVENTIONS TO SCALE
OUT REGIONALLY
Major intervention with development partners
6
Po
licy
Source: Adapted from Tom Randolph (2012)

Example: smallholder dairy project
Small holder dairy project: Kenya (smallholderdairy.org) • Collaborative research and development project (1997-2004): funded by DFID • Partnerships: ILRI, Government, KARI ; key objective: increase efficiency 1. Initial focus: increasing productivity at farm level
– better feeding strategies – access for forage
2. Marketing : key constraint was at the marketing level
- Highly concentrated: little competition & interest (dairy board) to limit no. of players - Small holder farmers kept out market: licensing - Key issue: raw milk perceived as risky; small traders of raw milk kept out key markets
- Research by ILRI: showed that risk levels were exaggerated 3. Policy engagement
- Information dissemination - Engagement of civil society, government and advocacy group - Policy briefs, strategies and dialogue
Impact
• Policy change: market liberalization • Training and certification: milk testing, quality control and maintenance • Increase in quantity of milk supplied 7

Smallholder production systems
• Size and nature of transaction costs in the value chain influence efficiency
• Key constraints to efficiency improvement include access to capital and inputs
• Value chain analysis: allows for a system approach and looks at efficiency holistically
• Moving beyond pictures & maps: quantifying VC performance
Value chain approach
8

Livestock and fish CGIAR Research program Coverage Uganda (pig), Ethiopia (sheep & goats), Tanzania (dairy), Vietnam (pig), India (dairy), Nicaragua (dairy), Mali (sheep and goats) and Egypt (fish)
Data & results - Uganda pig: VCA & implementing detailed benchmarking survey
- Tanzania dairy: value chain analysis and baseline data - Ethiopia: VCA & implementing detailed benchmarking survey
Efficiency and FA1 link
- Assess productivity, feed, animal health and economic efficiency
- Data covers most of the indicators discussed by FA1
- Technological interventions: feed, animal disease, breed/genetics levels, and marketing innovations
- Need: tools to assess environmental chain performance
ILRI Livestock projects – FA1
9

Smallholder livestock competitiveness project- Botswana - Identify factors affecting productivity
- Assess competitiveness including technical, cost and economic efficiency
Coverage & livestock commodity
- Botswana (potentially Namibia in the future)
- Cattle and small stock (goats and sheep)
Data and results
- Value chain analysis assessment
- Detailed producer level household farm level data: July –Aug. 2013
- Results on efficiency available early next year
Efficiency and FA1 link
- Assess productivity, feed and economic efficiency
- Data covers most of the indicators covered by FA1
- Need: tools to assess environmental chain performance
ILRI Livestock projects – FA1
10

Livestock systems and the environment
- Analyze interactions among livestock and plant systems and the environment (at global and local scale).
Approach
- Combines empirical and modeling approaches
- Econometric methods to estimate livestock feed-yield relationship
- Models: GLOBIUM (PE model) and ruminants model (diet)
Data and results
- Source: FAO-stats country level animal stocks and commodity: used minimum herd dynamics and animal nutrition modeling techniques to disaggregate data
Efficiency and FA1 link
- Models impacts of change in diet on yield, manure, GHG emissions, land use change, soil fertility
ILRI Livestock projects – FA1
11
Thank you
12

Technical level: Animal feed Production - Test eco-efficient technologies: (e.g. forage into mixed systems) - Reduction in level of land degradation Utilization level – feed resource conversion - Test different technologies: chopping, fortification and densification - Measure intake differences - Quantify conversion efficiency at animal level - Quantify changes in yield levels - Maintenance energy – convert to no. of days that feed can support the animal
Examples: East African Dairy Development - Efficiency from chopping crop residues; calves status diet - Dry season feed supplementation in pastoral systems (Uganda) - Intergrading forages into mixed systems (Rwanda, Uganda & Kenya) - Feed gap at site level: estimate target/optimum requirement at site level accounting for seasonality Lessons - When farmers see the benefits, they adopt selective feeding strategies – potential entry point to
reduce animal numbers in the long term - Make technologies user-friendly: should be less demanding in knowledge requirement - Extensive system more challenging then intensive systems: costs and land tenure systems
Efficiency methods and approaches
13

Approach: Solution-driven R4D to achieve impact
#3: Focus on 9 target value chains

International Livestock Research
Institute (ILRI)
Livestock and Fish Program
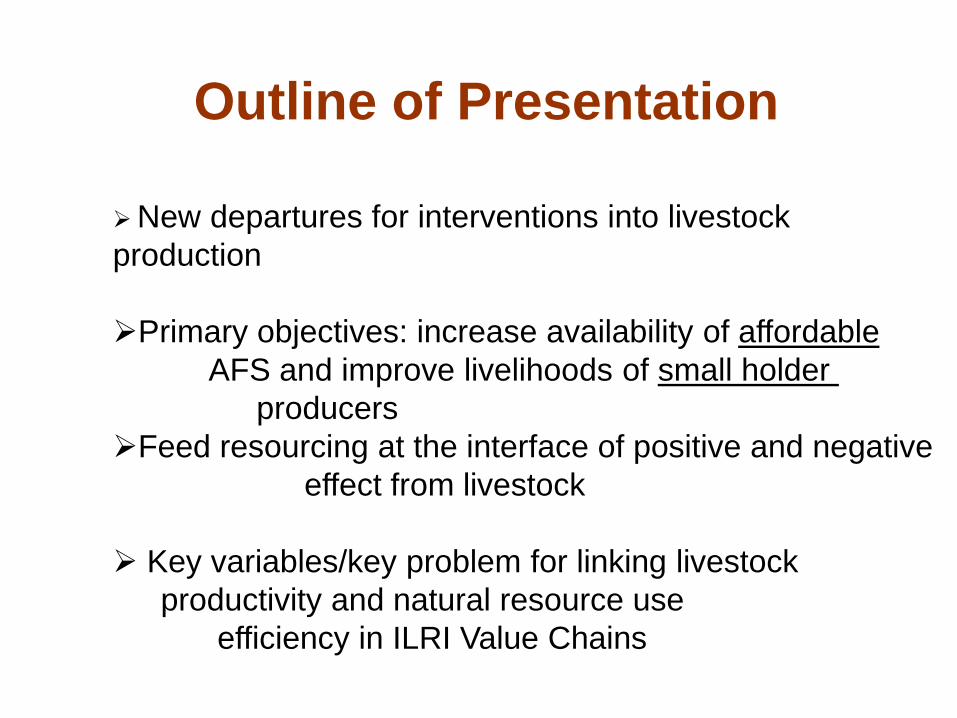
Outline of Presentation
New departures for interventions into livestock
production
Primary objectives: increase availability of affordable
AFS and improve livelihoods of small holder
producers
Feed resourcing at the interface of positive and negative
effect from livestock
Key variables/key problem for linking livestock
productivity and natural resource use
efficiency in ILRI Value Chains

Technology
development:
1 Health
2 Genetics
3 Feeds
Inputs & Services Production Processing Marketing Consumers
Commodity X in Country Y
4 Value chain development
5 Targeting: Foresight, prioritization, environmental
impacts
6 Cross-cutting: gender, impact, M&E, comms, capacity
building
Structure: Six integrated components
Delivering the Livestock and Fish Program

Water: where does it go?
Herrero et al. (2012) 0
2
4
6
8
10
12
10 15 20 25 30 35
Temperature (oC)
Wate
r in
dake (
kg
/kg
DM
feed
/day)

Water for milk and fodder
Gujerat 3 400 l of water per kg of milk
10 000 l of water for fodder/animal/day
Gobal 900 l of water per kg of milk
Source: Singh, Sharma, Singh, Shah (2004)

Predicting water requirement
for milk production by feed-
H20 estimates ?
20
S. Gujarat W. Gujarat N. Gujarat
Liters of H20 per MJ ME
Alfalfa 32.3 45.8 126.8
Green maize 43.5 21.7 131.5
Wheat straw 17.4 8.6 52.4
Millet stover 20.9 18.1 61.5
Rice straw 29.0
Groundnut haulm 8.8
Mean H2O / liter of milk 2 557 1 810 3 775
Blummel et al., 2009 calculated from data of Singh et al., 2004

21
Feed allocation, methane production
and natural resource utilization
India: Livestock and milk in 2005-06
Milch animals Total animals Milk yield
x 103 kg/d
Cross Bred 8 216 28 391 6.44
Local 28 370 155 805 1.97
Buffalo 33 137 101 253 4.40
Overall herd mean 3.61 l/d

22
Feed energy needs of milch animals in dependence of average daily milk yields
ME required (MJ x 109)
Milk (kg/d) Maintenance Production Total
3.61 (05/06) 1247.6 573.9 1821.5
6 (Scenario 1) 749.9 573.9 1323.8
9 (Scenario 2) 499.9 573.9 1073.8
12 (Scenario 3) 374.9 573.9 948.8
15 (Scenario 4) 299.9 573.9 873.9

Assume: Farmer A: 5 cattle each giving 2 liter milk day Farmer B: 1 cattle giving 10 liters milk per day Which farmer needs more feed and why?
It seems obvious but….

24
Effect of increasing average daily milk yields on
overall methane emissions from dairy in India
0 3 6 9 12 150.0
0.5
1.0
1.5
2.0
2.5
Daily milk yield per animal (liter)
Meth
an
e p
rod
uced
(T
g)
current herd average milk yield of 3.61 l/d
Blummel et al 2009

(2005-06) 2020 2020 (fixed LP
Milk (million tons) 91.8 172 172
yield/day (kg) 3.6 5.24 6.76
Numbers (000) 69759 89920 * 69759
Metabolizable energy requirements (MJ x 109)
Maintenance 1247.64 1608.22 1247.6
Production 573.94 1075.00 1075.00
total 1821.58 2683.22 2326.66
Feed Req.( m tons) 247.50 364.57 315.6
25
* Calculated based on Component Annual Growth Rate (CAGR)
Livestock revolution: Impact on energy and feed requirements

BAIF success with cross bred cow performance in rural WM
1997-2001
Land use Milk (kg/d)
Irrigated areas 8.5
Non-irrigated areas 7.7
Data from Ghokale et al 2007 calculated for 365 day lactations

27
Feed block manufacturing: supplementation, densification
Ingredients %
Sorghum stover 50
Bran/husks/hulls 18
Oilcakes 18
Molasses 8
Grains 4
Minerals, vitamins, urea 2
Courtesy: Miracle Fodder and Feeds PVT LTD

28
Comparisons of premium and low cost sorghum stover based complete feed blocks in dairy buffalo
Block Premium Block Low Cost
CP 17.2 % 17.1%
ME (MJ/kg) 8.46 MJ/kg 7.37 MJ/kg
DMI 19.7 kg/d 18.0 kg/d
DMI per kg LW 3.6 % 3.3 %
Milk Potential 16.6 kg/d 11.8 kg/d
Anandan et al. (2009a)
29
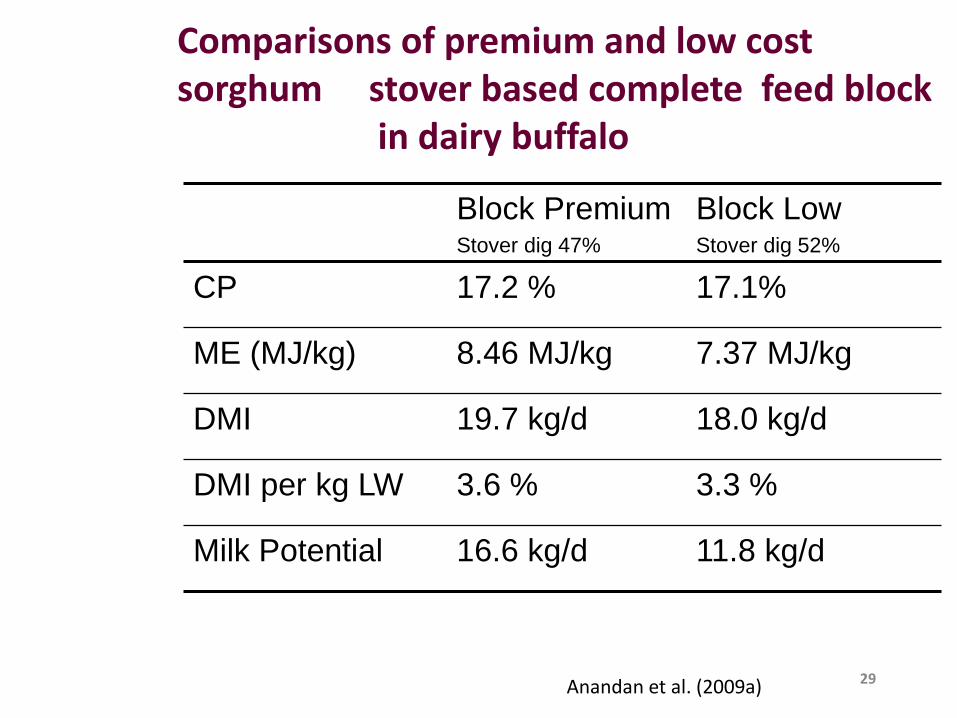
Comparisons of premium and low cost sorghum stover based complete feed block in dairy buffalo
Block Premium Stover dig 47%
Block Low Stover dig 52%
CP 17.2 % 17.1%
ME (MJ/kg) 8.46 MJ/kg 7.37 MJ/kg
DMI 19.7 kg/d 18.0 kg/d
DMI per kg LW 3.6 % 3.3 %
Milk Potential 16.6 kg/d 11.8 kg/d
Anandan et al. (2009a)

30
Key problems
Opportunistic management for example considerable variations in quantity and quality of feed from day to day and season to season (investment priority?) Frequent drastic disagreements between estimations of feed quantity and quality as obtained from farmers questionnaires and surveys and triangulation results based on number of animals and their productivity

31
Thank you for your attention!

Inputs & Services Production Processing Marketing Consumers
Past research has focused specific aspects
of given value chains, commodities and country.
Inputs & Services Production Processing Marketing Consumers
...in Country A
Inputs & Services Production Processing Marketing Consumers
Inputs & Services Production Processing Marketing Consumers
...in Country D
...in Country C
...in Country B
Traditional approach to increasing livestock productivity was
piecemeal

A value chain approach: a set of actors, transactions, information flows, and
institutions that enable value to be delivered to the customer (Baker 2007)

Strategic CRP 3.7 Cross-cutting Platforms
• Technology Generation
• Market Innovation
• Targeting & Impact
Inputs & Services Production Processing Marketing Consumers
R4D integrated to transform selected value chains
In targeted commodities and countries.
Value chain development team + research partners
GLOBAL RESEARCH
PUBLIC GOODS
INTERVENTIONS TO
SCALE OUT REGIONALLY
#1: Addressing the whole value chain
Major intervention with development partners
Approach: Solution-driven R4D to achieve impact