Embed Size (px)
Citation preview

Highly Porous Ti4O7 Reactive Electrochemical Water FiltrationMembranes Fabricated via Electrospinning/Electrospraying
Melissa C. Santos and Yossef A. ElabdDept. of Chemical Engineering, Texas A&M University, College Station, TX 77843
Yin Jing and Brian P. ChaplinDept. of Chemical Engineering, University of Illinois at Chicago, IL 60607
Lei FangDept. of Chemical Engineering, University of Illinois at Chicago, IL 60607
College of Civil Engineering and Architecture, Zhejiang University, Hangzhou 310058, P.R. China
DOI 10.1002/aic.15093Published online November 24, 2015 in Wiley Online Library (wileyonlinelibrary.com)
Porous, flexible, reactive electrochemical membranes (REMs) for water purification were synthesized by a novel simulta-neous electrospinning/electrospraying (E/E) technique, which produced a network of poly(sulfone) fibers and Ti4O7 par-ticles as evidenced by scanning electron microscopy. Cyclic voltammetry indicated that the kinetics for waterelectrolysis reactions and the Fe(CN)6
42/32 redox couple were enhanced by Ti4O7 deposition using the E/E technique.Membrane filtration experiments using phenol as a model contaminant showed a 2.6-fold enhancement in the observedfirst-order rate constant for phenol oxidation (kobs,phenol) in filtration mode relative to cross-flow operation. Phenol oxi-dation in filtration mode was approaching the pore diffusion mass transfer limit, and was 6 to 8 times higher than meas-ured in a previous study that utilized a ceramic Ti4O7 REM operated in filtration mode and is comparable to rateconstants obtained with carbon nanotube flow-through reactors, which are among the highest reported in the literatureto date. VC 2015 American Institute of Chemical Engineers AIChE J, 62: 508–524, 2016
Keywords: electrochemistry, environmental engineering, membrane materials, separation techniques
Introduction
Effective water treatment technologies need to treat a broad
range of water contaminants, which typically is accomplished
using multiple technologies in a treatment train. To reduce the
cost and complexity of water treatment, research has focused
on the development of novel technologies that can incorporate
multiple treatment methods into a single technology. Recent
work has focused on the integration of membrane filtration
with electrochemical advanced oxidation processes to create a
hybrid technology known as reactive electrochemical mem-
branes (REMs).1,2 This novel REM technology utilizes a
ceramic porous substoichiometric TinO2n-1 (4< n< 6) mate-
rial (known as Magn�eli phases) that can serve as both a mem-
brane for filtration and a reactive electrode surface that can
oxidize contaminants by a combination of hydroxyl radical
(OH•) production from water oxidation and direct electron
transfer reactions.1,2
The REMs are synthesized by the conversion of noncon-
ductive TiO2 precursors to conductive Magn�eli phases, where
Ti4O7 is the most electrically conductive phase. Due to their
stability under anodic polarization and resistant to oxidation
and corrosion,3–6 conductive Ti4O7 electrodes have been
utilized for the cathodic protection of metal structures3
and electrodes for a variety of applications, including lead-
acid batteries,7,8 rechargeable zinc-air batteries,5,6 and fuel
cells.4,9–11
While only few studies have reported on the use of Ti4O7
for water purification,1,2,12–17 Zaky and Chaplin1,2 have
expanded the use of Ti4O7 for water treatment by utilizing it
as a REM to study the removal of a series of p-substituted phe-
nolic compounds that were used as model organic contami-
nants. In their studies, they demonstrated that the REM was
active for both direct anodic oxidation and generation of OH•
that resulted in efficient removal of phenolic compounds.1,2
Although the porous rigid cylindrical REM used in these stud-
ies was effective, it had a limited morphology (e.g., limited
porosity, geometry, flexibility) for filtration experiments. To
expand the potential applications of REMs for water treat-
ment, it is desirable to develop flexible REMs with tailored
porosities that will facilitate the development of new hybrid
membranes for use in compact filtration systems (e.g., spiral
wound membrane modules and point-of-use devices).Toward this goal, a simultaneous electrospinning and elec-
trospraying method was pursued to develop Ti4O7 REMs that
are highly porous, flexible, durable, and inexpensive. Simulta-
neous electrospinning and electrospraying is a recent method
that can fabricate highly porous membranes by electrospinning
Correspondence concerning this article should be addressed to B. P. Chaplin [email protected] or Y. A. Elabd at [email protected].
VC 2015 American Institute of Chemical Engineers
508 AIChE JournalFebruary 2016 Vol. 62, No. 2

organic polymer nanofibers and electrospraying inorganicnanoparticles in tandem from two separate needles (see Figure1). The resulting membranes produced from this method resultin a network of nanofibers and nanoparticles with intimatecontact between both materials throughout the porous matrix,where changing the various electrospinning and electrospray-ing parameters and solution properties allows for membraneswith various porosities, fiber sizes, and particle sizes.Membranes fabricated from the electrospinning/electrospray-ing (E/E) method have recently been explored in a variety ofapplications, including batteries,19 tissue engineering,20–25
fuel cells,18,26 composites,27–29 and water purification.28,30–32
To date, few studies have explored the E/E method to developmembranes for water purification and to our knowledge stud-ies have not been conducted that have utilized the E/E methodto develop REMs.
In this study, the simultaneous E/E method was employed
to fabricate highly porous REMs consisting of poly(sulfone)
(PSU) fibers and Ti4O7 particles using the two needle system
shown in Figure 1. PSU is a commonly used polymer in filtra-
tion membranes32–35 and Ti4O7 has previously been used for
REMs due to its high conductivity and corrosion resistant
properties.3,5,6 Characterization of the E/E REMs was per-
formed using x-ray diffraction (XRD), scanning electron
microscopy (SEM), and Hg porosimetry analysis. The electro-
chemical properties and water filtration performance of these
E/E REMs were evaluated using electrical impedance spec-
troscopy (EIS), cyclic voltammetry (CV), and cross-flow filtra-
tion experiments.
Experimental
Materials
TiO2 (99.9%, 32 nm particles) nanopowder was purchased
from Alfa Aesar. Ethanol (EtOH) (�99.997%, anhydrous),-
PSU (average Mn � 22,000 g/mol, beads), and dichlorome-
thane (DCM) (�99.8%, anhydrous) were purchased from
Sigma Aldrich. High purity H2 gas was purchased from Airgas
and was used for Ti4O7 powder synthesis. Carbon cloth gas
diffusion layers (GDL; ELAT LT 1400W and ELAT H) were
purchased from Fuel Cells Etc. and were used as received for
membrane fabrication. All other chemicals were reagent-grade
and obtained from Sigma-Aldrich or Fisher and were used as
received. All solutions used in this study were made using
deionized water obtained from a NANOPure water purifica-
tion system (Barnstead) with resistivity greater than 18
MX�cm (258C).
Ti4O7 synthesis and structural characterization
Ti4O7 powder was prepared by reducing TiO2 nanopowder
in H2 gas at 9508C in a tube furnace (Mode F21135, Barnstead
Thermolyne) for 4 h.6 The chemical reaction for the produc-
tion of Ti4O7 is given3
4TiO21H2 ! Ti4O71H2O (1)
XRD (Bruker-D8 Advanced, Bragg Bentano) powder
experiments were performed to quantify and characterize the
Ti4O7 Magn�eli phase. XRD patterns were collected from 158
to 708 2h with a scan rate of 0.38/s. SEM (FEI Quanta 600 FE-
SEM) was used to characterize the morphology of the Ti4O7
powder. Samples were sputter coated (Cressington 208 HR)
with platinum at 40 mV to achieve a 6 nm layer thickness
before SEM images were collected. SEM images of the Ti4O7
powder were collected at 10 kV.
Simultaneous E/E system
A schematic of the simultaneous E/E apparatus used is
shown in Figure 1.18 The apparatus consists of two high-
voltage sources (Model PS/EL50R00.8, Glassman High Volt-
age and Model ES40P-10W/DAM, Gamma High Voltage
Research), two syringe pumps (Model NE-1000, New Era
Pump Systems), tubing (EW-30600-65, Cole Parmer and Pt.
No. 86510, Hamilton), luer lock needle adaptors (Pt. No.
86511, Hamilton), two syringe needles (i.d. 5 0.061 cm, Pt.
No. 90520, Hamilton), two syringes (CG-3070-03, Chemglass
Life Sciences), and a grounded collector consisting of an alu-
minum foil covered cylindrical drum connected to a motor
(Model 4IK25GN-SW2, Oriental Motor). The motor allows
for drum (o.d. 5 4.85 cm) rotation during E/E experiments and
was set at 100 rpm. GDLs were cut into 5 cm 3 5 cm pieces,
Figure 1. Schematic of simultaneous electrospinning/electrospraying (E/E) apparatus.18
[Color figure can be viewed in the online issue, which is available at wileyonlinelibrary.com.]
AIChE Journal February 2016 Vol. 62, No. 2 Published on behalf of the AIChE DOI 10.1002/aic 509
and four GDL pieces were adhered onto the drum for each E/Eexperiment. E/E experiments consisted of simultaneously elec-trospinning a PSU/DCM solution and electrospraying a Ti4O7/EtOH solution. For the electrospinning process, the needle tipto collector distance, applied voltage, and solution flow rateswere 12 cm, 12 kV, and 0.9 mL/h, respectively. For the elec-trospraying process, the needle tip to collector distance,applied voltage, and solution flow rates were 9 cm, 15 kV, and3 mL/h, respectively.
Membrane fabrication
PSU solutions for electrospinning were prepared by dissolv-ing 1 g of PSU in 10 g of DCM to produce a 9.1 wt % PSU/DCM solution. The polymer solutions were mixed for 24 h toensure homogeneity. The Ti4O7 solutions for electrosprayingwere prepared by dissolving 0.25 g of Ti4O7 powder in 9.75 gof EtOH to produce a 2.5 wt % Ti4O7/EtOH solution. TheTi4O7 solution was then sonicated for 15 min (Model Cl-18,QSonica Sonicator). The Ti4O7 and PSU solutions were usedfor E/E experiments. E/E experiments were conducted overthe course of 6 h using either the ELAT LT1400W or theELAT H GDLs as a substrate collector on the drum. ELATLT1400W and ELAT H are woven carbon cloth membranes.The ELAT LT 1400W GDL has a thickness of 454 lm, 63%porosity, is poly(tetrafluoroethylene) (PTFE) treated and has amicroporous carbon layer covering the woven carbon cloth.The ELAT H GDL has a thickness of 406 lm, 80% porosity,is not PTFE treated, and does not have a microporous carbonlayer covering the woven carbon cloth. The ELAT LT 1400Wand ELAT H GDLs were used because they provided struc-tural support for the E/E and solution cast PSU/Ti4O7 mem-branes, and were durable, flexible, and highly conductive. Inthis study, the ELAT LT 1400W and ELAT H GDLs will bereferred to as ELAT 1 and ELAT 2, respectively. E/E experi-ments were also conducted over the course of 2 days using theELAT H GDL (ELAT 2) to compare to the shorter 6 h deposi-tion E/E membranes. Several of the E/E membranes wereannealed at 200�C for 2 h to investigate the impact of anneal-ing. The resulting filtration membranes consisted of GDLcoated with a layer of electrospun PSU nanofibers and electro-sprayed Ti4O7 particles. These materials will be referred to asE/E membranes.
As a comparative control sample, PSU/Ti4O7 solutionswere cast onto GDLs. The PSU/Ti4O7 solution used to createthese solution cast membranes were prepared by dissolving
1 g of PSU in 10 g of DCM for 24 h to produce a 9.1 wt %PSU/DCM solution. The solution was mixed for 24 h to ensure
homogeneity. Then 0.25 g of Ti4O7 was added to the solution
and mixed for 24 h to ensure complete mixing. This solutionconcentration resulted in solution cast membranes with the
same amount of Ti4O7 as the E/E membranes. This solutionwas then cast onto 5 cm 3 5 cm pieces of both the ELAT 1
and ELAT 2 GDLs. The solution cast membranes wereallowed to dry in a fume hood for 24 h, and then were
annealed at 200�C for 2 h. The resulting filtration membranes
consisted of GDL coated with a layer of solution cast PSU/Ti4O7. These will be referred to as solution cast membranes.
Table 1 summarizes all of the membranes fabricated in thisstudy with an abbreviated sample name for each, which will
be used throughout the manuscript from this point forward.
Membrane characterization
SEM (FEI Quanta 600 FE-SEM) was used for morphologi-
cal characterization of the E/E and solution cast membranes
before and after they were annealed. Samples were sputtercoated (Cressington 208 HR) with platinum at 40 mV to
achieve a 6 nm layer thickness before SEM images were col-lected. SEM images of the membranes were collected at 10
kV and a working distance of 10 mm. Additionally, E/E
experiments were conducted over the course of 3 days on barealuminum foil to create 1.17 g of free standing E/E membrane
for Hg intrusion porosimetry analysis. Hg porosimetry analy-sis was also performed for ELAT 2, E/E ELAT 2-A, and E/E-
ELAT 2-A-2. Hg intrusion porosimetry analysis was per-formed by Micromeritic Analytical Services (Norcross, GA).
The conductivities of each of the E/E membranes and solu-
tion cast membranes (control), and bare GDLs (control) were
measured with EIS (Solartron, 1260 impedance analyzer, 1287electrochemical interface, Z Plot software). The in-plane con-
ductivities were measured using a cell with four parallel elec-trodes. An alternating current was applied to the two outer
electrodes while the resistance, R, was measured between the
two inner electrodes. Conductivities of each membrane weremeasured over a frequency range of 0.1 Hz to 106 Hz with
amplitude of 1 mV in the sinusoidal perturbation. The realimpedance or resistance was determined from the high x-inter-
cept of a semicircle regression of the Nyquist plot data. Theconductivity was calculated using the following equation
r5L
AR(2)
where r is the conductivity, L is the length between the twoinner electrodes, R is the resistance, and A is the cross-
sectional area of the membrane (A 5 wl, where w is the width
of the membrane and l is the thickness of the membrane). Theconductivity of each membrane and GDL (ELAT 1 and ELAT
2) was measured six times and the conductivity and errorreported is an average and standard deviation of these values.
Electrochemical characterization
The electrochemical characterization consisted of CV andEIS and was carried out in a single compartment three-
electrode glass cell using a potentiostat (Interface 1000,
Gamry). The ELAT sample was used as the working electrodeand immersed in 100 mM NaClO4 supporting electrolyte.
Electrical contact was made using copper tape (Fisher). A plat-inum wire (Alfa Aesar, Ward Hill, MA) was used as counter
electrode and a saturated Ag/AgCl electrode (Pine Instrument,
Table 1. Summary of Membranes Fabricated
Sample Name Membrane
ELAT 1 Bare ELAT 1 (ELAT LT 1400 W)E/E-ELAT 1 E/E PSU/Ti4O7 on ELAT 1E/E-ELAT 1-A E/E PSU/Ti4O7 on ELAT 1 – post-annealed
at 2008C for 2 hSC-ELAT 1 Solution Cast PSU/Ti4O7 on ELAT 1SC-ELAT 1-A Solution Cast PSU/Ti4O7 on ELAT
1 – post-annealed at 2008C for 2 hELAT 2 Bare ELAT 2 (ELAT H)E/E-ELAT 2 E/E PSU/Ti4O7 on ELAT 2E/E-ELAT 2-A E/E PSU/Ti4O7 on ELAT 2 –
post-annealed at 2008C for 2 hE/E-ELAT 2-A-2a E/E PSU/Ti4O7 on ELAT 2 –
post-annealed at 2008C for 2 hSC-ELAT 2 Solution Cast PSU/Ti4O7 on ELAT 1SC-ELAT 2-A Solution Cast PSU/Ti4O7 on ELAT
1 – post-annealed at 2008C for 2 h
aE/E 2 day process time; all other E/E membranes 6 h process time.
510 DOI 10.1002/aic Published on behalf of the AIChE February 2016 Vol. 62, No. 2 AIChE Journal
PA) was used as a reference electrode. The reference electrodewas placed 1 mm away from the ELAT surface to reduce solu-tion resistance and all potentials were corrected for solutionresistance (measured by EIS) and are reported against thestandard hydrogen electrode (SHE). CV was conducted inboth the supporting electrolyte and in supporting electrolytecontaining both 5 mM K3Fe(CN)6 and 5 mM K4Fe(CN)6 at ascan rate of 50 mV s21.
The measurement of the double layer capacitance (Cdl) ofselect ELAT samples was made within the potential regionbetween hydrogen and oxygen evolution reactions (0.2 to 0.6vs. SHE), and at the scan rates of 2, 4, 8, and 10 mV s21 in100 mM NaClO4 supporting electrolyte. In the Cdl measure-ment, an ELAT sample with a geometric surface area of10 cm2 was used as the working electrode, titanium mesh ascounter electrode, and saturated Ag/AgCl as reference elec-trode. The capacitive current increases linearly with increasingscan rates so that the capacitance of each ELAT sample can beextracted from the slope of the charging current (icharging) vs.scan rate (m) as given in Eq. 3
Cdl5icharging
v(3)
EIS experiments were conducted at the open circuit poten-tial (OCP) in a quiescent solution containing 5 mMK3Fe(CN)6 and 5 mM K4Fe(CN)6 with an amplitude of 10mV in the sinusoid perturbation and over a frequency rangeof 10 mHz to 30 kHz. The validity of the EIS data was exam-ined by Kramers–Kronig relations. An equivalent circuitmodel consisting of a Randles circuit with Warburg imped-ance was fit to EIS data, and details of the model are dis-cussed in the Results and Discussion Section. Fitting of theRandles circuit and examination of the Kramers–Kronig rela-tion to EIS data were performed in Gamry Echem Analystsoftware (version 6.23). The simplex algorithm was used tominimize the sum of squared errors between experimentaland simulated data. The fitting results are reported along witherror estimates at 95% confidence intervals assuming aChi-squared distribution.
Membrane filtration experiments
The cross-flow membrane filtration experimental setup is
shown in Figure 2a. The feed solution consisted of 100 mM
K2HPO4 as background electrolyte (pH 5 4.5) and 1 mM phe-
nol as target reactant. The background electrolyte concentra-
tion was chosen to mimic the ionic strength of industrial
wastewater streams and reverse osmosis concentrates.36–38
Phenol was chosen because is reacts via both direct oxidation
and OH• oxidation (kphenol,OH• 5 6.6 3 109 M21 s21).39 A
total volume of 300 mL feed solution was continuously
stirred in the feed tank and was pumped past the membrane at
a constant cross-flow rate (Qcross 5 25.8 L h21), using a bench
analog drive gear pump (Cole Parmer). Two different flow
configurations were tested: (1) cross-flow mode, where the
REMs were placed on a stainless steel current collector and,
thus, prevented liquid flow through the REM pores, and (2)
filtration mode, where the REMs were placed on a 0.2 lm
pore size polysulfone membrane support and liquid flow per-
meated through the membrane at a constant flux of
Qperm 5 6.1 L h21, which corresponds to a normalized mem-
brane flux of J 5 6100 L m22 h21 (1.7 3 1023 m s21). For
both flow configurations, Qcross 5 25.8 L h21, the transmem-
brane pressure was �14 kPa, and solutions were 100%
recycled to the feed reservoir to characterize reaction
kinetics. Constant current was supplied to the flow cell by a
potentiostat with REM as anode and boron-doped diamond
(BDD) plate as cathode. The electrode setup is shown in Fig-
ure 2b, and the flow cell assembly is shown in Figure 2c. The
anode and cathode were 6 mm apart. The membrane was
mounted between two gaskets with an exposed surface area
of 10 cm2 at the center. The electrical contact between mem-
brane and the potentiostat was made using copper tape.Prior to each experiment, a membrane was mounted into the
flow cell and 2 L deionized water was pumped through the
system in a nonrecycle mode. During 3 h of electrolysis, sam-
ples were taken from the feed tank every 20 min, filtered
through a 0.45 lm PVDF filters and analyzed in HPLC (LC-
20AD Shimadzu). HPLC analysis employed a SPD-M30A
Figure 2. (a) Schematic of the membrane filtration setup, (b) electrical connection in the three-electrode setup, (c)components of the flow cell in exploded view.
Lines 1, 2, and 3 represent feed, retentate, and permeate streams, respectively. [Color figure can be viewed in the online issue,
which is available at wileyonlinelibrary.com.]
AIChE Journal February 2016 Vol. 62, No. 2 Published on behalf of the AIChE DOI 10.1002/aic 511
variable wavelength UV-Visible detector set at 254 nm and a
reverse-phase C18 column (Phenomenex, 4.6 3 250 mm, 5
lm). Methanol:water (50:50, v/v) was used as mobile phase at
the total flow rate of 1 mL�min21. The injection volume was
programmed at 5 lL. Analysis was performed in duplicate and
evaluated using LabSolutions Lite Version 5.63 software.
After each experiment, solutions were pumped through the
system in the following sequence: 2 L deionized water (nonre-
cycle), 200 mL 100% ethanol (recycle, 15 min), and 2 L
deionized water (nonrecycle) to remove adsorbed contami-
nants. All experiments were performed in duplicate, that is,
experiments were performed on multiple samples of each
membrane.
Results and Discussion
Ti4O7 powder structure and morphologicalcharacterization
To fabricate E/E membranes with Ti4O7 particles, Ti4O7
powder was first synthesized by reducing TiO2 nanopowder in
hydrogen at 9508C for 4 h. After reduction in H2, the resulting
powder transitioned from a white color to a dark blue/black
color. The Ti4O7 Magn�eli phase present in the reduced TiO2
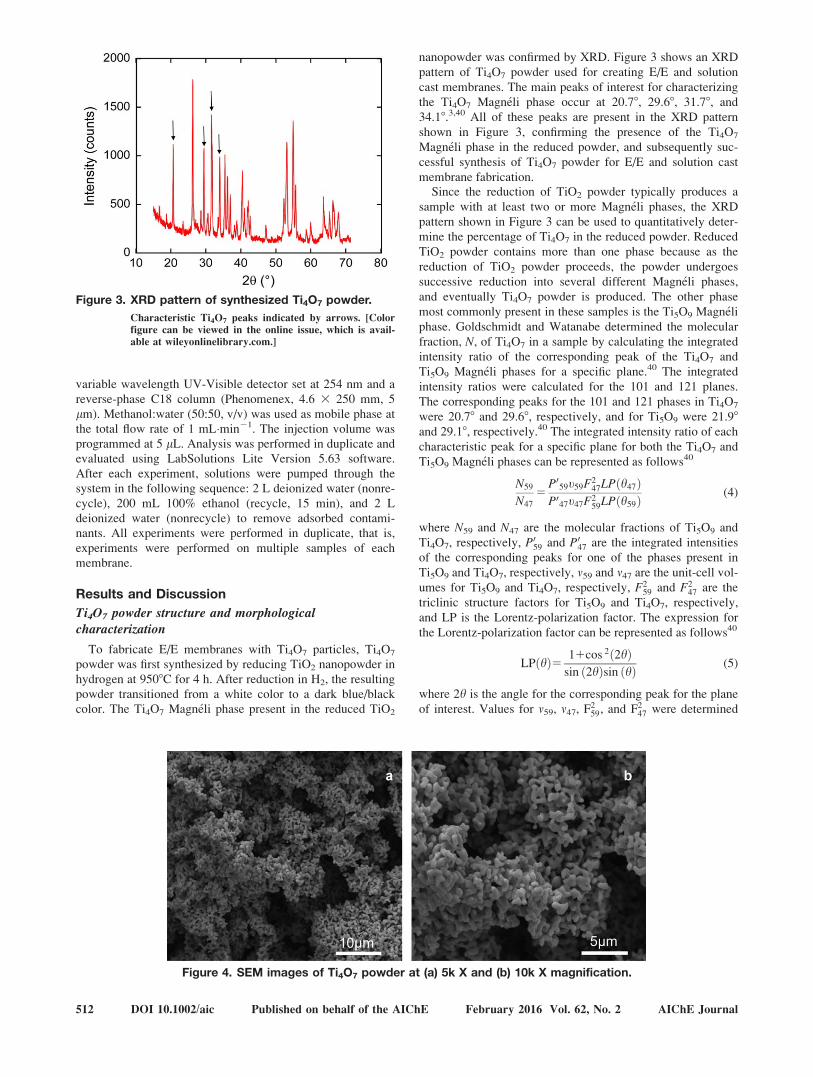
nanopowder was confirmed by XRD. Figure 3 shows an XRD
pattern of Ti4O7 powder used for creating E/E and solution
cast membranes. The main peaks of interest for characterizing
the Ti4O7 Magn�eli phase occur at 20.78, 29.68, 31.78, and
34.18.3,40 All of these peaks are present in the XRD pattern
shown in Figure 3, confirming the presence of the Ti4O7
Magn�eli phase in the reduced powder, and subsequently suc-
cessful synthesis of Ti4O7 powder for E/E and solution cast
membrane fabrication.Since the reduction of TiO2 powder typically produces a
sample with at least two or more Magn�eli phases, the XRD
pattern shown in Figure 3 can be used to quantitatively deter-
mine the percentage of Ti4O7 in the reduced powder. Reduced
TiO2 powder contains more than one phase because as the
reduction of TiO2 powder proceeds, the powder undergoes
successive reduction into several different Magn�eli phases,
and eventually Ti4O7 powder is produced. The other phase
most commonly present in these samples is the Ti5O9 Magn�eli
phase. Goldschmidt and Watanabe determined the molecular
fraction, N, of Ti4O7 in a sample by calculating the integrated
intensity ratio of the corresponding peak of the Ti4O7 and
Ti5O9 Magn�eli phases for a specific plane.40 The integrated
intensity ratios were calculated for the 101 and 121 planes.
The corresponding peaks for the 101 and 121 phases in Ti4O7
were 20.78 and 29.68, respectively, and for Ti5O9 were 21.98
and 29.18, respectively.40 The integrated intensity ratio of each
characteristic peak for a specific plane for both the Ti4O7 and
Ti5O9 Magn�eli phases can be represented as follows40
N59
N47
5P059t59F2
47LPðh47ÞP047t47F2
59LPðh59Þ(4)
where N59 and N47 are the molecular fractions of Ti5O9 and
Ti4O7, respectively, P059 and P047 are the integrated intensities
of the corresponding peaks for one of the phases present in
Ti5O9 and Ti4O7, respectively, m59 and m47 are the unit-cell vol-
umes for Ti5O9 and Ti4O7, respectively, F259 and F2
47 are the
triclinic structure factors for Ti5O9 and Ti4O7, respectively,
and LP is the Lorentz-polarization factor. The expression for
the Lorentz-polarization factor can be represented as follows40
LPðhÞ5 11cos 2ð2hÞsin ð2hÞsin ðhÞ (5)
where 2h is the angle for the corresponding peak for the plane
of interest. Values for m59, m47, F259, and F2
47 were determined
Figure 3. XRD pattern of synthesized Ti4O7 powder.
Characteristic Ti4O7 peaks indicated by arrows. [Color
figure can be viewed in the online issue, which is avail-
able at wileyonlinelibrary.com.]
Figure 4. SEM images of Ti4O7 powder at (a) 5k X and (b) 10k X magnification.
512 DOI 10.1002/aic Published on behalf of the AIChE February 2016 Vol. 62, No. 2 AIChE Journal
based on work done by LePage and Strobel;41 m59 and m47 were
590 A and 465 A, respectively, and F259 were 5240 and 12070
and F247 were 3240 and 6990 for the 101 and 121 phases,
respectively.42 Using Eqs. 4 and 5, the molecular fractions of
Ti4O7 and Ti5O9 were calculated in each sample of reduced
TiO2 powder produced. For the XRD pattern shown in Figure
3, the molecular fraction of Ti4O7 calculated in the powder
was 94.3% 6 4.6%. On average, the Ti4O7 was 90.6% 6 4.6%
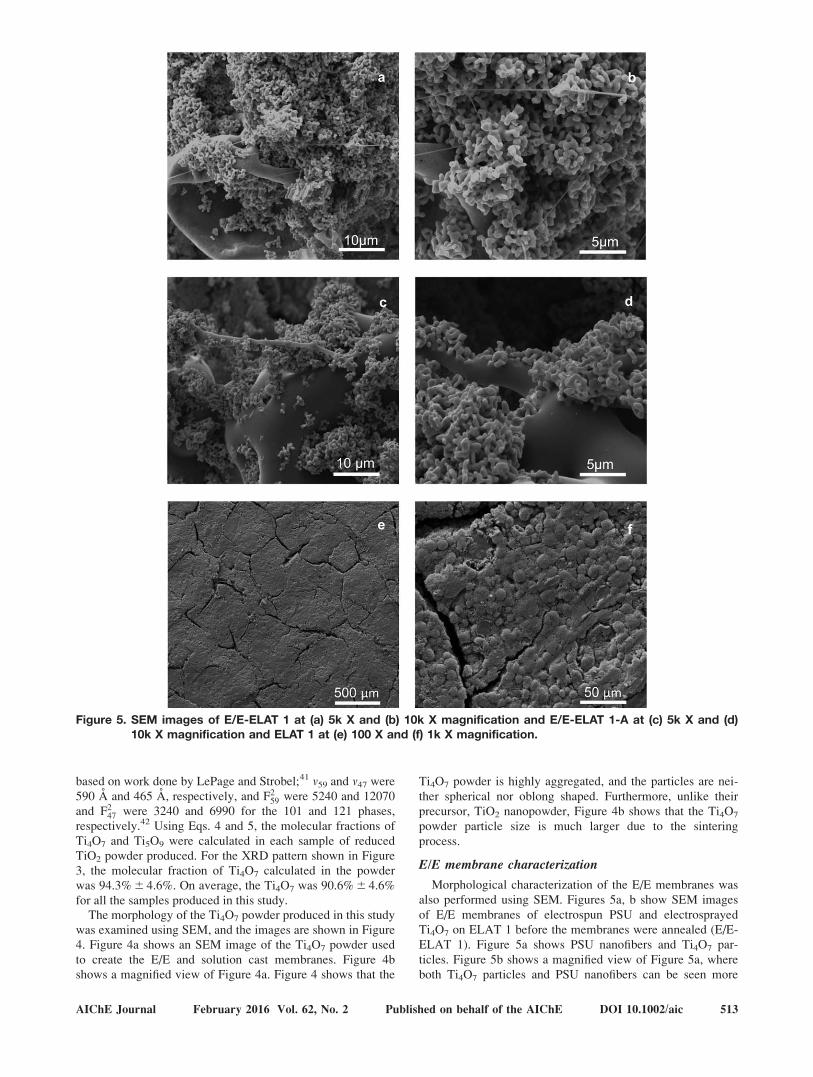
for all the samples produced in this study.The morphology of the Ti4O7 powder produced in this study
was examined using SEM, and the images are shown in Figure
4. Figure 4a shows an SEM image of the Ti4O7 powder used
to create the E/E and solution cast membranes. Figure 4b
shows a magnified view of Figure 4a. Figure 4 shows that the
Ti4O7 powder is highly aggregated, and the particles are nei-
ther spherical nor oblong shaped. Furthermore, unlike their
precursor, TiO2 nanopowder, Figure 4b shows that the Ti4O7
powder particle size is much larger due to the sintering
process.
E/E membrane characterization
Morphological characterization of the E/E membranes was
also performed using SEM. Figures 5a, b show SEM images
of E/E membranes of electrospun PSU and electrosprayed
Ti4O7 on ELAT 1 before the membranes were annealed (E/E-
ELAT 1). Figure 5a shows PSU nanofibers and Ti4O7 par-
ticles. Figure 5b shows a magnified view of Figure 5a, where
both Ti4O7 particles and PSU nanofibers can be seen more
Figure 5. SEM images of E/E-ELAT 1 at (a) 5k X and (b) 10k X magnification and E/E-ELAT 1-A at (c) 5k X and (d)10k X magnification and ELAT 1 at (e) 100 X and (f) 1k X magnification.
AIChE Journal February 2016 Vol. 62, No. 2 Published on behalf of the AIChE DOI 10.1002/aic 513
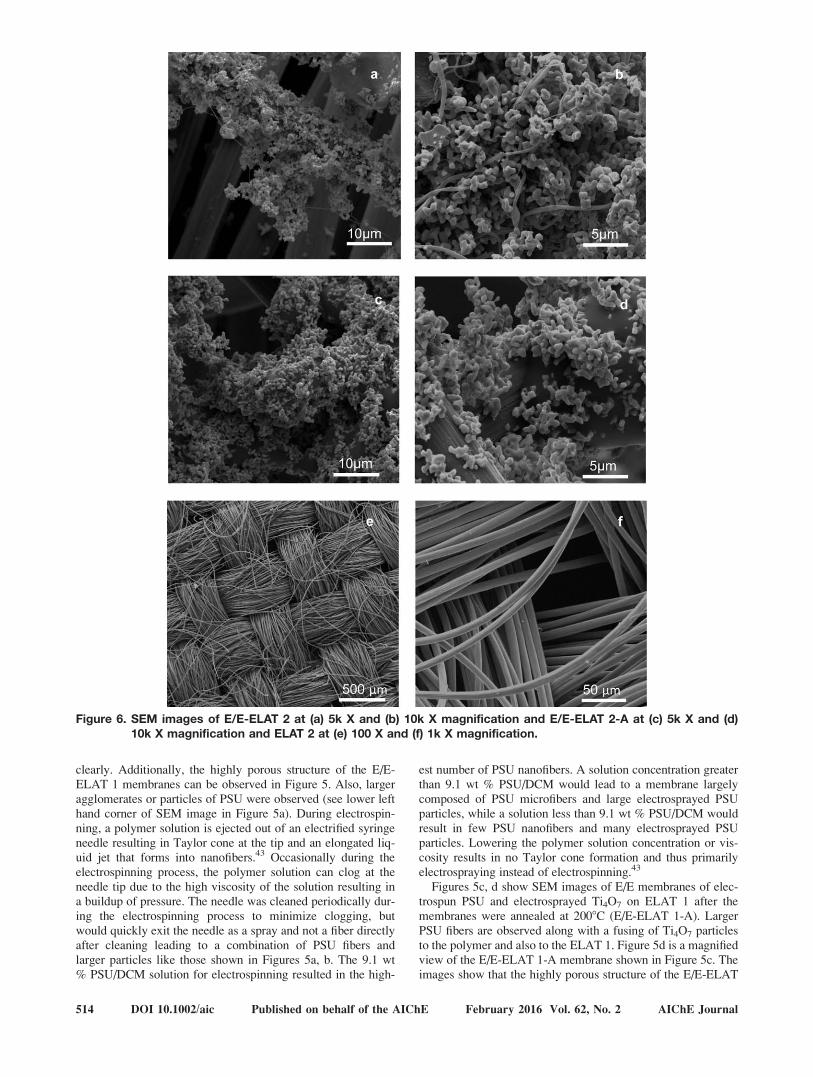
clearly. Additionally, the highly porous structure of the E/E-ELAT 1 membranes can be observed in Figure 5. Also, largeragglomerates or particles of PSU were observed (see lower lefthand corner of SEM image in Figure 5a). During electrospin-ning, a polymer solution is ejected out of an electrified syringeneedle resulting in Taylor cone at the tip and an elongated liq-uid jet that forms into nanofibers.43 Occasionally during theelectrospinning process, the polymer solution can clog at theneedle tip due to the high viscosity of the solution resulting ina buildup of pressure. The needle was cleaned periodically dur-ing the electrospinning process to minimize clogging, butwould quickly exit the needle as a spray and not a fiber directlyafter cleaning leading to a combination of PSU fibers andlarger particles like those shown in Figures 5a, b. The 9.1 wt% PSU/DCM solution for electrospinning resulted in the high-
est number of PSU nanofibers. A solution concentration greaterthan 9.1 wt % PSU/DCM would lead to a membrane largelycomposed of PSU microfibers and large electrosprayed PSUparticles, while a solution less than 9.1 wt % PSU/DCM wouldresult in few PSU nanofibers and many electrosprayed PSUparticles. Lowering the polymer solution concentration or vis-cosity results in no Taylor cone formation and thus primarilyelectrospraying instead of electrospinning.43
Figures 5c, d show SEM images of E/E membranes of elec-trospun PSU and electrosprayed Ti4O7 on ELAT 1 after themembranes were annealed at 2008C (E/E-ELAT 1-A). LargerPSU fibers are observed along with a fusing of Ti4O7 particlesto the polymer and also to the ELAT 1. Figure 5d is a magnifiedview of the E/E-ELAT 1-A membrane shown in Figure 5c. Theimages show that the highly porous structure of the E/E-ELAT
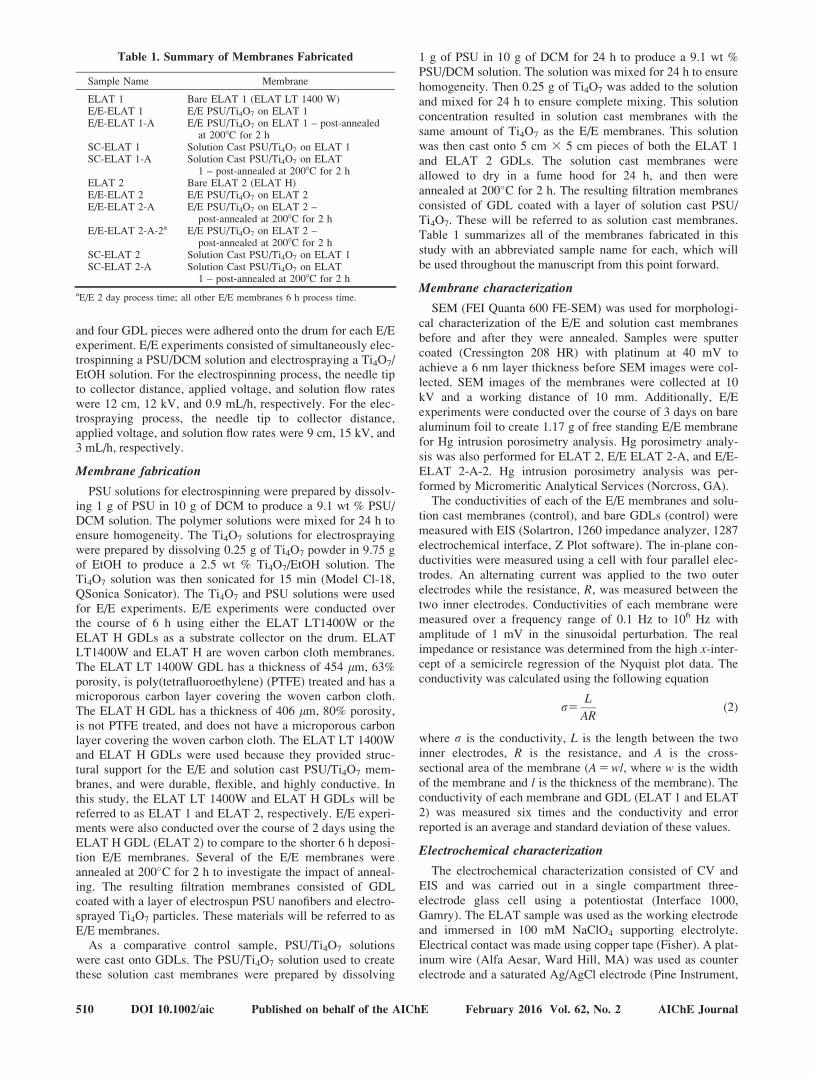
Figure 6. SEM images of E/E-ELAT 2 at (a) 5k X and (b) 10k X magnification and E/E-ELAT 2-A at (c) 5k X and (d)10k X magnification and ELAT 2 at (e) 100 X and (f) 1k X magnification.
514 DOI 10.1002/aic Published on behalf of the AIChE February 2016 Vol. 62, No. 2 AIChE Journal
1-A membranes persists even after annealing. Therefore,
annealing E/E-ELAT 1-A membranes results in highly porous,
durable membranes with enhanced adhesion between materials
that can subsequently be used for water filtration experiments.Figures 5e, f show SEM images of the bare ELAT 1 used as
the substrate for the E/E-ELAT 1 and E/E-ELAT 1-A mem-
branes shown in Figures 5a–d. Figure 5e shows that the PTFE-
treated microporous carbon layer on top of the woven carbon
cloth membrane has a fairly uniform morphology across the
substrate with visible cracks. Figure 5f shows a magnified
view of Figure 5e, showing the morphology of the coating in
more detail, highlighting the cracks in the coating, which are
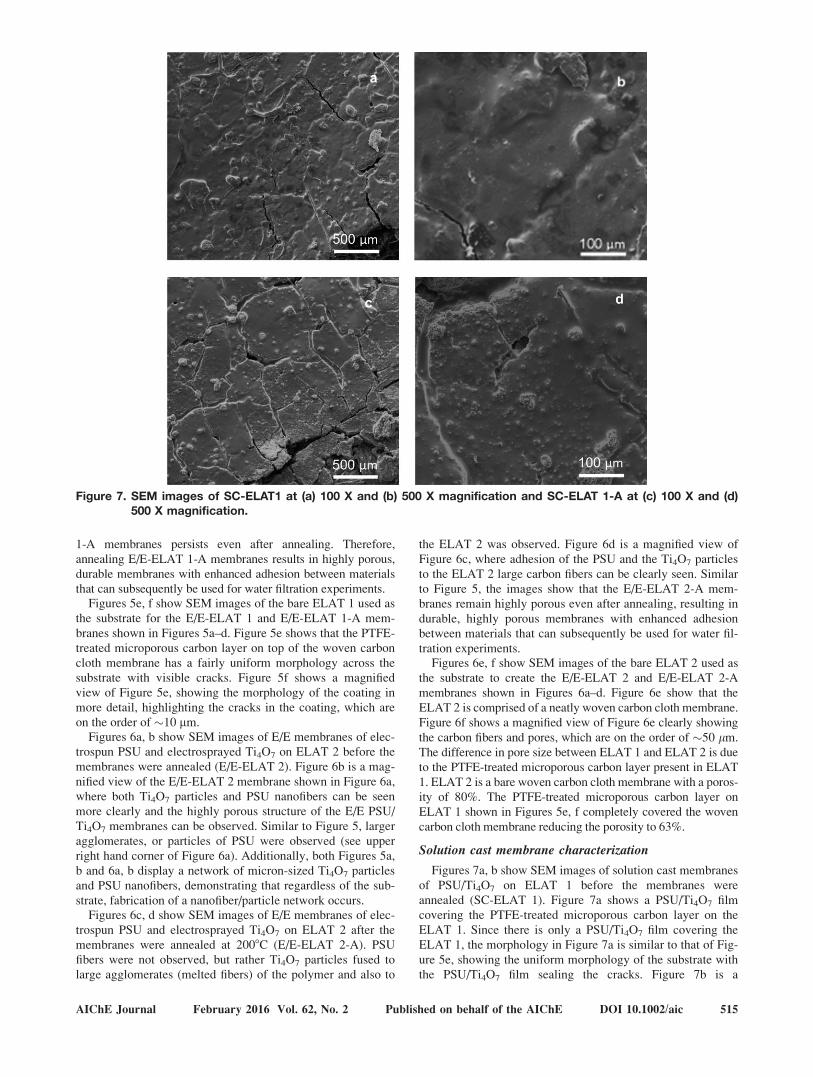
on the order of �10 mm.Figures 6a, b show SEM images of E/E membranes of elec-
trospun PSU and electrosprayed Ti4O7 on ELAT 2 before the
membranes were annealed (E/E-ELAT 2). Figure 6b is a mag-
nified view of the E/E-ELAT 2 membrane shown in Figure 6a,
where both Ti4O7 particles and PSU nanofibers can be seen
more clearly and the highly porous structure of the E/E PSU/
Ti4O7 membranes can be observed. Similar to Figure 5, larger
agglomerates, or particles of PSU were observed (see upper
right hand corner of Figure 6a). Additionally, both Figures 5a,
b and 6a, b display a network of micron-sized Ti4O7 particles
and PSU nanofibers, demonstrating that regardless of the sub-
strate, fabrication of a nanofiber/particle network occurs.Figures 6c, d show SEM images of E/E membranes of elec-
trospun PSU and electrosprayed Ti4O7 on ELAT 2 after the
membranes were annealed at 2008C (E/E-ELAT 2-A). PSU
fibers were not observed, but rather Ti4O7 particles fused to
large agglomerates (melted fibers) of the polymer and also to
the ELAT 2 was observed. Figure 6d is a magnified view of
Figure 6c, where adhesion of the PSU and the Ti4O7 particles
to the ELAT 2 large carbon fibers can be clearly seen. Similar
to Figure 5, the images show that the E/E-ELAT 2-A mem-
branes remain highly porous even after annealing, resulting in
durable, highly porous membranes with enhanced adhesion
between materials that can subsequently be used for water fil-
tration experiments.Figures 6e, f show SEM images of the bare ELAT 2 used as
the substrate to create the E/E-ELAT 2 and E/E-ELAT 2-A
membranes shown in Figures 6a–d. Figure 6e show that the
ELAT 2 is comprised of a neatly woven carbon cloth membrane.
Figure 6f shows a magnified view of Figure 6e clearly showing
the carbon fibers and pores, which are on the order of �50 lm.
The difference in pore size between ELAT 1 and ELAT 2 is due
to the PTFE-treated microporous carbon layer present in ELAT
1. ELAT 2 is a bare woven carbon cloth membrane with a poros-
ity of 80%. The PTFE-treated microporous carbon layer on
ELAT 1 shown in Figures 5e, f completely covered the woven
carbon cloth membrane reducing the porosity to 63%.
Solution cast membrane characterization
Figures 7a, b show SEM images of solution cast membranes
of PSU/Ti4O7 on ELAT 1 before the membranes were
annealed (SC-ELAT 1). Figure 7a shows a PSU/Ti4O7 film
covering the PTFE-treated microporous carbon layer on the
ELAT 1. Since there is only a PSU/Ti4O7 film covering the
ELAT 1, the morphology in Figure 7a is similar to that of Fig-
ure 5e, showing the uniform morphology of the substrate with
the PSU/Ti4O7 film sealing the cracks. Figure 7b is a
Figure 7. SEM images of SC-ELAT1 at (a) 100 X and (b) 500 X magnification and SC-ELAT 1-A at (c) 100 X and (d)500 X magnification.
AIChE Journal February 2016 Vol. 62, No. 2 Published on behalf of the AIChE DOI 10.1002/aic 515
magnified view of the solution cast membrane shown in Figure
6a showing the morphology of the film coating the ELAT 1 in
detail, highlighting the Ti4O7 particles embedded in the PSU/
Ti4O7 film. Figures 7c, d shows SEM images of solution cast
membranes of PSU/Ti4O7 on ELAT 1 after the membranes
were annealed at 2008C (SC-ELAT 1-A). Figure 7d is a mag-
nified view of the solution cast membrane shown in Figure 7c.
Since a PSU/Ti4O7 film was solution cast onto the ELAT 1,
there is not a significant change in the PSU morphology shown
in Figures 7c, d. The main difference is that Ti4O7 particles
can be seen more clearly in Figures 7c, d than in Figures 7a, b.
Unlike Figures 5 and 6, Figure 7 shows that the solution cast
membranes do not have a highly porous structure because the
PSU/Ti4O7 film covers the PTFE-treated microporous carbon
layer on the ELAT 1 completely and creates a nonporous
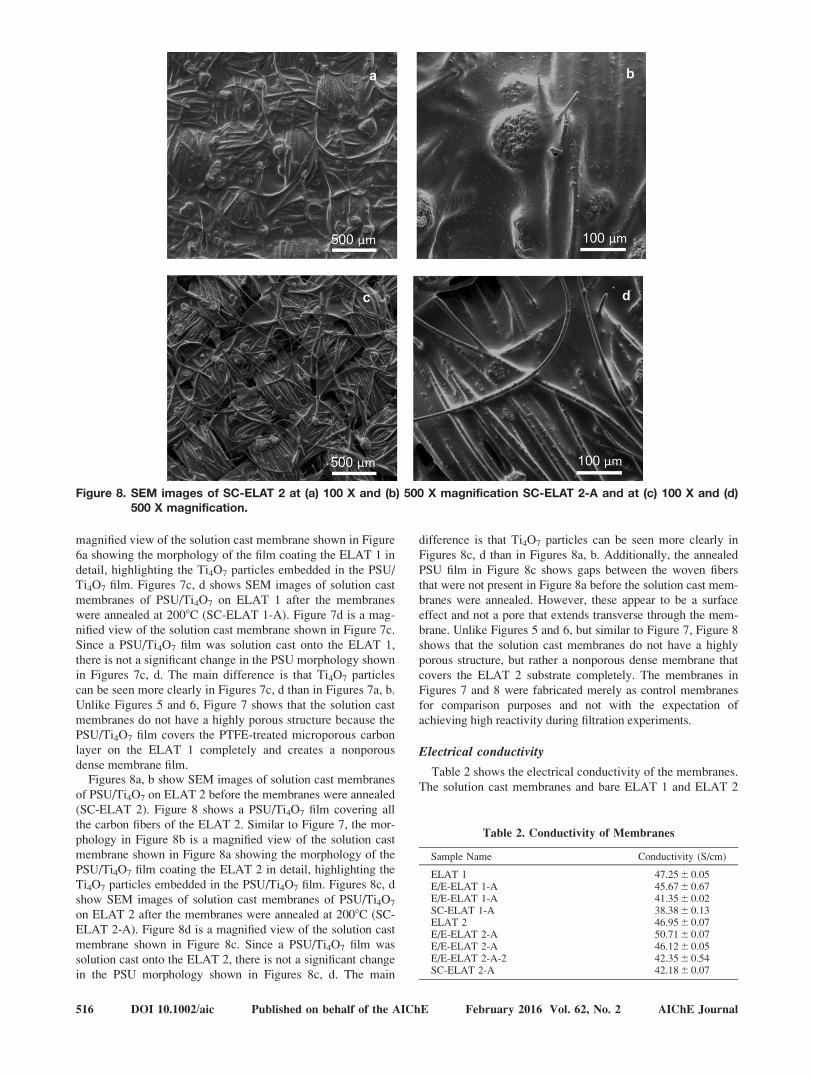
dense membrane film.Figures 8a, b show SEM images of solution cast membranes
of PSU/Ti4O7 on ELAT 2 before the membranes were annealed
(SC-ELAT 2). Figure 8 shows a PSU/Ti4O7 film covering all
the carbon fibers of the ELAT 2. Similar to Figure 7, the mor-
phology in Figure 8b is a magnified view of the solution cast
membrane shown in Figure 8a showing the morphology of the
PSU/Ti4O7 film coating the ELAT 2 in detail, highlighting the
Ti4O7 particles embedded in the PSU/Ti4O7 film. Figures 8c, d
show SEM images of solution cast membranes of PSU/Ti4O7
on ELAT 2 after the membranes were annealed at 2008C (SC-
ELAT 2-A). Figure 8d is a magnified view of the solution cast
membrane shown in Figure 8c. Since a PSU/Ti4O7 film was
solution cast onto the ELAT 2, there is not a significant change
in the PSU morphology shown in Figures 8c, d. The main
difference is that Ti4O7 particles can be seen more clearly in
Figures 8c, d than in Figures 8a, b. Additionally, the annealed
PSU film in Figure 8c shows gaps between the woven fibers
that were not present in Figure 8a before the solution cast mem-
branes were annealed. However, these appear to be a surface
effect and not a pore that extends transverse through the mem-
brane. Unlike Figures 5 and 6, but similar to Figure 7, Figure 8
shows that the solution cast membranes do not have a highly
porous structure, but rather a nonporous dense membrane that
covers the ELAT 2 substrate completely. The membranes in
Figures 7 and 8 were fabricated merely as control membranes
for comparison purposes and not with the expectation of
achieving high reactivity during filtration experiments.
Electrical conductivity
Table 2 shows the electrical conductivity of the membranes.
The solution cast membranes and bare ELAT 1 and ELAT 2
Figure 8. SEM images of SC-ELAT 2 at (a) 100 X and (b) 500 X magnification SC-ELAT 2-A and at (c) 100 X and (d)500 X magnification.
Table 2. Conductivity of Membranes
Sample Name Conductivity (S/cm)
ELAT 1 47.25 6 0.05E/E-ELAT 1-A 45.67 6 0.67E/E-ELAT 1-A 41.35 6 0.02SC-ELAT 1-A 38.38 6 0.13ELAT 2 46.95 6 0.07E/E-ELAT 2-A 50.71 6 0.07E/E-ELAT 2-A 46.12 6 0.05E/E-ELAT 2-A-2 42.35 6 0.54SC-ELAT 2-A 42.18 6 0.07
516 DOI 10.1002/aic Published on behalf of the AIChE February 2016 Vol. 62, No. 2 AIChE Journal
were tested as controls for the E/E membranes. The results inTable 2 show that the conductivity of ELAT 1 and ELAT 2are similar in magnitude, demonstrating that the substrates
used for creating the E/E and solution cast membranes wereconductive. Additionally, the conductivities of the E/E andsolution cast membranes are similar to those of bare ELAT 1
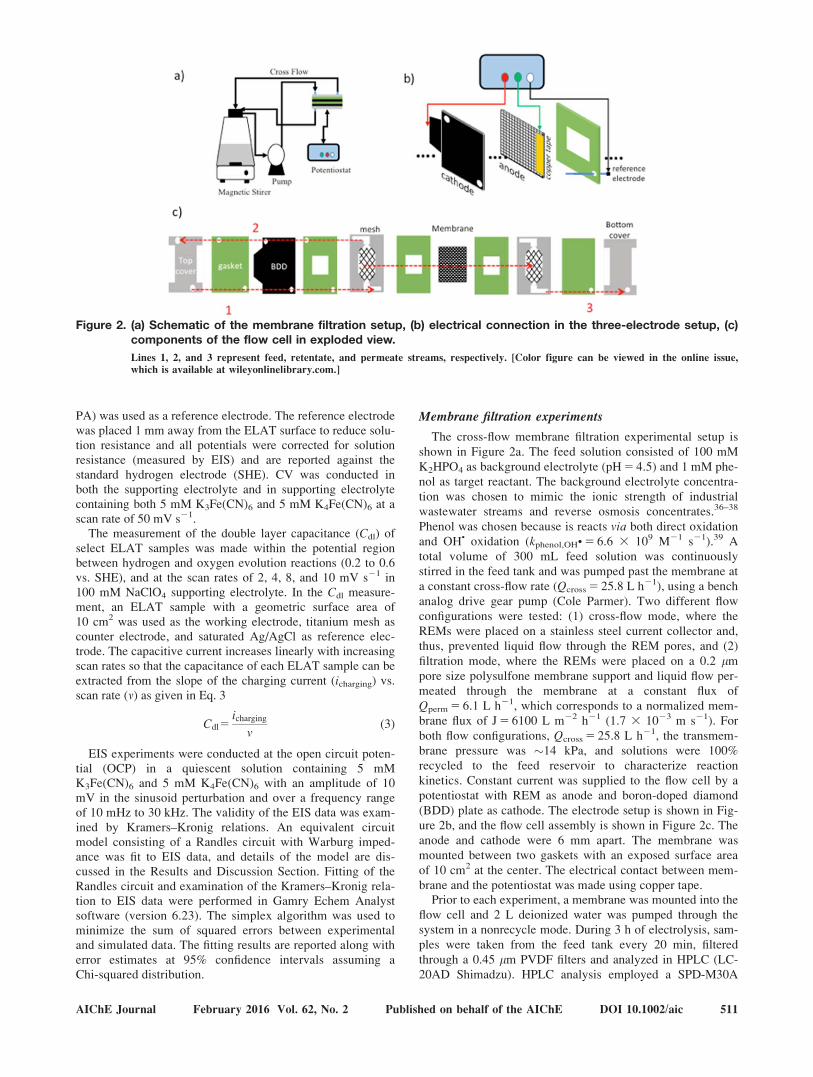
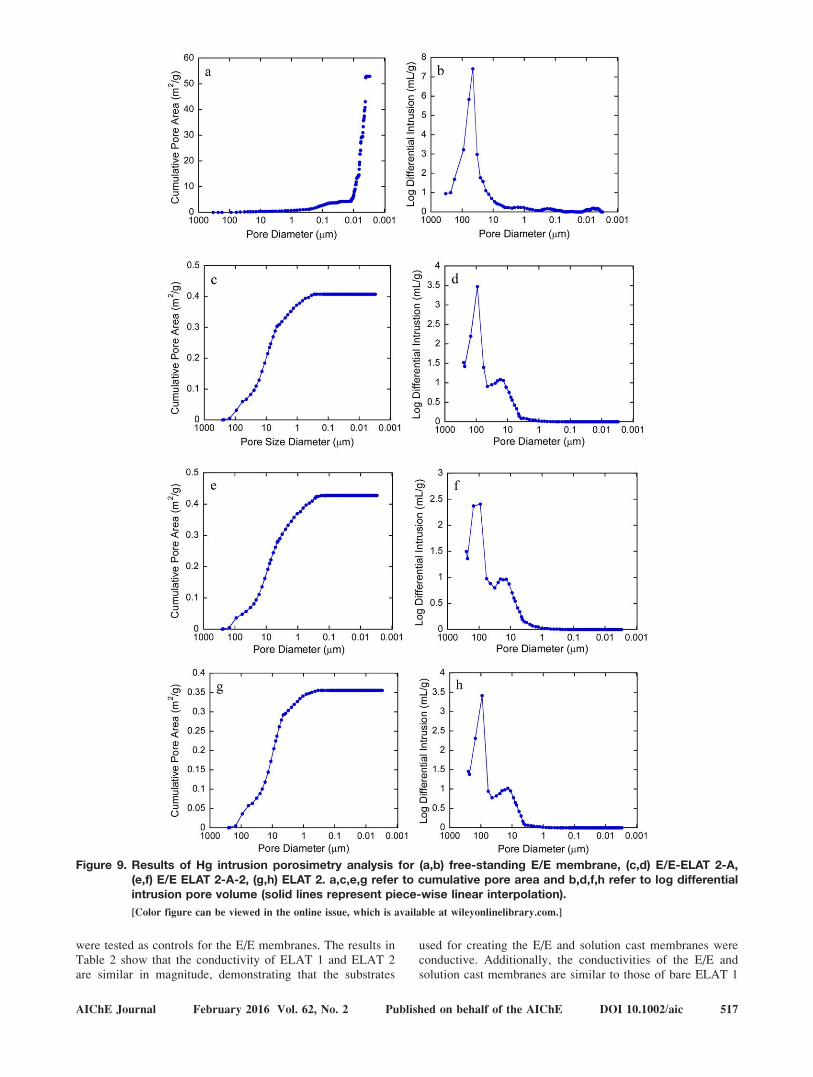
Figure 9. Results of Hg intrusion porosimetry analysis for (a,b) free-standing E/E membrane, (c,d) E/E-ELAT 2-A,(e,f) E/E ELAT 2-A-2, (g,h) ELAT 2. a,c,e,g refer to cumulative pore area and b,d,f,h refer to log differentialintrusion pore volume (solid lines represent piece-wise linear interpolation).
[Color figure can be viewed in the online issue, which is available at wileyonlinelibrary.com.]
AIChE Journal February 2016 Vol. 62, No. 2 Published on behalf of the AIChE DOI 10.1002/aic 517
and ELAT 2, indicating that the conductivities of the E/E and
solution cast membranes are maintained. These results demon-
strate that the E/E PSU/Ti4O7 membranes are not only highly
porous and durable, but are also conductive, which is an
important characteristic for REMs. Overall, these REMs are
not resistant to electrical current and can subsequently be used
for electrochemical water filtration experiments.
Hg porosimetery
The pore structure of the free-standing E/E membrane, E/E
ELAT 2-A, E/E ELAT 2-A-2, and ELAT 2 were characterized
using Hg intrusion porosimetry analysis. Figure 9 shows the
cumulative pore area and the log differential intrusion as a
function of the pore diameter for each membrane analyzed.
Figure 9b shows that the majority of the pore volume of the
free-standing E/E membrane consists of 16–45 lm sized
pores. Unlike the free-standing E/E membrane, the composite
membranes and bare ELAT 2 alone show different patterns for
the cumulative pore area and the log differential intrusion.
This is due to the ELAT 2 substrate (Figures 9g, h), which has
a vastly different pore structure than the E/E PSU/Ti4O7
adhered to it. Figures 9d, f, h show significant peaks at approx-
imately 15 lm and 100 lm. The 15 lm pore sizes are most
likely due to the pores between the fibers of the bare ELAT 2
membrane, and the 100 lm pore sizes are most likely due to
the pores between the bundles of fibers of the ELAT 2 mem-
brane shown in Figures 6e, f.
Electrochemical characterization
The CV scans were used to characterize the potential win-
dow of water stability and the electrochemical response to the
Fe(CN)642/32 redox couple. This redox couple was chosen
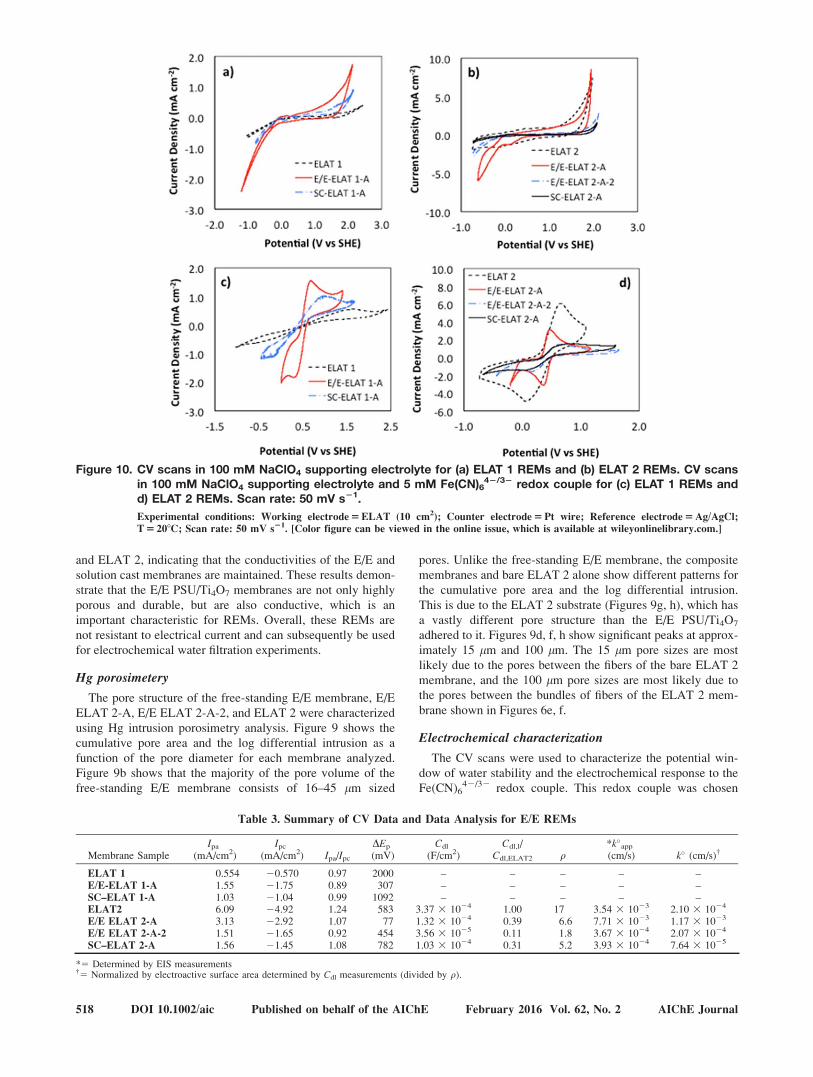
Figure 10. CV scans in 100 mM NaClO4 supporting electrolyte for (a) ELAT 1 REMs and (b) ELAT 2 REMs. CV scansin 100 mM NaClO4 supporting electrolyte and 5 mM Fe(CN)6
42/32 redox couple for (c) ELAT 1 REMs andd) ELAT 2 REMs. Scan rate: 50 mV s21.
Experimental conditions: Working electrode 5 ELAT (10 cm2); Counter electrode 5 Pt wire; Reference electrode 5 Ag/AgCl;
T 5 208C; Scan rate: 50 mV s21. [Color figure can be viewed in the online issue, which is available at wileyonlinelibrary.com.]
Table 3. Summary of CV Data and Data Analysis for E/E REMs
Membrane SampleIpa
(mA/cm2)Ipc
(mA/cm2) Ipa/Ipc
DEp
(mV)Cdl
(F/cm2)Cdl,l/
Cdl,ELAT2 q*k�app
(cm/s) k� (cm/s)†
ELAT 1 0.554 20.570 0.97 2000 – – – – –E/E-ELAT 1-A 1.55 21.75 0.89 307 – – – – –SC–ELAT 1-A 1.03 21.04 0.99 1092 – – – – –ELAT2 6.09 24.92 1.24 583 3.37 3 1024 1.00 17 3.54 3 1023 2.10 3 1024
E/E ELAT 2-A 3.13 22.92 1.07 77 1.32 3 1024 0.39 6.6 7.71 3 1023 1.17 3 1023
E/E ELAT 2-A-2 1.51 21.65 0.92 454 3.56 3 1025 0.11 1.8 3.67 3 1024 2.07 3 1024
SC–ELAT 2-A 1.56 21.45 1.08 782 1.03 3 1024 0.31 5.2 3.93 3 1024 7.64 3 1025
*5 Determined by EIS measurements†5 Normalized by electroactive surface area determined by Cdl measurements (divided by q).
518 DOI 10.1002/aic Published on behalf of the AIChE February 2016 Vol. 62, No. 2 AIChE Journal
because it undergoes a facile outer sphere electron transfer
reaction and is used as a probe to assess the effect of Ti4O7 on
the reaction kinetics toward the Fe(CN)642/32 redox couple.
Results of CV scans are shown in Figure 10.Results in Figure 10a indicate that the ELAT 1 substrate had
low activity for water oxidation and reduction reactions over
the investigated potential range. By contrast, the E/E-ELAT 1-
A sample showed an enhanced reactivity for both water oxida-
tion and water reduction relative to ELAT 1, which was also
much higher than for the solution cast REM (SC-ELAT 1-A).
These results are attributed to the coating of the Ti4O7 particles
by the PSU polymer, and the lower porosity created by the
solution cast process relative to the E/E fabrication technique,
which is evident from SEM images (Figures 5 and 7).The CV scans for ELAT 2, E/E-ELAT 2-A, E/E-ELAT 2-
A-2, and SC-ELAT 2-A are shown in Figure 10b. Results for
the E/E-ELAT 2-A membrane showed that the addition of the
Ti4O7 particles caused a slightly higher overpotential for water
oxidation and lower overpotential for water reduction, which
is characteristic of Ti4O7.44 However, the results for both the
E/E-ELAT 2-A-2 and SC-ELAT 2-A membranes indicate
that water oxidation and reduction reactions were less active
than on E/E-ELAT 2-A. These results are again attributed to
the coating of the Ti4O7 particles by the PSU polymer, and the
lower porosity (and thus surface area) created by the solution
cast technique relative to the E/E fabrication technique, which
is evident from SEM images (Figures 6 and 8). Additionally, itshould be noted that the current density for water oxidation
and reduction was much greater for the ELAT 2 materials
(Figure 10b) relative to the ELAT 1 materials (Figure 10a),this result is attributed to the higher porosity of the ELAT 2
materials and the higher activity of ELAT 2 relative to ELAT
1 for water oxidation and reduction reactions, the latter isattributed to the hydrophobic PTFE-treated microporous car-
bon coating that is present on ELAT 1.Investigation of the Fe(CN)6
42/32 redox couple on the
REMs is shown in Figures 10c, d and data summarizing theanalysis of these CV curves is included in Table 3. For all CV
scans with the Fe(CN)642/32 redox couple, the anodic peak
current (Ipa) to cathodic peak current (Ipc) ratio was close to
unity (Ipa/Ipc 5 0.89 2 1.24), indicating that neither homogene-
ous reactions nor adsorption were occurring during thesescans.45 The CV scans with the Fe(CN)6
42/32 redox couple
were used to determine changes to the reactive surface area
and reaction kinetics of the Fe(CN)642/32 redox couple. The
reactive surface area was assessed by Ipa and reaction kinetics
was qualitatively assessed by the anodic and cathodic peakseparation (DEp) (Table 3). The ELAT 1 substrate showed
irreversible kinetics for the Fe(CN)642/32 redox couple (Fig-
ure 10c), which was attributed to the hydrophobic PTFE-treated microporous carbon coating. The addition of the Ti4O7
particles by the E/E fabrication technique (E/E-ELAT 1-A)
increased Ipa and decreased DEp relative to ELAT, indicatingan increase in the reaction surface area and enhancement of
the reaction kinetics (Figure 10c and Table 3). SC-ELAT 1-Ashowed some enhancement of kinetics (DEp 5 1092 mV) and
reactive surface area (Ipa 5 1.03 mA cm22) compared to the
ELAT 1 substrate, but not to the extent of the E/E-ELAT 1-Amembrane. The response was more irreversible than the E/E-
ELAT 1-A, which was attributed to the coating of the Ti4O7
particles by the PSU polymer in the SC-ELAT 1-A membrane(see Figure 7).
CV scans in the presence of 5 mM Fe(CN)642/32 redox cou-
ple for ELAT 2 REMs are shown in Figure 10d. The uncoated
ELAT 2 substrate showed the highest peak current (Ipa 5 6.09mA cm22) and the largest peak separation (DEp 5 583 mV)
compared to the other ELAT 2 coated materials, except SC-ELAT 2-A (Table 3). On the addition of Ti4O7 to ELAT 2 by
the E/E method (E/E-ELAT 2-A), it was observed that both
DEp and Ipa decreased (Figure 10d and Table 3). These resultsare once again attributed to the PSU polymer deposition on
the ELAT 2 substrate. The E/E method operated under short
deposition times (6 h) (E/E-ELAT 2-A) was able to depositTi4O7 particles with low PSU polymer coverage, that pro-
duced membranes with intimate contact between the Ti4O7
particles and the ELAT 2 porous matrix. By contrast, both
the E/E method operated under extended deposition times
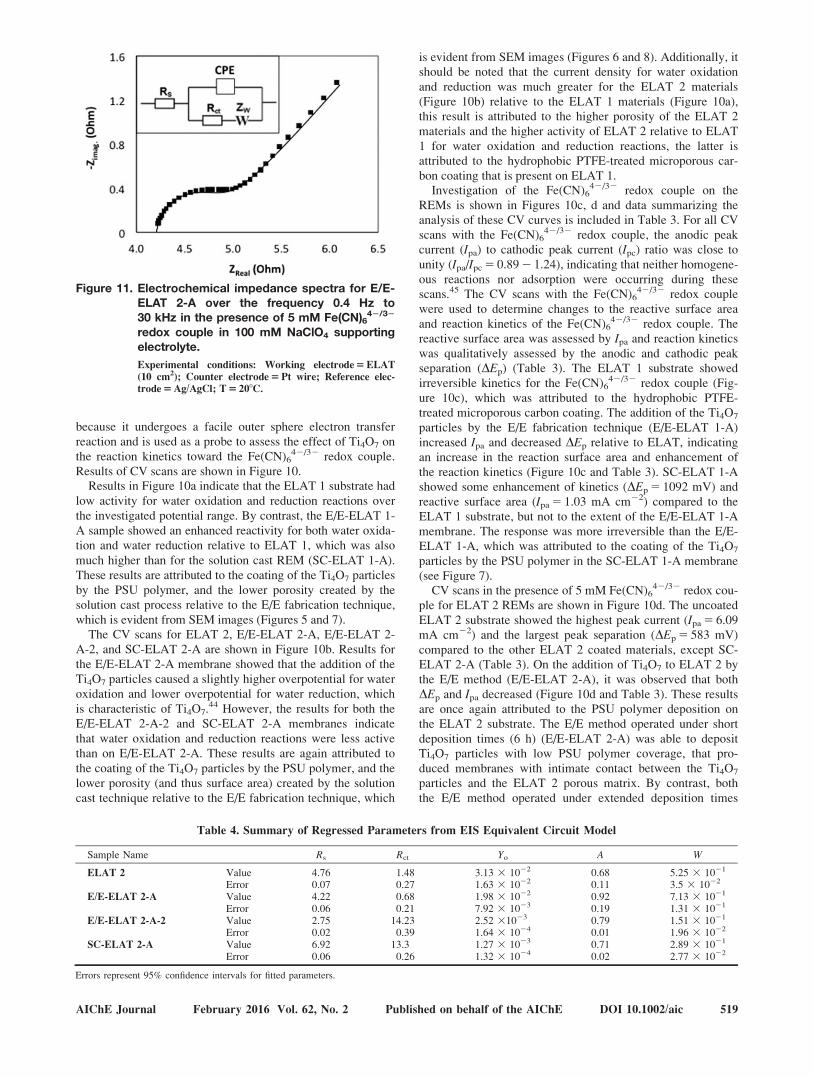
Figure 11. Electrochemical impedance spectra for E/E-ELAT 2-A over the frequency 0.4 Hz to30 kHz in the presence of 5 mM Fe(CN)6
42/32
redox couple in 100 mM NaClO4 supportingelectrolyte.
Experimental conditions: Working electrode 5 ELAT
(10 cm2); Counter electrode 5 Pt wire; Reference elec-
trode 5 Ag/AgCl; T 5 208C.
Table 4. Summary of Regressed Parameters from EIS Equivalent Circuit Model
Sample Name Rs Rct Yo A W
ELAT 2 Value 4.76 1.48 3.13 3 1022 0.68 5.25 3 1021
Error 0.07 0.27 1.63 3 1022 0.11 3.5 3 1022
E/E-ELAT 2-A Value 4.22 0.68 1.98 3 1022 0.92 7.13 3 1021
Error 0.06 0.21 7.92 3 1023 0.19 1.31 3 1021
E/E-ELAT 2-A-2 Value 2.75 14.23 2.52 31023 0.79 1.51 3 1021
Error 0.02 0.39 1.64 3 1024 0.01 1.96 3 1022
SC-ELAT 2-A Value 6.92 13.3 1.27 3 1023 0.71 2.89 3 1021
Error 0.06 0.26 1.32 3 1024 0.02 2.77 3 1022
Errors represent 95% confidence intervals for fitted parameters.
AIChE Journal February 2016 Vol. 62, No. 2 Published on behalf of the AIChE DOI 10.1002/aic 519
(E/E-ELAT 2-A-2) and the solution cast method (SC-ELAT 2-
A) produced membranes with excess PSU polymer coating
that prevented access of aqueous solutes to the Ti4O7 particles
and thus inhibited electron transfer rates. The SEM images in
Figure 8 clearly show the coating of the Ti4O7 particles and
the ELAT 2 substrate with the PSU polymer.A more reversible reaction typically results in an increase in
Ipa. The diminished Ipa observed after Ti4O7 addition (see
Table 3) is attributed to reduction of the electroactive surface
area during REM synthesis. The E/E-ELAT 2-A-2 membrane,
which was subjected to the E/E process for 2 days, showed
higher irreversibility than E/E-ELAT 2-A, which was synthe-
sized for a shorter time (6 h). This result is attributed to an
increase in PSU polymer deposition on the ELAT 2 substrate
with E/E deposition time, which resulted in a decrease in the
electroactive surface.The ELAT 2-based REMs showed a higher reactivity for
water oxidation and reduction and increased reversibility for
the Fe(CN)642/32 redox couple relative to the ELAT 1-based
REMs. Therefore, ELAT 2-based REMs were chosen for fur-
ther electrochemical characterization. The double layer capac-
itance (Cdl) values were measured for the ELAT 2-based
REMs and were used to assess the change in electroactive sur-
face area and to determine a roughness factor (q) for each of
the REMs. Capacitance methods for the determination of elec-
troactive surface area have been applied in prior studies.46 The
Cdl is a measure of the electroactive surface area of the materi-
als and was highest for the bare ELAT 2 substrate (Cdl 5 3.37
3 1024 F cm22) and decreased after E/E and SC coatings.
The ratio of Cdl,i/Cdl,ELAT-2 was 0.39, 0.11, and 0.31 for i 5 E/
E-ELAT 2-A, E/E-ELAT 2-A-2, SC-ELAT 2-A, respectively.
The values for Cdl,i/Cdl,ELAT-2 were similar to the Ipa,i/Ipa,ELAT-
2 values determined from the CV data shown in Figure 10d,
which were 0.51, 0.25, and 0.26 for i 5 E/E-ELAT 2-A, E/E-
ELAT 2-A-2, and SC-ELAT 2-A, respectively. These results
suggest that the deposition of the PSU/Ti4O7 decreased the
electroactive surface area of the REMs, and this decrease in
electro-active surface area was responsible for the decrease in
Ipa observed in CV data (Figure 10d). The decrease in DEp
after the addition of Ti4O7 particles indicates that Ti4O7 was
more active for the Fe(CN)642/32 redox couple, than the bare
ELAT 2 support.The q value for each REM was estimated from the Cdl
measurements by assuming an average double layer
capacitance of 20 lF cm22 for the bare ELAT 2 support.47,48
The q for Ti4O7 coated samples was determined by assumingthat the Cdl,i/Cdl,ELAT-2 ratio was representative of the change
in surface area. This approach may overestimate the actual qvalues of the REMs, since the Ti4O7 particles likely have a
slightly higher Cdl than the carbon support, but was deemed as
a reasonable first order approximation. Results indicate that
ELAT 2 had a q value of 17, and q decreased to 6.6, 1.8, and
5.2 for the E/E-ELAT 2-A, E/E-ELAT 2-A-2, and SC-ELAT2-A REMs, respectively. The decrease in surface roughness is
related to polymer deposition, which is apparent from SEM
images. Figure 6 shows the deposition of large polymer depos-
its on the ELAT 2 coating when using the E/E deposition
method, and Figure 8 shows a uniform coating when using the
SC method.EIS measurements were used to estimate the charge transfer
resistance (Rct) of the of 5 mM Fe(CN)642/32 redox couple and
to estimate a reaction rate constant. Figure 11 contains EIS data
and an equivalent circuit model fit for the E/E-ELAT 2-A
REM. A summary of all the regressed parameters from the
equivalent circuit model fits of all the ELAT 2-based REMs are
shown in Table 4. The EIS results support the results obtained
from the CV data. The apparent standard heterogeneous rateconstant (ko
app) was determined for the tested redox couple using
the measured value of Rct and the following equation45
k�
app5RT
RctACF2(6)
where R is the ideal gas constant, T is temperature, C is the
concentration of the redox couple, A is the membrane geomet-
ric surface area, and F is Faraday’s constant. The standard rate
constant (ko) was also estimated by dividing by the roughnessfactor to normalize by the “real” electroactive surface area.
Results are shown in Table 3. The comparable ko values show
that the difference in CV curves for ELAT 2 and E/E-ELAT
2-A-2 are attributed to surface area changes, and also that the
Cdl ratio is an accurate approximation of the change in electro-
active surface area. The E/E-ELAT 2-A material showed
changes to reversible behavior, which increased the surfacearea normalized rate constant (ko) by a factor of> 5, which is
attributed to enhanced kinetics on Ti4O7 particles relative to
the ELAT 2 support.Overall the results from CV and EIS analyses indicate that
the ELAT 2 substrate was more active for water electrolysis
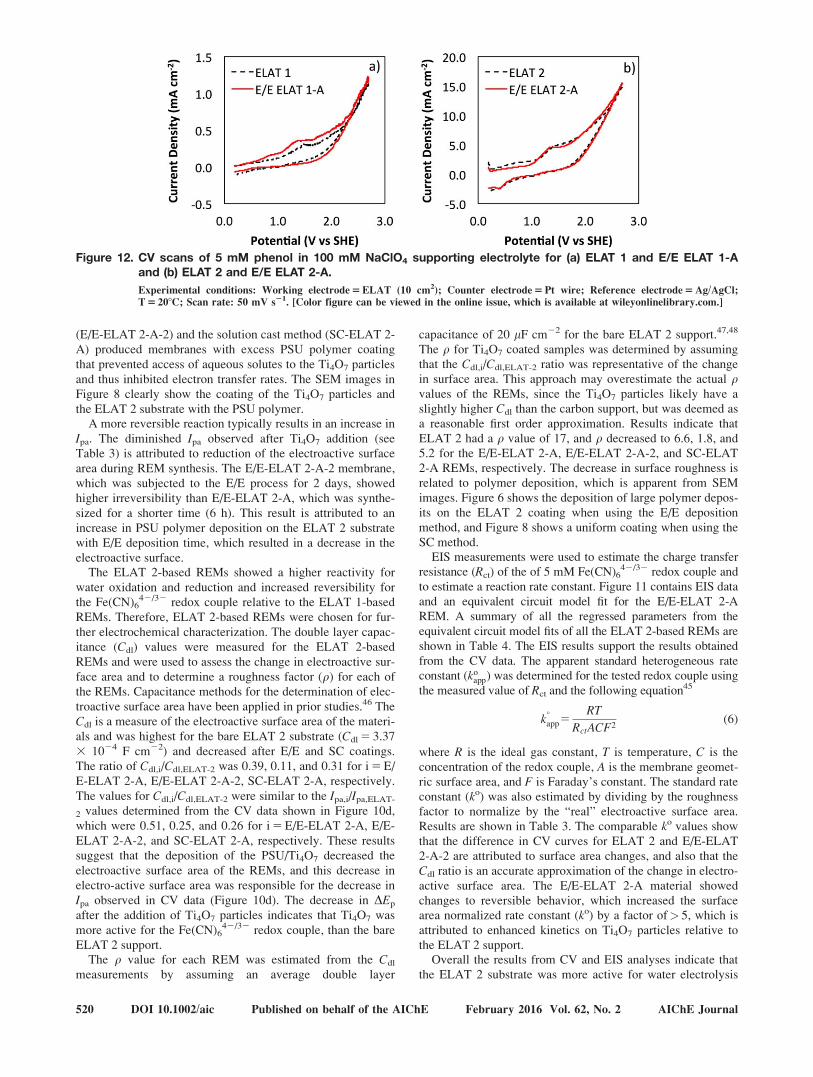
Figure 12. CV scans of 5 mM phenol in 100 mM NaClO4 supporting electrolyte for (a) ELAT 1 and E/E ELAT 1-Aand (b) ELAT 2 and E/E ELAT 2-A.
Experimental conditions: Working electrode 5 ELAT (10 cm2); Counter electrode 5 Pt wire; Reference electrode 5 Ag/AgCl;
T 5 208C; Scan rate: 50 mV s21. [Color figure can be viewed in the online issue, which is available at wileyonlinelibrary.com.]
520 DOI 10.1002/aic Published on behalf of the AIChE February 2016 Vol. 62, No. 2 AIChE Journal
reactions and reaction with the Fe(CN)642/32 redox couple
relative to ELAT 1, which was attributed to the hydrophobicPTFE-treated microporous carbon coating on ELAT 1 thatwas less active for these reactions and also acted to reduce thetotal surface area (per SEM images). It also was found that thedeposition of the Ti4O7 particles by the E/E method for 6 h (E/E-ELAT 2-A) produced the best membranes with respect toincreased activity for water electrolysis and the Fe(CN)6
42/32
redox couple. The response was highly correlated to the con-tent of PSU polymer on the REM material, which acted toreduce the electroactive surface area for the E/E-ELAT 2-A-2and SC-ELAT 2-A membranes.
Flow-through experiments
To determine the potential of the E/E REMs for water treat-ment applications, a series of experiments were conducted toassess phenol oxidation. CV scans were first conducted inbatch mode to assess the direct oxidation of phenol (Figure12). Peaks associated with the direct oxidation of phenol (E �1.3 V) indicate some enhancement for E/E-ELAT 1-A relativeto ELAT 1 (Figure 12a), and results were similar for both E/E-ELAT 2-A and ELAT 2 (Figure 12b). Direct oxidation of phe-nol was much greater on the ELAT 2 materials compared tothe ELAT 1 materials, which is consistent with results shownin Figure 10. To assess bulk phenol oxidation by both directoxidation and reaction with OH•, the E/E REMs were tested inthe flow-through reactor shown in Figure 2. Experiments wereconducted in both cross-flow and filtration mode, and for both
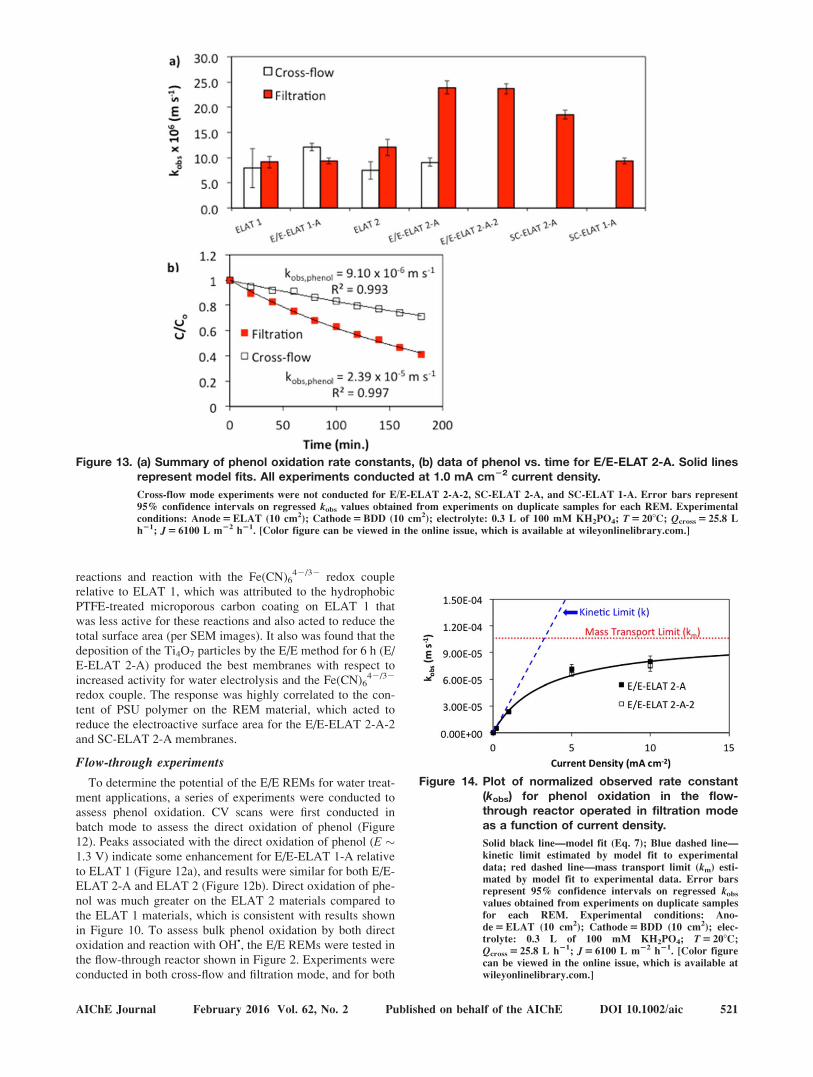
Figure 13. (a) Summary of phenol oxidation rate constants, (b) data of phenol vs. time for E/E-ELAT 2-A. Solid linesrepresent model fits. All experiments conducted at 1.0 mA cm22 current density.
Cross-flow mode experiments were not conducted for E/E-ELAT 2-A-2, SC-ELAT 2-A, and SC-ELAT 1-A. Error bars represent
95% confidence intervals on regressed kobs values obtained from experiments on duplicate samples for each REM. Experimental
conditions: Anode 5 ELAT (10 cm2); Cathode 5 BDD (10 cm2); electrolyte: 0.3 L of 100 mM KH2PO4; T 5 208C; Qcross 5 25.8 L
h21; J 5 6100 L m22 h21. [Color figure can be viewed in the online issue, which is available at wileyonlinelibrary.com.]
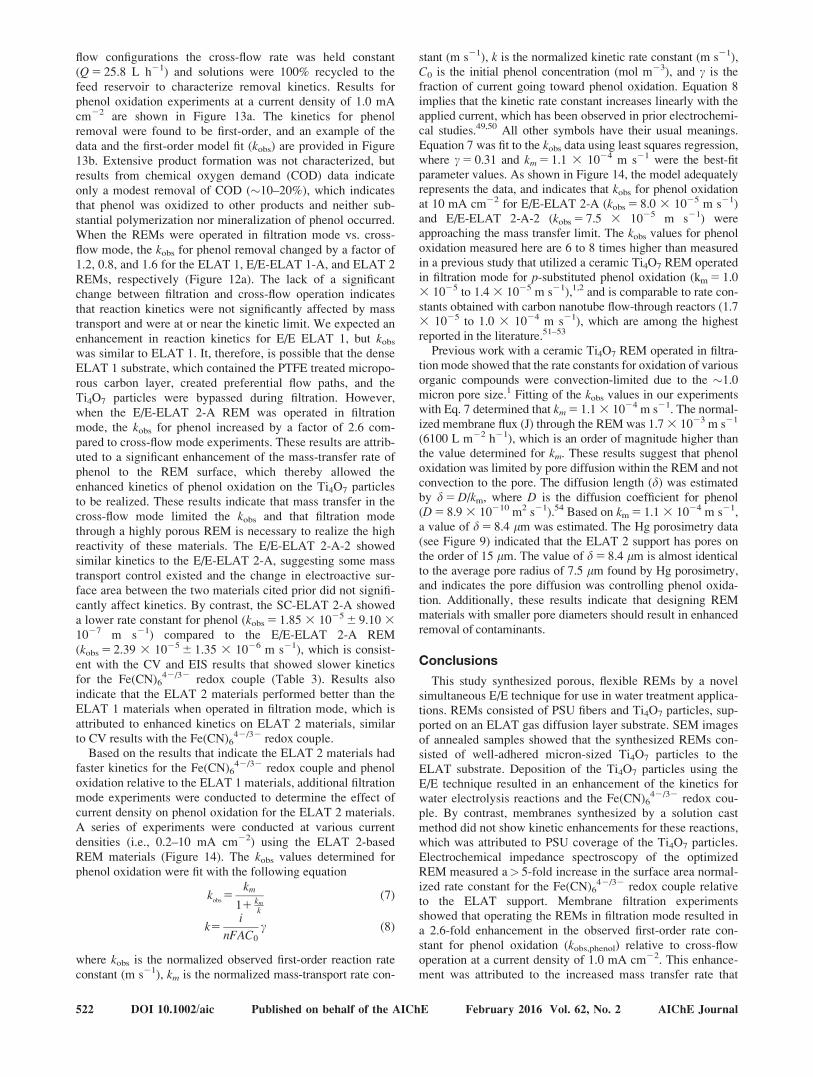
Figure 14. Plot of normalized observed rate constant(kobs) for phenol oxidation in the flow-through reactor operated in filtration modeas a function of current density.
Solid black line—model fit (Eq. 7); Blue dashed line—
kinetic limit estimated by model fit to experimental
data; red dashed line—mass transport limit (km) esti-
mated by model fit to experimental data. Error bars
represent 95% confidence intervals on regressed kobs
values obtained from experiments on duplicate samples
for each REM. Experimental conditions: Ano-
de 5 ELAT (10 cm2); Cathode 5 BDD (10 cm2); elec-
trolyte: 0.3 L of 100 mM KH2PO4; T 5 208C;
Qcross 5 25.8 L h21; J 5 6100 L m22 h21. [Color figure
can be viewed in the online issue, which is available at
wileyonlinelibrary.com.]
AIChE Journal February 2016 Vol. 62, No. 2 Published on behalf of the AIChE DOI 10.1002/aic 521
flow configurations the cross-flow rate was held constant(Q 5 25.8 L h21) and solutions were 100% recycled to the
feed reservoir to characterize removal kinetics. Results forphenol oxidation experiments at a current density of 1.0 mA
cm22 are shown in Figure 13a. The kinetics for phenolremoval were found to be first-order, and an example of the
data and the first-order model fit (kobs) are provided in Figure13b. Extensive product formation was not characterized, butresults from chemical oxygen demand (COD) data indicate
only a modest removal of COD (�10–20%), which indicatesthat phenol was oxidized to other products and neither sub-
stantial polymerization nor mineralization of phenol occurred.When the REMs were operated in filtration mode vs. cross-
flow mode, the kobs for phenol removal changed by a factor of1.2, 0.8, and 1.6 for the ELAT 1, E/E-ELAT 1-A, and ELAT 2
REMs, respectively (Figure 12a). The lack of a significantchange between filtration and cross-flow operation indicates
that reaction kinetics were not significantly affected by masstransport and were at or near the kinetic limit. We expected an
enhancement in reaction kinetics for E/E ELAT 1, but kobs
was similar to ELAT 1. It, therefore, is possible that the denseELAT 1 substrate, which contained the PTFE treated micropo-
rous carbon layer, created preferential flow paths, and theTi4O7 particles were bypassed during filtration. However,
when the E/E-ELAT 2-A REM was operated in filtrationmode, the kobs for phenol increased by a factor of 2.6 com-
pared to cross-flow mode experiments. These results are attrib-uted to a significant enhancement of the mass-transfer rate of
phenol to the REM surface, which thereby allowed theenhanced kinetics of phenol oxidation on the Ti4O7 particles
to be realized. These results indicate that mass transfer in thecross-flow mode limited the kobs and that filtration mode
through a highly porous REM is necessary to realize the highreactivity of these materials. The E/E-ELAT 2-A-2 showedsimilar kinetics to the E/E-ELAT 2-A, suggesting some mass
transport control existed and the change in electroactive sur-face area between the two materials cited prior did not signifi-
cantly affect kinetics. By contrast, the SC-ELAT 2-A showeda lower rate constant for phenol (kobs 5 1.85 3 1025 6 9.10 3
1027 m s21) compared to the E/E-ELAT 2-A REM(kobs 5 2.39 3 1025 6 1.35 3 1026 m s21), which is consist-
ent with the CV and EIS results that showed slower kineticsfor the Fe(CN)6
42/32 redox couple (Table 3). Results also
indicate that the ELAT 2 materials performed better than theELAT 1 materials when operated in filtration mode, which is
attributed to enhanced kinetics on ELAT 2 materials, similarto CV results with the Fe(CN)6
42/32 redox couple.Based on the results that indicate the ELAT 2 materials had
faster kinetics for the Fe(CN)642/32 redox couple and phenol
oxidation relative to the ELAT 1 materials, additional filtrationmode experiments were conducted to determine the effect of
current density on phenol oxidation for the ELAT 2 materials.A series of experiments were conducted at various current
densities (i.e., 0.2–10 mA cm22) using the ELAT 2-basedREM materials (Figure 14). The kobs values determined for
phenol oxidation were fit with the following equation
kobs
5km
11 km
k
(7)
k5i
nFAC0
c (8)
where kobs is the normalized observed first-order reaction rate
constant (m s21), km is the normalized mass-transport rate con-
stant (m s21), k is the normalized kinetic rate constant (m s21),C0 is the initial phenol concentration (mol m23), and c is thefraction of current going toward phenol oxidation. Equation 8implies that the kinetic rate constant increases linearly with theapplied current, which has been observed in prior electrochemi-cal studies.49,50 All other symbols have their usual meanings.Equation 7 was fit to the kobs data using least squares regression,where c 5 0.31 and km 5 1.1 3 1024 m s21 were the best-fitparameter values. As shown in Figure 14, the model adequatelyrepresents the data, and indicates that kobs for phenol oxidationat 10 mA cm22 for E/E-ELAT 2-A (kobs 5 8.0 3 1025 m s21)and E/E-ELAT 2-A-2 (kobs 5 7.5 3 1025 m s21) wereapproaching the mass transfer limit. The kobs values for phenoloxidation measured here are 6 to 8 times higher than measuredin a previous study that utilized a ceramic Ti4O7 REM operatedin filtration mode for p-substituted phenol oxidation (km 5 1.03 1025 to 1.4 3 1025 m s21),1,2 and is comparable to rate con-stants obtained with carbon nanotube flow-through reactors (1.73 1025 to 1.0 3 1024 m s21), which are among the highestreported in the literature.51–53
Previous work with a ceramic Ti4O7 REM operated in filtra-tion mode showed that the rate constants for oxidation of variousorganic compounds were convection-limited due to the �1.0micron pore size.1 Fitting of the kobs values in our experimentswith Eq. 7 determined that km 5 1.1 3 1024 m s21. The normal-ized membrane flux (J) through the REM was 1.7 3 1023 m s21
(6100 L m22 h21), which is an order of magnitude higher thanthe value determined for km. These results suggest that phenoloxidation was limited by pore diffusion within the REM and notconvection to the pore. The diffusion length (d) was estimatedby d 5 D/km, where D is the diffusion coefficient for phenol(D 5 8.9 3 10210 m2 s21).54 Based on km 5 1.1 3 1024 m s21,a value of d 5 8.4 lm was estimated. The Hg porosimetry data(see Figure 9) indicated that the ELAT 2 support has pores onthe order of 15 lm. The value of d 5 8.4 lm is almost identicalto the average pore radius of 7.5 lm found by Hg porosimetry,and indicates the pore diffusion was controlling phenol oxida-tion. Additionally, these results indicate that designing REMmaterials with smaller pore diameters should result in enhancedremoval of contaminants.
Conclusions
This study synthesized porous, flexible REMs by a novelsimultaneous E/E technique for use in water treatment applica-tions. REMs consisted of PSU fibers and Ti4O7 particles, sup-ported on an ELAT gas diffusion layer substrate. SEM imagesof annealed samples showed that the synthesized REMs con-sisted of well-adhered micron-sized Ti4O7 particles to theELAT substrate. Deposition of the Ti4O7 particles using theE/E technique resulted in an enhancement of the kinetics forwater electrolysis reactions and the Fe(CN)6
42/32 redox cou-ple. By contrast, membranes synthesized by a solution castmethod did not show kinetic enhancements for these reactions,which was attributed to PSU coverage of the Ti4O7 particles.Electrochemical impedance spectroscopy of the optimizedREM measured a> 5-fold increase in the surface area normal-ized rate constant for the Fe(CN)6
42/32 redox couple relativeto the ELAT support. Membrane filtration experimentsshowed that operating the REMs in filtration mode resulted ina 2.6-fold enhancement in the observed first-order rate con-stant for phenol oxidation (kobs,phenol) relative to cross-flowoperation at a current density of 1.0 mA cm22. This enhance-ment was attributed to the increased mass transfer rate that
522 DOI 10.1002/aic Published on behalf of the AIChE February 2016 Vol. 62, No. 2 AIChE Journal
occurred in filtration mode. Phenol oxidation in filtration
mode reached a kobs,phenol 5 8.0 3 1025 m s21 at 10 mA
cm22, which was approaching the pore diffusion mass transfer
limit, and was 6 to 8 times higher than measured in a previous
study that utilized a ceramic Ti4O7 REM in filtration mode,1,2
and is comparable to rate constants obtained with carbon
nanotube flow-through reactors (1.7 3 1025 to 1.0 3 1024 m
s21), which are among the highest reported in the literature to
date.51–53 Results suggest that further rate enhancements can
be achieved by synthesizing REMs with smaller pore diame-
ters, which will decrease the time-scale for pore diffusion.
Acknowledgments
The authors acknowledge the financial support of the
National Science Foundation (CBET-1447172 and CBET-
1356031) and for use of the SEM, which was acquired with
support by the National Science Foundation (DBI-0116835),
Texas A&M University, and the Texas Engineering Experi-
mental Station.
Literature Cited
1. Zaky AM, Chaplin BP. Porous substoichiometric TiO2 anodes asreactive electrochemical membranes for water treatment. Environ SciTechnol. 2013;47(12):6554–6563.
2. Zaky AM, Chaplin BP. Mechanism of P-substituted phenol oxidationat a Ti4O7 reactive electrochemical membrane. Environ Sci Technol.2014;48(10):5857–5867.
3. Hayfield PCS. Development of a New Material - Monolithic Ti4O7
EbonexVR Ceramic. Cambridge, UK: Royal Society of Chemistry, 2002.4. Senevirathne K, Hui R, Campbell S, Ye SY, Zhang JJ. Electrocata-
lytic activity and durability of Pt/NbO2 and Pt/Ti4O7 nanofibers forpem fuel cell oxygen reduction reaction. Electrochim Acta. 2012;59:538–547.
5. Pollock RJ, Houlihan JF, Bain AN, Coryea BS. ElectrochemicalProperties of a New Electrode Material, Ti4O7. Mater Res Bull.1984;19(1):17–24.
6. Li XX, Zhu AL, Qu W, Wang HJ, Hui R, Zhang L, Zhang JJ. Mag-neli phase Ti4O7 electrode for oxygen reduction reaction and itsimplication for zinc-air rechargeable batteries. Electrochim Acta.2010;55(20):5891–5898.
7. Kao WH, Patel P, Haberichter SL. Formation enhancement of alead/acid battery positive plate by Barium Metaplumbate and Ebo-nex. J Electrochem Soc. 1997;144(8):2942–2942.
8. Loyns AC, Hill A, Ellis KG, Partington TJ, Hill JM. Bipolar bat-teries based on EbonexVR technology. J Power Sources. 2005;144(2):329–337.
9. Chen GY, Bare SR, Mallouk TE. Development of supported bifunc-tional electrocatalysts for unitized regenerative fuel cells.J Electrochem Soc. 2002;149(8):A1092–A1099.
10. Ioroi T, Senoh H, Yamazaki SI, Siroma Z, Fujiwara N, Yasuda K. Sta-bility of corrosion-resistant magneli-phase Ti4O7-supported pemfc cata-lysts at high potentials. J Electrochem Soc. 2008;155(4):B321–B326.
11. Phillips R, Hansen P, Eisenbraun E. Atomic layer deposition fabri-cated substoichiometric TiOx nanorods as fuel cell catalyst supports.J Vac Sci Technol. A. 2012;30(1):6.
12. Chen G, Betterton EA, Arnold RG. Electrolytic oxidation of trichlo-roethylene using a ceramic anode. J Appl Electrochem. 1999;29(8):961–970.
13. El-Sherif S, Bejan D, Bunce NJ. Electrochemical oxidation of sulfideion in synthetic sour brines using periodic polarity reversal atEbonexVR electrodes. Can J Chem. 2010;88(9):928–936.
14. Kearney D, Bejan D, Bunce NJ. The use of Ebonex electrodes forthe electrochemical removal of nitrate ion from water. Can J Chem.2012;90(8):666–674.
15. Bejan D, Malcolm JD, Morrison L, Bunce NJ. Mechanistic investi-gation of the conductive ceramic EbonexVR as an anode material.Electrochim Acta. 2009;54(23):5548–5556.
16. Bejan D, Guinea E, Bunce NJ. On the nature of the hydroxyl radi-cals produced at boron-doped diamond and EbonexVR anodes. Elec-trochim Acta. 2012;69:275–281.
17. Scialdone O, Galia A, Filardo G. Electrochemical incineration of1,2-dichloroethane: effect of the electrode material. ElectrochimActa. 2008;53(24):7220–7225.
18. Wang X, Richey FW, Wujcik KH, Elabd YA. Ultra-low platinumloadings in polymer electrolyte membrane fuel cell electrodes fabri-cated via simultaneous electrospinning/electrospraying method.J Power Sources. 2014;264:42–48.
19. Yanilmaz M, Lu Y, Dirican M, Fu K, Zhang XW. Nanoparticle-on-nanofiber hybrid membrane separators for lithium-ion batteries viacombining electrospraying and electrospinning techniques. J MembrSci. 2014;456:57–65.
20. Wang K, Xu M, Zhu M, Su H, Wang H, Kong D, Wang L. Creationof macropores in electrospun silk fibroin scaffolds using sacrificialpeo-microparticles to enhance cellular infiltration. J Biomed MaterRes A. 2013;101(12):3474–3481.
21. Virovska D, Paneva D, Manolova N, Rashkov I, Karashanova D.Electrospinning/electrospraying vs. electrospinning: a comparativestudy on the design of poly(L-lactide)/zinc oxide non-woven textile.Appl Surf Sci. 2014;311:842–850.
22. Thayer PS, Dimling AF, Plessl DS, Hahn MR, Guelcher SA,Dahlgren LA, Goldstein AS. Cellularized cylindrical fiber/hydrogelcomposites for ligament tissue engineering. Biomacromolecules.2014;15(1):75–83.
23. Ignatova M, Manolova N, Rashkov I. Electrospun antibacterialchitosan-based fibers. Macromol Biosci. 2013;13(7):860–872.
24. Bock N, Woodruff MA, Steck R, Hutmacher DW, Farrugia BL,Dargaville TR. Composites for delivery of therapeutics: combiningmelt electrospun scaffolds with loaded electrosprayed microparticles.Macromol Biosci. 2014;14(2):202–214.
25. Bae H, Lee J. Encapsulated particles attached on electrospun fibersby in situ combination of electrospinning and coaxial electrospray-ing. J Nanosci Nanotechnol. 2014;14(10):7574–7580.
26. Wang X, Richey FW, Wujcik KH, Ventura R, Mattson K, ElabdYA. Effect of polytetrafluoroethylene on ultra-low platinum loadedelectrospun/electrosprayed electrodes in proton exchange membranefuel cells. Electrochim Acta. 2014;139:217–224.
27. Lavielle N, Hebraud A, Schlatter G, Thony-Meyer L, Rossi RM,Popa AM. Simultaneous electrospinning and electrospraying: astraightforward approach for fabricating hierarchically structuredcomposite membranes. ACS Appl Mater Interfaces. 2013;5(20):10090–10097.
28. Korina E, Stoilova O, Manolova N, Rashkov I. Poly(3-hydroxybuty-rate)-based hybrid materials with photocatalytic and magnetic prop-erties prepared by electrospinning and electrospraying. J Mater Sci.2014;49(5):2144–2153.
29. Ding YC, Wu Q, Zhao D, Ye W, Hanif M, Hou HQ. Flexible Pi/BaTiO3 dielectric nanocomposite fabricated by combining electro-spinning and electrospraying. Eur Polym J. 2013;49(9):2567–2571.
30. Lombardi M, Palmero P, Sangermano M, Varesano A. Electrospunpolyamide-6 membranes containing titanium dioxide as photocata-lyst. Polym Int. 2011;60(2):234–239.
31. An S, Lee MW, Joshi BN, Jo A, Jung J, Yoon SS. Water purifica-tion and toxicity control of chlorophenols by 3D nanofiber mem-branes decorated with photocatalytic titania nanoparticles. CeramInt. 2014;40(2):3305–3313.
32. Roso M, Sundarrajan S, Pliszka D, Ramakrishna S, Modesti M. Mul-tifunctional membranes based on spinning technologies: the synergyof nanofibers and nanoparticles. Nanotechnology. 2008;19(28):285707.
33. Nabe A, Staude E, Belfort G. Surface Modification of PolysulfoneUltrafiltration Membranes and Fouling by Bsa Solutions. J MembrSci. 1997;133(1):57–72.
34. Zodrow K, Brunet L, Mahendra S, Li D, Zhang A, Li Q, AlvarezPJJ. Polysulfone ultrafiltration membranes impregnated with silvernanoparticles show improved biofouling resistance and virusremoval. Water Res. 2009;43(3):715–723.
35. Chakrabarty B, Ghoshal AK, Purkait MK. Ultrafiltration of stableoil-in-water emulsion by polysulfone membrane. J Membr Sci. 2008;325(1):427–437.
36. Lima AA, Montalvao AF, Dezotti M, Sant’Anna GL. Ozonation of acomplex industrial effluent: oxidation of organic pollutants andremoval of toxicity. Ozone Sci Eng. 2006;28(1):3–8.
37. Li G, An T, Chen J, Sheng G, Fu J, Chen F, Zhang S, Zhao H. Pho-toelectrocatalytic decontamination of oilfield produced wastewatercontaining refractory organic pollutants in the presence of high con-centration of chloride ions. J Hazard Mater. 2006;138(2):392–400.
AIChE Journal February 2016 Vol. 62, No. 2 Published on behalf of the AIChE DOI 10.1002/aic 523
38. Westerhoff P, Moon H, Minakata D, Crittenden J. Oxidation oforganics in retentates from reverse osmosis wastewater reuse facili-ties. Water Res. 2009;43(16):3992–3998.
39. Buxton GV, Greenstock CL, Helman WP, Ross AB. Critical-reviewof rate constants for reactions of hydrated electrons, hydrogen-atomsand hydroxyl radicals (.Oh/.O-) in aqueous-solution. J Phys ChemRef Data. 1988;17(2):513–886.
40. Goldschmidt D, Watanabe M. X-ray-diffraction of polycrystallineTi4O7. Mater Res Bull. 1985;20(1):65–70.
41. Andersson S, Jahnberg L. Crystal structure studies on homologous seriesTinO2n-1 VnO2n-1 and Tin-2 Cr2O2n-1. Arkiv for Kemi. 1964;21(5):413.
42. Lepage Y, Strobel P. Structural chemistry of magneli phases TinO2n-1
(4� n� 9) .1. Cell and structure comparisons. J Solid State Chem.1982;43(3):314–319.
43. Li D, Xia Y. Electrospinning of nanofibers: reinventing the wheel?Adv Mater. 2004;16(14):1151–1170.
44. Walsh FC, Wills RGA. The continuing development of magneliphase titanium sub-oxides and Ebonex (R) electrodes. ElectrochimActa. 2010;55(22):6342–6351.
45. Bard AJ, Faulkner LR. Electrochemical Methods: Fundamentals andApplications. 2nd ed. New York, NY: Wiley, 2000.
46. Tremblay ML, Martin MH, Lebouin C, Lasia A, Guay D. Determi-nation of the real surface area of powdered materials in cavitymicroelectrodes by electrochemical impedance spectroscopy. Elec-trochima Acta. 2010;55(21):6283–6291.
47. Shi H. Activated carbons and double layer capacitance. ElectrochimActa. 1996;41(10):1633–1639.
48. Frackowiak E, Beguin F. Carbon materials for the electrochemicalstorage of energy in capacitors. Carbon. 2001;39(6):937–950.
49. Canizares P, Garcia-Gomez J, Lobato J, Rodrigo MA. Modeling of waste-water electro-oxidation processes part I. General description and applica-tion to inactive electrodes. Ind Eng Chem Res. 2004;43(9):1915–1922.
50. Chaplin BP, Schrader G, Farrell J. Electrochemical destruction of N-nitrosodimethylamine in reverse osmosis concentrates using boron-doped diamond film electrodes. Environ Sci Technol. 2010;44(11):4264–4269.
51. Yang J, Wang J, Jia JP. Improvement of electrochemical wastewatertreatment through mass transfer in a seepage carbon nanotube elec-trode reactor. Environ Sci Technol. 2009;43(10):3796–3802.
52. Tsierkezos NG, Ritter U. Electrochemical and thermodynamic prop-erties of hexacyanoferrate(II)/(III) redox system on multi-walled car-bon nanotubes. J Chem Thermodyn. 2012;54:35–40.
53. Schnoor MH, Vecitis CD. Quantitative examination of aqueous fer-rocyanide oxidation in a carbon nanotube electrochemical filter:effects of flow rate, ionic strength, and cathode material. J PhysChem C. 2013;117(6):2855–2867.
54. Haynes WM. CRC Handbook of Chemistry and Physics, 91st ed.Boca Raton, FL: Taylor & Francis, 2010.
Manuscript received July 1, 2015, and revision received Sep. 28, 2015.
524 DOI 10.1002/aic Published on behalf of the AIChE February 2016 Vol. 62, No. 2 AIChE Journal