Embed Size (px)
Citation preview
CHARACTERIZATION OF A REACTIVE DYE,
CIBACRON VIOLET P-2R, DURING AN
ELECTROCHEMICAL OXIDATION PROCESS
LAHTI UNIVERSITY OF APPLIED SCIENCES
Degree program in Environmental Technology
Environmental biotechnology
Bachelor`s Thesis
Autumn 2007
Teija Laakso
Lahti University of Applied Sciences Degree Program in Environmental Technology Faculty of Technology LAAKSO, TEIJA: Characterization of a reactive dye, Cibacron violet P-2R, dur-
ing an electrochemical oxidation process Bachelor’s Thesis in Environmental Biotechnology, 32 pages, 5 appendices Autumn 2007 __________________________________________________________________ ABSTRACT The aim of this study was to characterize the chemical changes in textile industrial wastewater containing dyes when electrochemical treatment is introduced. This study concentrated on one reactive dye, Cibacron Violet P-2R, and the changes that take place in each step of the electrochemical treatment process. Improvements for the electrochemical bulk oxidation conditions are also introduced to achieve the best pos-sible results. The work was commissioned by the Universitat Polytecnica de Catalunya in Terrassa. The project consisted of experimental working amidst the reactive dye selected of modifying the results to a more understandable form and of an analysis of the results. The characterization of the dye was accomplished with inftrared spectroscopy (FTIR) and UV-Vis spectroscopy. The electrochemical behaviour of the dye was studied us-ing an electrochemical technique called cyclic voltammetry. Electrochemical bulk oxidation of the dye was performed to achieve the required results. The oxidation products were analysed with FTIR and UV-Vis spectroscopy. The results showed that many changes take place in the chemical structure of the dye during the electrochemical oxidation process. Changes can also be seen before oxida-tion itself occurs. There are also changes in other parameters due to electrochemical oxidation, for example, in conductivity. Electrochemical oxidation is a functional way to treat textile industrial wastewaters but further research is required to obtain more reliability to the results achieved by this study.
Keywords: reactive dye, electrochemical oxidation, characterization, spectra
Lahden ammattikorkeakoulu Ympäristöteknologian koulutusohjelma Tekniikan laitos LAAKSO, TEIJA: Reaktiivisen väriaineen, Cibacron violet P-2R, identifiointi
elektrokemiallisen hapetusprosessin aikana Ympäristöbiotekniikan opinnäytetyö, 32 sivua, 5 liitesivu
Syksy 2007 __________________________________________________________________
TIIVISTELMÄ
Tässä työssä keskitytään tunnistamaan väriaineessa tapahtuvat kemialliset muutokset, kun tekstiiliteollisuuden jätevesiä käsitellään elektrokemiallisin menetelmin. Reaktii-vinen väriaine, jonka kemiallisia muutoksia seurattiin, on nimeltään Cibacron Violet P-2R. Työn tarkoituksena oli seurata, millaisia muutoksia väriaineen kemiallisessa rakenteessa tapahtuu elektrokemiallisen hapetuksen eri vaiheissa. Työssä on esitetty kehitysehdotuksia tekstiiliteollisuuden jäteveden elektrokemialliseen hapetukseen.
Työssä väriaineen tunnistus tapahtui käyttämällä kahta tunnistusmenetelmää: Infra-puna spektroskopiaa (FTIR) ja UV-Vis spektrometriaa. Väriainetta hapetettiin elekt-rokemiallisesti käyttämällä apuna syklistä voltametria. Elektrokemialliset hapetus-tuotteet, joita menetelmässä syntyi, analysoitiin käyttämällä FTIR ja UV-Vis spekt-rometria. Työn tarkoituksena on myös optimoida elektrokemiallisen hapetuksen olo-suhteet siten, että häiriötekijöitä ei esiinny tuloksissa.
Tulokset osoittivat, että väriaineen kemiallisessa rakenteessa tapahtui monia muutok-sia elektrokemiallisen hapetuksen aikana. Elektrokemiallinen hapetus vaikuttaa myös muihin olosuhteisiin (esim. sähkönjohtokyky) ja tämä on hyvä huomioida lisätutki-muksia tehdessä.
Laboratoriomittakaavassa saatujen tulosten perusteella menetelmä soveltuu valitun väriaineen käsittelyyn jätevedessä, mutta tarkemmat tutkimukset ovat tarpeen, jotta olisi mahdollista saada tarkempia tuloksia väriaineen kemiallisessa rakenteessa tapah-tuneista muutoksista.
Avainsanat: reaktiivinen väriaine, elektrokemiallinen hapetus, kemiallinen rakenne
CONTENTS
1 INTRODUCTION ..................................................................................................... 1
2 DYES AND OTHER CHEMICALS IN THIS STUDY ........................................... 2
2.1 Reactive dyes ..................................................................................................... 2
2.2 Azo dyes............................................................................................................. 3
2.3 Other chemicals.................................................................................................. 3
3 METHODS FOR WASTEWATER ANALYSIS IN THIS
STUDY......................................................................................................................... 4
3.1 Ultraviolet-visible spectrophotometer................................................................ 4
3.2 Fourier Transform Infrared ................................................................................ 5
3.3 Electrochemical techniques and Cyclic Voltammetry ....................................... 5
4 EXPERIMENTS........................................................................................................ 7
4.1 Experimental initial conditions .......................................................................... 7
4.2 Measurements .................................................................................................... 9
4.2.1 UV-Vis ...................................................................................................... 9
4.2.2 FTIR........................................................................................................ 10
4.3 Electrochemical treatment................................................................................ 11
4.3.1 Tests with Blank solution........................................................................ 13
4.3.2 pH and conductimeter ............................................................................. 13
5 RESULTS AND DISCUSSION.............................................................................. 14
5.1 Concentration of the dye solution during the experiment................................ 14
5.2 Changes in the chemical structure of the dye .................................................. 16
5.3 Electrochemical oxidation results with water diluted dye solution ................. 20
5.4 Electrochemical oxidation results with other solvents..................................... 24
5.5 Conductivity and pH results............................................................................. 26
5.6 Improvements in the conditions of the electrochemical bulk oxidation .......... 26
6 CONCLUSIONS ..................................................................................................... 27
REFERENCES ........................................................................................................... 29
APPENDICES ............................................................................................................ 33
1
1 INTRODUCTION
These days the production of coloured textiles is one of the basic technologies. Tex-
tile consumption is steadily increasing in many countries, primarily in Asia, but also
worldwide due to the growth of world population. This has led to a situation where
coloured textiles are produced on a large industrial scale. Before textiles were mainly
dyed with plant dyes and the use of animal dyes was restricted only to special cases.
Today, plant dyes have more or less been left aside and synthetic dyes have taken
their place. (Leube 2003, 339-340).
In textile industry the high water consumption makes it important to study the reuse
of wastewaters. Many different treatments have been studied to make textile waste-
waters reusable. ( Bes-Piá, Mendoza-Roca, Alcaina-Miranda, A. Iborra-Clar, M.I.
Iborra-Clar 2002). Textile industrial wastewaters can be treated with various tech-
niques. Available technologies are, for example, biological treatment, chemical pre-
cipitation, ultra filtration, carbon adsorption, and oxidation with ozone. The main
problems with these techniques lie in the lacking efficiency of pollutant reduction and
the cost of treatment for the large amount of wastewaters. (Demmin & Andco 1988).
The use of electrochemical techniques for the treatment of industrial effluents and
process streams is rapidly increasing (Scott 1995, 119). Traditionally, wastewaters
from textile industry are treated biologically, physically or chemically. Various com-
binations of these techniques are also applied. By means of electrochemical oxida-
tion, pollutants in wastewaters can be mineralised. (Xuejun, Zhemin, Xiaolong,
Yaobo&Wenhua 2005)
In this study, a reactive azo dye, Violet Cibacron, was studied to gain information on
the changes in the chemical structure after electrochemical oxidation. The objective
of this study was to identify the chemical groups that react in electrochemical oxida-
tion and to optimize the conditions during oxidation. The experimental part took eight
2
weeks and during that time different methods were introduced to characterize textile
industrial wastewater. The experimental part of the study was accomplished in the re-
search laboratory of Universitat Polytecnica de Catalunya (UPC).
2 DYES AND OTHER CHEMICALS IN THIS STUDY
2.1 Reactive dyes
Reactive dyes were discovered in 1954. After this research into reactive dyes became
intensive and it still continues today. According to Hunger world textile production
has grown steadily. Dye manufacturers have concentrated on producing dyes for the
two most important textile fibres: cotton and polyester. The geographical focus of dye
production lies in Germany, England and Switzerland. (Hunger 2003, 1-2).
Reactive dyes can be classified in five chemical groups: azo (including metallized
azo), triphendioxazine, phthalocyanine, formazan and anthraquinone. Reactive dyes
form a covalent bond with the fiber. The existence of the covalent bond makes it pos-
sible to gain excessively high washfastness properties by rather simple dyeing meth-
ods. (Hunger 2003, 3). According to Hunger (2003, 3) "A marked advantage of reac-
tive dyes over direct dyes is that their chemical structures are much simpler, their ab-
sorption spectra show narrower absorption bands, and the dyeings are brighter."
3
2.2 Azo dyes
The azo dyes account for over 50% of all commercial dyes and the dyes in this class
have been studied more than any other class. Azo dyes contain usually one to three
azo groups (-N=N-). Four or more azo groups can also be found but more rarely.
Gregory and Hunger (2003) describe the structure of azo groups in the following
way: “Azo group is attached to two groups, of which at least one, but more usually
both, are aromatic.” Usually the most reactive dyes are in the class of azo dyes.
(Hunger 2003, 14)
Apart from the textile industry azo dyes are also used as chromophores in diffusion-
transfer imaging systems. Photography industry utilizes azo dyes in many other ways.
For example, azo dyes apply in colour masking and in silver dye bleach process.
(Filosa 2003, 519-520)
2.3 Other chemicals
To study the textile industrial wastewaters many chemicals are needed. For infrared
spectroscopy potassium bromide is often applied. Bases and acids are generally the
two most important substances to adjust the pH. Sodium hydroxide (NaOH) is one of
the most commonly used bases.
Potassium bromide (KBr) is a salt. It is colourless to white solid that is odourless. It is
soluble in water and neutral in solution. (Material safety data sheet 2003). These days
potassium bromide is used as a laboratory reagent and a veterinary drug. For dogs
and cats it is used to control epilepsy and seizures. (Foster & Smith 2007). Potassium
bromide is used as a sedative in cattle and other animals. Previously potassium bro-
4
mide was applied as a sedative also in humans. (The European Agency for the
Evaluation of Medicinal Products 1999).
Sodium hydroxide (NaOH) is an odourless manufactured substance. At room tem-
perature, sodium hydroxide is a white crystalline solid that is very corrosive. In gen-
eral, it is in solid form when it absorbs moisture from the air. (Agency for Toxic Sub-
stances and Disease Registry 2007). Sodium hydroxide may produce heat when di-
luted with water or when in contact with moisture. It is a strong base and that may be
hazardous to the environment. (International Occupational Safety and Health Infor-
mation Centre (CIS) 2007).
Dimethylformamide (DMF) is colourless to yellow liquid. It produces toxic fumes
when heated. (International Occupational Safety and Health Information Centre (CIS)
2004). Dimethylformamide has a production volume over 1 million pounds per year
in the U.S. and this makes the chemical a high production volume chemical (Score-
card 2005). Dimethylformamide is used as an industrial solvent in utilizing to process
polymer fibres among other things. Therefore, the exposure to this chemical usually
occurs at work. (Environmental Protection Agency 2007).
3 METHODS FOR WASTEWATER ANALYSIS IN THIS STUDY
3.1 Ultraviolet-visible spectrophotometer
An ultraviolet-visible spectrophotometer (UV-Vis) is a device which analyzes on
which degree a given sample absorbs different spectra of light. The device functions
in the visible and ultraviolet wavelengths. A more simple way to express the function
of UV-Vis spectrophotometer is to state that it analyses the colour of the sample.
(Everything 2, 2005). Wikipedia (2007) clarifies the function of the devise in the fol-
5
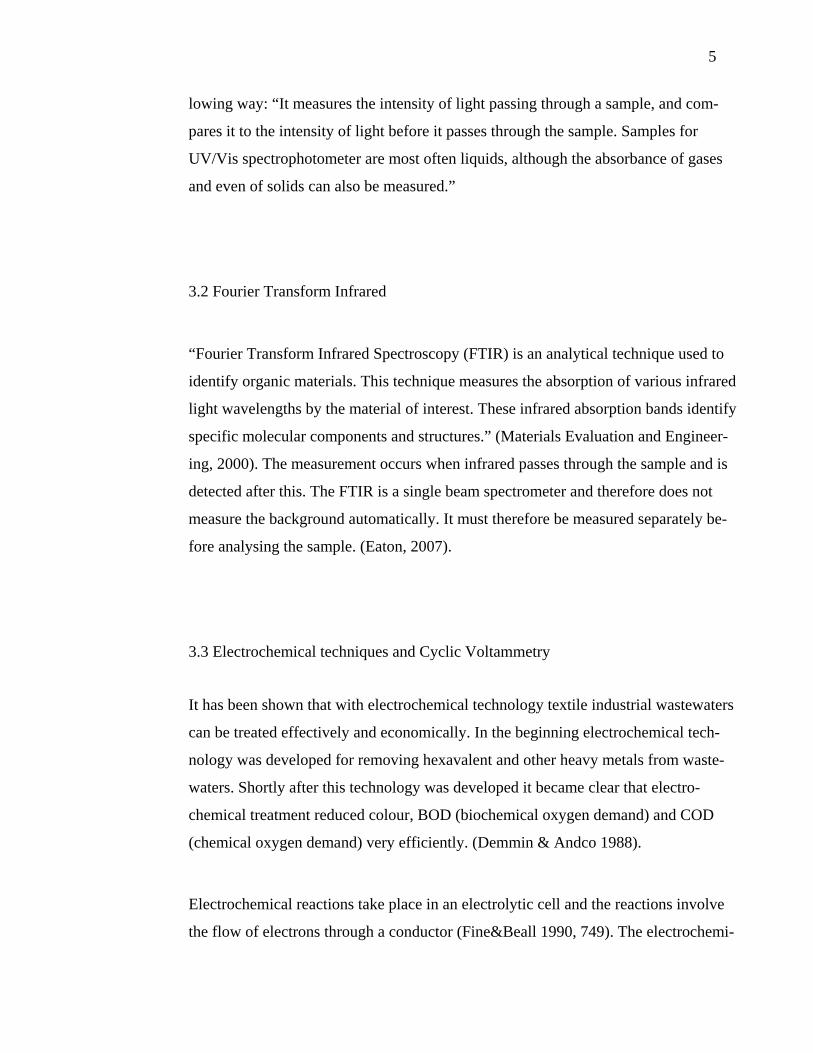
lowing way: “It measures the intensity of light passing through a sample, and com-
pares it to the intensity of light before it passes through the sample. Samples for
UV/Vis spectrophotometer are most often liquids, although the absorbance of gases
and even of solids can also be measured.”
3.2 Fourier Transform Infrared
“Fourier Transform Infrared Spectroscopy (FTIR) is an analytical technique used to
identify organic materials. This technique measures the absorption of various infrared
light wavelengths by the material of interest. These infrared absorption bands identify
specific molecular components and structures.” (Materials Evaluation and Engineer-
ing, 2000). The measurement occurs when infrared passes through the sample and is
detected after this. The FTIR is a single beam spectrometer and therefore does not
measure the background automatically. It must therefore be measured separately be-
fore analysing the sample. (Eaton, 2007).
3.3 Electrochemical techniques and Cyclic Voltammetry
It has been shown that with electrochemical technology textile industrial wastewaters
can be treated effectively and economically. In the beginning electrochemical tech-
nology was developed for removing hexavalent and other heavy metals from waste-
waters. Shortly after this technology was developed it became clear that electro-
chemical treatment reduced colour, BOD (biochemical oxygen demand) and COD
(chemical oxygen demand) very efficiently. (Demmin & Andco 1988).
Electrochemical reactions take place in an electrolytic cell and the reactions involve
the flow of electrons through a conductor (Fine&Beall 1990, 749). The electrochemi-
6
cal reaction often involves two separate reactions that can take place simultaneously.
These processes are initiated by the transfer of charge. To gain reactions electrodes
must be placed in conducting liquids or salts. At a cathodic surface, the process in-
volves the reduction of species by the impact of electrons whereas the other process
involves the oxidation of species at an anodic surface. (Scott 1991, 4).
According to the education material of New Mexico state university:
“Cyclic voltammetry is the most widely used technique for acquiring qualita-tive information about electrochemical reactions. The power of cyclic voltam-metry results from its ability to rapidly provide considerable information on the thermodynamics of redox processes and the kinetics of heterogeneous electron-transfer reactions, and on coupled chemical reactions or adsorption processes. Cyclic voltammetry consists of scanning linearly the potential of a stationary working electrode, using a triangular potential waveform. Depending on the in-formation sought, single or multiple cycles can be used. During the potential sweep, the potentiostat measures the current resulting from the applied poten-tial. The resulting plot of current vs. potential is termed a cyclic voltammogram. The cyclic voltammogram is a complicated, time-dependent function of a large number of physical and chemical parameters.” (New Mexico state university, 2007).
The possibility to observe the reduction wave and the oxidation wave simultaneously
is useful when studying the electrode processes. From the cyclic voltammograms,
electrode kinetic and electrosorption processes can be studied in detail. (Installation
and Diagnostics Guide for Autolab with PGSTAT30, 2000).
7
4 EXPERIMENTS
4.1 Experimental initial conditions
The study was conducted in a research laboratory of UPC, Terrassa. The reactive dye,
Violet Cibacron, was studied in water solutions and in two other solvents: ethanol and
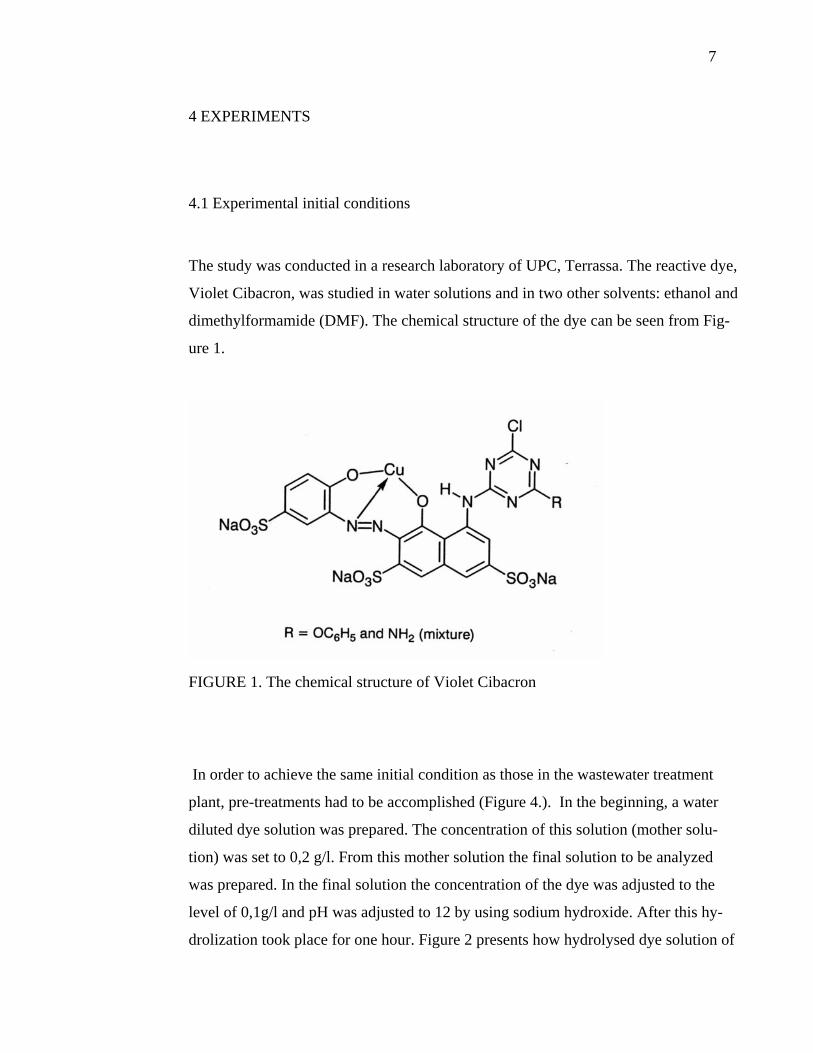
dimethylformamide (DMF). The chemical structure of the dye can be seen from Fig-
ure 1.
FIGURE 1. The chemical structure of Violet Cibacron
In order to achieve the same initial condition as those in the wastewater treatment
plant, pre-treatments had to be accomplished (Figure 4.). In the beginning, a water
diluted dye solution was prepared. The concentration of this solution (mother solu-
tion) was set to 0,2 g/l. From this mother solution the final solution to be analyzed
was prepared. In the final solution the concentration of the dye was adjusted to the
level of 0,1g/l and pH was adjusted to 12 by using sodium hydroxide. After this hy-
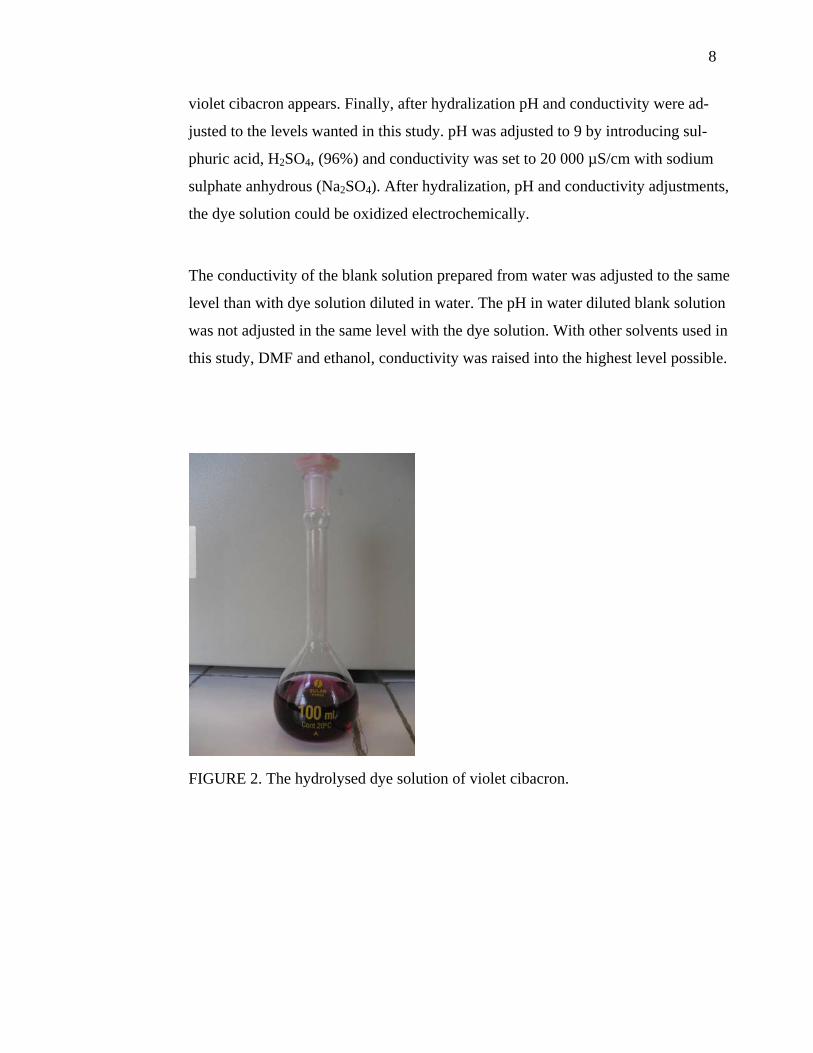
drolization took place for one hour. Figure 2 presents how hydrolysed dye solution of
8
violet cibacron appears. Finally, after hydralization pH and conductivity were ad-
justed to the levels wanted in this study. pH was adjusted to 9 by introducing sul-
phuric acid, H2SO4, (96%) and conductivity was set to 20 000 µS/cm with sodium
sulphate anhydrous (Na2SO4). After hydralization, pH and conductivity adjustments,
the dye solution could be oxidized electrochemically.
The conductivity of the blank solution prepared from water was adjusted to the same
level than with dye solution diluted in water. The pH in water diluted blank solution
was not adjusted in the same level with the dye solution. With other solvents used in
this study, DMF and ethanol, conductivity was raised into the highest level possible.
FIGURE 2. The hydrolysed dye solution of violet cibacron.
9
4.2 Measurements
4.2.1 UV-Vis
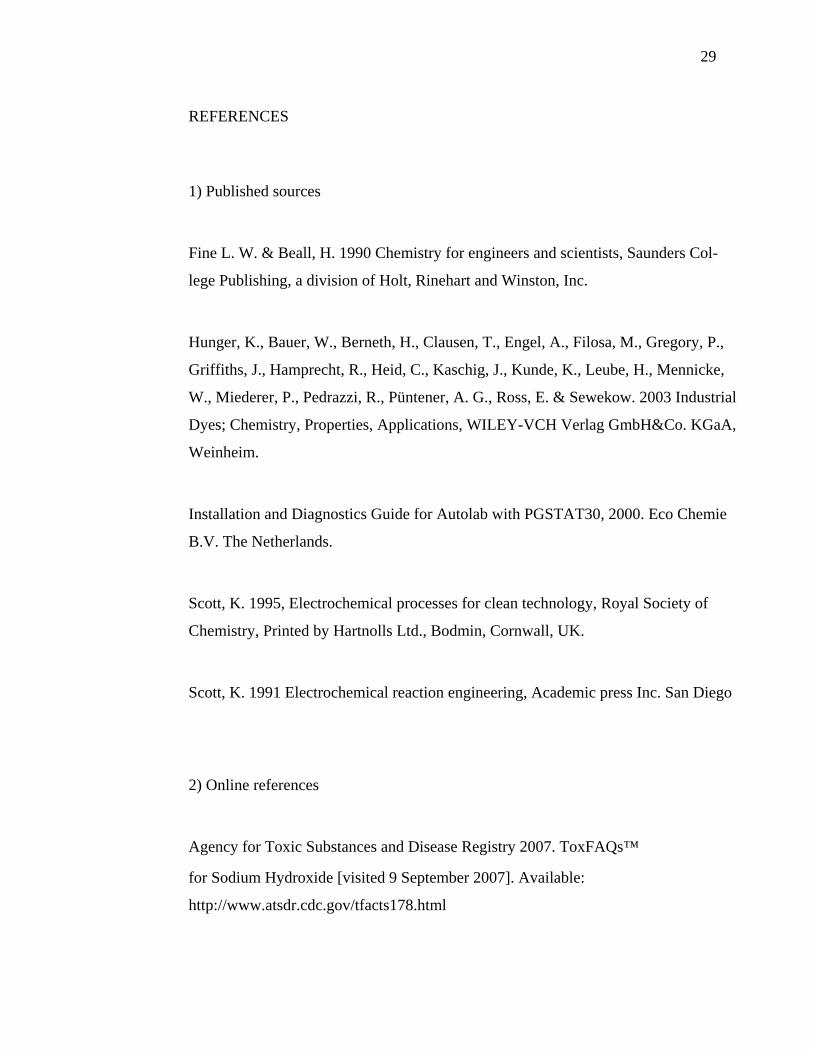
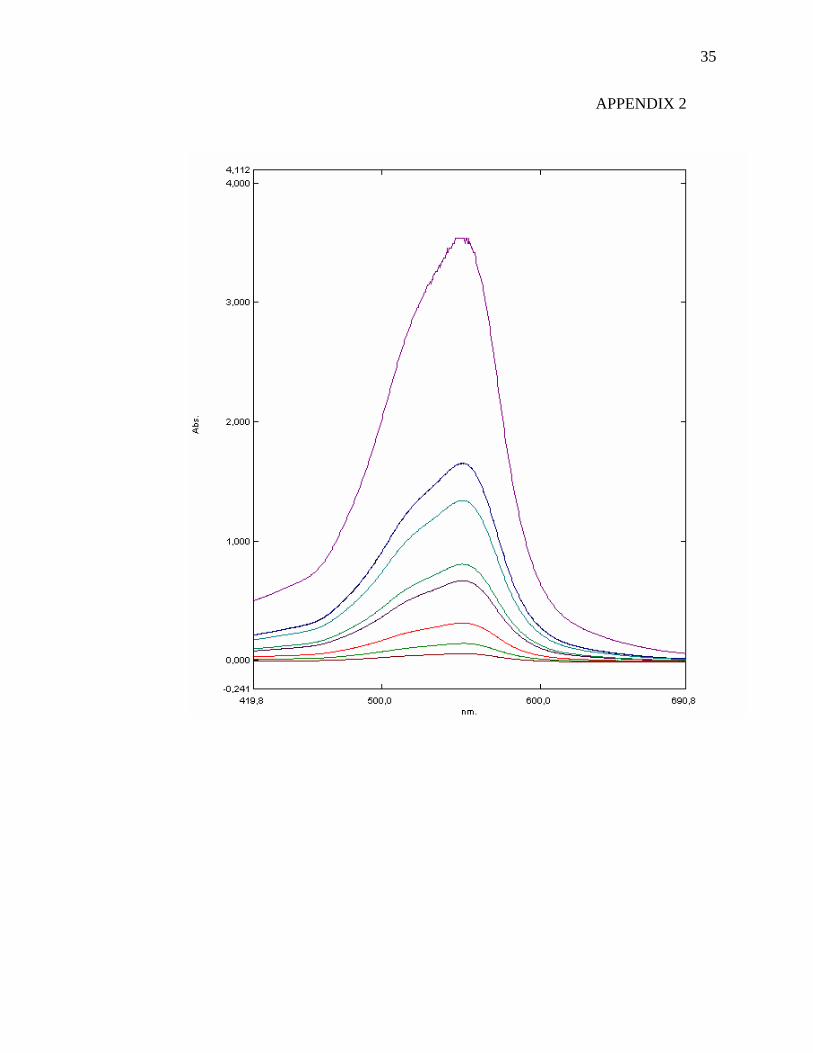
In the beginning, the wave length where maximum absorbance appears with the dye
was studied. Afterwards, a calibration line was created to see the dependency be-
tween absorbance and concentration (APPENDIX 1). The Calibration line was cre-
ated by using these absorbance levels obtained from the previous tests (APPENDIX
2). Absorbance from 190 to 900 nm was measured with UV-VIS recording spectro-
photometer UV-2401 PC.
Concentration of the original dye solution (concentration 0,1 g/l) was pursued for 12
days to presage if any changes occur spontaneously. In order to confirm that the ini-
tial concentration has not changed during different treatments, ultraviolet spectrome-
ter was applied in each stage of the process:
1) Dye solution with pH 12 and concentration 0,1 g/l.
2) Dye solution after hydralization
3) Dye solution after pH and conductivity adjustment
4) Dye solution after electrochemical oxidation
10
4.2.2 FTIR
To characterize the changes in chemical structure of the dye, infrared spectrometer
was used during the process. Infrared spectra were collected four times (Figure 4). In
this study spectrometer Avatar System 320 was applied in order to gain the infrared
spectra. As a detector there was DTGS KBr. Mirror velocity of the spectrometer was
0.6329. For every sample infrared spectrum was collected between 4000 and 500 cm-
1.
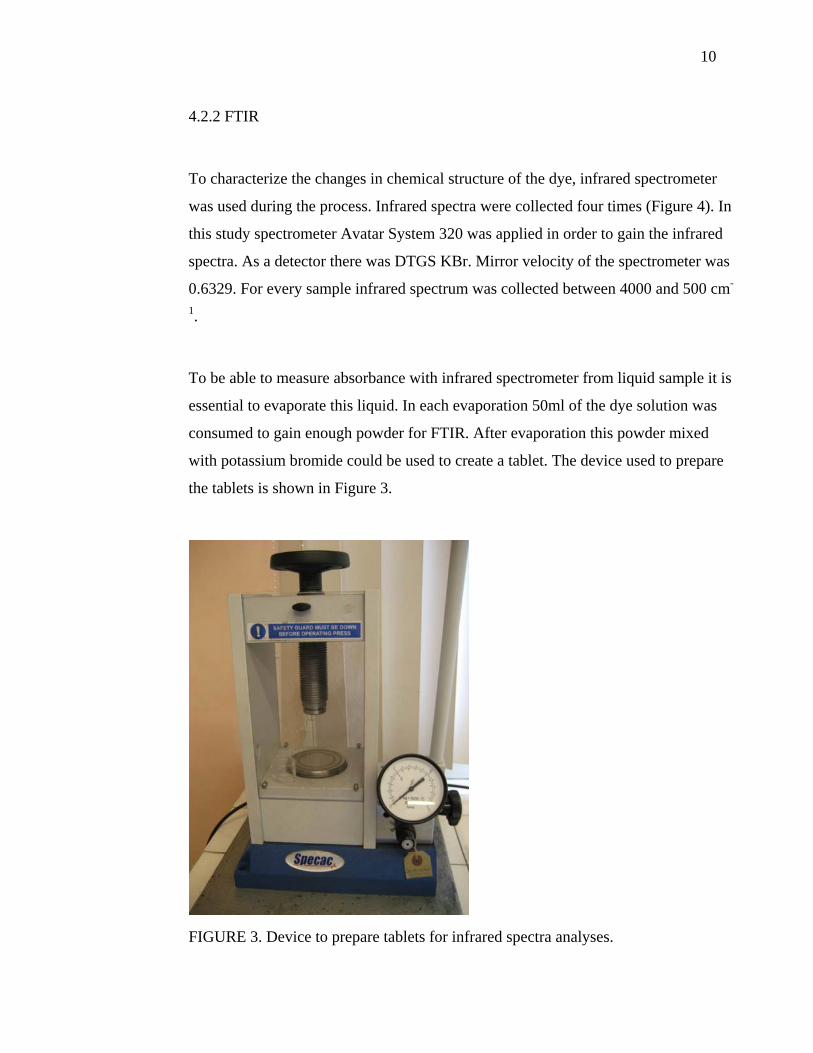
To be able to measure absorbance with infrared spectrometer from liquid sample it is
essential to evaporate this liquid. In each evaporation 50ml of the dye solution was
consumed to gain enough powder for FTIR. After evaporation this powder mixed
with potassium bromide could be used to create a tablet. The device used to prepare
the tablets is shown in Figure 3.
FIGURE 3. Device to prepare tablets for infrared spectra analyses.
11
Absorbance for each tablet was measured twice: right after preparing the tablet and
after retaining it in the oven for 24 hours. The temperature in the oven was 60 de-
grees. The purpose of keeping the tablets in the oven for 24 hours was to remove
moisture.
The components of interest in this study are: -SO3Na, N=N, N-H, -NH2,
1,3,5-triazine, benzene, naphthalene, 1-oxygenbenzene, 1-nitrogenbenzene and 1-
chlorinetriazine.
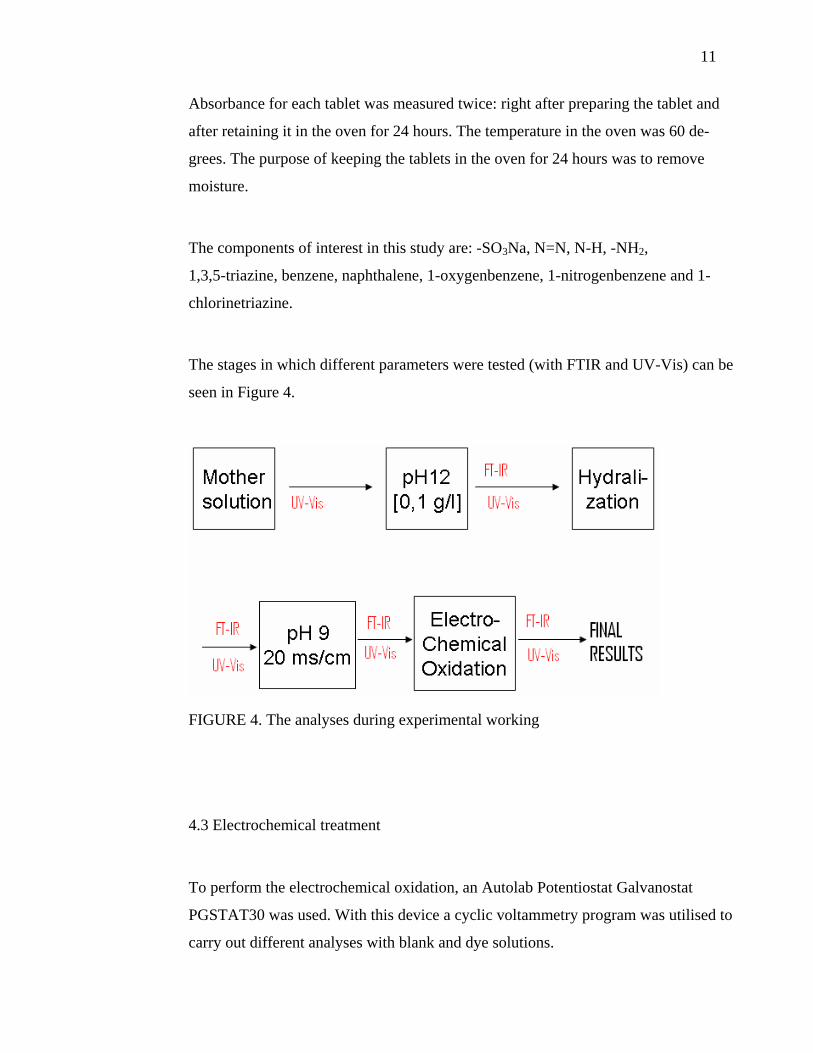
The stages in which different parameters were tested (with FTIR and UV-Vis) can be
seen in Figure 4.
FIGURE 4. The analyses during experimental working
4.3 Electrochemical treatment
To perform the electrochemical oxidation, an Autolab Potentiostat Galvanostat
PGSTAT30 was used. With this device a cyclic voltammetry program was utilised to
carry out different analyses with blank and dye solutions.
12
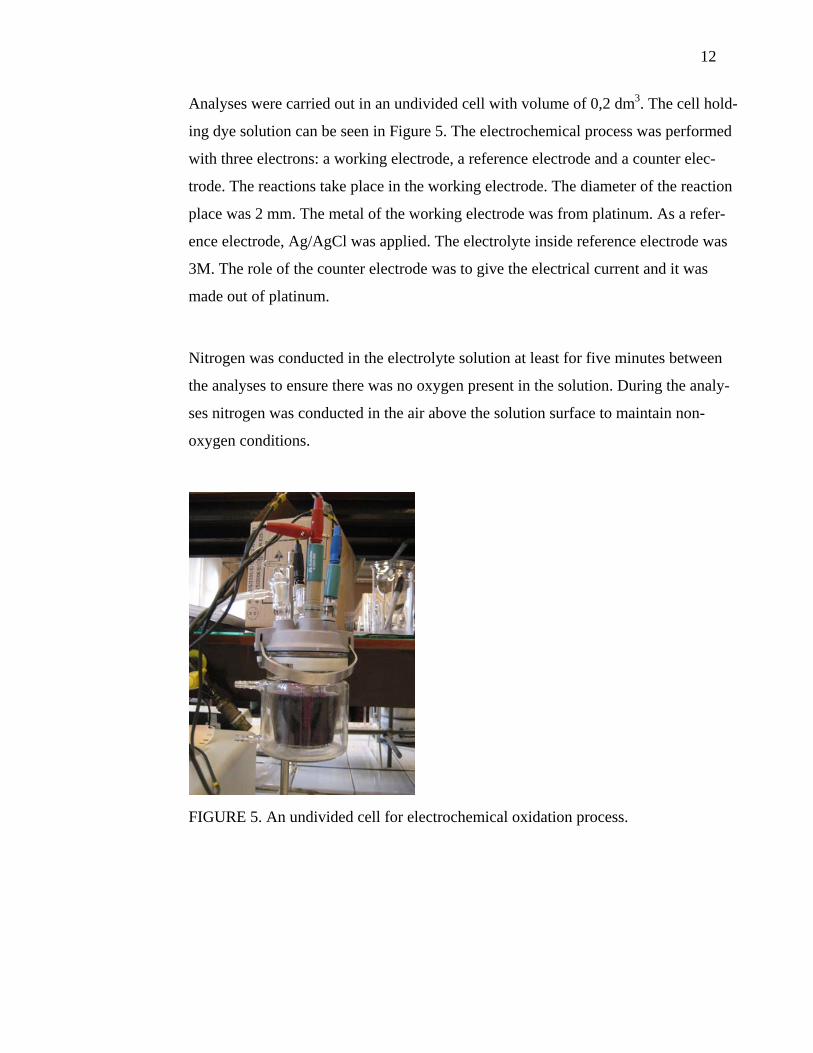
Analyses were carried out in an undivided cell with volume of 0,2 dm3. The cell hold-
ing dye solution can be seen in Figure 5. The electrochemical process was performed
with three electrons: a working electrode, a reference electrode and a counter elec-
trode. The reactions take place in the working electrode. The diameter of the reaction
place was 2 mm. The metal of the working electrode was from platinum. As a refer-
ence electrode, Ag/AgCl was applied. The electrolyte inside reference electrode was
3M. The role of the counter electrode was to give the electrical current and it was
made out of platinum.
Nitrogen was conducted in the electrolyte solution at least for five minutes between
the analyses to ensure there was no oxygen present in the solution. During the analy-
ses nitrogen was conducted in the air above the solution surface to maintain non-
oxygen conditions.
FIGURE 5. An undivided cell for electrochemical oxidation process.
13
4.3.1 Tests with Blank solution
The effects of different experimental parameters were tested with water diluted blank
solution in order to see how these affect the results. Each parameter was tested sev-
eral times to confirm that different parameters will not cause interference on the final
results. There will be more discussion on the tested parameters later.
Most of the analyses were performed with two scans, step potential at 0,00244 V and
scan rate at 0,05 V/s. Nitrogen input was generally five minutes between analyses.
Whenever a magnetic mixer was applied the speed was set on 500 RPM.
The first cleaning technique for the working electrode included simply wiping of the
electrode surface between analyses. The second cleaning technique contained three
stages. First, the electrode surface was wiped with a cloth. After this, the electrode
was rinsed with three different solvents: toluene, alcohol and water (in this order).
For the final infrared spectrometer analyses two different dye solutions were oxidized
for 24 hours. One dye solution was water diluted and the other was dimethyleforma-
mide diluted. Nitrogen was conducted to the air space in the cell to ensure non oxy-
gen conditions during analyses. After 24 hours of oxidation, the solutions were
evaporated to prepare the tablets for the FTIR analysis.
4.3.2 pH and conductimeter
In this study a Crison pH meter and a conductimeter were used to measure these pa-
rameters. The model of conductimeter was 522 and for pH meter it was GLP21.
When calibrating the pH meter original Crison buffer solutions were applied (pH 7.00
and 4.01). pH meter was calibrated every day before the use.
14
pH was measured in each pre-treatment before electrochemical oxidation as well as
before and after electrochemical oxidation to see if the treatment had had some im-
pact on this parameter. Conductivity was measured before and after oxidation to see
if there had been any changes due to electrochemical oxidation.
5 RESULTS AND DISCUSSION
5.1 Concentration of the dye solution during the experiment
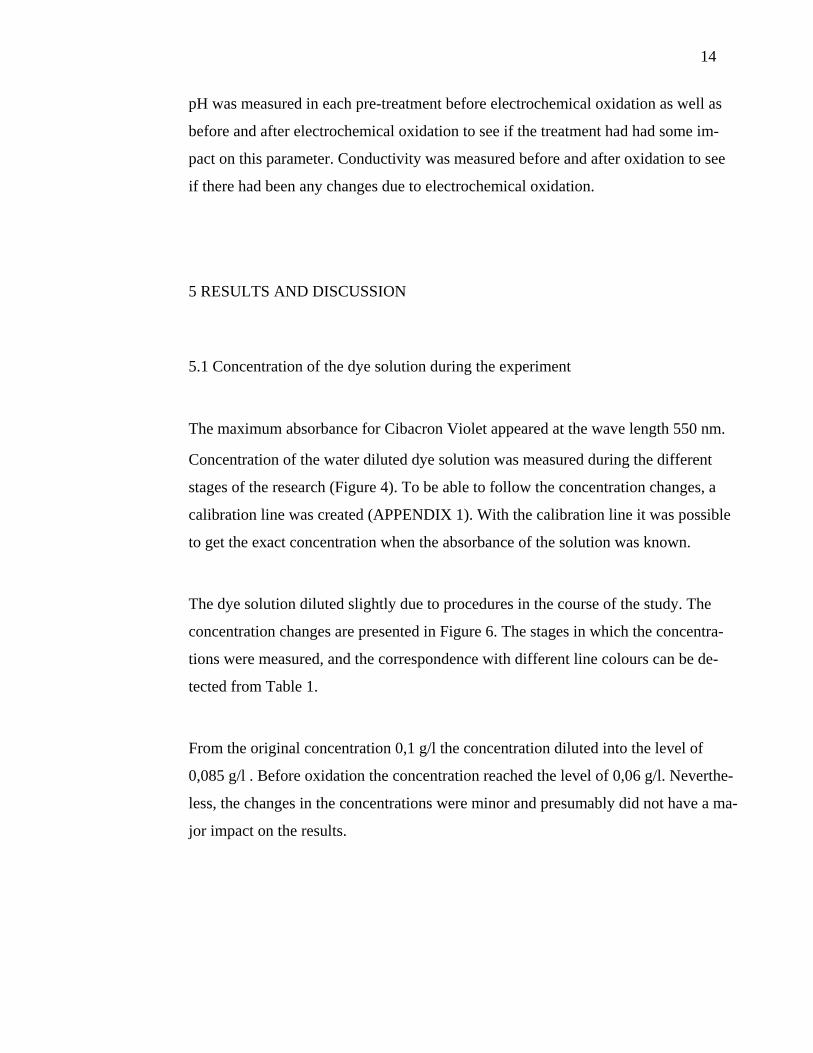
The maximum absorbance for Cibacron Violet appeared at the wave length 550 nm.
Concentration of the water diluted dye solution was measured during the different
stages of the research (Figure 4). To be able to follow the concentration changes, a
calibration line was created (APPENDIX 1). With the calibration line it was possible
to get the exact concentration when the absorbance of the solution was known.
The dye solution diluted slightly due to procedures in the course of the study. The
concentration changes are presented in Figure 6. The stages in which the concentra-
tions were measured, and the correspondence with different line colours can be de-
tected from Table 1.
From the original concentration 0,1 g/l the concentration diluted into the level of
0,085 g/l . Before oxidation the concentration reached the level of 0,06 g/l. Neverthe-
less, the changes in the concentrations were minor and presumably did not have a ma-
jor impact on the results.
15
TABLE 1. The correspondence with different line colours for Figure 6.
Line colour Analysis stage
Blue In the beginning*
Black After pH adjustment
Brown After hydralization
Pink After pH and conductivity adjustment
Green After oxidation
* before pH adjustment
FIGURE 6. Concentrations of the water diluted dye solution during the study
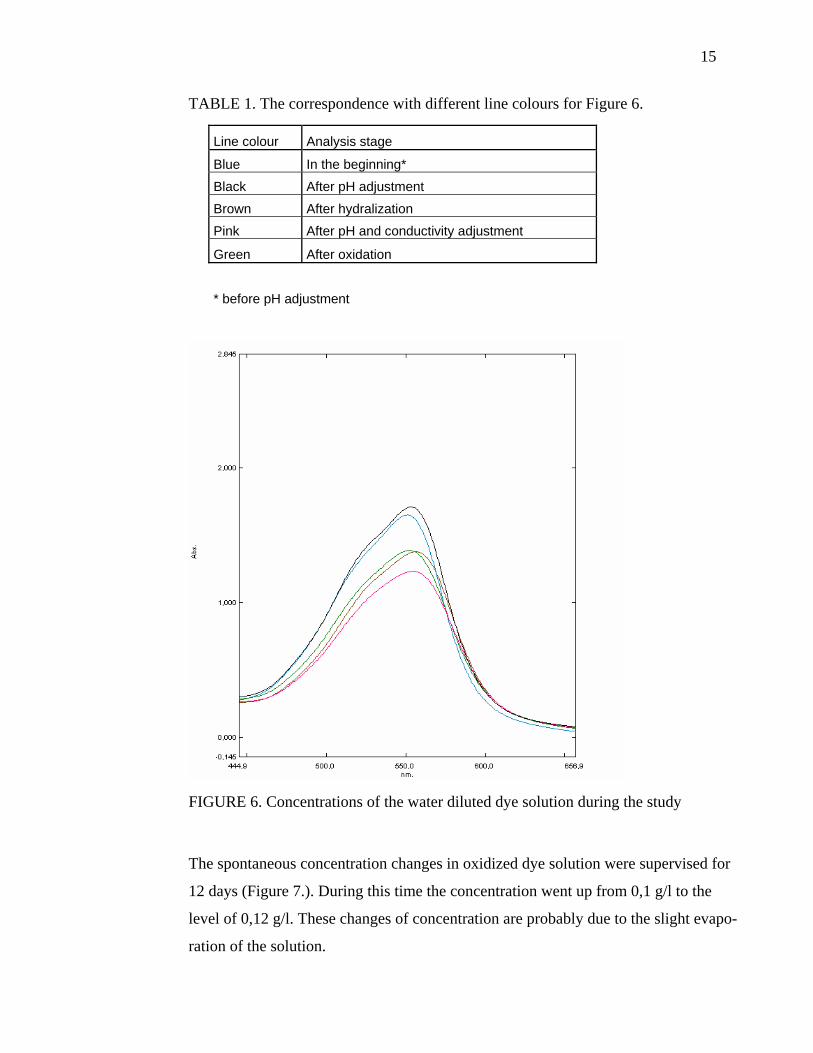
The spontaneous concentration changes in oxidized dye solution were supervised for
12 days (Figure 7.). During this time the concentration went up from 0,1 g/l to the
level of 0,12 g/l. These changes of concentration are probably due to the slight evapo-
ration of the solution.
16
In Figure 7 the green line is a result of the analysis on day 1. The black line is meas-
ured on day 6 and the blue line is measured on day 12.
FIGURE 7. Spontaneous concentration changes on water diluted dye solution.
5.2 Changes in the chemical structure of the dye
The characterisation of the chemical structure was challenging due to the feature of
the evaporated dye solution powder. When preparing the tablets for the FTIR analy-
ses the same mass of the dye could not be used at every stage because the spectra
achieved with the same mass were not always in good quality.
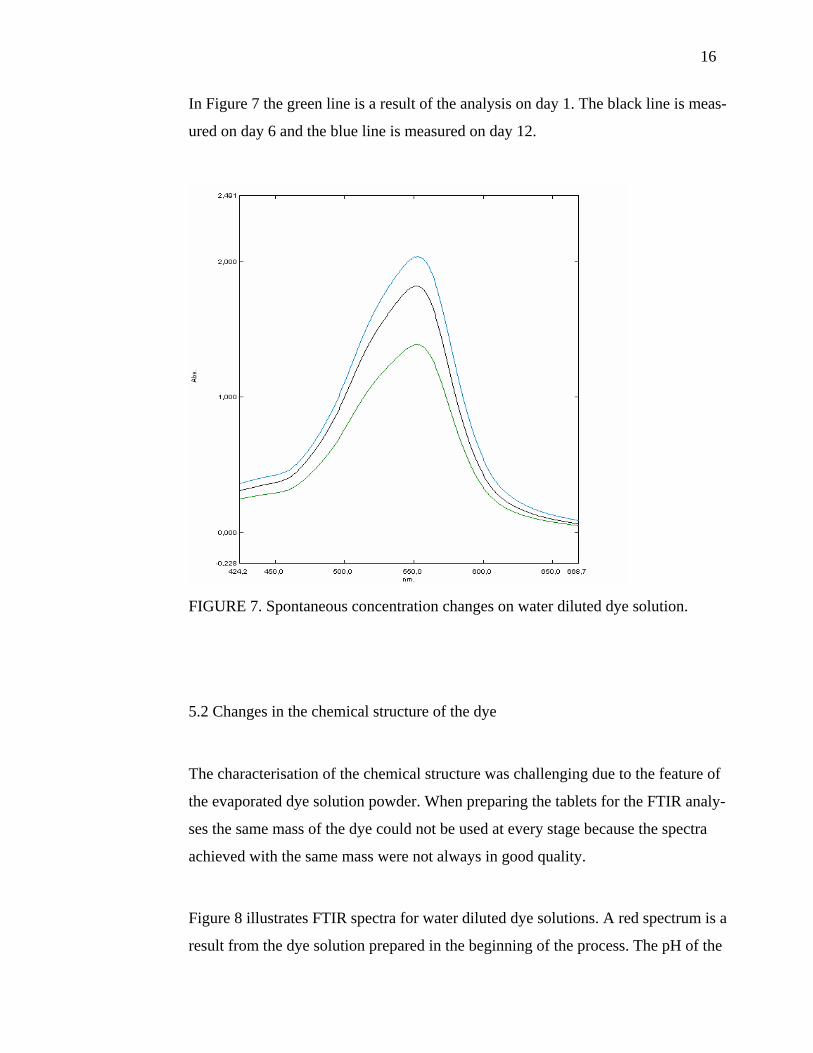
Figure 8 illustrates FTIR spectra for water diluted dye solutions. A red spectrum is a
result from the dye solution prepared in the beginning of the process. The pH of the
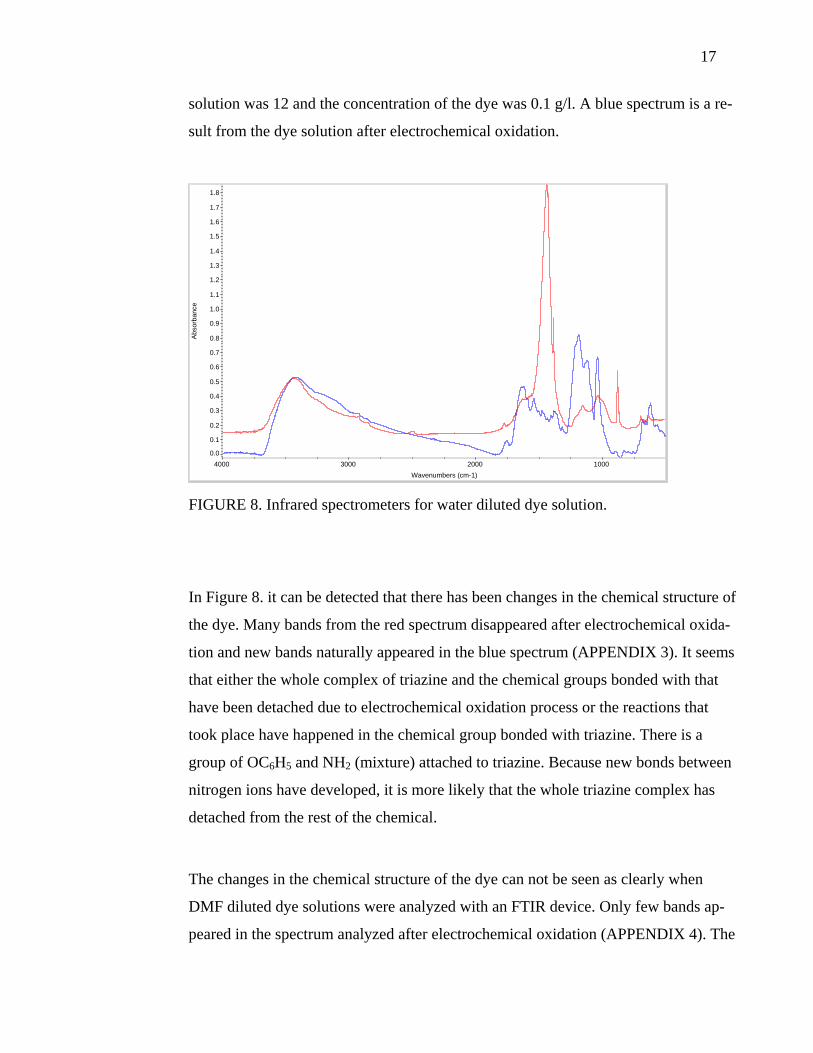
17
solution was 12 and the concentration of the dye was 0.1 g/l. A blue spectrum is a re-
sult from the dye solution after electrochemical oxidation.
0.0
0.1
0.2
0.3
0.4
0.5
0.6
0.7
0.8
0.9
1.0
1.1
1.2
1.3
1.4
1.5
1.6
1.7
1.8Ab
sorb
ance
1000 2000 3000 4000 Wavenumbers (cm-1)
FIGURE 8. Infrared spectrometers for water diluted dye solution.
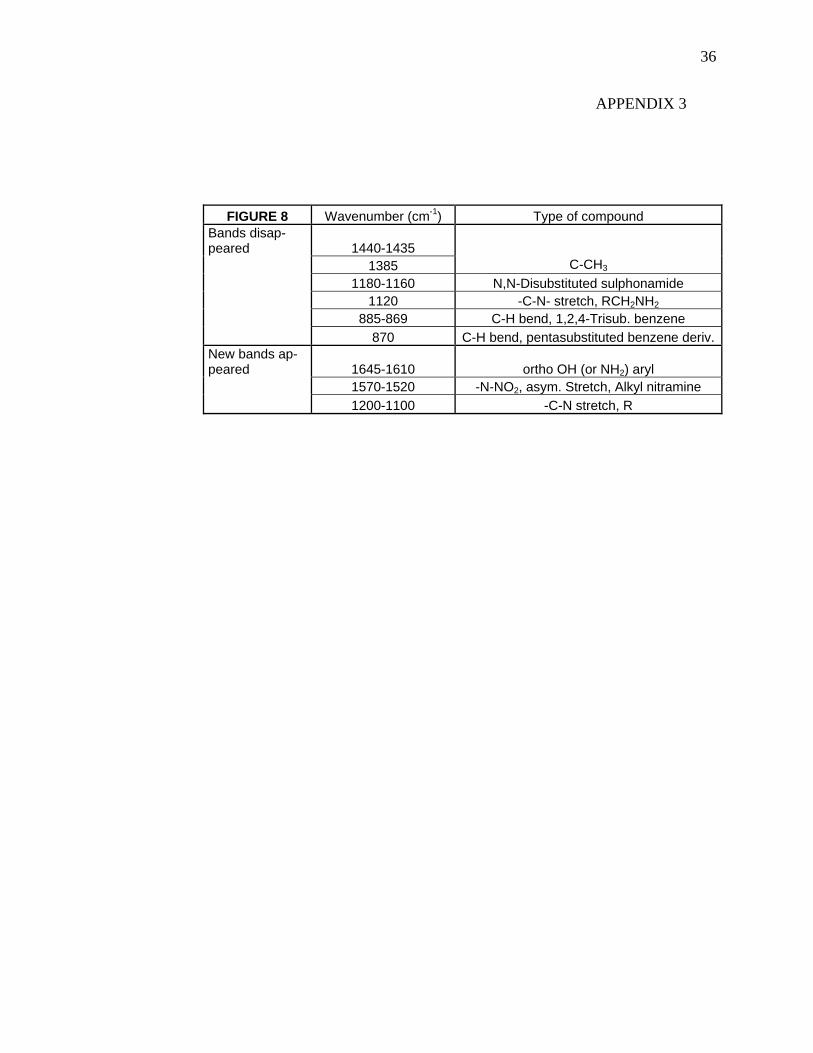
In Figure 8. it can be detected that there has been changes in the chemical structure of
the dye. Many bands from the red spectrum disappeared after electrochemical oxida-
tion and new bands naturally appeared in the blue spectrum (APPENDIX 3). It seems
that either the whole complex of triazine and the chemical groups bonded with that
have been detached due to electrochemical oxidation process or the reactions that
took place have happened in the chemical group bonded with triazine. There is a
group of OC6H5 and NH2 (mixture) attached to triazine. Because new bonds between
nitrogen ions have developed, it is more likely that the whole triazine complex has
detached from the rest of the chemical.
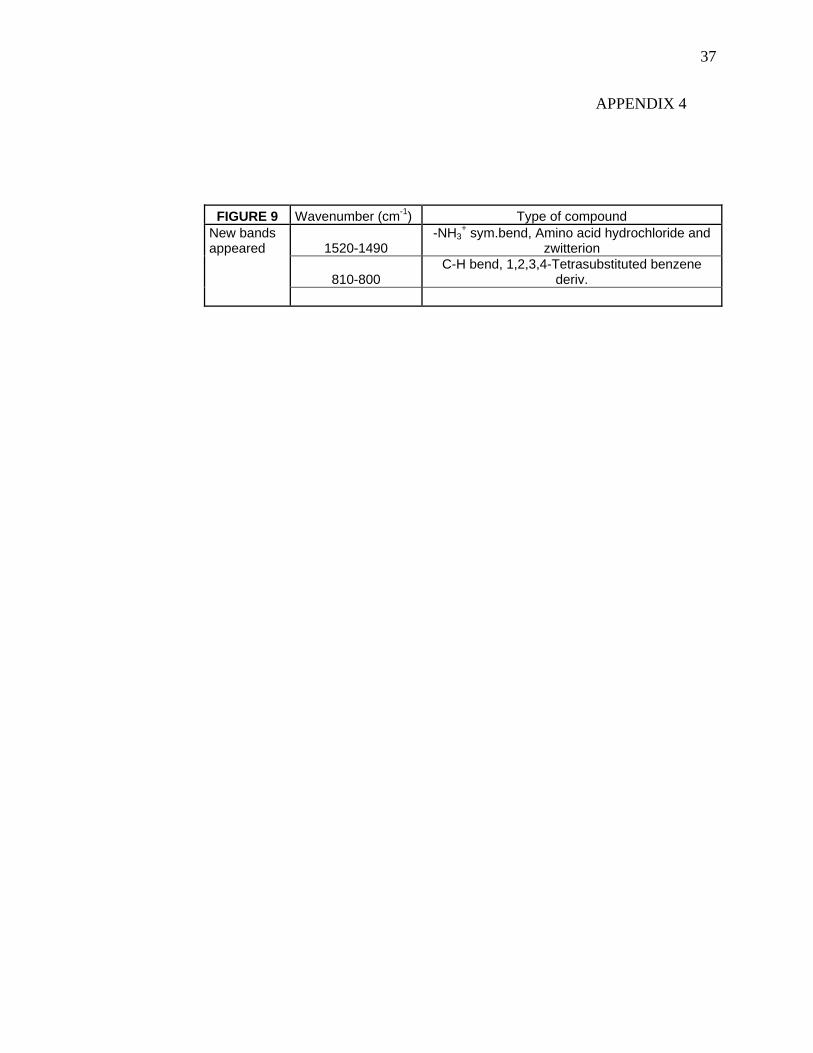
The changes in the chemical structure of the dye can not be seen as clearly when
DMF diluted dye solutions were analyzed with an FTIR device. Only few bands ap-
peared in the spectrum analyzed after electrochemical oxidation (APPENDIX 4). The
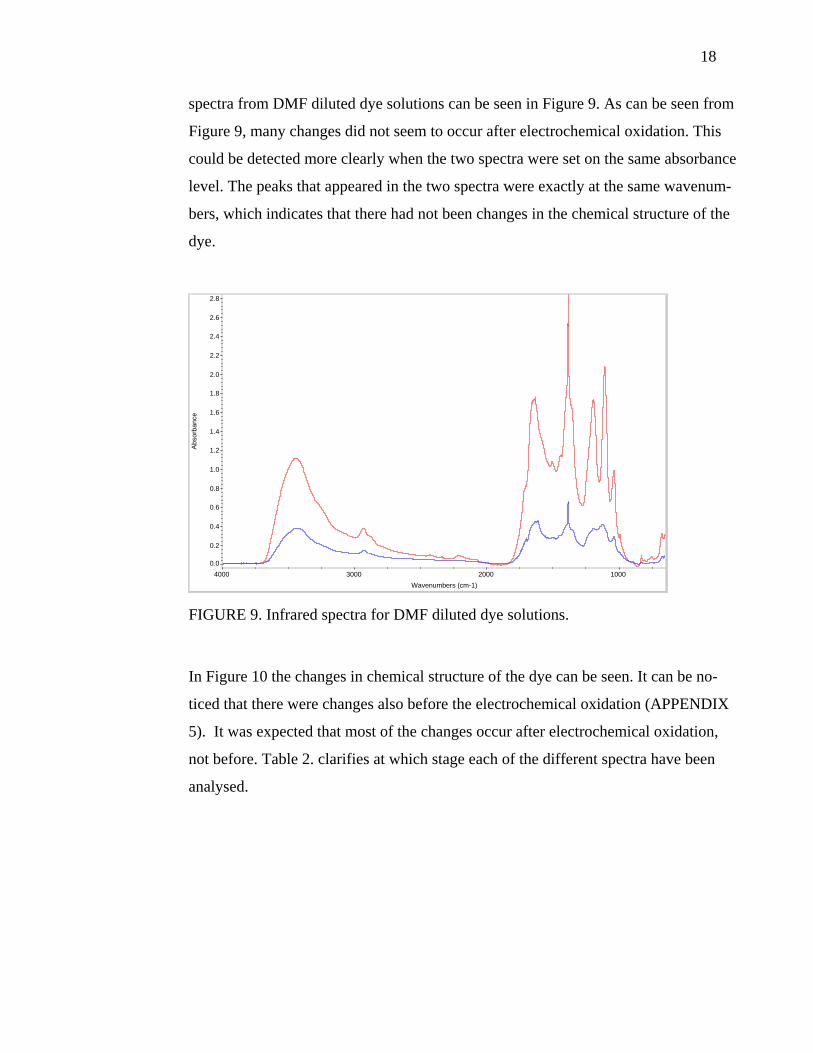
18
spectra from DMF diluted dye solutions can be seen in Figure 9. As can be seen from
Figure 9, many changes did not seem to occur after electrochemical oxidation. This
could be detected more clearly when the two spectra were set on the same absorbance
level. The peaks that appeared in the two spectra were exactly at the same wavenum-
bers, which indicates that there had not been changes in the chemical structure of the
dye.
0.0
0.2
0.4
0.6
0.8
1.0
1.2
1.4
1.6
1.8
2.0
2.2
2.4
2.6
2.8
Abso
rban
ce
1000 2000 3000 4000 Wavenumbers (cm-1)
FIGURE 9. Infrared spectra for DMF diluted dye solutions.
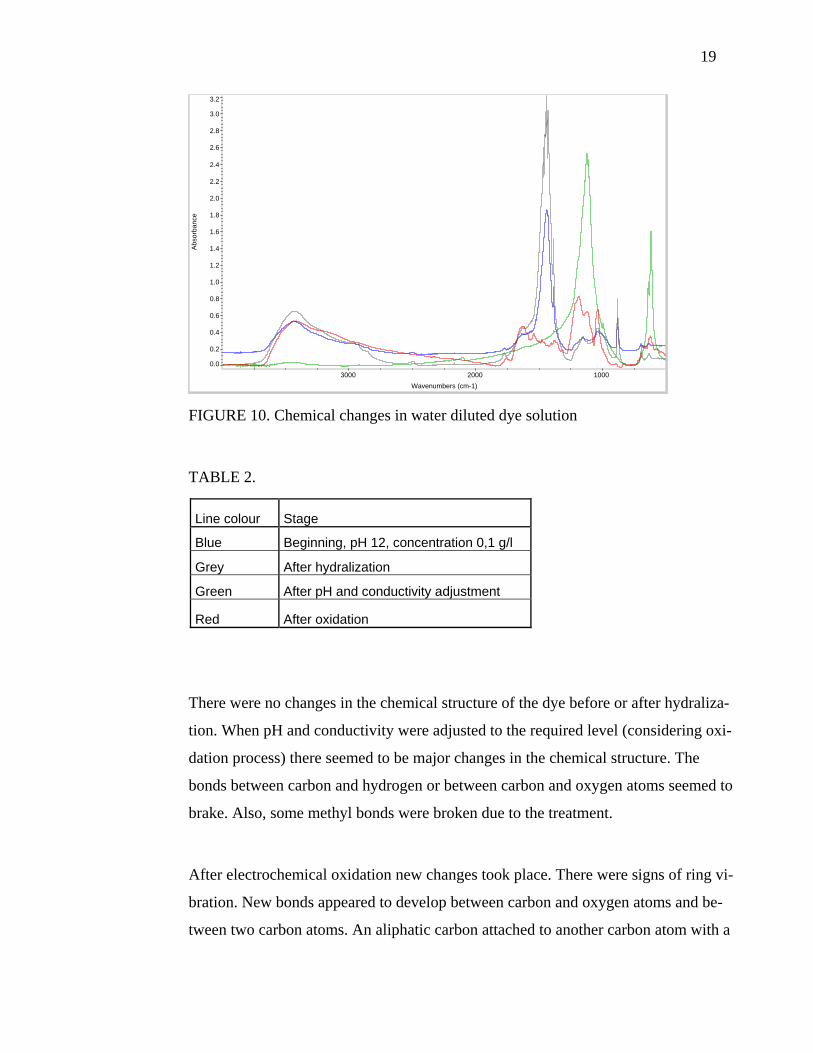
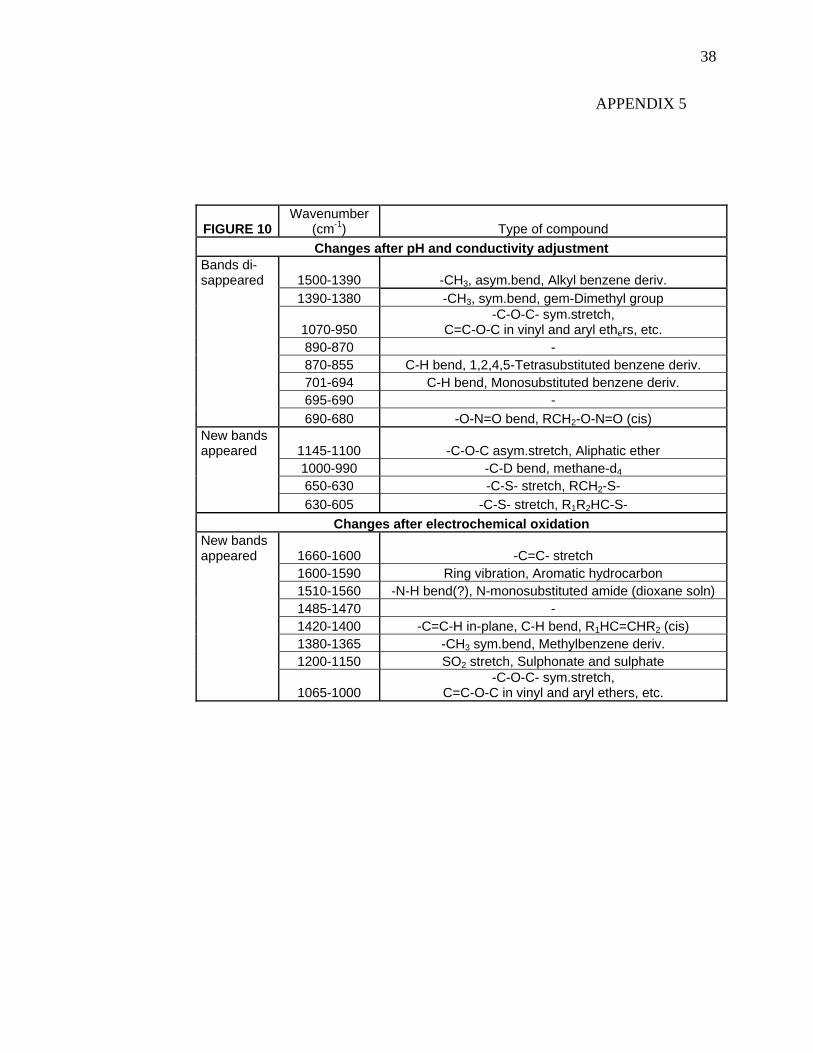
In Figure 10 the changes in chemical structure of the dye can be seen. It can be no-
ticed that there were changes also before the electrochemical oxidation (APPENDIX
5). It was expected that most of the changes occur after electrochemical oxidation,
not before. Table 2. clarifies at which stage each of the different spectra have been
analysed.
19
0.0
0.2
0.4
0.6
0.8
1.0
1.2
1.4
1.6
1.8
2.0
2.2
2.4
2.6
2.8
3.0
3.2
Abso
rban
ce
1000 2000 3000 Wavenumbers (cm-1)
FIGURE 10. Chemical changes in water diluted dye solution
TABLE 2.
Line colour Stage
Blue Beginning, pH 12, concentration 0,1 g/l
Grey After hydralization
Green After pH and conductivity adjustment
Red After oxidation
There were no changes in the chemical structure of the dye before or after hydraliza-
tion. When pH and conductivity were adjusted to the required level (considering oxi-
dation process) there seemed to be major changes in the chemical structure. The
bonds between carbon and hydrogen or between carbon and oxygen atoms seemed to
brake. Also, some methyl bonds were broken due to the treatment.
After electrochemical oxidation new changes took place. There were signs of ring vi-
bration. New bonds appeared to develop between carbon and oxygen atoms and be-
tween two carbon atoms. An aliphatic carbon attached to another carbon atom with a
20
double bond appeared to the spectrum and this possibly means that the structure of
benzene ring has broken. Sulphur dioxide could also be detected from the spectra af-
ter electrochemical oxidation.
5.3 Electrochemical oxidation results with water diluted dye solution
In this study the results achieved with cyclic voltammetry are not in standard scale. In
order to convert the results in standard scale, Nernst Equation is required.
1) EHNE(AgCl/Ag) = E0(AgCl/Ag) + (RT/mF)* ln [Cl-]
E0(AgCl/Ag)=0,2221V R=8,314 J/Kmol T=25 0C = 298,15 K m=1 F= 96485,338 C/mol [Cl-]= 3M EHNE(AgCl/Ag) = 0,2221V + [(8,314 J/Kmol*298,15 K)/(1*96485,338 C/mol)]*ln3 = 0,2503 V An example with 2V: 2) EHNE = V + EHNE(AgCl/Ag) = 2V + 0,2503 V = 2,2503 V
When having, for example, 2 V at the result scale it would equal 2,2503 V on a
standard scale.
The effects of different parameters tested varied. All of them (1-7) were tested several
times.
1) various times of nitrogen input into the solution (from five to fifteen minutes)
2) two different cleaning techniques for the working electrode
21
3) various speeds in scanning (from 0.05 to 1 V/s)
4) various analyses orders and starting points
5) various voltage zones and directions of the scans
6) using/not using magnetic mixer
7) various quantity of scans (between two and ten)
From the tested parameters, points 1 to 2 did not seem to have any effect on the re-
sults. Using a faster scan rate (3) the voltammograms achieved were slightly noisier
but the difference was not major. Various analyses orders or starting points of the
scans did not give any different results.
Various quantities of scans showed difference in results. With only two scans all the
reactions could not be seen as clearly as with ten scans. Therefore the analyses meas-
ured afterwards were accomplished with ten scans.
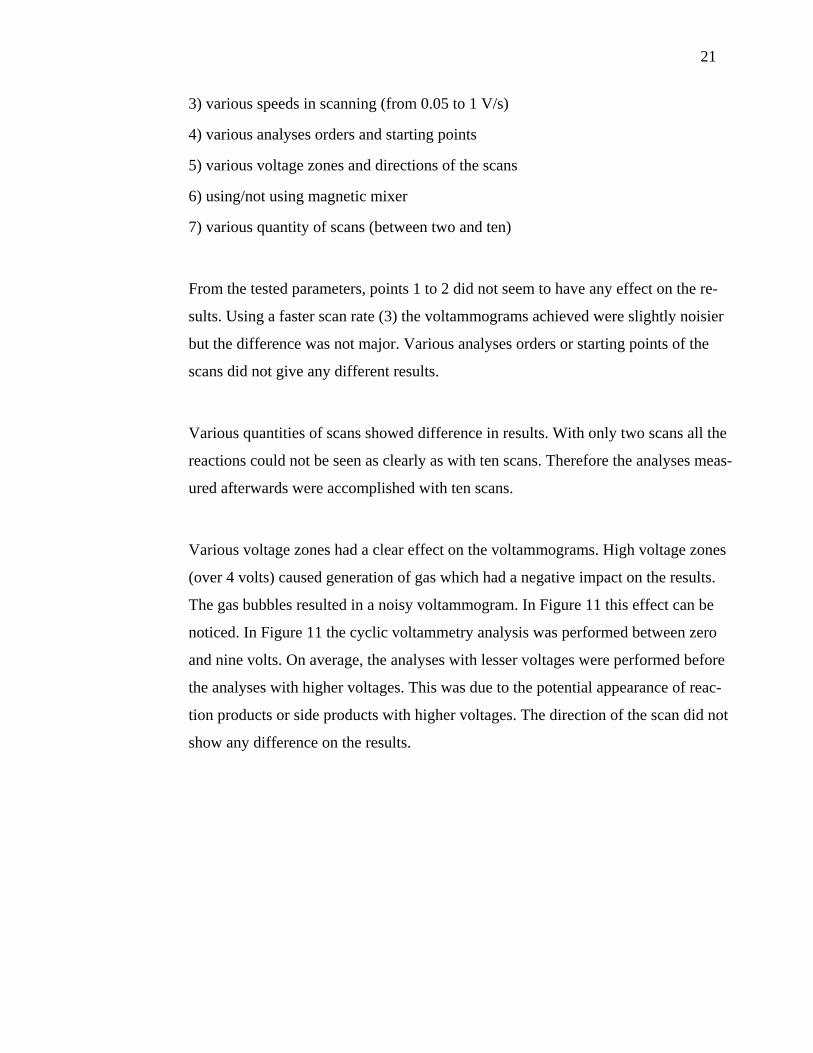
Various voltage zones had a clear effect on the voltammograms. High voltage zones
(over 4 volts) caused generation of gas which had a negative impact on the results.
The gas bubbles resulted in a noisy voltammogram. In Figure 11 this effect can be
noticed. In Figure 11 the cyclic voltammetry analysis was performed between zero
and nine volts. On average, the analyses with lesser voltages were performed before
the analyses with higher voltages. This was due to the potential appearance of reac-
tion products or side products with higher voltages. The direction of the scan did not
show any difference on the results.
22
Water based Blank solution
-2,00E-020,00E+002,00E-024,00E-026,00E-028,00E-021,00E-01
0,00E+00
2,00E+00
4,00E+00
6,00E+00
8,00E+00
1,00E+01
0 to 9 volts
Water diluted blank solution
FIGURE 11. Voltammogram for water diluted blank solution with high volts
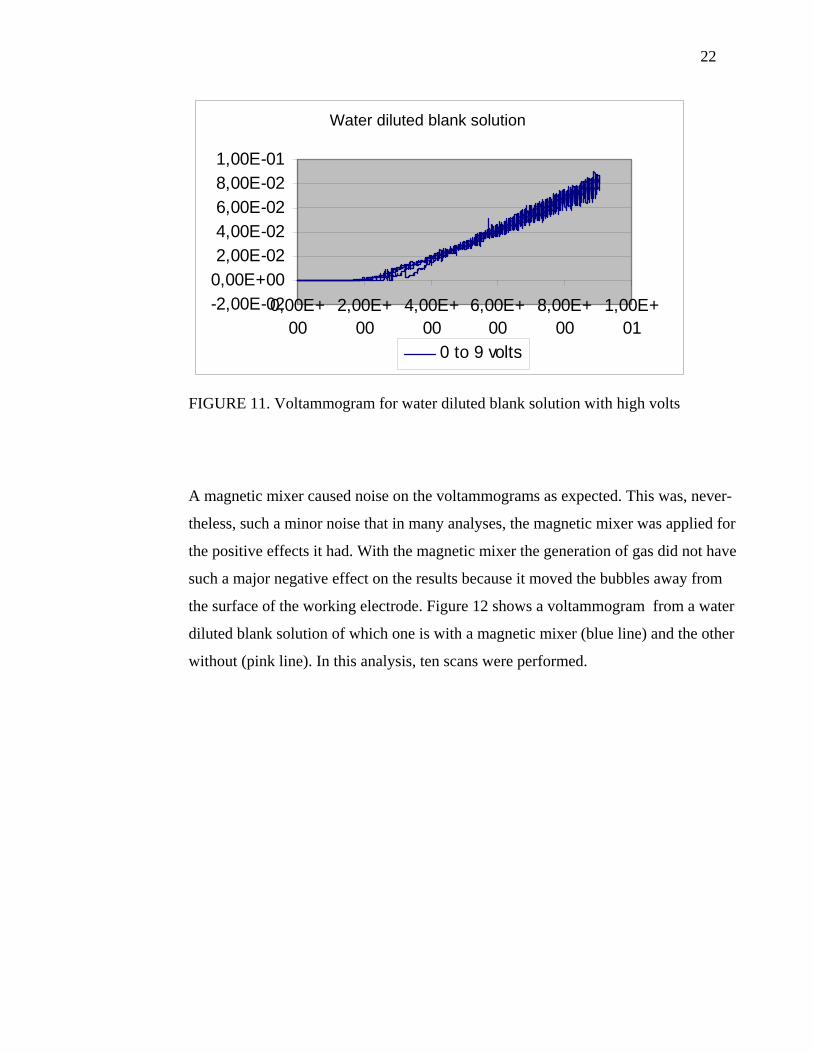
A magnetic mixer caused noise on the voltammograms as expected. This was, never-
theless, such a minor noise that in many analyses, the magnetic mixer was applied for
the positive effects it had. With the magnetic mixer the generation of gas did not have
such a major negative effect on the results because it moved the bubbles away from
the surface of the working electrode. Figure 12 shows a voltammogram from a water
diluted blank solution of which one is with a magnetic mixer (blue line) and the other
without (pink line). In this analysis, ten scans were performed.
23
Water based blank solution
-0,000006-0,000004-0,000002
00,0000020,0000040,000006
-1 -0,5 0 0,5 1
Volts
Am
pere
Water diluted blank solution
FIGURE 12. Voltammogram with and without magnetic mixer
The voltage zone in which the ten scans took place was from -0.5 to 0.5 volts. On this
voltage zone, no reactions were detected.
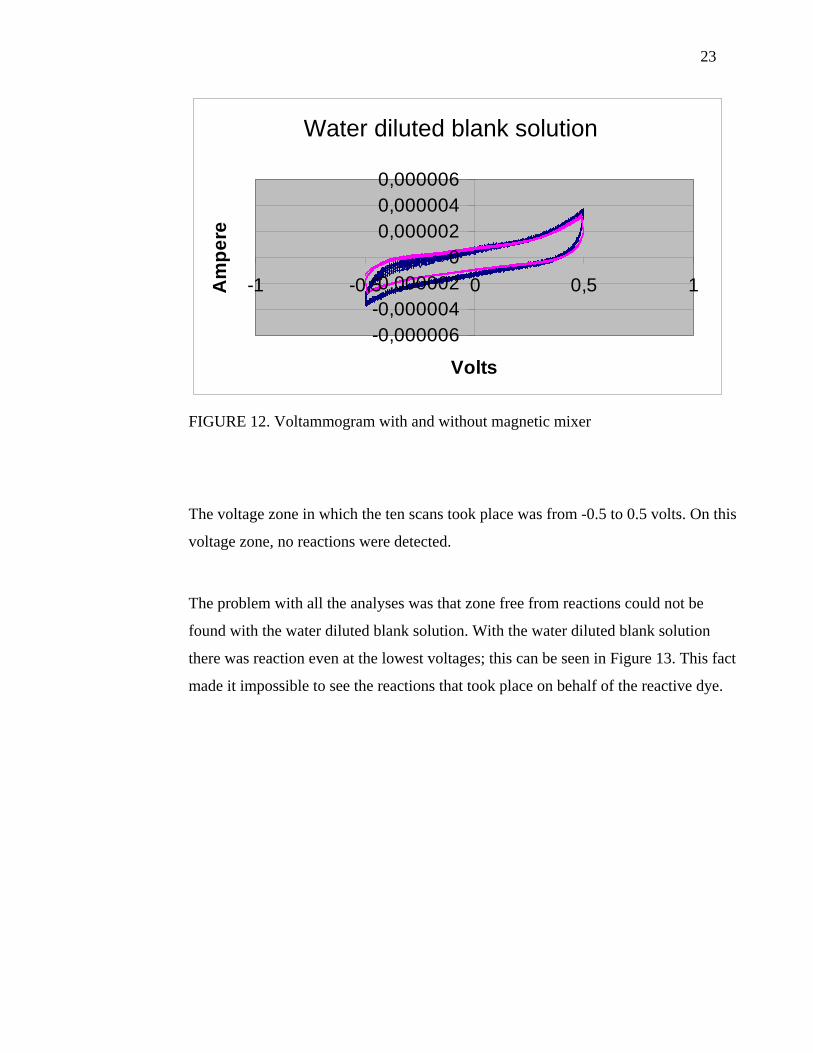
The problem with all the analyses was that zone free from reactions could not be
found with the water diluted blank solution. With the water diluted blank solution
there was reaction even at the lowest voltages; this can be seen in Figure 13. This fact
made it impossible to see the reactions that took place on behalf of the reactive dye.
24
Water based blank solution
-1,50E-05-1,00E-05-5,00E-060,00E+005,00E-061,00E-051,50E-05
-1 -0,5 0 0,5 1
volts
ampere
-0.75 to 0.75 volts
Water diluted blank solution
FIGURE 13. Reaction with water diluted blank solution
In Figure 13 the reactions that took place on these voltages can be seen at -0.3 volts
and at -0.5 volts. With ten scans the reactions could be seen clearly. Earlier, when the
same voltage zone was applied, the reactions could not be detected in the analyses.
5.4 Electrochemical oxidation results with other solvents
In order to achieve proper results from electrochemical oxidation, different solvents
were tested. After solubility tests with the dye and with sodium sulphate anhydrous, it
became clear that ethanol could not be used as a solvent for electrochemical oxida-
tion. The solubility of sodium sulphate anhydrous was less than 0.01 g/l, leaving the
conductivity as low as 4.08 µS/cm. The solubility of the dye was nearly zero.
With dimethylformamide the concentration of the dye reached the same level as with
a water diluted dye solution (0.1g/l). The salt solubility was not as good as with water
but the conductivity level of the dimethylformamide diluted dye solution used for
electrochemical oxidation was 16.81 µS/cm. The conductivity of the dimethylforma-
25
mide diluted blank solution was 2.07 µS/cm. Due to these solubility test results, only
dimethylforamide diluted solutions were oxidised electrochemically.
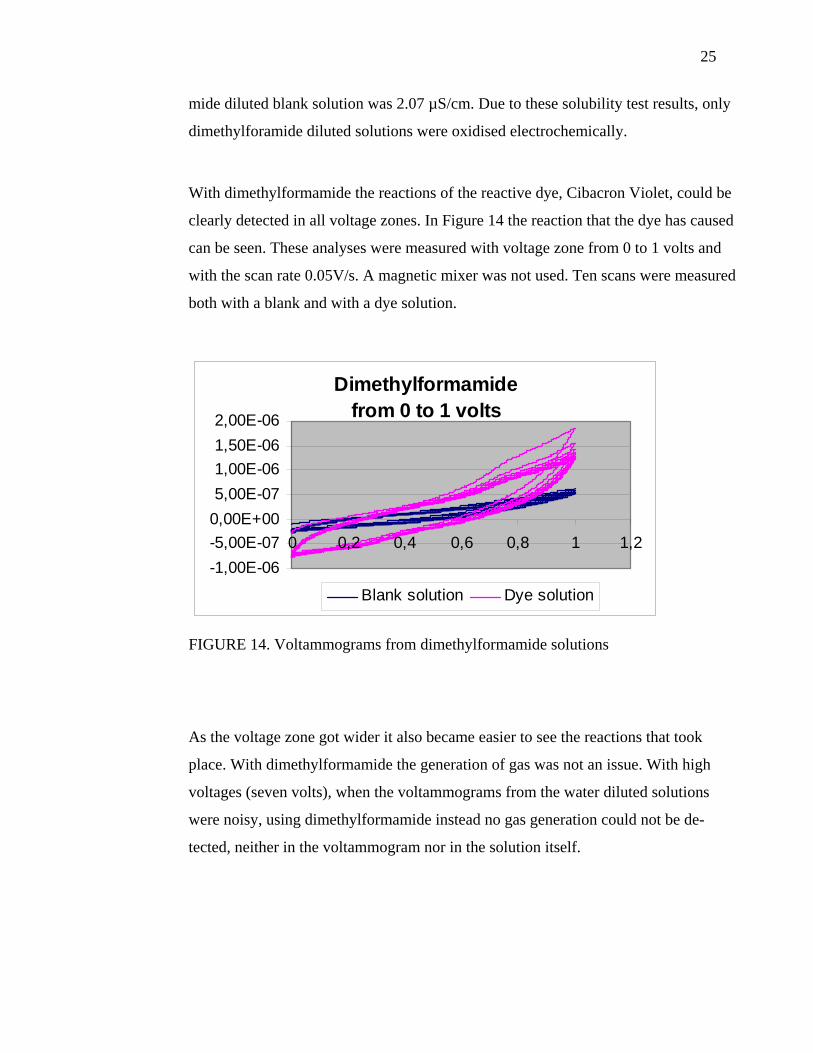
With dimethylformamide the reactions of the reactive dye, Cibacron Violet, could be
clearly detected in all voltage zones. In Figure 14 the reaction that the dye has caused
can be seen. These analyses were measured with voltage zone from 0 to 1 volts and
with the scan rate 0.05V/s. A magnetic mixer was not used. Ten scans were measured
both with a blank and with a dye solution.
Dimethylformamidefrom 0 to 1 volts
-1,00E-06-5,00E-070,00E+005,00E-071,00E-061,50E-062,00E-06
0 0,2 0,4 0,6 0,8 1 1,2
Blank solution Dye solution
FIGURE 14. Voltammograms from dimethylformamide solutions
As the voltage zone got wider it also became easier to see the reactions that took
place. With dimethylformamide the generation of gas was not an issue. With high
voltages (seven volts), when the voltammograms from the water diluted solutions
were noisy, using dimethylformamide instead no gas generation could not be de-
tected, neither in the voltammogram nor in the solution itself.
26
5.5 Conductivity and pH results
The electrochemical oxidation distinctly appeared to have an impact on the conduc-
tivity of the electrolyte solution. Electrochemical oxidation raised the conductivity.
This could be detected with short analyses series and, above all, after the 24 hour
electrochemical oxidation. After 24 hours of electrochemical oxidation the conductiv-
ity of the solution had doubled.
On pH the electrochemical oxidation did not seem to have as clear an effect as in con-
ductivity. On a few occasions the pH raised a little but the same effect could not be
detected with all the analyses. On many occasions, the pH did not convert at all. After
24 hours of electrochemical oxidation the pH had raised only 0.2 units.
5.6 Improvements in the conditions of the electrochemical bulk oxidation
In electrochemical oxidation, it is extremely essential to avoid contamination. Elec-
trochemical oxidation device is sensitive and reacts easily if there are organic com-
pounds (contaminants) in the cell. Chlorine is also a substance that can cause interfer-
ence on the results. Therefore, all the instruments used for electrochemical oxidation
must be handled with a chemical that eliminates the unwanted organic compounds.
The instruments used in this study had been handled with a chemical that eliminates
organic compounds. In spite of that, there were contaminants in the water diluted so-
lutions. In this study, the origin of the contaminants is not entirely certain.
It is essential to clean the electrodes between the analyses. Otherwise there can be re-
action products from the previous analyses on the surface of the working electrode.
To avoid contamination, the electrodes should be cleaned with a cloth that does not
27
leave any residuals. Rinsing the electrodes with some solvents can also be functional.
6 CONCLUSIONS
Textile industrial wastewaters acquire efficient water purification. In the future, many
different techniques to purify the wastewaters are probably introduced because the
reuse of water is becoming more and more important. One way to try to reach the
highest reuse in wastewaters is to use electrochemical techniques. These techniques
are not well known, at least yet. One of the biggest issues when using electrochemical
techniques is electricity. To purify wastewaters on large scale the amount of electric-
ity needed is quite big. This is one of the reasons why electrochemical techniques ha-
ve not become very popular. However, the results of this study seem to indicate that
electrochemical oxidation is a good way to purify textile industrial wastewaters.
The identification of the changes in the chemical structure of the dye turned out to be
a challenging task. To achieve good infrared spectra, different amounts of dye pow-
der had to be tested. Nevertheless, good spectra were not achieved in every case and
this made the identification of the chemical structure difficult. More time would have
been required to achieve more reliable results.
When using another solvent, DMF, on electrochemical oxidation, the reactions that
took place on behalf of the reactive dye could be detected. When working with di-
methylformamide diluted solutions, the generation of gas and the bubbling followed
by the gas generation was not an issue. This was presumably due to lower conductiv-
ity. The dimethylformamide diluted solution had only one thousandth of the conduc-
tivity in water diluted solutions. In spite of the reactions detected in voltammograms
there were no clear changes in the chemical structure of the dye in FTIR results. DMF
is not an easily evaporative liquid and the quality of the dye powder achieved through
28
evaporation was slightly questionable.
The contaminations that appeared in the water diluted solutions were most likely
from the water itself and from the chemicals that were used in the pre-treatments be-
fore the electrochemical oxidation. Both sodium sulphate anhydrous and sodium hy-
droxide contained some chlorine and phosphate compounds. The problems with
these took a lot of time and yet it did not lead to good results.
Textile industrial wastewaters treated with electrochemical oxidation are effectively
cleaned. To define more accurately what occurs in the chemical structure of the dye
during this electrochemical oxidation process, further research is required.
29
REFERENCES
1) Published sources
Fine L. W. & Beall, H. 1990 Chemistry for engineers and scientists, Saunders Col-
lege Publishing, a division of Holt, Rinehart and Winston, Inc.
Hunger, K., Bauer, W., Berneth, H., Clausen, T., Engel, A., Filosa, M., Gregory, P.,
Griffiths, J., Hamprecht, R., Heid, C., Kaschig, J., Kunde, K., Leube, H., Mennicke,
W., Miederer, P., Pedrazzi, R., Püntener, A. G., Ross, E. & Sewekow. 2003 Industrial
Dyes; Chemistry, Properties, Applications, WILEY-VCH Verlag GmbH&Co. KGaA,
Weinheim.
Installation and Diagnostics Guide for Autolab with PGSTAT30, 2000. Eco Chemie
B.V. The Netherlands.
Scott, K. 1995, Electrochemical processes for clean technology, Royal Society of
Chemistry, Printed by Hartnolls Ltd., Bodmin, Cornwall, UK.
Scott, K. 1991 Electrochemical reaction engineering, Academic press Inc. San Diego
2) Online references
Agency for Toxic Substances and Disease Registry 2007. ToxFAQs™
for Sodium Hydroxide [visited 9 September 2007]. Available:
http://www.atsdr.cdc.gov/tfacts178.html

30
Bes-Piá, A., Mendoza-Roca, J.A., Alcaina-Miranda, M.I., Iborra-Clar, A. & Iborra-
Clar, M.I. 2002. Reuse of wastewater of the textile industry after its treatment with a
combination of physico-chemical treatment and membrane technologies. Department
of Chemical and Nuclear Engineering, Universidad Politécnica of Valencia, Spain
[visited 4 June 2007]. Available: http://www.desline.com/articoli/4731.pdf
Demmin, T. & Uhrich, K. 1988. A New Development For (Textile Mill) Wastewater
Treatment. Andco Environmental Processes, Inc. Amherst, New York [visited 5 June
2007]. Available: http://www.p2pays.org/ref/01/00011.pdf.
Eaton, P., 2007. FTIR Tutorial [visited 17 June 2007]. Available:
http://www2.fc.up.pt/pessoas/peter.eaton/tutorial/webCT/index.html
Environmental Protection Agency, 2007. N,N-Dimethylformamide, Hazard Summary
[visited 13 September 2007]. Available: http://www.epa.gov/ttn/atw/hlthef/di-
forma.html
Everything 2, 2005. Ultraviolet-visible spectrophotometer [visited 16 June 2007].
Available: http://www.everything2.com/index.pl?node_id=1702109
Foster & Smith 2007. Pet education. Potassium bromide (KBr) [visited 6 September
2007]. Available:
http://www.peteducation.com/article.cfm?cls=0&cat=1458&articleid=1465
International Occupational Safety and Health Information Centre (CIS) 2007. Interna-
tional labour organization. Sodium hydroxide [visited 9 September 2007]. Available:
http://www.ilo.org/public/english/protection/safework/cis/products/icsc/dtasht/_icsc0
3/icsc0360.htm
31
International Occupational Safety and Health Information Centre (CIS) 2004. Interna-
tional labour organization. Dimethylformamide [visited 9 September 2007]. Avail-
able:
http://www.ilo.org/public/english/protection/safework/cis/products/icsc/dtasht/_icsc0
4/icsc0457.htm
Materials Evaluation and Engineering, Inc. 2000. Handbook of analytic methods.
[visited 17 June 2007] Available: http://www.mee-inc.com/ftir.html
Material safety sheet 2003. Potassium bromide [visited 6 September 2007]. Avail-
able:
http://www.nanotech.wisc.edu/CNT_LABS/MSDS/Inorganic%20compounds/MSDS
%20Potassium%20bromide.pdf
New Mexico state university, 2007. Cyclic voltammetry. Department of Chemistry
and Biochemistry [visited 17 June 2007]. Available:
http://www.chemistry.nmsu.edu/studntres/chem435/Lab13/
Scorecard, 2005. The pollution information site. N,N-dimethylformamide [visited 13
September 2007]. Available: http://www.scorecard.org/chemical-
profiles/summary.tcl?edf_substance_id=68-12-2
The European Agency for the Evaluation of Medicinal Products, 1999. Bromide, po-
tassium salt. Committee for veterinary medicinal products [visited 13 September
2007]. Summary report. Available:
http://www.emea.europa.eu/pdfs/vet/mrls/053898en.pdf
Wikipedia, 2007. Ultraviolet-visible spectroscopy [visited 16 June 2007] Available:
http://en.wikipedia.org/wiki/UV/VIS_spectroscopy

32
Xuejun, C., Zhemin, S., Xiaolong, Z., Yaobo, F. & Wenhua, W. 2005, Advanced
treatment of textile wastewater for reuse using electrochemical oxidation and mem-
brane filtration. School of Environmental Science and Engineering, Shanghai
Jiaotong University, Dongchuan Road 800, Shanghai, 200240, PR China. Research
Center for Eco-environmental Sciences, Chinese Academy of Sciences, Shuangqing
Road 18, Beijing 10085, PR China [visited 2 June 2007]. Available:
http://www.wrc.org.za/downloads/watersa/2005/Jan-05/1790.pdf
33
APPENDICES
Calibration line used to determine concentrations during this study (APPENDIX 1)
UV-V spectra of different concentrations for calibration line (APPENDIX 2)
Specific band regions changed in water diluted dye solutions (APPENDIX 3)
Specific band regions changed in DMF diluted solutions (APPENDIX 4)
The band regions that changed in different stages of electrochemical oxidation proc-
ess (APPENDIX 5)
34
APPENDIX 1
y = 17,284xR2 = 0,9976
0
0,5
1
1,5
2
2,5
3
3,5
4
0 0,05 0,1 0,15 0,2 0,25
g/l
A
35
APPENDIX 2
36
APPENDIX 3
FIGURE 8 Wavenumber (cm-1) Type of compound
Bands disap-peared 1440-1435
1385 C-CH3 1180-1160 N,N-Disubstituted sulphonamide 1120 -C-N- stretch, RCH2NH2
885-869 C-H bend, 1,2,4-Trisub. benzene 870 C-H bend, pentasubstituted benzene deriv.
New bands ap-peared 1645-1610 ortho OH (or NH2) aryl
1570-1520 -N-NO2, asym. Stretch, Alkyl nitramine 1200-1100 -C-N stretch, R
37
APPENDIX 4
FIGURE 9 Wavenumber (cm-1) Type of compound
New bands appeared 1520-1490
-NH3+ sym.bend, Amino acid hydrochloride and
zwitterion
810-800 C-H bend, 1,2,3,4-Tetrasubstituted benzene
deriv.
38
APPENDIX 5
FIGURE 10 Wavenumber
(cm-1) Type of compound Changes after pH and conductivity adjustment
Bands di-sappeared 1500-1390 -CH3, asym.bend, Alkyl benzene deriv.
1390-1380 -CH3, sym.bend, gem-Dimethyl group
1070-950 -C-O-C- sym.stretch,
C=C-O-C in vinyl and aryl ethers, etc. 890-870 - 870-855 C-H bend, 1,2,4,5-Tetrasubstituted benzene deriv. 701-694 C-H bend, Monosubstituted benzene deriv. 695-690 - 690-680 -O-N=O bend, RCH2-O-N=O (cis)
New bands appeared 1145-1100 -C-O-C asym.stretch, Aliphatic ether
1000-990 -C-D bend, methane-d4
650-630 -C-S- stretch, RCH2-S- 630-605 -C-S- stretch, R1R2HC-S- Changes after electrochemical oxidation
New bands appeared 1660-1600 -C=C- stretch
1600-1590 Ring vibration, Aromatic hydrocarbon 1510-1560 -N-H bend(?), N-monosubstituted amide (dioxane soln) 1485-1470 - 1420-1400 -C=C-H in-plane, C-H bend, R1HC=CHR2 (cis) 1380-1365 -CH3 sym.bend, Methylbenzene deriv. 1200-1150 SO2 stretch, Sulphonate and sulphate
1065-1000 -C-O-C- sym.stretch,
C=C-O-C in vinyl and aryl ethers, etc.


![Electrochemical degradation of the Acid Orange 10 dye on a ... · of the azo dyes, Acid Orange 10 (AO10), a typical azo dye in tex-tile wastewaters [7], ... have the advantage of](https://img.pdfslide.us/doc/110x75/5eb719f02b018f3f69388c54/electrochemical-degradation-of-the-acid-orange-10-dye-on-a-of-the-azo-dyes.jpg)