Embed Size (px)
Citation preview
1
FOR IMMEDIATE RELEASE London 1 August 2017
Highlights Solid first half; strong operations, strong cash flow. • Underlying replacement cost (RC) profit* for the second quarter was
$0.7 billion. • Second-quarter operating cash flow, excluding Gulf of Mexico oil spill
payments*, was $6.9 billion. Including these payments, operating cash flow* for the quarter was $4.9 billion.
• Dividend unchanged at 10 cents per share. • Second-quarter Upstream production was 10% higher than in the same
period in 2016; first-half production was 6% higher. • Upstream major projects on track; two new projects sanctioned in quarter;
significant gas discoveries in Senegal and Trinidad announced; $753 million exploration write-off, predominantly in Angola.
• In Downstream, first-half fuels marketing earnings around 20% higher than in the first half of 2016.
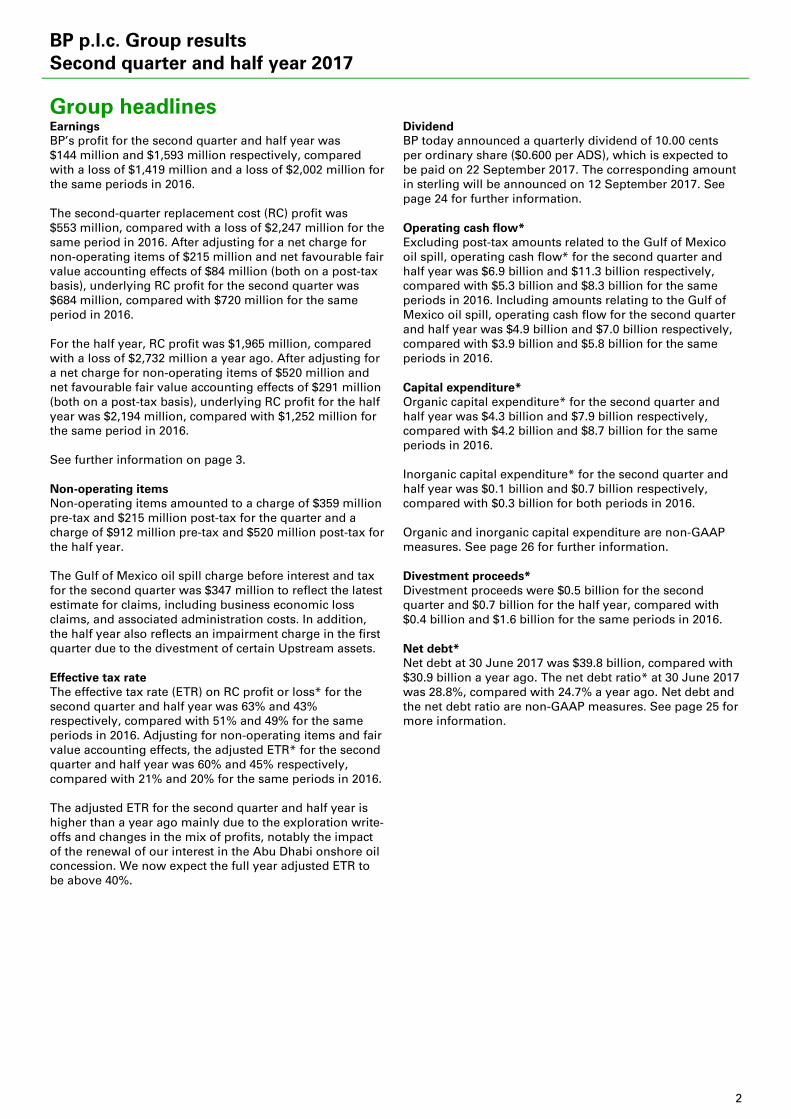
Financial summary Second quarter 2017
Second First Second First First quarter quarter quarter half half $ million 2017 2017 2016 2017 2016 Profit (loss) for the period(b) 144 1,449 (1,419) 1,593 (2,002) Inventory holding (gains) losses*, net of tax 409 (37) (828) 372 (730) RC profit (loss)* 553 1,412 (2,247) 1,965 (2,732) Net (favourable) unfavourable impact of non-operating items* and fair value accounting effects*, net of tax 131 98 2,967 229 3,984 Underlying RC profit 684 1,510 720 2,194 1,252 RC profit (loss) per ordinary share (cents)* 2.80 7.23 (12.03) 10.02 (14.71) RC profit (loss) per ADS (dollars) 0.17 0.43 (0.72) 0.60 (0.88) Underlying RC profit per ordinary share (cents)* 3.47 7.74 3.85 11.19 6.73 Underlying RC profit per ADS (dollars) 0.21 0.46 0.23 0.67 0.40
(a) This results announcement also represents BP’s half-yearly financial report (see page 12). (b) Profit attributable to BP shareholders.
Bob Dudley – Group chief executive: “We continue to position BP for the new oil price environment, with a continued tight focus on costs, efficiency and discipline in capital spending. We delivered strong operational performance in the first half of 2017 and have considerable strategic momentum coming into the rest of the year and 2018, with rising production from our new Upstream projects and marketing growth in the Downstream.”
Brian Gilvary – Chief financial officer: “Cash flow was strong in the first half – organic cash flow* exceeded organic capital expenditure* and dividends paid. While net debt* rose primarily due to Gulf of Mexico payments, we expect this will improve over the second half as these payments decline and divestment proceeds come in towards the end of the year.”
* See definitions in the Glossary on page 32. RC profit (loss), underlying RC profit, cash flow excluding Gulf of Mexico oil spill payments, organic capital expenditure and net debt are non-GAAP measures.
The commentary above and following should be read in conjunction with the cautionary statement on page 35.
720 684
(1,419)
144
(1,500)
(1,000)
(500)
0
500
1,000
2016 2017 2016 2017
5,281
6,915
0
2,000
4,000
6,000
8,000
2016 2017
BP p.l.c. Group results Second quarter and half year 2017(a)
Underlying RC profit ($ million)
Profit (loss) for the period ($ million)
Operating cash flow excluding Gulf of Mexico oil spill payments ($ million)
2
BP p.l.c. Group results Second quarter and half year 2017
Group headlines Earnings BP’s profit for the second quarter and half year was $144 million and $1,593 million respectively, compared with a loss of $1,419 million and a loss of $2,002 million for the same periods in 2016. The second-quarter replacement cost (RC) profit was $553 million, compared with a loss of $2,247 million for the same period in 2016. After adjusting for a net charge for non-operating items of $215 million and net favourable fair value accounting effects of $84 million (both on a post-tax basis), underlying RC profit for the second quarter was $684 million, compared with $720 million for the same period in 2016. For the half year, RC profit was $1,965 million, compared with a loss of $2,732 million a year ago. After adjusting for a net charge for non-operating items of $520 million and net favourable fair value accounting effects of $291 million (both on a post-tax basis), underlying RC profit for the half year was $2,194 million, compared with $1,252 million for the same period in 2016. See further information on page 3. Non-operating items Non-operating items amounted to a charge of $359 million pre-tax and $215 million post-tax for the quarter and a charge of $912 million pre-tax and $520 million post-tax for the half year. The Gulf of Mexico oil spill charge before interest and tax for the second quarter was $347 million to reflect the latest estimate for claims, including business economic loss claims, and associated administration costs. In addition, the half year also reflects an impairment charge in the first quarter due to the divestment of certain Upstream assets. Effective tax rate The effective tax rate (ETR) on RC profit or loss* for the second quarter and half year was 63% and 43% respectively, compared with 51% and 49% for the same periods in 2016. Adjusting for non-operating items and fair value accounting effects, the adjusted ETR* for the second quarter and half year was 60% and 45% respectively, compared with 21% and 20% for the same periods in 2016. The adjusted ETR for the second quarter and half year is higher than a year ago mainly due to the exploration write-offs and changes in the mix of profits, notably the impact of the renewal of our interest in the Abu Dhabi onshore oil concession. We now expect the full year adjusted ETR to be above 40%.
Dividend BP today announced a quarterly dividend of 10.00 cents per ordinary share ($0.600 per ADS), which is expected to be paid on 22 September 2017. The corresponding amount in sterling will be announced on 12 September 2017. See page 24 for further information. Operating cash flow* Excluding post-tax amounts related to the Gulf of Mexico oil spill, operating cash flow* for the second quarter and half year was $6.9 billion and $11.3 billion respectively, compared with $5.3 billion and $8.3 billion for the same periods in 2016. Including amounts relating to the Gulf of Mexico oil spill, operating cash flow for the second quarter and half year was $4.9 billion and $7.0 billion respectively, compared with $3.9 billion and $5.8 billion for the same periods in 2016. Capital expenditure* Organic capital expenditure* for the second quarter and half year was $4.3 billion and $7.9 billion respectively, compared with $4.2 billion and $8.7 billion for the same periods in 2016. Inorganic capital expenditure* for the second quarter and half year was $0.1 billion and $0.7 billion respectively, compared with $0.3 billion for both periods in 2016. Organic and inorganic capital expenditure are non-GAAP measures. See page 26 for further information. Divestment proceeds* Divestment proceeds were $0.5 billion for the second quarter and $0.7 billion for the half year, compared with $0.4 billion and $1.6 billion for the same periods in 2016. Net debt* Net debt at 30 June 2017 was $39.8 billion, compared with $30.9 billion a year ago. The net debt ratio* at 30 June 2017 was 28.8%, compared with 24.7% a year ago. Net debt and the net debt ratio are non-GAAP measures. See page 25 for more information.
3
BP p.l.c. Group results Second quarter and half year 2017
Analysis of underlying RC profit before interest and tax Second First Second First First quarter quarter quarter half half $ million 2017 2017 2016 2017 2016 Underlying RC profit before interest and tax* Upstream 710 1,370 29 2,080 (718) Downstream 1,413 1,742 1,513 3,155 3,326 Rosneft 279 99 246 378 312 Other businesses and corporate (366) (440) (376) (806) (554) Consolidation adjustment – UPII* 135 (68) (121) 67 (81) Underlying RC profit before interest and tax 2,171 2,703 1,291 4,874 2,285 Finance costs and net finance expense relating to pensions and other post-retirement benefits (420) (387) (337) (807) (654) Taxation on an underlying RC basis (1,055) (763) (205) (1,818) (325) Non-controlling interests (12) (43) (29) (55) (54) Underlying RC profit attributable to BP shareholders 684 1,510 720 2,194 1,252 Reconciliations of underlying RC profit or loss to the nearest equivalent IFRS measure are provided on page 1 for the group and on pages 6-11 for the segments.
Analysis of RC profit (loss) before interest and tax and reconciliation to profit (loss) for the period
Second First Second First First quarter quarter quarter half half
$ million 2017 2017 2016 2017 2016 RC profit (loss) before interest and tax* Upstream 795 1,256 (109) 2,051 (1,314) Downstream 1,567 1,706 1,405
3,273 3,285
Rosneft 279 99 246
378 312 Other businesses and corporate(a) (721) (431) (5,525)
(1,152) (6,599)
Consolidation adjustment – UPII 135 (68) (121)
67 (81) RC profit (loss) before interest and tax 2,055 2,562 (4,104)
4,617 (4,397)
Finance costs and net finance expense relating to
pensions and other post-retirement benefits (541) (513) (460)
(1,054) (900)
Taxation on a RC basis (949) (594) 2,346
(1,543) 2,619 Non-controlling interests (12) (43) (29)
(55) (54)
RC profit (loss) attributable to BP shareholders 553 1,412 (2,247) 1,965 (2,732) Inventory holding gains (losses) (586) 66 1,188
(520) 1,056
Taxation (charge) credit on inventory holding
gains and losses 177 (29) (360) 148 (326) Profit (loss) for the period attributable to BP shareholders 144 1,449 (1,419) 1,593 (2,002)
(a) Includes costs related to the Gulf of Mexico oil spill. See page 11 and also Note 2 from page 19 for further information on the accounting for the Gulf of Mexico oil spill.
4
BP p.l.c. Group results Second quarter and half year 2017
Strategic progress
Upstream Upstream operating performance was strong in the first half, underpinned by 6% production growth and an 18% reduction in unit production costs.
BP’s major projects programme is on track to deliver 800,000boe/d of new production by 2020. Three projects have already come online in 2017, Persephone in Australia and Juniper in Trinidad are in final commissioning, and Khazzan Phase 1 in Oman and Zohr in Egypt are expected online before year end. In the second quarter, BP sanctioned development of two new major gas projects: ‘R-Series’ in India and Angelin in Trinidad.
BP announced four gas discoveries in the first half. One in Egypt and two in Trinidad may support future developments and the major Yakaar discovery offshore Senegal marked a further step in building BP’s new business in Mauritania and Senegal. BP decided to exit some exploration assets in Angola, leading to higher exploration write-offs in the second quarter.
Downstream BP’s fuels marketing business continues to make good strategic progress; first-half earnings were around 20% higher than in the first half of 2016.
Premium fuel volumes continue to grow and around 90 new convenience partnership sites have been added so far this year. In lubricants, BP signed an agreement to be the exclusive premium brand sold by Kroger, the largest supermarket chain in the US.
In refining, BP increased the level of advantaged feedstock processed in the US and, in petrochemicals, BP’s industry-leading PTA technology is now operational at all its key PTA sites.
Financial framework
Operating cash flow, excluding Gulf of Mexico payments*, in the first half of 2017 was $11.3 billion, with $6.9 billion in the second quarter. This compares with $8.3 billion for the first half of 2016. Organic capital expenditure* of $4.3 billion in the second quarter brought the total for the first half of 2017 to $7.9 billion. BP continues to intend to keep annual organic capital expenditure in the range $15-17 billion. In the first half of 2017, operating cash flow, excluding Gulf of Mexico payments, exceeded organic capital expenditure and cash dividend payments by $0.6 billion. BP expects divestments of $4.5-5.5 billion in 2017, with proceeds weighted to the second half of the year. Divestment proceeds for the first half of 2017 were $0.7 billion. Gulf of Mexico oil spill payments were $2.0 billion in the second quarter and $4.3 billion in the first half of 2017. Payments are expected to be considerably lower in the second half, and the 2017 full-year estimate is unchanged at $4.5-5.5 billion. The additional charge in the second quarter is not expected to have any significant effect on forecast cash flows in the second half of 2017. BP continues to target a gearing* range of 20-30%. At the end of the second quarter, gearing was 28.8%.
Operating metrics
First half 2017 (vs. First half 2016)
Financial metrics
First half 2017 (vs. First half 2016)
Safety Tier 1 process safety events*
11 (+2)
Underlying RC profit
$2.2bn (+$0.9bn)
Safety Reported recordable injury frequency*
0.22 (-3%)
Operating cash flow excluding Gulf of Mexico oil spill payments
$11.3bn (+$3bn)
Group production
3,544mboe/d (+8%)
Organic capital expenditure
$7.9bn (-$0.8bn)
Upstream production excluding Rosneft segment
2,410mboe/d (+6%)
Gulf of Mexico oil spill payments
$4.3bn (+$1.8bn)
Upstream unit production costs*
$7.20/boe (-18%)
Divestment proceeds
$0.7bn (-$0.9bn)
BP-operated Upstream operating efficiency*(a)
81.4%
Net debt ratio (gearing)
28.8% (+4.1)
Refining availability*
94.8% (-0.5)
Dividend per ordinary share
10.00 cents (–)
(a) Reported on a one-quarter lagged basis and represents 1Q 2017 actuals only.
The commentary above contains forward-looking statements and should be read in conjunction with the cautionary statement on page 35.

5
BP p.l.c. Group results Second quarter and half year 2017
INTENTIONALLY BLANK
6
BP p.l.c. Group results Second quarter and half year 2017
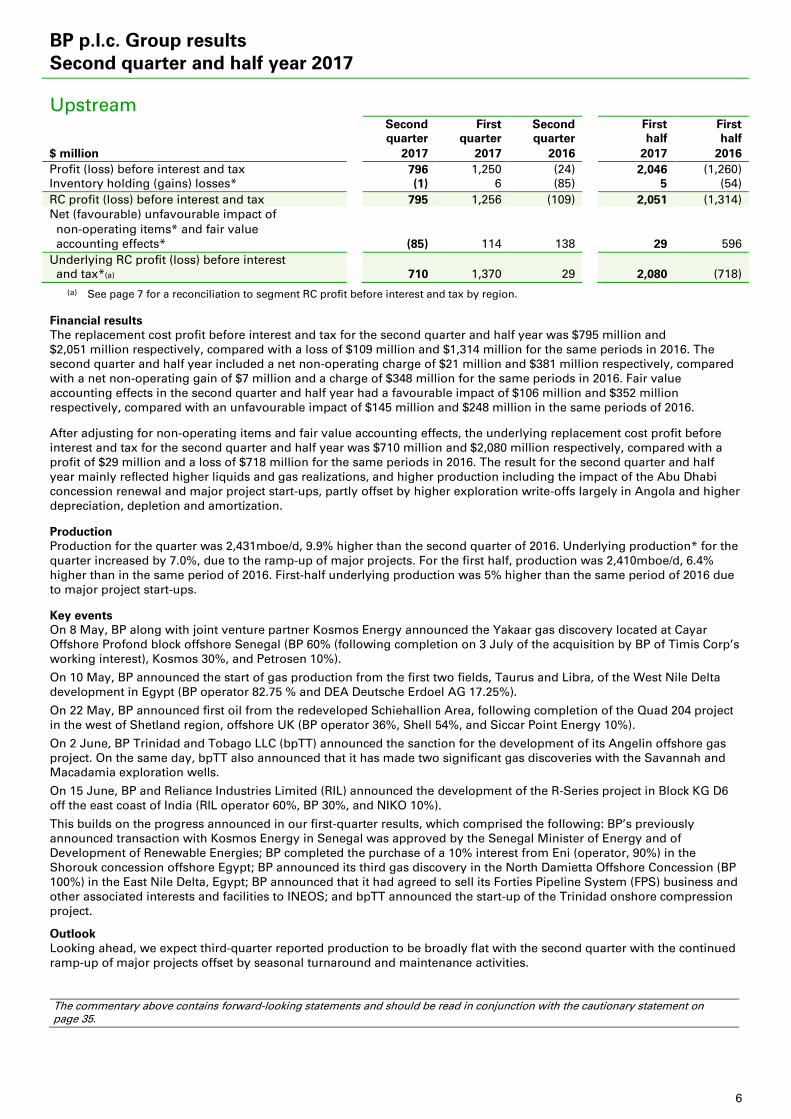
Upstream Second First Second First First quarter quarter quarter half half $ million 2017 2017 2016 2017 2016 Profit (loss) before interest and tax 796 1,250 (24) 2,046 (1,260) Inventory holding (gains) losses* (1) 6 (85) 5 (54) RC profit (loss) before interest and tax 795 1,256 (109) 2,051 (1,314) Net (favourable) unfavourable impact of non-operating items* and fair value accounting effects* (85) 114 138 29 596 Underlying RC profit (loss) before interest and tax*(a) 710 1,370 29 2,080 (718)
(a) See page 7 for a reconciliation to segment RC profit before interest and tax by region. Financial results The replacement cost profit before interest and tax for the second quarter and half year was $795 million and $2,051 million respectively, compared with a loss of $109 million and $1,314 million for the same periods in 2016. The second quarter and half year included a net non-operating charge of $21 million and $381 million respectively, compared with a net non-operating gain of $7 million and a charge of $348 million for the same periods in 2016. Fair value accounting effects in the second quarter and half year had a favourable impact of $106 million and $352 million respectively, compared with an unfavourable impact of $145 million and $248 million in the same periods of 2016. After adjusting for non-operating items and fair value accounting effects, the underlying replacement cost profit before interest and tax for the second quarter and half year was $710 million and $2,080 million respectively, compared with a profit of $29 million and a loss of $718 million for the same periods in 2016. The result for the second quarter and half year mainly reflected higher liquids and gas realizations, and higher production including the impact of the Abu Dhabi concession renewal and major project start-ups, partly offset by higher exploration write-offs largely in Angola and higher depreciation, depletion and amortization. Production Production for the quarter was 2,431mboe/d, 9.9% higher than the second quarter of 2016. Underlying production* for the quarter increased by 7.0%, due to the ramp-up of major projects. For the first half, production was 2,410mboe/d, 6.4% higher than in the same period of 2016. First-half underlying production was 5% higher than the same period of 2016 due to major project start-ups. Key events On 8 May, BP along with joint venture partner Kosmos Energy announced the Yakaar gas discovery located at Cayar Offshore Profond block offshore Senegal (BP 60% (following completion on 3 July of the acquisition by BP of Timis Corp’s working interest), Kosmos 30%, and Petrosen 10%).
On 10 May, BP announced the start of gas production from the first two fields, Taurus and Libra, of the West Nile Delta development in Egypt (BP operator 82.75 % and DEA Deutsche Erdoel AG 17.25%).
On 22 May, BP announced first oil from the redeveloped Schiehallion Area, following completion of the Quad 204 project in the west of Shetland region, offshore UK (BP operator 36%, Shell 54%, and Siccar Point Energy 10%).
On 2 June, BP Trinidad and Tobago LLC (bpTT) announced the sanction for the development of its Angelin offshore gas project. On the same day, bpTT also announced that it has made two significant gas discoveries with the Savannah and Macadamia exploration wells.
On 15 June, BP and Reliance Industries Limited (RIL) announced the development of the R-Series project in Block KG D6 off the east coast of India (RIL operator 60%, BP 30%, and NIKO 10%).
This builds on the progress announced in our first-quarter results, which comprised the following: BP’s previously announced transaction with Kosmos Energy in Senegal was approved by the Senegal Minister of Energy and of Development of Renewable Energies; BP completed the purchase of a 10% interest from Eni (operator, 90%) in the Shorouk concession offshore Egypt; BP announced its third gas discovery in the North Damietta Offshore Concession (BP 100%) in the East Nile Delta, Egypt; BP announced that it had agreed to sell its Forties Pipeline System (FPS) business and other associated interests and facilities to INEOS; and bpTT announced the start-up of the Trinidad onshore compression project.
Outlook Looking ahead, we expect third-quarter reported production to be broadly flat with the second quarter with the continued ramp-up of major projects offset by seasonal turnaround and maintenance activities. The commentary above contains forward-looking statements and should be read in conjunction with the cautionary statement on page 35.
7
BP p.l.c. Group results Second quarter and half year 2017
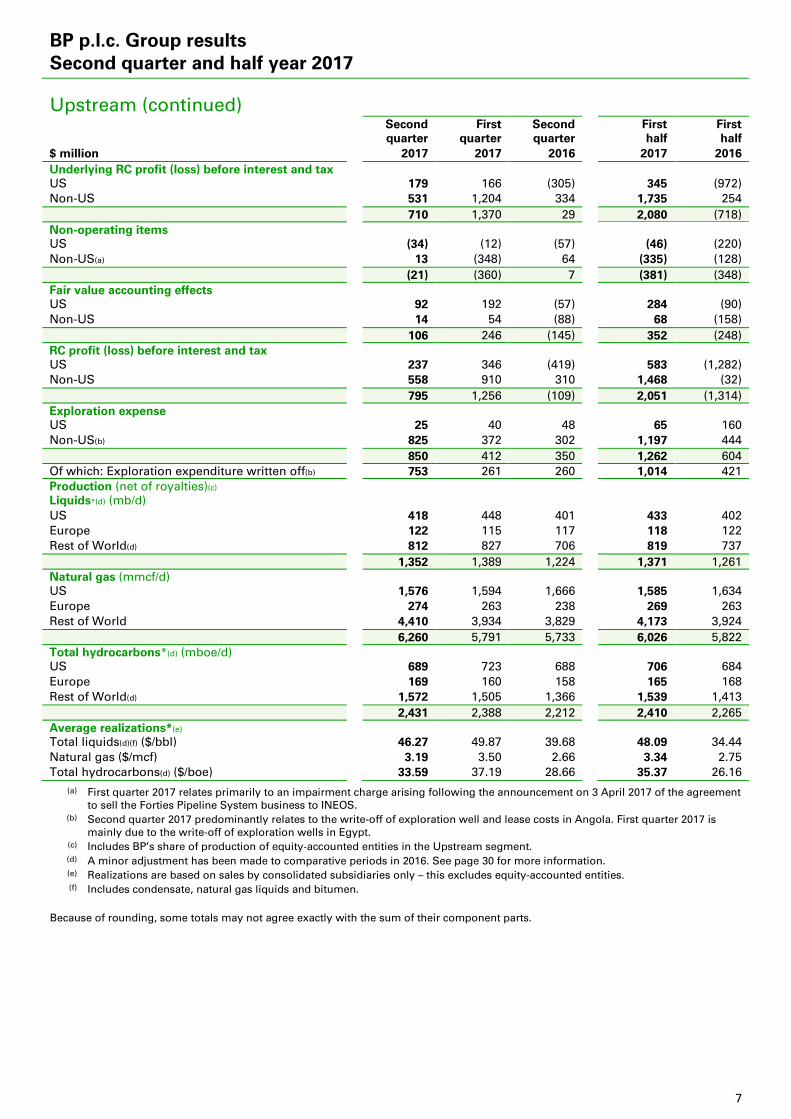
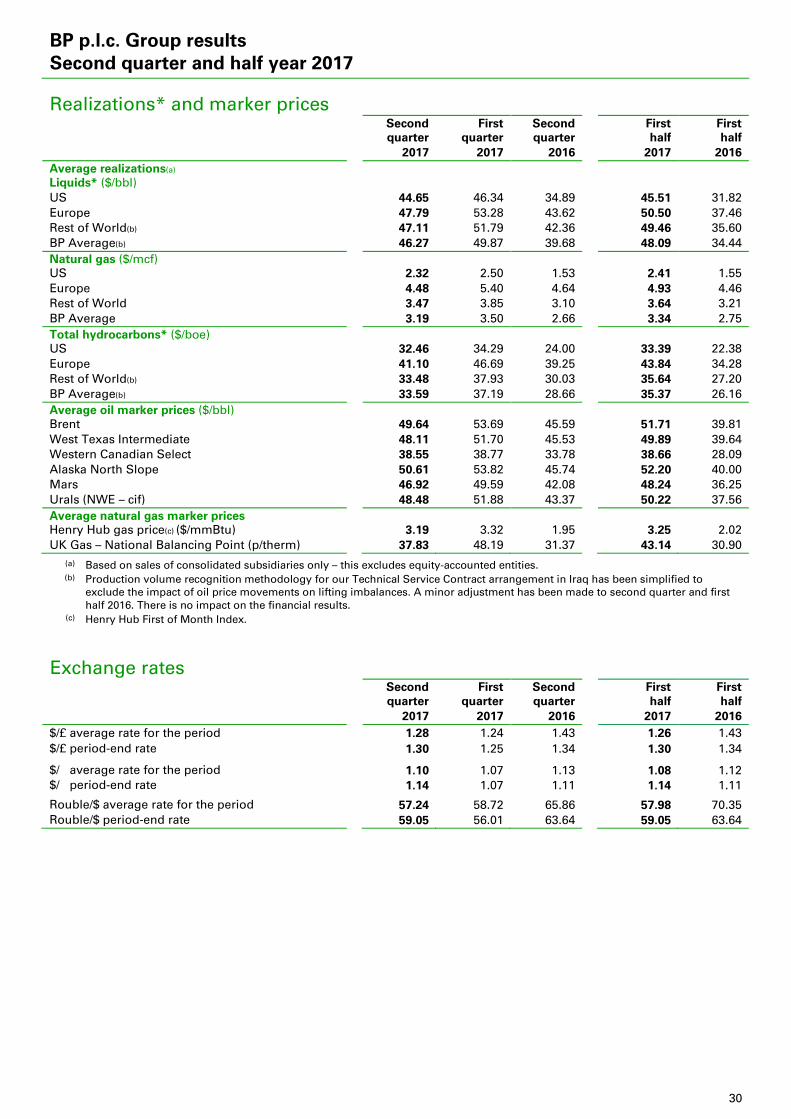
Upstream (continued) Second First Second First First quarter quarter quarter half half $ million 2017 2017 2016 2017 2016 Underlying RC profit (loss) before interest and tax US 179 166 (305) 345 (972) Non-US 531 1,204 334 1,735 254 710 1,370 29 2,080 (718) Non-operating items US (34) (12) (57) (46) (220) Non-US(a) 13 (348) 64 (335) (128) (21) (360) 7 (381) (348) Fair value accounting effects US 92 192 (57) 284 (90) Non-US 14 54 (88) 68 (158) 106 246 (145) 352 (248) RC profit (loss) before interest and tax US 237 346 (419) 583 (1,282) Non-US 558 910 310 1,468 (32) 795 1,256 (109) 2,051 (1,314) Exploration expense US 25 40 48 65 160 Non-US(b) 825 372 302 1,197 444 850 412 350 1,262 604 Of which: Exploration expenditure written off(b) 753 261 260 1,014 421 Production (net of royalties)(c) Liquids*(d) (mb/d) US 418 448 401 433 402 Europe 122 115 117 118 122 Rest of World(d) 812 827 706 819 737 1,352 1,389 1,224 1,371 1,261 Natural gas (mmcf/d) US 1,576 1,594 1,666 1,585 1,634 Europe 274 263 238 269 263 Rest of World 4,410 3,934 3,829 4,173 3,924 6,260 5,791 5,733 6,026 5,822 Total hydrocarbons*(d) (mboe/d) US 689 723 688 706 684 Europe 169 160 158 165 168 Rest of World(d) 1,572 1,505 1,366 1,539 1,413 2,431 2,388 2,212 2,410 2,265 Average realizations*(e) Total liquids(d)(f) ($/bbl) 46.27 49.87 39.68 48.09 34.44 Natural gas ($/mcf) 3.19 3.50 2.66 3.34 2.75 Total hydrocarbons(d) ($/boe) 33.59 37.19 28.66 35.37 26.16
(a) First quarter 2017 relates primarily to an impairment charge arising following the announcement on 3 April 2017 of the agreement to sell the Forties Pipeline System business to INEOS.
(b) Second quarter 2017 predominantly relates to the write-off of exploration well and lease costs in Angola. First quarter 2017 is mainly due to the write-off of exploration wells in Egypt.
(c) Includes BP’s share of production of equity-accounted entities in the Upstream segment. (d) A minor adjustment has been made to comparative periods in 2016. See page 30 for more information. (e) Realizations are based on sales by consolidated subsidiaries only – this excludes equity-accounted entities. (f) Includes condensate, natural gas liquids and bitumen.
Because of rounding, some totals may not agree exactly with the sum of their component parts.
8
BP p.l.c. Group results Second quarter and half year 2017
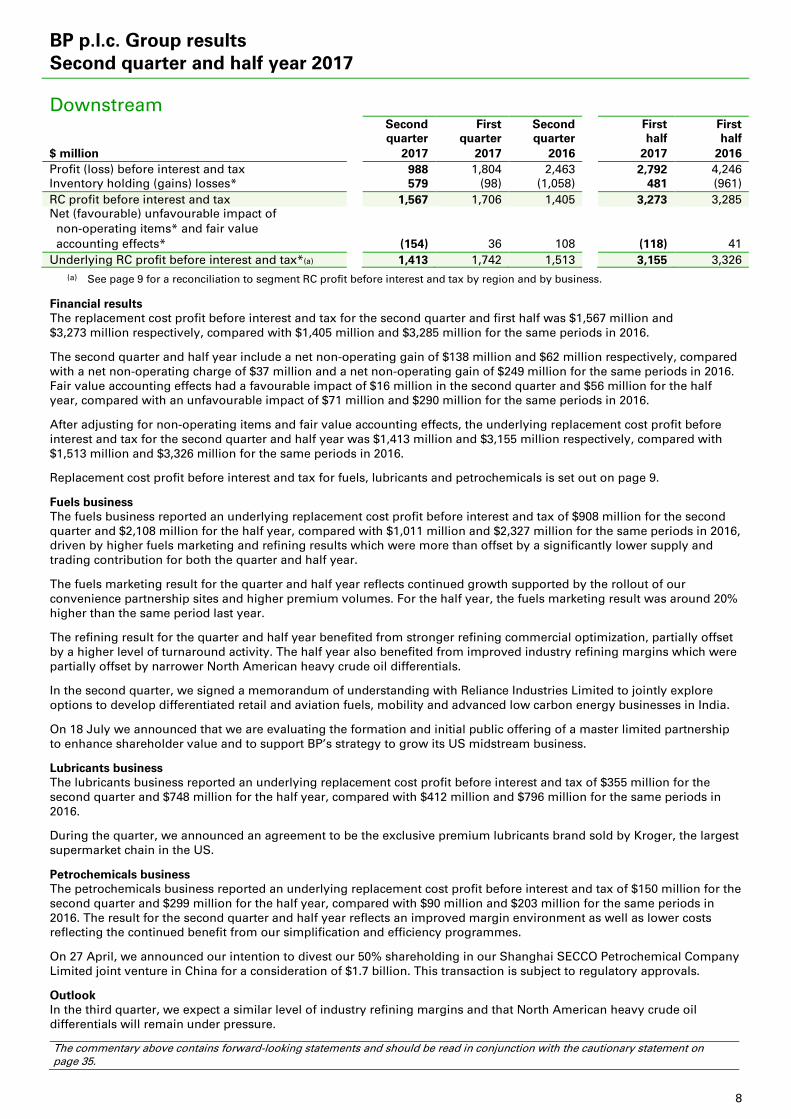
Downstream Second First Second First First quarter quarter quarter half half $ million 2017 2017 2016 2017 2016 Profit (loss) before interest and tax 988 1,804 2,463 2,792 4,246 Inventory holding (gains) losses* 579 (98) (1,058) 481 (961) RC profit before interest and tax 1,567 1,706 1,405 3,273 3,285 Net (favourable) unfavourable impact of non-operating items* and fair value accounting effects* (154) 36 108 (118) 41 Underlying RC profit before interest and tax*(a) 1,413 1,742 1,513 3,155 3,326
(a) See page 9 for a reconciliation to segment RC profit before interest and tax by region and by business.
Financial results The replacement cost profit before interest and tax for the second quarter and first half was $1,567 million and $3,273 million respectively, compared with $1,405 million and $3,285 million for the same periods in 2016.
The second quarter and half year include a net non-operating gain of $138 million and $62 million respectively, compared with a net non-operating charge of $37 million and a net non-operating gain of $249 million for the same periods in 2016. Fair value accounting effects had a favourable impact of $16 million in the second quarter and $56 million for the half year, compared with an unfavourable impact of $71 million and $290 million for the same periods in 2016.
After adjusting for non-operating items and fair value accounting effects, the underlying replacement cost profit before interest and tax for the second quarter and half year was $1,413 million and $3,155 million respectively, compared with $1,513 million and $3,326 million for the same periods in 2016.
Replacement cost profit before interest and tax for fuels, lubricants and petrochemicals is set out on page 9.
Fuels business The fuels business reported an underlying replacement cost profit before interest and tax of $908 million for the second quarter and $2,108 million for the half year, compared with $1,011 million and $2,327 million for the same periods in 2016, driven by higher fuels marketing and refining results which were more than offset by a significantly lower supply and trading contribution for both the quarter and half year.
The fuels marketing result for the quarter and half year reflects continued growth supported by the rollout of our convenience partnership sites and higher premium volumes. For the half year, the fuels marketing result was around 20% higher than the same period last year.
The refining result for the quarter and half year benefited from stronger refining commercial optimization, partially offset by a higher level of turnaround activity. The half year also benefited from improved industry refining margins which were partially offset by narrower North American heavy crude oil differentials.
In the second quarter, we signed a memorandum of understanding with Reliance Industries Limited to jointly explore options to develop differentiated retail and aviation fuels, mobility and advanced low carbon energy businesses in India.
On 18 July we announced that we are evaluating the formation and initial public offering of a master limited partnership to enhance shareholder value and to support BP’s strategy to grow its US midstream business.
Lubricants business The lubricants business reported an underlying replacement cost profit before interest and tax of $355 million for the second quarter and $748 million for the half year, compared with $412 million and $796 million for the same periods in 2016.
During the quarter, we announced an agreement to be the exclusive premium lubricants brand sold by Kroger, the largest supermarket chain in the US.
Petrochemicals business The petrochemicals business reported an underlying replacement cost profit before interest and tax of $150 million for the second quarter and $299 million for the half year, compared with $90 million and $203 million for the same periods in 2016. The result for the second quarter and half year reflects an improved margin environment as well as lower costs reflecting the continued benefit from our simplification and efficiency programmes.
On 27 April, we announced our intention to divest our 50% shareholding in our Shanghai SECCO Petrochemical Company Limited joint venture in China for a consideration of $1.7 billion. This transaction is subject to regulatory approvals.
Outlook In the third quarter, we expect a similar level of industry refining margins and that North American heavy crude oil differentials will remain under pressure.
The commentary above contains forward-looking statements and should be read in conjunction with the cautionary statement on page 35.
9
BP p.l.c. Group results Second quarter and half year 2017
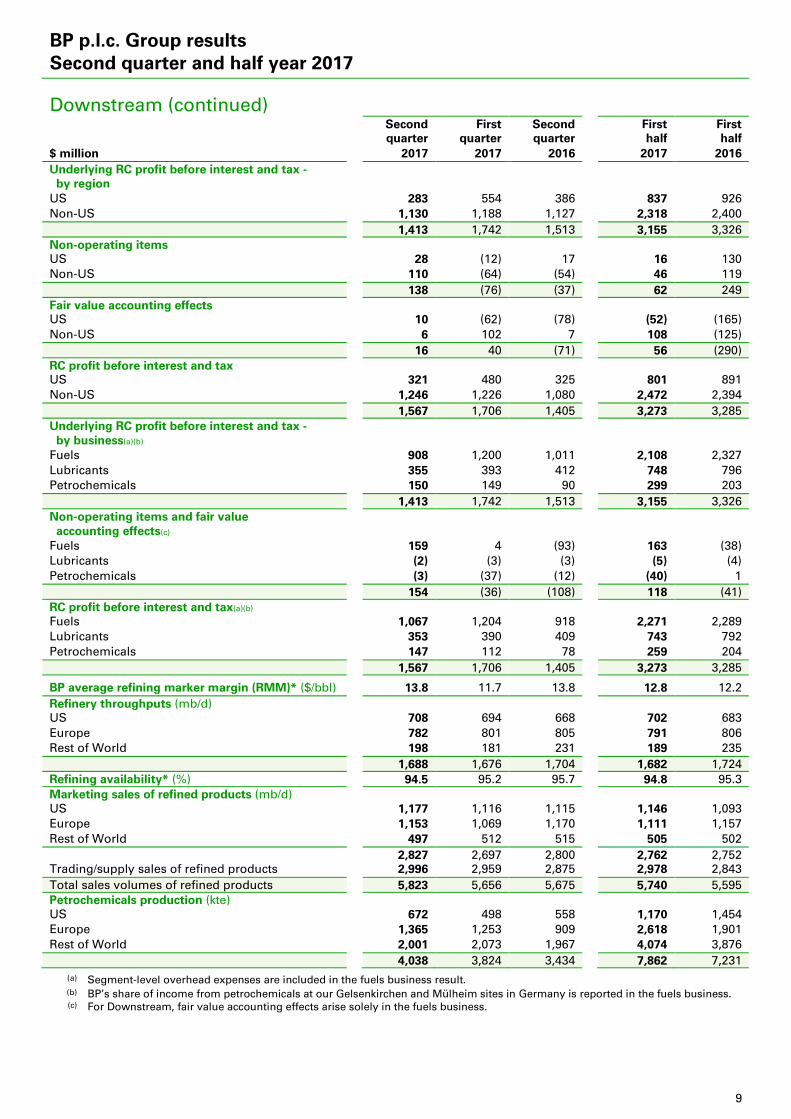
Downstream (continued) Second First Second First First quarter quarter quarter half half $ million 2017 2017 2016 2017 2016 Underlying RC profit before interest and tax -
by region US 283 554 386 837 926 Non-US 1,130 1,188 1,127 2,318 2,400 1,413 1,742 1,513 3,155 3,326 Non-operating items US 28 (12) 17 16 130 Non-US 110 (64) (54) 46 119 138 (76) (37) 62 249 Fair value accounting effects US 10 (62) (78) (52) (165) Non-US 6 102 7 108 (125) 16 40 (71) 56 (290) RC profit before interest and tax US 321 480 325 801 891 Non-US 1,246 1,226 1,080 2,472 2,394 1,567 1,706 1,405 3,273 3,285 Underlying RC profit before interest and tax - by business(a)(b) Fuels 908 1,200 1,011 2,108 2,327 Lubricants 355 393 412 748 796 Petrochemicals 150 149 90 299 203 1,413 1,742 1,513 3,155 3,326 Non-operating items and fair value accounting effects(c) Fuels 159 4 (93) 163 (38) Lubricants (2) (3) (3) (5) (4) Petrochemicals (3) (37) (12) (40) 1 154 (36) (108) 118 (41) RC profit before interest and tax(a)(b) Fuels 1,067 1,204 918 2,271 2,289 Lubricants 353 390 409 743 792 Petrochemicals 147 112 78 259 204 1,567 1,706 1,405 3,273 3,285
BP average refining marker margin (RMM)* ($/bbl) 13.8 11.7 13.8 12.8 12.2 Refinery throughputs (mb/d) US 708 694 668 702 683 Europe 782 801 805 791 806 Rest of World 198 181 231 189 235 1,688 1,676 1,704 1,682 1,724 Refining availability* (%) 94.5 95.2 95.7 94.8 95.3 Marketing sales of refined products (mb/d) US 1,177 1,116 1,115 1,146 1,093 Europe 1,153 1,069 1,170 1,111 1,157 Rest of World 497 512 515 505 502 2,827 2,697 2,800 2,762 2,752 Trading/supply sales of refined products 2,996 2,959 2,875 2,978 2,843 Total sales volumes of refined products 5,823 5,656 5,675 5,740 5,595 Petrochemicals production (kte) US 672 498 558 1,170 1,454 Europe 1,365 1,253 909 2,618 1,901 Rest of World 2,001 2,073 1,967 4,074 3,876 4,038 3,824 3,434 7,862 7,231
(a) Segment-level overhead expenses are included in the fuels business result. (b) BP’s share of income from petrochemicals at our Gelsenkirchen and Mülheim sites in Germany is reported in the fuels business. (c) For Downstream, fair value accounting effects arise solely in the fuels business.
10
BP p.l.c. Group results Second quarter and half year 2017
Rosneft
Second First Second First First quarter quarter quarter half half $ million 2017(a) 2017 2016 2017(a) 2016 Profit before interest and tax(b) 271 73 291 344 353 Inventory holding (gains) losses* 8 26 (45) 34 (41) RC profit before interest and tax 279 99 246 378 312 Net charge (credit) for non-operating items* – – – – – Underlying RC profit before interest and tax* 279 99 246 378 312 Financial results Replacement cost profit before interest and tax and underlying replacement cost profit before interest and tax for the second quarter and half year was $279 million and $378 million respectively, compared with $246 million and $312 million for the same periods in 2016. There were no non-operating items in the second quarter and half year of either year. Compared with the same periods in 2016, the result for the second quarter was primarily affected by higher oil prices and adverse duty lag effects. For the half year, the result was primarily affected by higher oil prices, adverse foreign exchange and adverse duty lag effects. BP’s two nominees, Bob Dudley and Guillermo Quintero, were re-elected to Rosneft’s board by the annual general meeting (AGM) on 22 June. The AGM also adopted a resolution to pay dividends of 5.98 roubles per ordinary share. In July BP received a dividend in relation to the 2016 annual results of $190 million, after the deduction of withholding tax. Key events In April Rosneft completed the acquisition of a 100% interest in the Kondaneft project that is developing four licence areas in the Khanty-Mansiysk Autonomous District in West Siberia. The acquisition price was approximately $700 million. On 29 June Rosneft completed the transaction for the sale of a 20% interest in its Verkhnechonskneftegaz subsidiary to the Beijing Gas Group, for around $1.1 billion. Second First Second First First quarter quarter quarter half half 2017(a) 2017 2016 2017(a) 2016 Production (net of royalties) (BP share) Liquids* (mb/d) 902 912 812 907 810 Natural gas (mmcf/d) 1,302 1,334 1,266 1,318 1,274 Total hydrocarbons* (mboe/d) 1,126 1,142 1,030 1,134 1,029
(a) The operational and financial information of the Rosneft segment for the second quarter and first half of the year is based on preliminary operational and financial results of Rosneft for the six months ended 30 June 2017. Actual results may differ from these amounts.
(b) The Rosneft segment result includes equity-accounted earnings arising from BP’s 19.75% shareholding in Rosneft as adjusted for the accounting required under IFRS relating to BP’s purchase of its interest in Rosneft and the amortization of the deferred gain relating to the divestment of BP’s interest in TNK-BP. These adjustments have increased the reported profit before interest and tax for the second quarter and first half 2017, as shown in the table above, compared with the equivalent amount in Russian roubles that we expect Rosneft to report in its own financial statements under IFRS. BP’s share of Rosneft’s profit before interest and tax for each year-to-date period is calculated by translating the amounts reported in Russian roubles into US dollars using the average exchange rate for the year to date. BP's share of Rosneft’s earnings after finance costs, taxation and non-controlling interests, as adjusted, is included in the BP group income statement within profit before interest and taxation.
11
BP p.l.c. Group results Second quarter and half year 2017
Other businesses and corporate Second First Second First First quarter quarter quarter half half $ million 2017 2017 2016 2017 2016 Profit (loss) before interest and tax Gulf of Mexico oil spill (347) (35) (5,106) (382) (5,900) Other (374) (396) (419) (770) (699) Profit (loss) before interest and tax (721) (431) (5,525) (1,152) (6,599) Inventory holding (gains) losses* – – – – – RC profit (loss) before interest and tax (721) (431) (5,525) (1,152) (6,599) Net charge (credit) for non-operating items* Gulf of Mexico oil spill 347 35 5,106 382 5,900 Other 8 (44) 43 (36) 145 Net charge (credit) for non-operating items 355 (9) 5,149 346 6,045 Underlying RC profit (loss) before interest and tax* (366) (440) (376) (806) (554) Underlying RC profit (loss) before interest and tax US (104) (197) (109) (301) (219) Non-US (262) (243) (267) (505) (335) (366) (440) (376) (806) (554) Non-operating items US (350) (38) (5,136) (388) (5,984) Non-US (5) 47 (13) 42 (61) (355) 9 (5,149) (346) (6,045) RC profit (loss) before interest and tax US (454) (235) (5,245) (689) (6,203) Non-US (267) (196) (280) (463) (396) (721) (431) (5,525) (1,152) (6,599) Other businesses and corporate comprises our alternative energy business, shipping, treasury, corporate activities including centralized functions, and the costs of the Gulf of Mexico oil spill. Financial results The replacement cost loss before interest and tax for the second quarter and half year was $721 million and $1,152 million respectively, compared with $5,525 million and $6,599 million for the same periods in 2016. The results included a net non-operating charge of $355 million for the second quarter and $346 million for the half year, compared with a net non-operating charge of $5,149 million and $6,045 million for the same periods in 2016. After adjusting for non-operating items, the underlying replacement cost loss before interest and tax for the second quarter and half year was $366 million and $806 million respectively, compared with $376 million and $554 million for the same periods in 2016. The underlying charge for the half year was impacted by adverse foreign exchange effects, which had a favourable effect in the same period in 2016. Alternative energy – biofuels, wind The net ethanol-equivalent production (which includes ethanol and sugar) for the second quarter was 227 million litres, compared with 283 million litres for the same period in 2016. Net wind generation capacity*(a) was 1,432MW at 30 June 2017 compared with 1,477MW at 30 June 2016. BP’s net share of wind generation for the second quarter and half year was 1,053GWh and 2,212GWh respectively, compared with 1,060GWh and 2,407GWh for the same periods in 2016.
(a) Capacity figures for 2016 include 23MW in the Netherlands managed by our Downstream segment.
12
BP p.l.c. Group results Second quarter and half year 2017
Half-yearly financial report This results announcement also represents BP’s half-yearly financial report for the purposes of the Disclosure Guidance and Transparency Rules made by the UK Financial Conduct Authority. In this context: (i) the condensed set of financial statements can be found on pages 14-25; (ii) pages 1-11, and 26-35 comprise the interim management report; and (iii) the directors’ responsibility statement and auditors’ independent review report can be found on pages 12-13.
Statement of directors’ responsibilities The directors confirm that, to the best of their knowledge, the condensed set of financial statements on pages 14-25 has been prepared in accordance with IAS 34 ‘Interim Financial Reporting’, and that the interim management report on pages 1-11 and 26-35 includes a fair review of the information required by the Disclosure Guidance and Transparency Rules.
The directors of BP p.l.c. are listed on pages 52-57 of BP Annual Report and Form 20-F 2016, with the exception of Cynthia Carroll and Andrew Shilston who retired at the 2017 Annual General Meeting on 17 May 2017, and Melody Meyer who was elected at the 2017 Annual General Meeting. By order of the board
Bob Dudley Brian Gilvary Group Chief Executive Chief Financial Officer 31 July 2017 31 July 2017
13
BP p.l.c. Group results Second quarter and half year 2017
Independent review report to BP p.l.c. Introduction We have been engaged by the company to review the condensed set of financial statements in the half-yearly financial report for the six months ended 30 June 2017 which comprises the group income statement, group statement of comprehensive income, group statement of changes in equity, group balance sheet, condensed group cash flow statement and Notes 1 to 10. We have read the other information contained in the half-yearly financial report and considered whether it contains any apparent misstatements or material inconsistencies with the information in the condensed set of financial statements. This report is made solely to the company in accordance with guidance contained in International Standard on Review Engagements 2410 (UK and Ireland) ‘Review of Interim Financial Information Performed by the Independent Auditor of the Entity’ issued by the Auditing Practices Board for use in the United Kingdom (ISRE 2410). To the fullest extent permitted by law, we do not accept or assume responsibility to anyone other than the company, for our work, for this report, or for the conclusions we have formed. Directors’ responsibilities The half-yearly financial report is the responsibility of, and has been approved by, the directors. The directors are responsible for preparing the half-yearly financial report in accordance with the Disclosure Guidance and Transparency Rules of the United Kingdom’s Financial Conduct Authority. As disclosed in Note 1, the annual financial statements of the group are prepared in accordance with International Financial Reporting Standards (IFRS) as issued by the International Accounting Standards Board (IASB) and IFRS as adopted by the European Union (EU). The condensed set of financial statements included in this half-yearly financial report has been prepared in accordance with International Accounting Standard 34, ‘Interim Financial Reporting’, as issued by the IASB and as adopted by the EU. Our responsibility Our responsibility is to express to the company a conclusion on the condensed set of financial statements in the half-yearly financial report based on our review. Scope of review We conducted our review in accordance with ISRE 2410. A review of interim financial information consists of making enquiries, primarily of persons responsible for financial and accounting matters, and applying analytical and other review procedures. A review is substantially less in scope than an audit conducted in accordance with International Standards on Auditing (UK) and consequently does not enable us to obtain assurance that we would become aware of all significant matters that might be identified in an audit. Accordingly, we do not express an audit opinion. Conclusion Based on our review, nothing has come to our attention that causes us to believe that the condensed set of financial statements in the half-yearly financial report for the six months ended 30 June 2017 is not prepared, in all material respects, in accordance with International Accounting Standard 34 as issued by the IASB and as adopted by the EU and the Disclosure Guidance and Transparency Rules of the United Kingdom’s Financial Conduct Authority. Ernst & Young LLP London 31 July 2017 The maintenance and integrity of the BP p.l.c. website are the responsibility of the directors; the review work carried out by the auditors does not involve consideration of these matters and, accordingly, the auditors accept no responsibility for any changes that may have occurred to the financial information since it was initially presented on the website. Legislation in the United Kingdom governing the preparation and dissemination of financial statements may differ from legislation in other jurisdictions.
14
BP p.l.c. Group results Second quarter and half year 2017
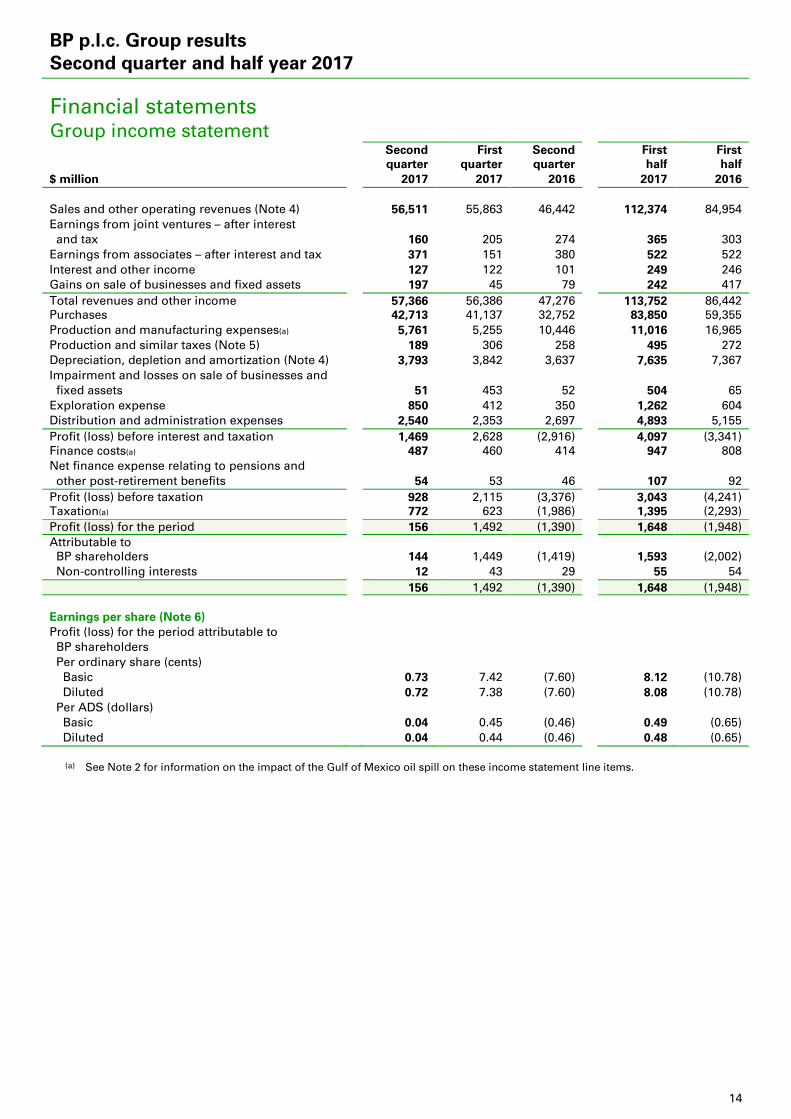
Financial statements Group income statement Second First Second First First quarter quarter quarter half half $ million 2017 2017 2016 2017 2016 Sales and other operating revenues (Note 4) 56,511 55,863 46,442 112,374 84,954 Earnings from joint ventures – after interest and tax 160 205 274 365 303 Earnings from associates – after interest and tax 371 151 380 522 522 Interest and other income 127 122 101 249 246 Gains on sale of businesses and fixed assets 197 45 79 242 417 Total revenues and other income 57,366 56,386 47,276 113,752 86,442 Purchases 42,713 41,137 32,752 83,850 59,355 Production and manufacturing expenses(a) 5,761 5,255 10,446 11,016 16,965 Production and similar taxes (Note 5) 189 306 258 495 272 Depreciation, depletion and amortization (Note 4) 3,793 3,842 3,637 7,635 7,367 Impairment and losses on sale of businesses and fixed assets 51 453 52 504 65 Exploration expense 850 412 350 1,262 604 Distribution and administration expenses 2,540 2,353 2,697 4,893 5,155 Profit (loss) before interest and taxation 1,469 2,628 (2,916) 4,097 (3,341) Finance costs(a) 487 460 414 947 808 Net finance expense relating to pensions and other post-retirement benefits 54 53 46 107 92 Profit (loss) before taxation 928 2,115 (3,376) 3,043 (4,241) Taxation(a) 772 623 (1,986) 1,395 (2,293) Profit (loss) for the period 156 1,492 (1,390) 1,648 (1,948) Attributable to BP shareholders 144 1,449 (1,419) 1,593 (2,002) Non-controlling interests 12 43 29 55 54 156 1,492 (1,390) 1,648 (1,948) Earnings per share (Note 6) Profit (loss) for the period attributable to BP shareholders Per ordinary share (cents) Basic 0.73 7.42 (7.60) 8.12 (10.78) Diluted 0.72 7.38 (7.60) 8.08 (10.78) Per ADS (dollars) Basic 0.04 0.45 (0.46) 0.49 (0.65) Diluted 0.04 0.44 (0.46) 0.48 (0.65)
(a) See Note 2 for information on the impact of the Gulf of Mexico oil spill on these income statement line items.
15
BP p.l.c. Group results Second quarter and half year 2017
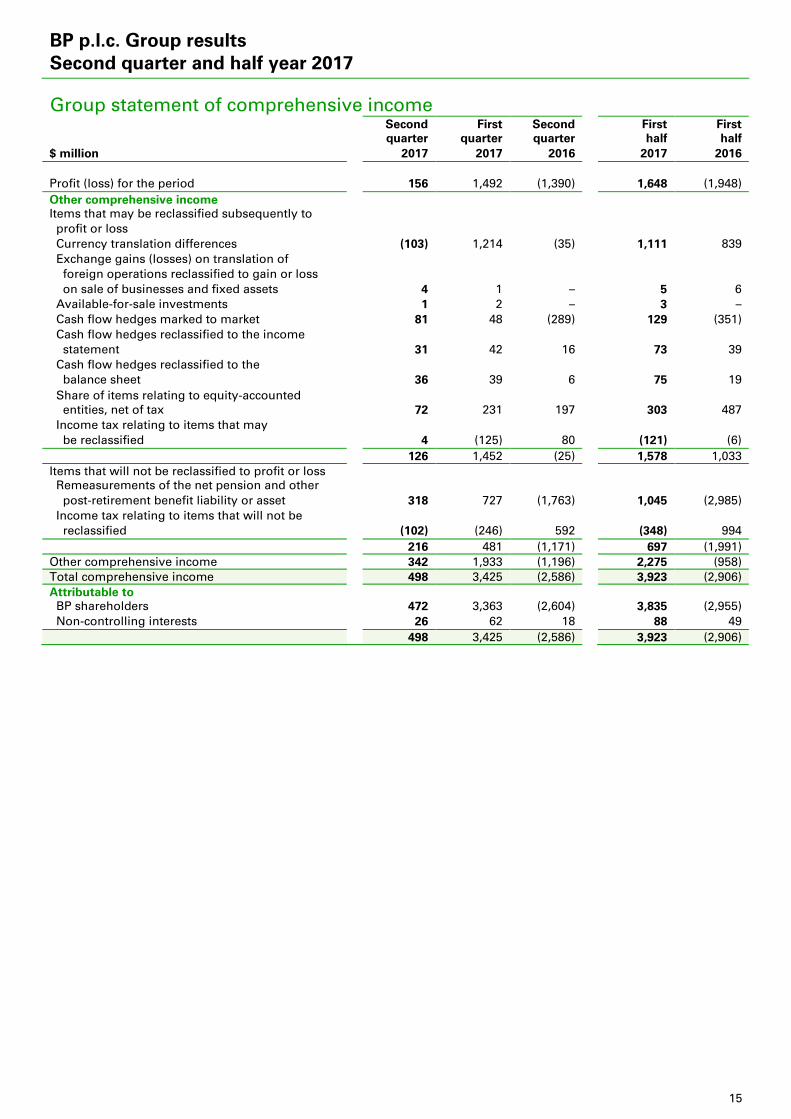
Group statement of comprehensive income Second First Second First First quarter quarter quarter half half $ million 2017 2017 2016 2017 2016 Profit (loss) for the period 156 1,492 (1,390) 1,648 (1,948) Other comprehensive income Items that may be reclassified subsequently to profit or loss Currency translation differences (103) 1,214 (35) 1,111 839 Exchange gains (losses) on translation of foreign operations reclassified to gain or loss on sale of businesses and fixed assets 4 1 – 5 6 Available-for-sale investments 1 2 – 3 – Cash flow hedges marked to market 81 48 (289) 129 (351) Cash flow hedges reclassified to the income statement 31 42 16 73 39 Cash flow hedges reclassified to the balance sheet 36 39 6 75 19 Share of items relating to equity-accounted entities, net of tax 72 231 197 303 487 Income tax relating to items that may be reclassified 4 (125) 80 (121) (6) 126 1,452 (25) 1,578 1,033 Items that will not be reclassified to profit or loss Remeasurements of the net pension and other post-retirement benefit liability or asset 318 727 (1,763) 1,045 (2,985) Income tax relating to items that will not be reclassified (102) (246) 592 (348) 994 216 481 (1,171) 697 (1,991) Other comprehensive income 342 1,933 (1,196) 2,275 (958) Total comprehensive income 498 3,425 (2,586) 3,923 (2,906) Attributable to BP shareholders 472 3,363 (2,604) 3,835 (2,955) Non-controlling interests 26 62 18 88 49 498 3,425 (2,586) 3,923 (2,906)
16
BP p.l.c. Group results Second quarter and half year 2017
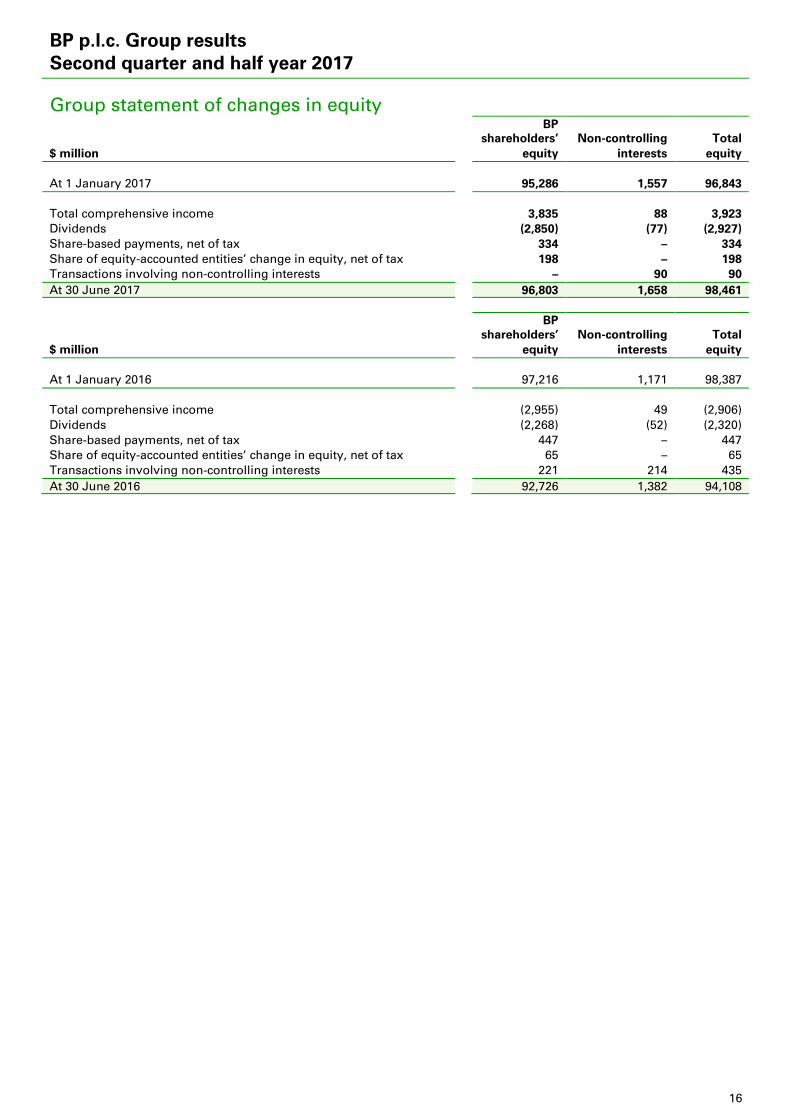
Group statement of changes in equity BP shareholders’ Non-controlling Total $ million equity interests equity At 1 January 2017 95,286 1,557 96,843 Total comprehensive income 3,835 88 3,923 Dividends (2,850) (77) (2,927) Share-based payments, net of tax 334 – 334 Share of equity-accounted entities’ change in equity, net of tax 198 – 198 Transactions involving non-controlling interests – 90 90 At 30 June 2017 96,803 1,658 98,461 BP shareholders’ Non-controlling Total $ million equity interests equity At 1 January 2016 97,216 1,171 98,387 Total comprehensive income (2,955) 49 (2,906) Dividends (2,268) (52) (2,320) Share-based payments, net of tax 447 – 447 Share of equity-accounted entities’ change in equity, net of tax 65 – 65 Transactions involving non-controlling interests 221 214 435 At 30 June 2016 92,726 1,382 94,108
17
BP p.l.c. Group results Second quarter and half year 2017
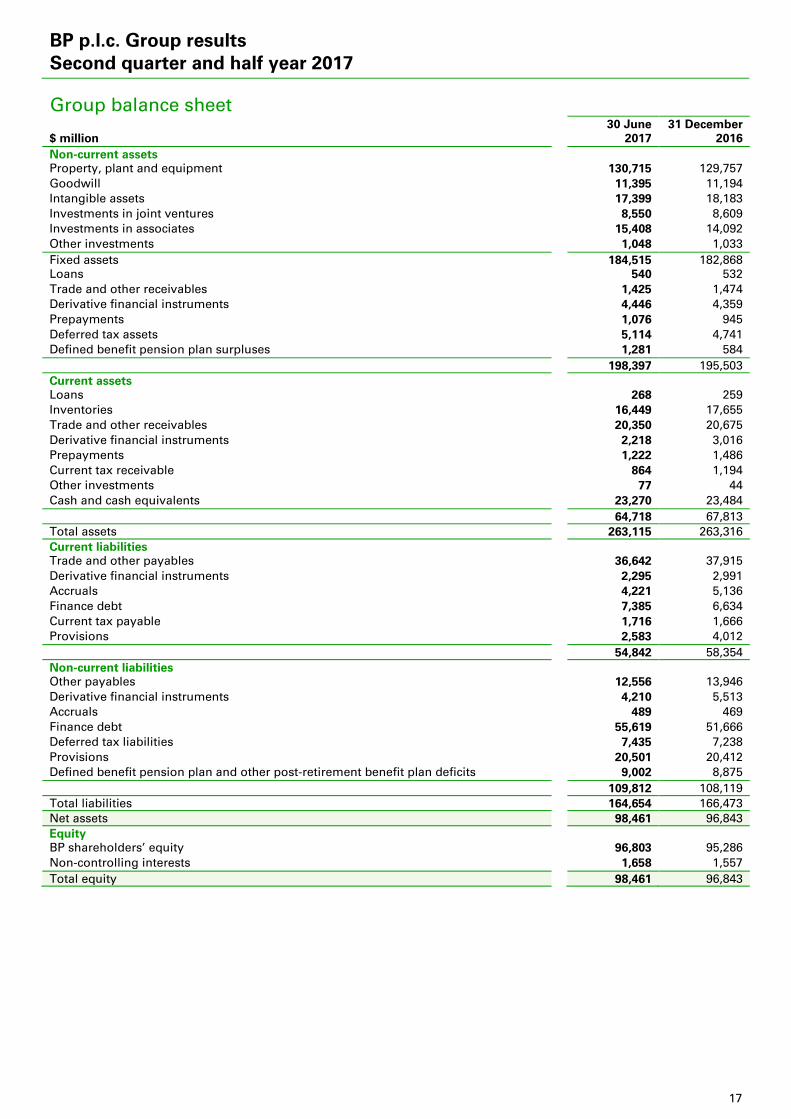
Group balance sheet 30 June 31 December $ million 2017 2016 Non-current assets Property, plant and equipment 130,715 129,757 Goodwill 11,395 11,194 Intangible assets 17,399 18,183 Investments in joint ventures 8,550 8,609 Investments in associates 15,408 14,092 Other investments 1,048 1,033 Fixed assets 184,515 182,868 Loans 540 532 Trade and other receivables 1,425 1,474 Derivative financial instruments 4,446 4,359 Prepayments 1,076 945 Deferred tax assets 5,114 4,741 Defined benefit pension plan surpluses 1,281 584 198,397 195,503 Current assets Loans 268 259 Inventories 16,449 17,655 Trade and other receivables 20,350 20,675 Derivative financial instruments 2,218 3,016 Prepayments 1,222 1,486 Current tax receivable 864 1,194 Other investments 77 44 Cash and cash equivalents 23,270 23,484 64,718 67,813 Total assets 263,115 263,316 Current liabilities Trade and other payables 36,642 37,915 Derivative financial instruments 2,295 2,991 Accruals 4,221 5,136 Finance debt 7,385 6,634 Current tax payable 1,716 1,666 Provisions 2,583 4,012 54,842 58,354 Non-current liabilities Other payables 12,556 13,946 Derivative financial instruments 4,210 5,513 Accruals 489 469 Finance debt 55,619 51,666 Deferred tax liabilities 7,435 7,238 Provisions 20,501 20,412 Defined benefit pension plan and other post-retirement benefit plan deficits 9,002 8,875 109,812 108,119 Total liabilities 164,654 166,473 Net assets 98,461 96,843 Equity BP shareholders’ equity 96,803 95,286 Non-controlling interests 1,658 1,557 Total equity 98,461 96,843
18
BP p.l.c. Group results Second quarter and half year 2017
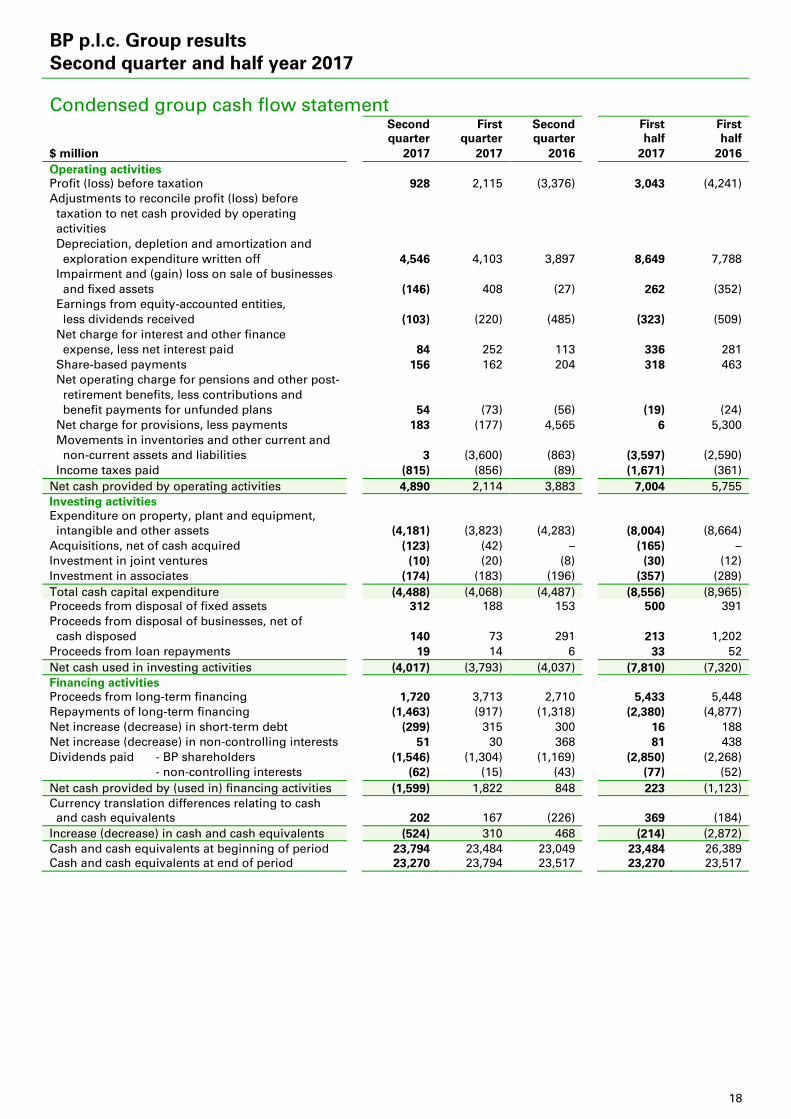
Condensed group cash flow statement Second First Second First First quarter quarter quarter half half $ million 2017 2017 2016 2017 2016 Operating activities Profit (loss) before taxation 928 2,115 (3,376) 3,043 (4,241) Adjustments to reconcile profit (loss) before
taxation to net cash provided by operating activities Depreciation, depletion and amortization and exploration expenditure written off 4,546 4,103 3,897 8,649 7,788 Impairment and (gain) loss on sale of businesses and fixed assets (146) 408 (27) 262 (352) Earnings from equity-accounted entities, less dividends received (103) (220) (485) (323) (509) Net charge for interest and other finance expense, less net interest paid 84 252 113 336 281 Share-based payments 156 162 204 318 463 Net operating charge for pensions and other post- retirement benefits, less contributions and benefit payments for unfunded plans 54 (73) (56) (19) (24) Net charge for provisions, less payments 183 (177) 4,565 6 5,300 Movements in inventories and other current and non-current assets and liabilities 3 (3,600) (863) (3,597) (2,590) Income taxes paid (815) (856) (89) (1,671) (361) Net cash provided by operating activities 4,890 2,114 3,883 7,004 5,755 Investing activities Expenditure on property, plant and equipment, intangible and other assets (4,181) (3,823) (4,283) (8,004) (8,664) Acquisitions, net of cash acquired (123) (42) – (165) – Investment in joint ventures (10) (20) (8) (30) (12) Investment in associates (174) (183) (196) (357) (289) Total cash capital expenditure (4,488) (4,068) (4,487) (8,556) (8,965) Proceeds from disposal of fixed assets 312 188 153 500 391 Proceeds from disposal of businesses, net of cash disposed 140 73 291 213 1,202 Proceeds from loan repayments 19 14 6 33 52 Net cash used in investing activities (4,017) (3,793) (4,037) (7,810) (7,320) Financing activities Proceeds from long-term financing 1,720 3,713 2,710 5,433 5,448 Repayments of long-term financing (1,463) (917) (1,318) (2,380) (4,877) Net increase (decrease) in short-term debt (299) 315 300 16 188 Net increase (decrease) in non-controlling interests 51 30 368 81 438 Dividends paid - BP shareholders (1,546) (1,304) (1,169) (2,850) (2,268) - non-controlling interests (62) (15) (43) (77) (52) Net cash provided by (used in) financing activities (1,599) 1,822 848 223 (1,123) Currency translation differences relating to cash and cash equivalents 202 167 (226) 369 (184) Increase (decrease) in cash and cash equivalents (524) 310 468 (214) (2,872) Cash and cash equivalents at beginning of period 23,794 23,484 23,049 23,484 26,389 Cash and cash equivalents at end of period 23,270 23,794 23,517 23,270 23,517
19
BP p.l.c. Group results Second quarter and half year 2017
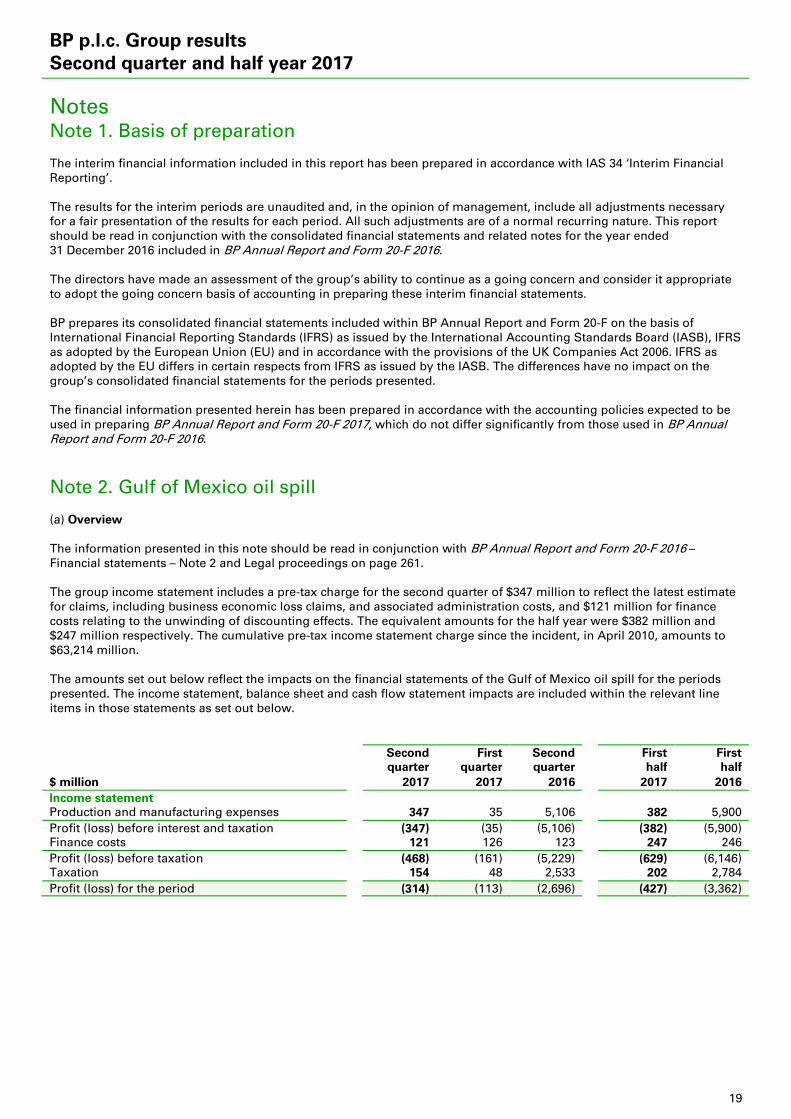
Notes Note 1. Basis of preparation The interim financial information included in this report has been prepared in accordance with IAS 34 ‘Interim Financial Reporting’. The results for the interim periods are unaudited and, in the opinion of management, include all adjustments necessary for a fair presentation of the results for each period. All such adjustments are of a normal recurring nature. This report should be read in conjunction with the consolidated financial statements and related notes for the year ended 31 December 2016 included in BP Annual Report and Form 20-F 2016. The directors have made an assessment of the group’s ability to continue as a going concern and consider it appropriate to adopt the going concern basis of accounting in preparing these interim financial statements. BP prepares its consolidated financial statements included within BP Annual Report and Form 20-F on the basis of International Financial Reporting Standards (IFRS) as issued by the International Accounting Standards Board (IASB), IFRS as adopted by the European Union (EU) and in accordance with the provisions of the UK Companies Act 2006. IFRS as adopted by the EU differs in certain respects from IFRS as issued by the IASB. The differences have no impact on the group’s consolidated financial statements for the periods presented. The financial information presented herein has been prepared in accordance with the accounting policies expected to be used in preparing BP Annual Report and Form 20-F 2017, which do not differ significantly from those used in BP Annual Report and Form 20-F 2016.
Note 2. Gulf of Mexico oil spill (a) Overview The information presented in this note should be read in conjunction with BP Annual Report and Form 20-F 2016 – Financial statements – Note 2 and Legal proceedings on page 261. The group income statement includes a pre-tax charge for the second quarter of $347 million to reflect the latest estimate for claims, including business economic loss claims, and associated administration costs, and $121 million for finance costs relating to the unwinding of discounting effects. The equivalent amounts for the half year were $382 million and $247 million respectively. The cumulative pre-tax income statement charge since the incident, in April 2010, amounts to $63,214 million. The amounts set out below reflect the impacts on the financial statements of the Gulf of Mexico oil spill for the periods presented. The income statement, balance sheet and cash flow statement impacts are included within the relevant line items in those statements as set out below.
Second First Second First First quarter quarter quarter half half $ million 2017 2017 2016 2017 2016 Income statement Production and manufacturing expenses 347 35 5,106 382 5,900 Profit (loss) before interest and taxation (347) (35) (5,106) (382) (5,900) Finance costs 121 126 123 247 246 Profit (loss) before taxation (468) (161) (5,229) (629) (6,146) Taxation 154 48 2,533 202 2,784 Profit (loss) for the period (314) (113) (2,696) (427) (3,362)
20
BP p.l.c. Group results Second quarter and half year 2017
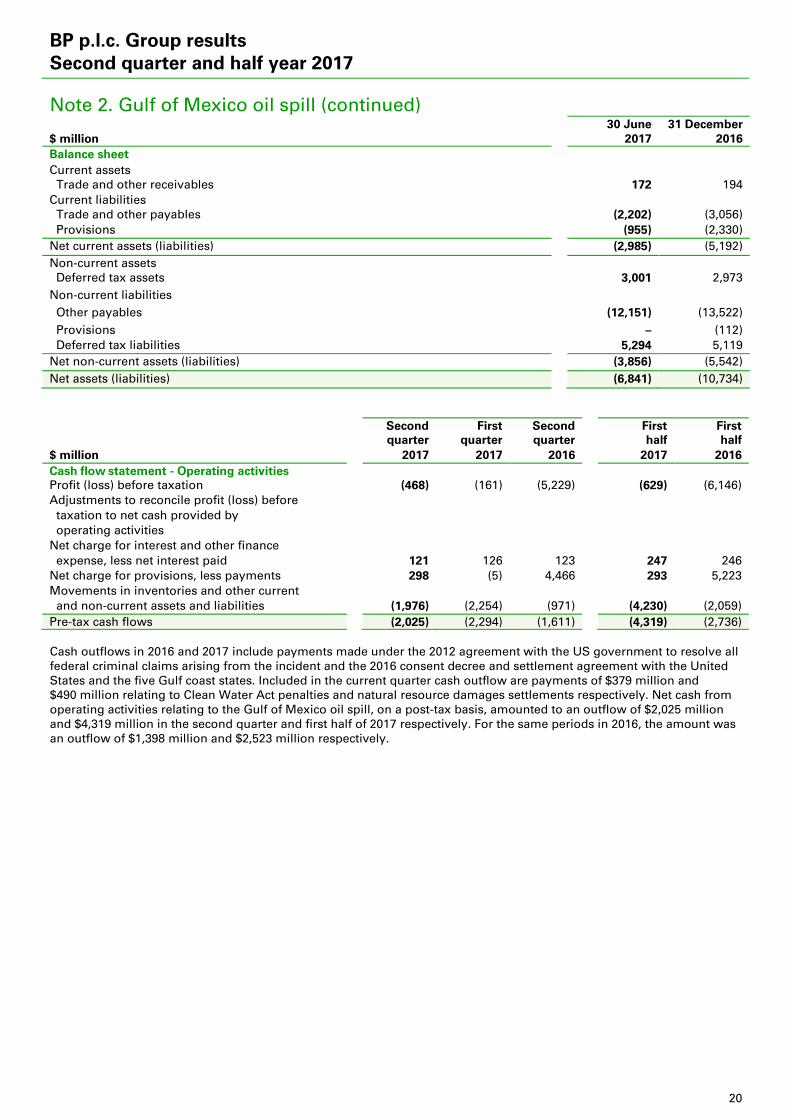
Note 2. Gulf of Mexico oil spill (continued) 30 June 31 December $ million 2017 2016 Balance sheet Current assets Trade and other receivables 172 194 Current liabilities Trade and other payables (2,202) (3,056) Provisions (955) (2,330) Net current assets (liabilities) (2,985) (5,192) Non-current assets Deferred tax assets 3,001 2,973 Non-current liabilities Other payables (12,151) (13,522) Provisions – (112) Deferred tax liabilities 5,294 5,119 Net non-current assets (liabilities) (3,856) (5,542) Net assets (liabilities) (6,841) (10,734) Second First Second First First quarter quarter quarter half half $ million 2017 2017 2016 2017 2016 Cash flow statement - Operating activities Profit (loss) before taxation (468) (161) (5,229) (629) (6,146) Adjustments to reconcile profit (loss) before taxation to net cash provided by operating activities Net charge for interest and other finance expense, less net interest paid 121 126 123 247 246 Net charge for provisions, less payments 298 (5) 4,466 293 5,223 Movements in inventories and other current and non-current assets and liabilities (1,976) (2,254) (971) (4,230) (2,059) Pre-tax cash flows (2,025) (2,294) (1,611) (4,319) (2,736) Cash outflows in 2016 and 2017 include payments made under the 2012 agreement with the US government to resolve all federal criminal claims arising from the incident and the 2016 consent decree and settlement agreement with the United States and the five Gulf coast states. Included in the current quarter cash outflow are payments of $379 million and $490 million relating to Clean Water Act penalties and natural resource damages settlements respectively. Net cash from operating activities relating to the Gulf of Mexico oil spill, on a post-tax basis, amounted to an outflow of $2,025 million and $4,319 million in the second quarter and first half of 2017 respectively. For the same periods in 2016, the amount was an outflow of $1,398 million and $2,523 million respectively.
21
BP p.l.c. Group results Second quarter and half year 2017
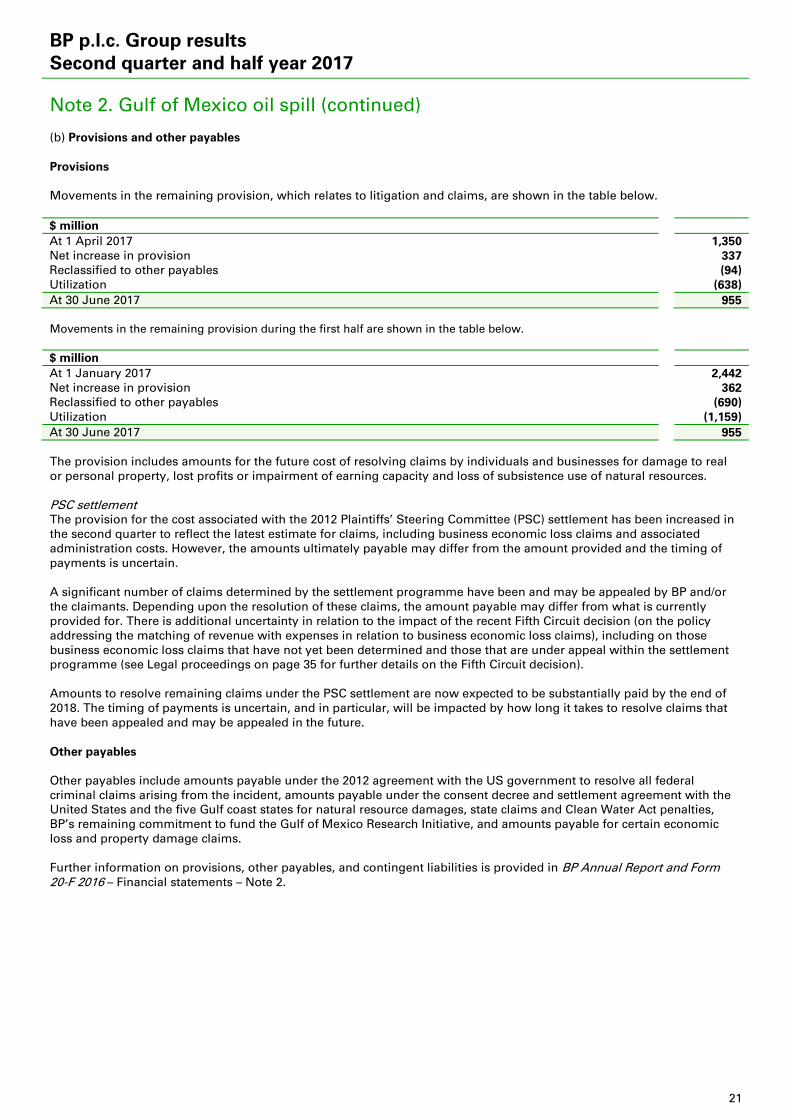
Note 2. Gulf of Mexico oil spill (continued) (b) Provisions and other payables Provisions Movements in the remaining provision, which relates to litigation and claims, are shown in the table below. $ million At 1 April 2017 1,350 Net increase in provision 337 Reclassified to other payables (94) Utilization (638) At 30 June 2017 955 Movements in the remaining provision during the first half are shown in the table below. $ million At 1 January 2017 2,442 Net increase in provision 362 Reclassified to other payables (690) Utilization (1,159) At 30 June 2017 955 The provision includes amounts for the future cost of resolving claims by individuals and businesses for damage to real or personal property, lost profits or impairment of earning capacity and loss of subsistence use of natural resources. PSC settlement The provision for the cost associated with the 2012 Plaintiffs’ Steering Committee (PSC) settlement has been increased in the second quarter to reflect the latest estimate for claims, including business economic loss claims and associated administration costs. However, the amounts ultimately payable may differ from the amount provided and the timing of payments is uncertain. A significant number of claims determined by the settlement programme have been and may be appealed by BP and/or the claimants. Depending upon the resolution of these claims, the amount payable may differ from what is currently provided for. There is additional uncertainty in relation to the impact of the recent Fifth Circuit decision (on the policy addressing the matching of revenue with expenses in relation to business economic loss claims), including on those business economic loss claims that have not yet been determined and those that are under appeal within the settlement programme (see Legal proceedings on page 35 for further details on the Fifth Circuit decision). Amounts to resolve remaining claims under the PSC settlement are now expected to be substantially paid by the end of 2018. The timing of payments is uncertain, and in particular, will be impacted by how long it takes to resolve claims that have been appealed and may be appealed in the future. Other payables Other payables include amounts payable under the 2012 agreement with the US government to resolve all federal criminal claims arising from the incident, amounts payable under the consent decree and settlement agreement with the United States and the five Gulf coast states for natural resource damages, state claims and Clean Water Act penalties, BP’s remaining commitment to fund the Gulf of Mexico Research Initiative, and amounts payable for certain economic loss and property damage claims. Further information on provisions, other payables, and contingent liabilities is provided in BP Annual Report and Form 20-F 2016 – Financial statements – Note 2.
22
BP p.l.c. Group results Second quarter and half year 2017
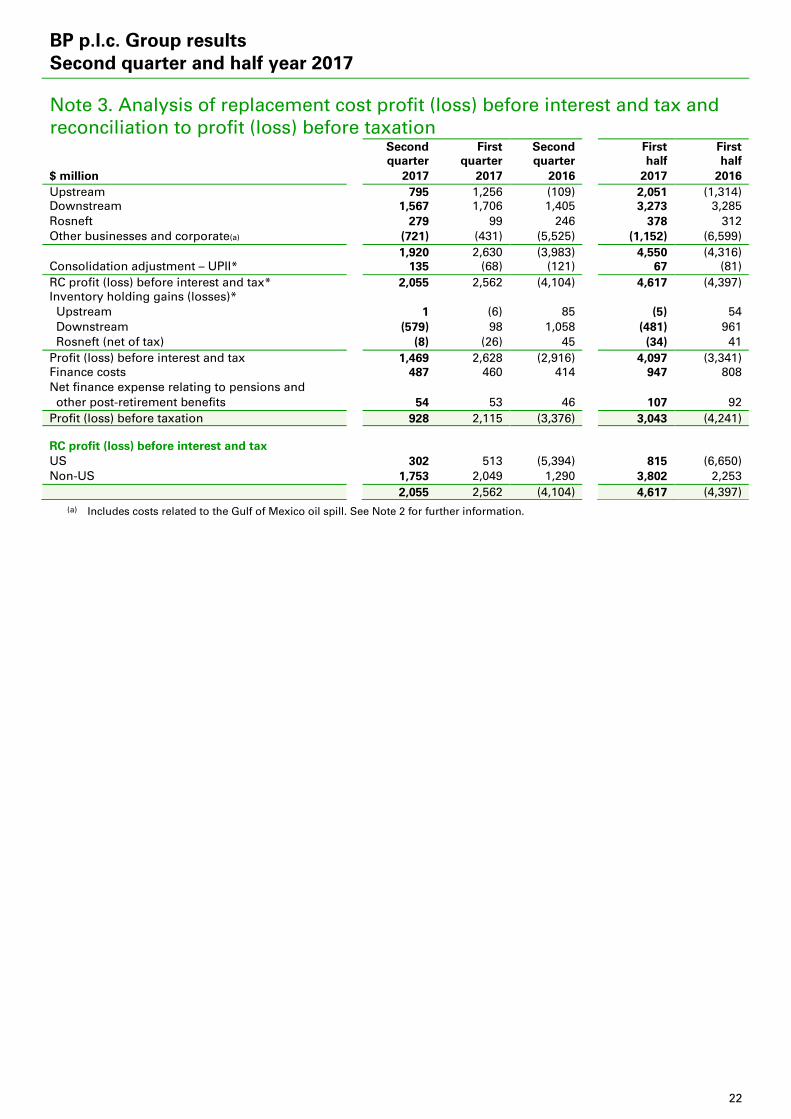
Note 3. Analysis of replacement cost profit (loss) before interest and tax and reconciliation to profit (loss) before taxation Second First Second First First quarter quarter quarter half half $ million 2017 2017 2016 2017 2016 Upstream 795 1,256 (109) 2,051 (1,314) Downstream 1,567 1,706 1,405 3,273 3,285 Rosneft 279 99 246 378 312 Other businesses and corporate(a) (721) (431) (5,525) (1,152) (6,599) 1,920 2,630 (3,983) 4,550 (4,316) Consolidation adjustment – UPII* 135 (68) (121) 67 (81) RC profit (loss) before interest and tax* 2,055 2,562 (4,104) 4,617 (4,397) Inventory holding gains (losses)* Upstream 1 (6) 85 (5) 54 Downstream (579) 98 1,058 (481) 961 Rosneft (net of tax) (8) (26) 45 (34) 41 Profit (loss) before interest and tax 1,469 2,628 (2,916) 4,097 (3,341) Finance costs 487 460 414 947 808 Net finance expense relating to pensions and other post-retirement benefits 54 53 46 107 92 Profit (loss) before taxation 928 2,115 (3,376) 3,043 (4,241)
RC profit (loss) before interest and tax US 302 513 (5,394) 815 (6,650) Non-US 1,753 2,049 1,290 3,802 2,253 2,055 2,562 (4,104) 4,617 (4,397)
(a) Includes costs related to the Gulf of Mexico oil spill. See Note 2 for further information.
23
BP p.l.c. Group results Second quarter and half year 2017
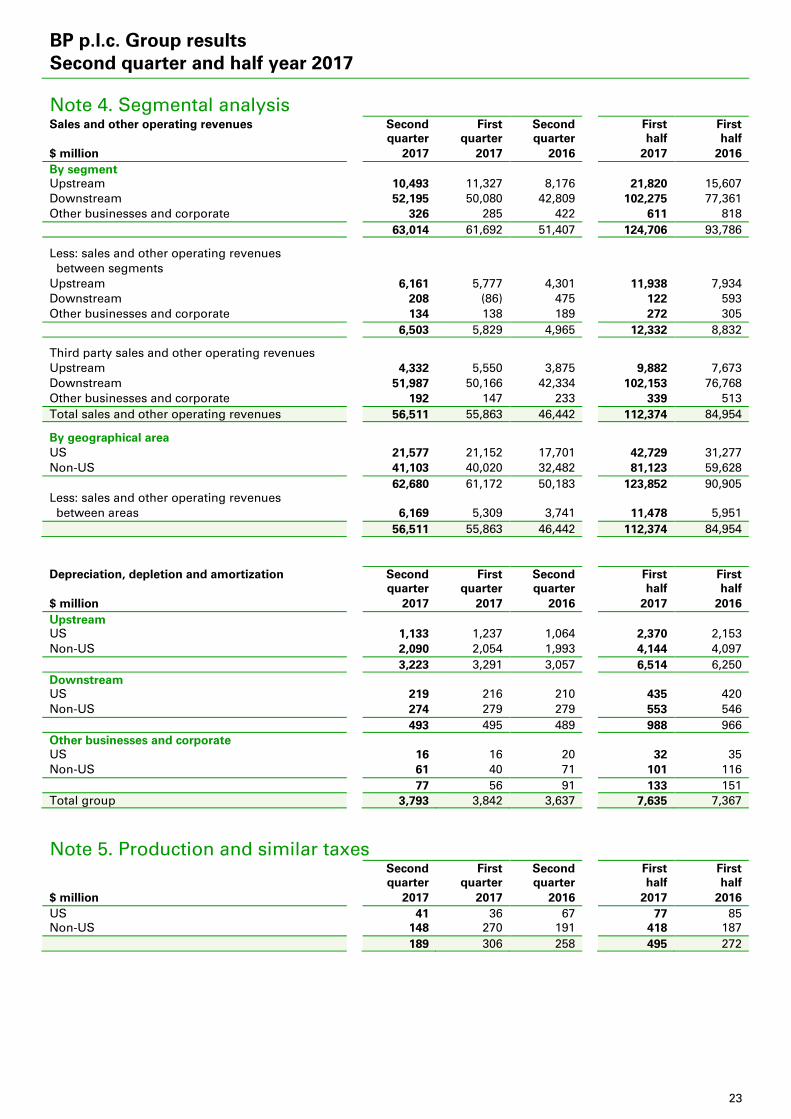
Note 4. Segmental analysis Sales and other operating revenues Second First Second First First quarter quarter quarter half half $ million 2017 2017 2016 2017 2016 By segment Upstream 10,493 11,327 8,176 21,820 15,607 Downstream 52,195 50,080 42,809 102,275 77,361 Other businesses and corporate 326 285 422 611 818 63,014 61,692 51,407 124,706 93,786
Less: sales and other operating revenues between segments Upstream 6,161 5,777 4,301 11,938 7,934 Downstream 208 (86) 475 122 593 Other businesses and corporate 134 138 189 272 305 6,503 5,829 4,965 12,332 8,832
Third party sales and other operating revenues Upstream 4,332 5,550 3,875 9,882 7,673 Downstream 51,987 50,166 42,334 102,153 76,768 Other businesses and corporate 192 147 233 339 513 Total sales and other operating revenues 56,511 55,863 46,442 112,374 84,954
By geographical area US 21,577 21,152 17,701 42,729 31,277 Non-US 41,103 40,020 32,482 81,123 59,628 62,680 61,172 50,183 123,852 90,905 Less: sales and other operating revenues between areas 6,169 5,309 3,741 11,478 5,951
56,511 55,863 46,442 112,374 84,954 Depreciation, depletion and amortization Second First Second First First quarter quarter quarter half half $ million 2017 2017 2016 2017 2016 Upstream US 1,133 1,237 1,064 2,370 2,153 Non-US 2,090 2,054 1,993 4,144 4,097 3,223 3,291 3,057 6,514 6,250 Downstream US 219 216 210 435 420 Non-US 274 279 279 553 546 493 495 489 988 966 Other businesses and corporate US 16 16 20 32 35 Non-US 61 40 71 101 116 77 56 91 133 151 Total group 3,793 3,842 3,637 7,635 7,367
Note 5. Production and similar taxes Second First Second First First quarter quarter quarter half half $ million 2017 2017 2016 2017 2016 US 41 36 67 77 85 Non-US 148 270 191 418 187
189 306 258 495 272
24
BP p.l.c. Group results Second quarter and half year 2017
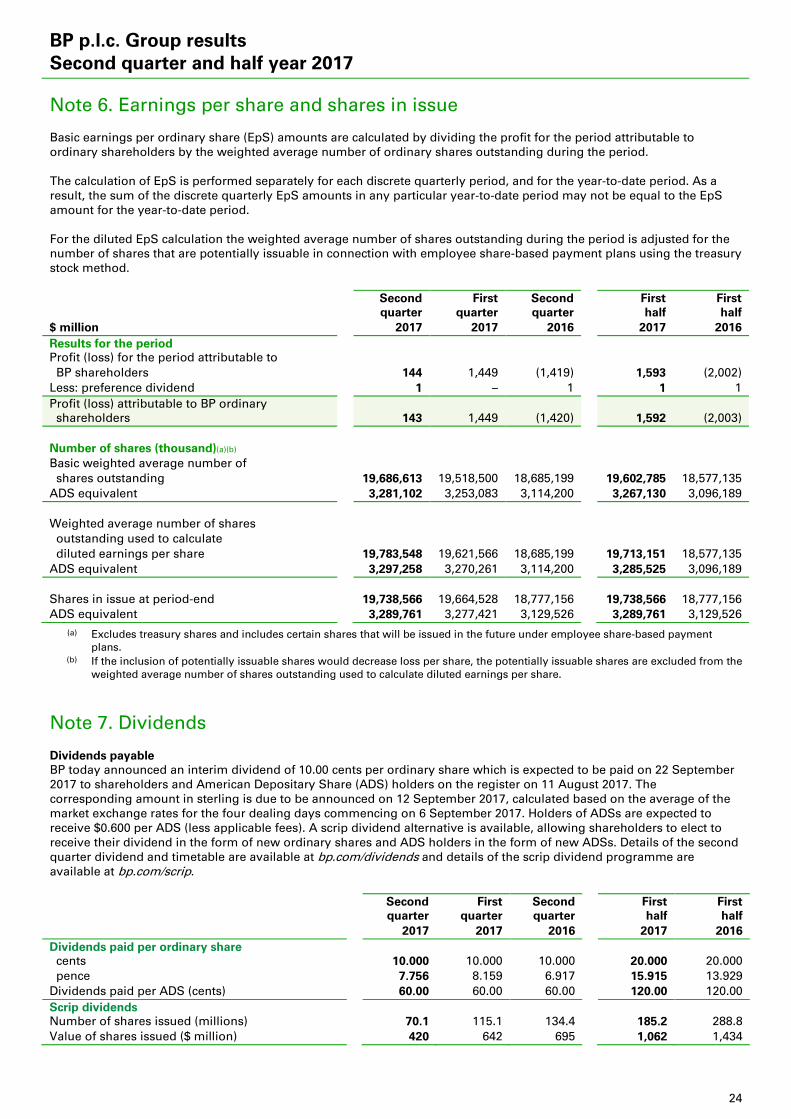
Note 6. Earnings per share and shares in issue Basic earnings per ordinary share (EpS) amounts are calculated by dividing the profit for the period attributable to ordinary shareholders by the weighted average number of ordinary shares outstanding during the period. The calculation of EpS is performed separately for each discrete quarterly period, and for the year-to-date period. As a result, the sum of the discrete quarterly EpS amounts in any particular year-to-date period may not be equal to the EpS amount for the year-to-date period. For the diluted EpS calculation the weighted average number of shares outstanding during the period is adjusted for the number of shares that are potentially issuable in connection with employee share-based payment plans using the treasury stock method. Second First Second First First quarter quarter quarter half half $ million 2017 2017 2016 2017 2016 Results for the period Profit (loss) for the period attributable to BP shareholders 144 1,449 (1,419) 1,593 (2,002) Less: preference dividend 1 – 1 1 1 Profit (loss) attributable to BP ordinary shareholders 143 1,449 (1,420) 1,592 (2,003) Number of shares (thousand)(a)(b) Basic weighted average number of shares outstanding 19,686,613 19,518,500 18,685,199 19,602,785 18,577,135 ADS equivalent 3,281,102 3,253,083 3,114,200 3,267,130 3,096,189 Weighted average number of shares outstanding used to calculate diluted earnings per share 19,783,548 19,621,566 18,685,199 19,713,151 18,577,135 ADS equivalent 3,297,258 3,270,261 3,114,200 3,285,525 3,096,189 Shares in issue at period-end 19,738,566 19,664,528 18,777,156 19,738,566 18,777,156 ADS equivalent 3,289,761 3,277,421 3,129,526 3,289,761 3,129,526
(a) Excludes treasury shares and includes certain shares that will be issued in the future under employee share-based payment plans.
(b) If the inclusion of potentially issuable shares would decrease loss per share, the potentially issuable shares are excluded from the weighted average number of shares outstanding used to calculate diluted earnings per share.
Note 7. Dividends Dividends payable BP today announced an interim dividend of 10.00 cents per ordinary share which is expected to be paid on 22 September 2017 to shareholders and American Depositary Share (ADS) holders on the register on 11 August 2017. The corresponding amount in sterling is due to be announced on 12 September 2017, calculated based on the average of the market exchange rates for the four dealing days commencing on 6 September 2017. Holders of ADSs are expected to receive $0.600 per ADS (less applicable fees). A scrip dividend alternative is available, allowing shareholders to elect to receive their dividend in the form of new ordinary shares and ADS holders in the form of new ADSs. Details of the second quarter dividend and timetable are available at bp.com/dividends and details of the scrip dividend programme are available at bp.com/scrip. Second First Second First First quarter quarter quarter half half 2017 2017 2016 2017 2016 Dividends paid per ordinary share cents 10.000 10.000 10.000 20.000 20.000 pence 7.756 8.159 6.917 15.915 13.929 Dividends paid per ADS (cents) 60.00 60.00 60.00 120.00 120.00 Scrip dividends Number of shares issued (millions) 70.1 115.1 134.4 185.2 288.8 Value of shares issued ($ million) 420 642 695 1,062 1,434
25
BP p.l.c. Group results Second quarter and half year 2017
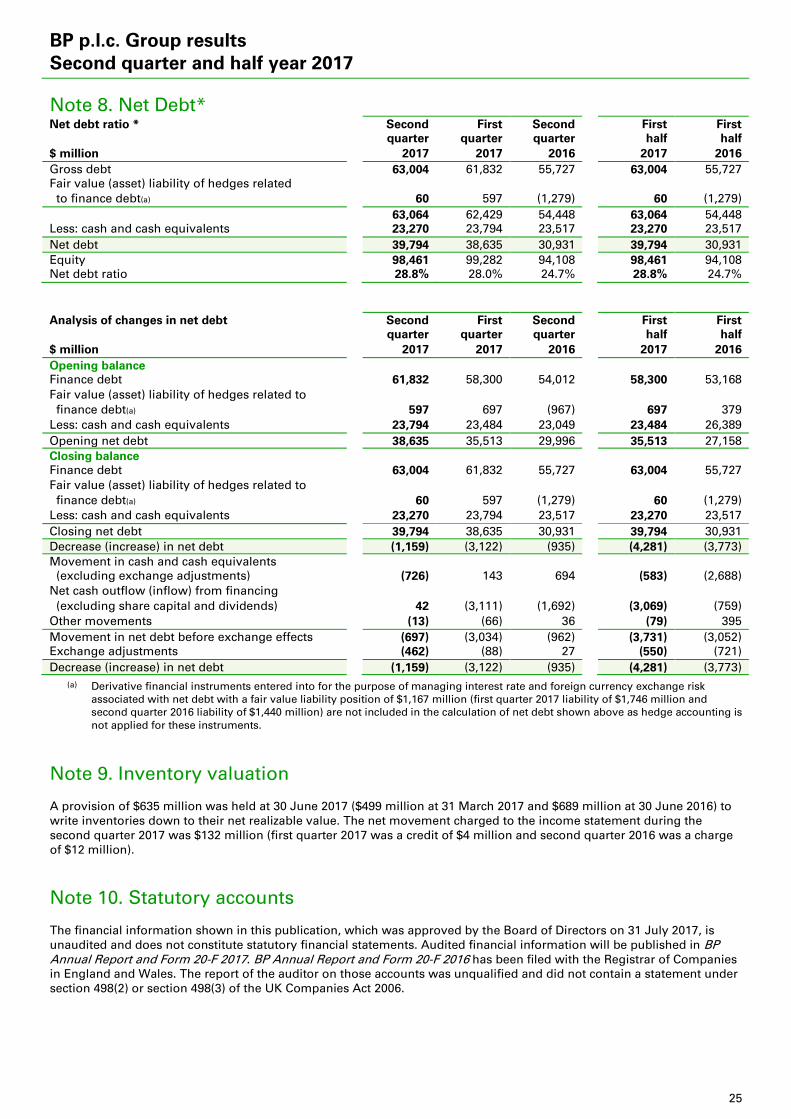
Note 8. Net Debt* Net debt ratio * Second First Second First First quarter quarter quarter half half $ million 2017 2017 2016 2017 2016 Gross debt 63,004 61,832 55,727 63,004 55,727 Fair value (asset) liability of hedges related to finance debt(a) 60 597 (1,279) 60 (1,279) 63,064 62,429 54,448 63,064 54,448 Less: cash and cash equivalents 23,270 23,794 23,517 23,270 23,517 Net debt 39,794 38,635 30,931 39,794 30,931 Equity 98,461 99,282 94,108 98,461 94,108 Net debt ratio 28.8% 28.0% 24.7% 28.8% 24.7% Analysis of changes in net debt Second First Second First First quarter quarter quarter half half $ million 2017 2017 2016 2017 2016 Opening balance Finance debt 61,832 58,300 54,012 58,300 53,168 Fair value (asset) liability of hedges related to finance debt(a) 597 697 (967) 697 379 Less: cash and cash equivalents 23,794 23,484 23,049 23,484 26,389 Opening net debt 38,635 35,513 29,996 35,513 27,158 Closing balance Finance debt 63,004 61,832 55,727 63,004 55,727 Fair value (asset) liability of hedges related to finance debt(a) 60 597 (1,279) 60 (1,279) Less: cash and cash equivalents 23,270 23,794 23,517 23,270 23,517 Closing net debt 39,794 38,635 30,931 39,794 30,931 Decrease (increase) in net debt (1,159) (3,122) (935) (4,281) (3,773) Movement in cash and cash equivalents (excluding exchange adjustments) (726) 143 694 (583) (2,688) Net cash outflow (inflow) from financing (excluding share capital and dividends) 42 (3,111) (1,692) (3,069) (759) Other movements (13) (66) 36 (79) 395 Movement in net debt before exchange effects (697) (3,034) (962) (3,731) (3,052) Exchange adjustments (462) (88) 27 (550) (721) Decrease (increase) in net debt (1,159) (3,122) (935) (4,281) (3,773)
(a) Derivative financial instruments entered into for the purpose of managing interest rate and foreign currency exchange risk associated with net debt with a fair value liability position of $1,167 million (first quarter 2017 liability of $1,746 million and second quarter 2016 liability of $1,440 million) are not included in the calculation of net debt shown above as hedge accounting is not applied for these instruments.
Note 9. Inventory valuation A provision of $635 million was held at 30 June 2017 ($499 million at 31 March 2017 and $689 million at 30 June 2016) to write inventories down to their net realizable value. The net movement charged to the income statement during the second quarter 2017 was $132 million (first quarter 2017 was a credit of $4 million and second quarter 2016 was a charge of $12 million).
Note 10. Statutory accounts The financial information shown in this publication, which was approved by the Board of Directors on 31 July 2017, is unaudited and does not constitute statutory financial statements. Audited financial information will be published in BP Annual Report and Form 20-F 2017. BP Annual Report and Form 20-F 2016 has been filed with the Registrar of Companies in England and Wales. The report of the auditor on those accounts was unqualified and did not contain a statement under section 498(2) or section 498(3) of the UK Companies Act 2006.
26
BP p.l.c. Group results Second quarter and half year 2017
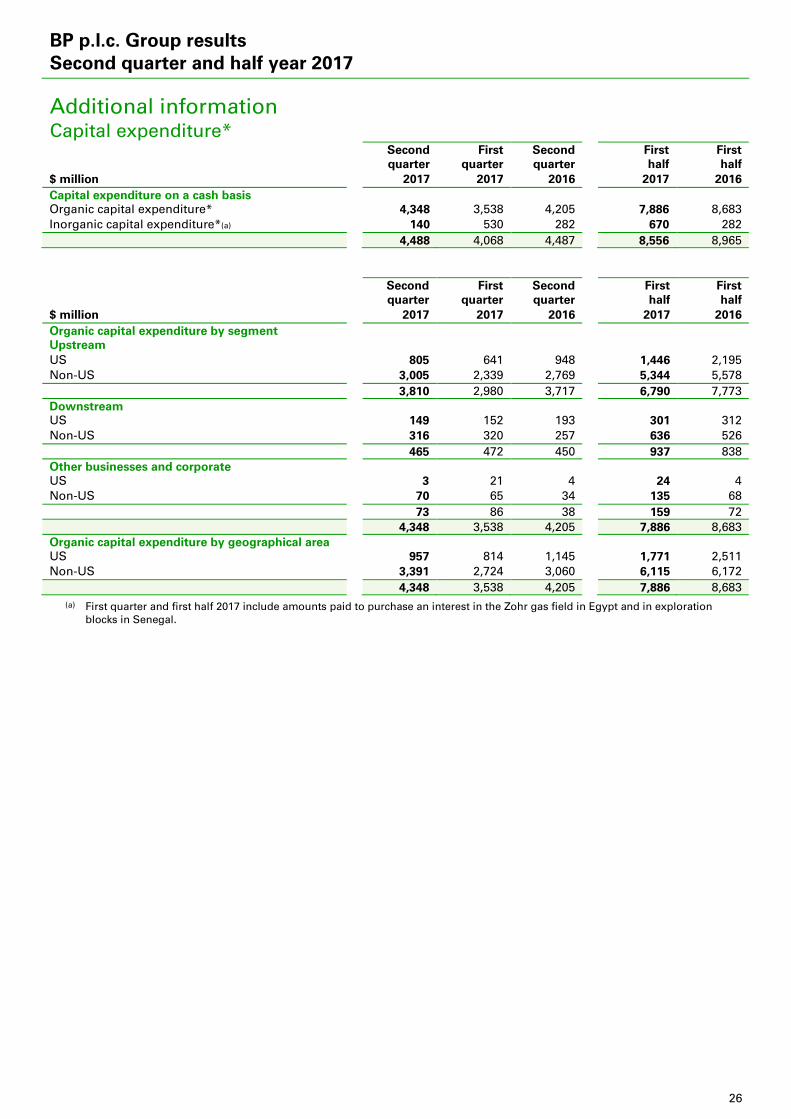
Additional information Capital expenditure* Second First Second First First quarter quarter quarter half half $ million 2017 2017 2016 2017 2016 Capital expenditure on a cash basis Organic capital expenditure* 4,348 3,538 4,205 7,886 8,683 Inorganic capital expenditure*(a) 140 530 282 670 282 4,488 4,068 4,487 8,556 8,965 Second First Second First First quarter quarter quarter half half $ million 2017 2017 2016 2017 2016 Organic capital expenditure by segment Upstream US 805 641 948 1,446 2,195 Non-US 3,005 2,339 2,769 5,344 5,578 3,810 2,980 3,717 6,790 7,773 Downstream US 149 152 193 301 312 Non-US 316 320 257 636 526 465 472 450 937 838 Other businesses and corporate US 3 21 4 24 4 Non-US 70 65 34 135 68 73 86 38 159 72 4,348 3,538 4,205 7,886 8,683 Organic capital expenditure by geographical area US 957 814 1,145 1,771 2,511 Non-US 3,391 2,724 3,060 6,115 6,172 4,348 3,538 4,205 7,886 8,683
(a) First quarter and first half 2017 include amounts paid to purchase an interest in the Zohr gas field in Egypt and in exploration blocks in Senegal.
27
BP p.l.c. Group results Second quarter and half year 2017
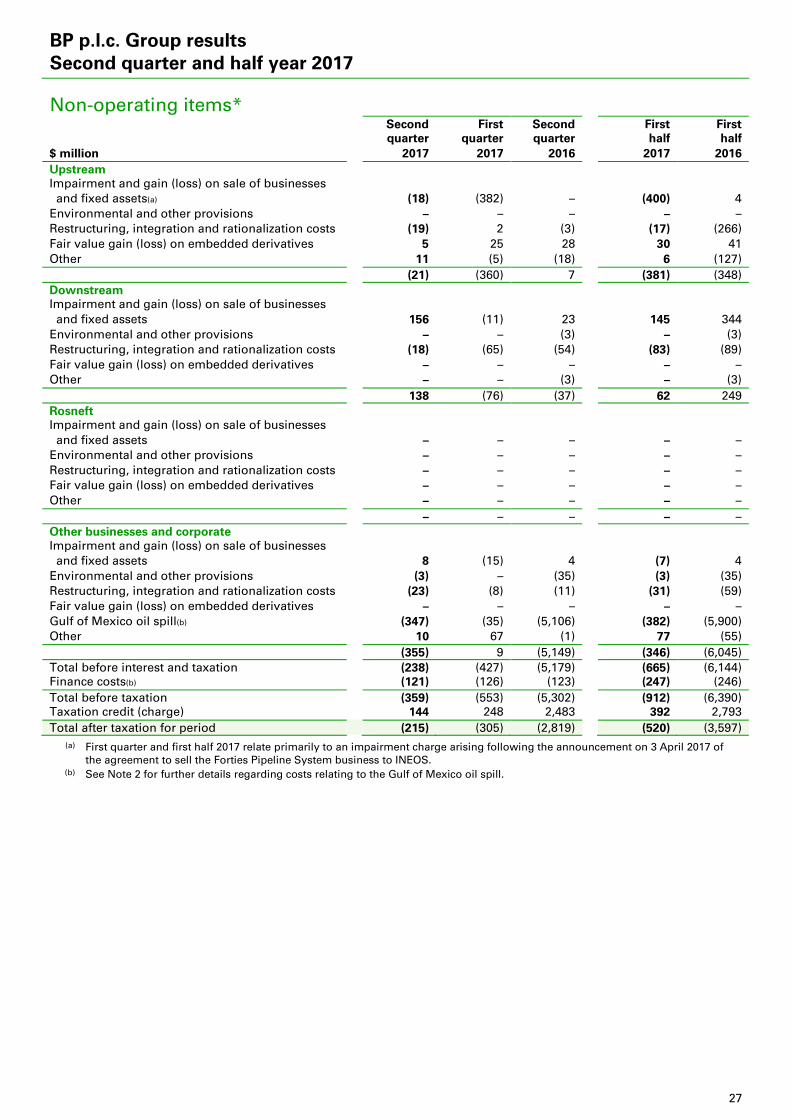
Non-operating items* Second First Second First First quarter quarter quarter half half $ million 2017 2017 2016 2017 2016 Upstream Impairment and gain (loss) on sale of businesses and fixed assets(a) (18) (382) – (400) 4 Environmental and other provisions – – – – – Restructuring, integration and rationalization costs (19) 2 (3) (17) (266) Fair value gain (loss) on embedded derivatives 5 25 28 30 41 Other 11 (5) (18) 6 (127) (21) (360) 7 (381) (348) Downstream Impairment and gain (loss) on sale of businesses and fixed assets 156 (11) 23 145 344 Environmental and other provisions – – (3) – (3) Restructuring, integration and rationalization costs (18) (65) (54) (83) (89) Fair value gain (loss) on embedded derivatives – – – – – Other – – (3) – (3) 138 (76) (37) 62 249 Rosneft Impairment and gain (loss) on sale of businesses and fixed assets – – – – – Environmental and other provisions – – – – – Restructuring, integration and rationalization costs – – – – – Fair value gain (loss) on embedded derivatives – – – – – Other – – – – – – – – – – Other businesses and corporate Impairment and gain (loss) on sale of businesses and fixed assets 8 (15) 4 (7) 4 Environmental and other provisions (3) – (35) (3) (35) Restructuring, integration and rationalization costs (23) (8) (11) (31) (59) Fair value gain (loss) on embedded derivatives – – – – – Gulf of Mexico oil spill(b) (347) (35) (5,106) (382) (5,900) Other 10 67 (1) 77 (55) (355) 9 (5,149) (346) (6,045) Total before interest and taxation (238) (427) (5,179) (665) (6,144) Finance costs(b) (121) (126) (123) (247) (246) Total before taxation (359) (553) (5,302) (912) (6,390) Taxation credit (charge) 144 248 2,483 392 2,793 Total after taxation for period (215) (305) (2,819) (520) (3,597)
(a) First quarter and first half 2017 relate primarily to an impairment charge arising following the announcement on 3 April 2017 of the agreement to sell the Forties Pipeline System business to INEOS.
(b) See Note 2 for further details regarding costs relating to the Gulf of Mexico oil spill.
28
BP p.l.c. Group results Second quarter and half year 2017
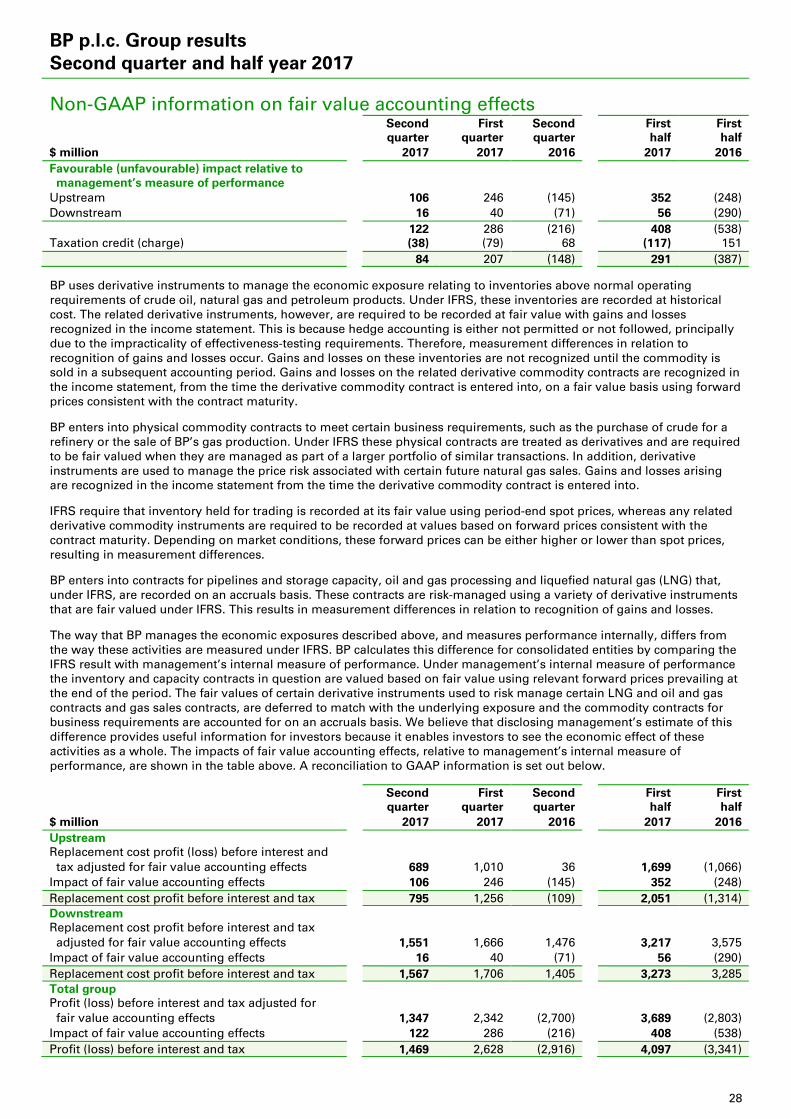
Non-GAAP information on fair value accounting effects Second First Second First First quarter quarter quarter half half $ million 2017 2017 2016 2017 2016 Favourable (unfavourable) impact relative to management’s measure of performance Upstream 106 246 (145) 352 (248) Downstream 16 40 (71) 56 (290) 122 286 (216) 408 (538) Taxation credit (charge) (38) (79) 68 (117) 151 84 207
(148) 291 (387)
BP uses derivative instruments to manage the economic exposure relating to inventories above normal operating requirements of crude oil, natural gas and petroleum products. Under IFRS, these inventories are recorded at historical cost. The related derivative instruments, however, are required to be recorded at fair value with gains and losses recognized in the income statement. This is because hedge accounting is either not permitted or not followed, principally due to the impracticality of effectiveness-testing requirements. Therefore, measurement differences in relation to recognition of gains and losses occur. Gains and losses on these inventories are not recognized until the commodity is sold in a subsequent accounting period. Gains and losses on the related derivative commodity contracts are recognized in the income statement, from the time the derivative commodity contract is entered into, on a fair value basis using forward prices consistent with the contract maturity. BP enters into physical commodity contracts to meet certain business requirements, such as the purchase of crude for a refinery or the sale of BP’s gas production. Under IFRS these physical contracts are treated as derivatives and are required to be fair valued when they are managed as part of a larger portfolio of similar transactions. In addition, derivative instruments are used to manage the price risk associated with certain future natural gas sales. Gains and losses arising are recognized in the income statement from the time the derivative commodity contract is entered into. IFRS require that inventory held for trading is recorded at its fair value using period-end spot prices, whereas any related derivative commodity instruments are required to be recorded at values based on forward prices consistent with the contract maturity. Depending on market conditions, these forward prices can be either higher or lower than spot prices, resulting in measurement differences. BP enters into contracts for pipelines and storage capacity, oil and gas processing and liquefied natural gas (LNG) that, under IFRS, are recorded on an accruals basis. These contracts are risk-managed using a variety of derivative instruments that are fair valued under IFRS. This results in measurement differences in relation to recognition of gains and losses. The way that BP manages the economic exposures described above, and measures performance internally, differs from the way these activities are measured under IFRS. BP calculates this difference for consolidated entities by comparing the IFRS result with management’s internal measure of performance. Under management’s internal measure of performance the inventory and capacity contracts in question are valued based on fair value using relevant forward prices prevailing at the end of the period. The fair values of certain derivative instruments used to risk manage certain LNG and oil and gas contracts and gas sales contracts, are deferred to match with the underlying exposure and the commodity contracts for business requirements are accounted for on an accruals basis. We believe that disclosing management’s estimate of this difference provides useful information for investors because it enables investors to see the economic effect of these activities as a whole. The impacts of fair value accounting effects, relative to management’s internal measure of performance, are shown in the table above. A reconciliation to GAAP information is set out below.
Second First Second First First quarter quarter quarter half half $ million 2017 2017 2016 2017 2016 Upstream Replacement cost profit (loss) before interest and tax adjusted for fair value accounting effects 689 1,010 36 1,699 (1,066) Impact of fair value accounting effects 106 246 (145) 352 (248) Replacement cost profit before interest and tax 795 1,256 (109) 2,051 (1,314) Downstream Replacement cost profit before interest and tax adjusted for fair value accounting effects 1,551 1,666 1,476 3,217 3,575 Impact of fair value accounting effects 16 40 (71) 56 (290) Replacement cost profit before interest and tax 1,567 1,706 1,405 3,273 3,285 Total group Profit (loss) before interest and tax adjusted for fair value accounting effects 1,347 2,342 (2,700) 3,689 (2,803) Impact of fair value accounting effects 122 286 (216) 408 (538) Profit (loss) before interest and tax 1,469 2,628 (2,916) 4,097 (3,341)
29
BP p.l.c. Group results Second quarter and half year 2017
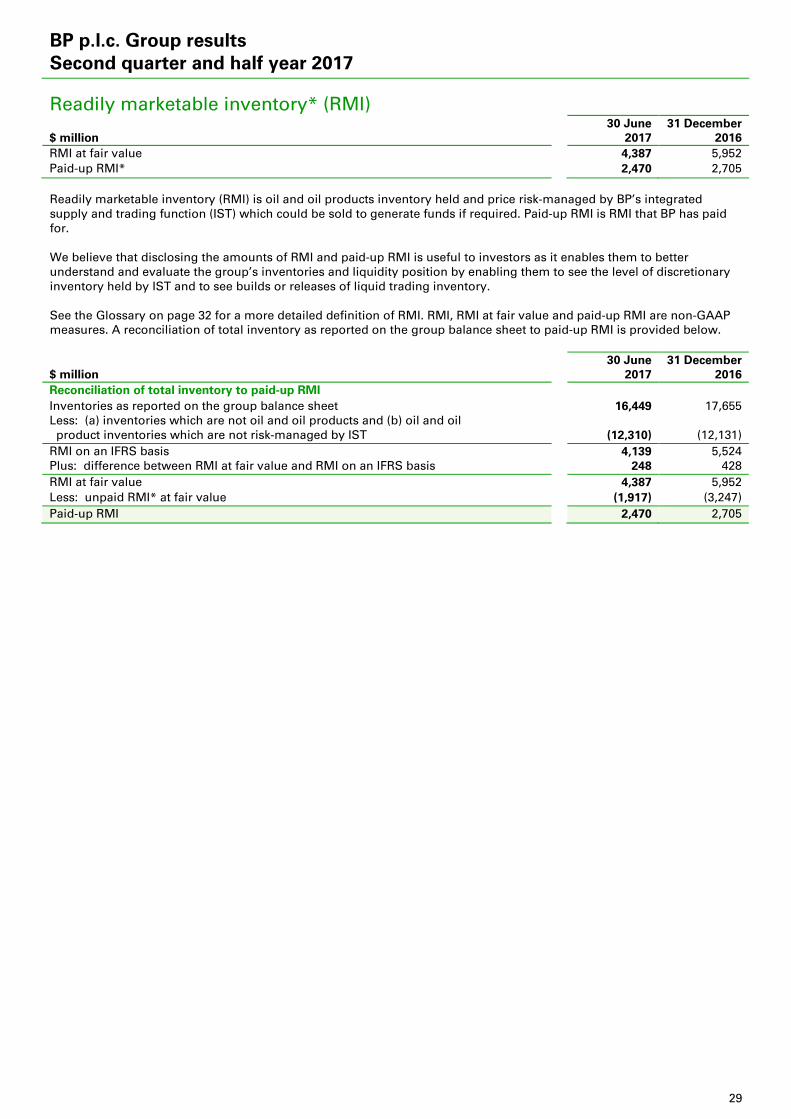
Readily marketable inventory* (RMI) 30 June 31 December $ million 2017 2016 RMI at fair value 4,387 5,952 Paid-up RMI* 2,470 2,705 Readily marketable inventory (RMI) is oil and oil products inventory held and price risk-managed by BP’s integrated supply and trading function (IST) which could be sold to generate funds if required. Paid-up RMI is RMI that BP has paid for. We believe that disclosing the amounts of RMI and paid-up RMI is useful to investors as it enables them to better understand and evaluate the group’s inventories and liquidity position by enabling them to see the level of discretionary inventory held by IST and to see builds or releases of liquid trading inventory. See the Glossary on page 32 for a more detailed definition of RMI. RMI, RMI at fair value and paid-up RMI are non-GAAP measures. A reconciliation of total inventory as reported on the group balance sheet to paid-up RMI is provided below. 30 June 31 December $ million 2017 2016 Reconciliation of total inventory to paid-up RMI Inventories as reported on the group balance sheet 16,449 17,655 Less: (a) inventories which are not oil and oil products and (b) oil and oil product inventories which are not risk-managed by IST (12,310) (12,131) RMI on an IFRS basis 4,139 5,524 Plus: difference between RMI at fair value and RMI on an IFRS basis 248 428 RMI at fair value 4,387 5,952 Less: unpaid RMI* at fair value (1,917) (3,247) Paid-up RMI 2,470 2,705
30
BP p.l.c. Group results Second quarter and half year 2017
Realizations* and marker prices Second First Second First First quarter quarter quarter half half 2017 2017 2016 2017 2016 Average realizations(a) Liquids* ($/bbl) US 44.65 46.34 34.89 45.51 31.82 Europe 47.79 53.28 43.62 50.50 37.46 Rest of World(b) 47.11 51.79 42.36 49.46 35.60 BP Average(b) 46.27 49.87 39.68 48.09 34.44 Natural gas ($/mcf) US 2.32 2.50 1.53 2.41 1.55 Europe 4.48 5.40 4.64 4.93 4.46 Rest of World 3.47 3.85 3.10 3.64 3.21 BP Average 3.19 3.50 2.66 3.34 2.75 Total hydrocarbons* ($/boe) US 32.46 34.29 24.00 33.39 22.38 Europe 41.10 46.69 39.25 43.84 34.28 Rest of World(b) 33.48 37.93 30.03 35.64 27.20 BP Average(b) 33.59 37.19 28.66 35.37 26.16 Average oil marker prices ($/bbl) Brent 49.64 53.69 45.59 51.71 39.81 West Texas Intermediate 48.11 51.70 45.53 49.89 39.64 Western Canadian Select 38.55 38.77 33.78 38.66 28.09 Alaska North Slope 50.61 53.82 45.74 52.20 40.00 Mars 46.92 49.59 42.08 48.24 36.25 Urals (NWE – cif) 48.48 51.88 43.37 50.22 37.56 Average natural gas marker prices Henry Hub gas price(c) ($/mmBtu) 3.19 3.32 1.95 3.25 2.02 UK Gas – National Balancing Point (p/therm) 37.83 48.19 31.37 43.14 30.90
(a) Based on sales of consolidated subsidiaries only – this excludes equity-accounted entities. (b) Production volume recognition methodology for our Technical Service Contract arrangement in Iraq has been simplified to
exclude the impact of oil price movements on lifting imbalances. A minor adjustment has been made to second quarter and first half 2016. There is no impact on the financial results.
(c) Henry Hub First of Month Index.
Exchange rates Second First Second First First quarter quarter quarter half half 2017 2017 2016 2017 2016 $/£ average rate for the period 1.28 1.24 1.43 1.26 1.43 $/£ period-end rate 1.30 1.25 1.34 1.30 1.34
$/€ average rate for the period 1.10 1.07 1.13 1.08 1.12 $/€ period-end rate 1.14 1.07 1.11 1.14 1.11
Rouble/$ average rate for the period 57.24 58.72 65.86 57.98 70.35 Rouble/$ period-end rate 59.05 56.01 63.64 59.05 63.64
31
BP p.l.c. Group results Second quarter and half year 2017
Principal risks and uncertainties The principal risks and uncertainties affecting BP are described in the Risk factors section of BP Annual Report and Form 20-F 2016 (pages 49-50) and are summarized below. There are no material changes in those risk factors for the remaining six months of the financial year. The risks summarized below, separately or in combination, could have a material adverse effect on the implementation of our strategy, our business, financial performance, results of operations, cash flows, liquidity, prospects, shareholder value and returns and reputation. Strategic and commercial risks
• Prices and markets – our financial performance is subject to fluctuating prices of oil, gas, refined products, technological change, exchange rate fluctuations, and the general macroeconomic outlook.
• Access, renewal and reserves progression – our inability to access, renew and progress upstream resources in a timely manner could adversely affect our long-term replacement of reserves.
• Major project* delivery – failure to invest in the best opportunities or deliver major projects successfully could adversely affect our financial performance.
• Geopolitical – we are exposed to a range of political developments and consequent changes to the operating and regulatory environment.
• Liquidity, financial capacity and financial, including credit, exposure – failure to work within our financial framework could impact our ability to operate and result in financial loss.
• Joint arrangements and contractors – we may have limited control over the standards, operations and compliance of our partners, contractors and sub-contractors.
• Digital infrastructure and cybersecurity – breach of our digital security or failure of our digital infrastructure could damage our operations and our reputation.
• Climate change and carbon pricing – public policies could increase costs and reduce future revenue and strategic growth opportunities.
• Competition – inability to remain efficient, innovate and retain an appropriately skilled workforce could negatively impact delivery of our strategy in a highly competitive market.
• Crisis management and business continuity – potential disruption to our business and operations could occur if we do not address an incident effectively.
• Insurance – our insurance strategy could expose the group to material uninsured losses. Safety and operational risks
• Process safety, personal safety, and environmental risks – we are exposed to a wide range of health, safety, security and environmental risks that could result in regulatory action, legal liability, increased costs, damage to our reputation and potentially denial of our licence to operate.
• Drilling and production – challenging operational environments and other uncertainties can impact drilling and production activities.
• Security – hostile acts against our staff and activities could cause harm to people and disrupt our operations. • Product quality – supplying customers with off-specification products could damage our reputation, lead to
regulatory action and legal liability, and potentially impact our financial performance. Compliance and control risks
• US government settlements – failure to comply with the terms of our settlements with legal and regulatory bodies in the US announced in November 2012 in respect of certain charges related to the Gulf of Mexico oil spill may expose us to further penalties or liabilities or could result in suspension or debarment of certain BP entities.
• Regulation – changes in the regulatory and legislative environment could increase the cost of compliance, affect our provisions and limit our access to new exploration opportunities.
• Ethical misconduct and non-compliance – ethical misconduct or breaches of applicable laws by our businesses or our employees could be damaging to our reputation, and could result in litigation, regulatory action and penalties.
• Treasury and trading activities – ineffective oversight of treasury and trading activities could lead to business disruption, financial loss, regulatory intervention or damage to our reputation.
• Reporting – failure to accurately report our data could lead to regulatory action, legal liability and reputational damage.
32
BP p.l.c. Group results Second quarter and half year 2017
Glossary Non-GAAP measures are provided for investors because they are closely tracked by management to evaluate BP’s operating performance and to make financial, strategic and operating decisions. Adjusted effective tax rate (ETR) is a non-GAAP measure. The adjusted ETR is calculated by dividing taxation on an underlying RC basis excluding the impact of the reduction in the rate of the UK North Sea supplementary charge in the third quarter 2016 by underlying RC profit or loss before tax. Taxation on an underlying RC basis is taxation on a RC basis for the period adjusted for taxation on non-operating items and fair value accounting effects. Information on underlying RC profit or loss is provided below. BP believes it is helpful to disclose the adjusted ETR because this measure may help investors to understand and evaluate, in the same manner as management, the underlying trends in BP’s operational performance on a comparable basis, period on period. The nearest equivalent measure on an IFRS basis is the ETR on profit or loss for the period. Capital expenditure is total cash capital expenditure as stated in the condensed group cash flow statement. Consolidation adjustment – UPII is unrealized profit in inventory arising on inter-segment transactions. Divestment proceeds are disposal proceeds as per the condensed group cash flow statement. Effective tax rate (ETR) on replacement cost (RC) profit or loss is a non-GAAP measure. The ETR on RC profit or loss is calculated by dividing taxation on a RC basis by RC profit or loss before tax. Information on RC profit or loss is provided below. BP believes it is helpful to disclose the ETR on RC profit or loss because this measure excludes the impact of price changes on the replacement of inventories and allows for more meaningful comparisons between reporting periods. The nearest equivalent measure on an IFRS basis is the ETR on profit or loss for the period. Fair value accounting effects are non-GAAP adjustments to our IFRS profit (loss) relating to certain physical inventories, pipelines and storage capacity. Management uses a fair-value basis to value these items which, under IFRS, are accounted for on an accruals basis with the exception of trading inventories, which are valued using spot prices. The adjustments have the effect of aligning the valuation basis of the physical positions with that of any associated derivative instruments, which are required to be fair valued under IFRS, in order to provide a more representative view of the ultimate economic value. Further information is provided on page 28. Gearing – See Net debt and net debt ratio definition. Hydrocarbons – Liquids and natural gas. Natural gas is converted to oil equivalent at 5.8 billion cubic feet = 1 million barrels. Inorganic capital expenditure is a subset of capital expenditure and is a non-GAAP measure. Inorganic capital expenditure comprises consideration in business combinations and certain other significant investments made by the group. It is reported on a cash basis. BP believes that this measure provides useful information as it allows investors to understand how BP’s management invests funds in projects which expand the group’s activities through acquisition. Further information and a reconciliation to GAAP information is provided on page 26. Inventory holding gains and losses represent the difference between the cost of sales calculated using the replacement cost of inventory and the cost of sales calculated on the first-in first-out (FIFO) method after adjusting for any changes in provisions where the net realizable value of the inventory is lower than its cost. Under the FIFO method, which we use for IFRS reporting, the cost of inventory charged to the income statement is based on its historical cost of purchase or manufacture, rather than its replacement cost. In volatile energy markets, this can have a significant distorting effect on reported income. The amounts disclosed represent the difference between the charge to the income statement for inventory on a FIFO basis (after adjusting for any related movements in net realizable value provisions) and the charge that would have arisen based on the replacement cost of inventory. For this purpose, the replacement cost of inventory is calculated using data from each operation’s production and manufacturing system, either on a monthly basis, or separately for each transaction where the system allows this approach. The amounts disclosed are not separately reflected in the financial statements as a gain or loss. No adjustment is made in respect of the cost of inventories held as part of a trading position and certain other temporary inventory positions. See Replacement cost (RC) profit or loss definition below. Liquids – Liquids for Upstream and Rosneft comprises crude oil, condensate and natural gas liquids. For Upstream, liquids also includes bitumen.
Major projects have a BP net investment of at least $250 million, or are considered to be of strategic importance to BP or of a high degree of complexity.
33
BP p.l.c. Group results Second quarter and half year 2017
Glossary (continued) Net debt and net debt ratio are non-GAAP measures. Net debt is calculated as gross finance debt, as shown in the balance sheet, plus the fair value of associated derivative financial instruments that are used to hedge foreign currency exchange and interest rate risks relating to finance debt, for which hedge accounting is applied, less cash and cash equivalents. The net debt ratio is defined as the ratio of net debt to the total of net debt plus shareholders’ equity. All components of equity are included in the denominator of the calculation. BP believes these measures provide useful information to investors. Net debt enables investors to see the economic effect of gross debt, related hedges and cash and cash equivalents in total. The net debt ratio enables investors to see how significant net debt is relative to equity from shareholders. The derivatives are reported on the balance sheet within the headings ‘Derivative financial instruments’. Net wind generation capacity is the sum of the rated capacities of the assets/turbines that have entered into commercial operation, including BP’s share of equity-accounted entities. The gross data is the equivalent capacity on a gross-JV basis, which includes 100% of the capacity of equity-accounted entities where BP has partial ownership. Non-operating items are charges and credits included in the financial statements that BP discloses separately because it considers such disclosures to be meaningful and relevant to investors. They are items that management considers not to be part of underlying business operations and are disclosed in order to enable investors better to understand and evaluate the group’s reported financial performance. Non-operating items within equity-accounted earnings are reported net of incremental income tax reported by the equity-accounted entity. An analysis of non-operating items by region is shown on pages 7, 9 and 11, and by segment and type is shown on page 27. Operating cash flow is net cash provided by (used in) operating activities as stated in the condensed group cash flow statement. When used in the context of a segment rather than the group, the terms refer to the segment’s share thereof. Operating cash flow excluding amounts related to the Gulf of Mexico oil spill / Gulf of Mexico oil spill payments or Organic cash flow is a non-GAAP measure calculated by excluding post-tax operating cash flows relating to the Gulf of Mexico oil spill as reported in Note 2 from Net cash provided by operating activities as reported in the condensed group cash flow statement. BP believes it is helpful to disclose net cash provided by operating activities excluding amounts related to the Gulf of Mexico oil spill because this measure allows for more meaningful comparisons between reporting periods. The nearest equivalent measure on an IFRS basis is Net cash provided by operating activities. Organic capital expenditure is a subset of capital expenditure and is a non-GAAP measure. Organic capital expenditure comprises capital expenditure less inorganic capital expenditure. BP believes that this measure provides useful information as it allows investors to understand how BP’s management invests funds in developing and maintaining the group’s assets. An analysis of organic capital expenditure by segment and region, and a reconciliation to GAAP information is provided on page 26. Production-sharing agreement (PSA) is an arrangement through which an oil company bears the risks and costs of exploration, development and production. In return, if exploration is successful, the oil company receives entitlement to variable physical volumes of hydrocarbons, representing recovery of the costs incurred and a stipulated share of the production remaining after such cost recovery. Readily marketable inventory (RMI) is inventory held and price risk-managed by our integrated supply and trading function (IST) which could be sold to generate funds if required. It comprises oil and oil products for which liquid markets are available and excludes inventory which is required to meet operational requirements and other inventory which is not price risk-managed. RMI is reported at fair value. Inventory held by the Downstream fuels business for the purpose of sales and marketing, and all inventories relating to the lubricants and petrochemicals businesses, are not included in RMI. Paid-up RMI excludes RMI which has not yet been paid for. For inventory that is held in storage, a first-in first-out (FIFO) approach is used to determine whether inventory has been paid for or not. Unpaid RMI is RMI which has not yet been paid for by BP. RMI, Paid-up RMI and Unpaid RMI are non-GAAP measures. Further information is provided on page 29. Realizations are the result of dividing revenue generated from hydrocarbon sales, excluding revenue generated from purchases made for resale and royalty volumes, by revenue generating hydrocarbon production volumes. Revenue generating hydrocarbon production reflects the BP share of production as adjusted for any production which does not generate revenue. Adjustments may include losses due to shrinkage, amounts consumed during processing, and contractual or regulatory host committed volumes such as royalties. Refining availability represents Solomon Associates’ operational availability, which is defined as the percentage of the year that a unit is available for processing after subtracting the annualized time lost due to turnaround activity and all planned mechanical, process and regulatory downtime.
34
BP p.l.c. Group results Second quarter and half year 2017
Glossary (continued) The Refining marker margin (RMM) is the average of regional indicator margins weighted for BP’s crude refining capacity in each region. Each regional marker margin is based on product yields and a marker crude oil deemed appropriate for the region. The regional indicator margins may not be representative of the margins achieved by BP in any period because of BP’s particular refinery configurations and crude and product slate. Replacement cost (RC) profit or loss reflects the replacement cost of inventories sold in the period and is arrived at by excluding inventory holding gains and losses from profit or loss. RC profit or loss is the measure of profit or loss that is required to be disclosed for each operating segment under IFRS. RC profit or loss for the group is not a recognized GAAP measure. BP believes this measure is useful to illustrate to investors the fact that crude oil and product prices can vary significantly from period to period and that the impact on our reported result under IFRS can be significant. Inventory holding gains and losses vary from period to period due to changes in prices as well as changes in underlying inventory levels. In order for investors to understand the operating performance of the group excluding the impact of price changes on the replacement of inventories, and to make comparisons of operating performance between reporting periods, BP’s management believes it is helpful to disclose this measure. The nearest equivalent measure on an IFRS basis is profit or loss attributable to BP shareholders. RC profit or loss per share is a non-GAAP measure. Earnings per share is defined in Note 6. RC profit or loss per share is calculated using the same denominator. The numerator used is RC profit or loss attributable to BP shareholders rather than profit or loss attributable to BP shareholders. BP believes it is helpful to disclose the RC profit or loss per share because this measure excludes the impact of price changes on the replacement of inventories and allows for more meaningful comparisons between reporting periods. The nearest equivalent measure on an IFRS basis is basic earnings per share based on profit or loss for the period attributable to BP shareholders. Reported recordable injury frequency measures the number of reported work-related employee and contractor incidents that result in a fatality or injury per 200,000 hours worked. This represents reported incidents occurring within BP’s operational HSSE reporting boundary. That boundary includes BP’s own operated facilities and certain other locations or situations. Tier 1 process safety events are losses of primary containment from a process of greatest consequence – causing harm to a member of the workforce, costly damage to equipment or exceeding defined quantities. This represents reported incidents occurring within BP’s operational HSSE reporting boundary. That boundary includes BP’s own operated facilities and certain other locations or situations. Underlying production is production after adjusting for divestments and entitlement impacts in our production-sharing agreements. 2017 underlying production does not include the Abu Dhabi onshore concession renewal. Underlying RC profit or loss is RC profit or loss after adjusting for non-operating items and fair value accounting effects. Underlying RC profit or loss and adjustments for fair value accounting effects are not recognized GAAP measures. See pages 27 and 28 for additional information on the non-operating items and fair value accounting effects that are used to arrive at underlying RC profit or loss in order to enable a full understanding of the events and their financial impact. BP believes that underlying RC profit or loss is a useful measure for investors because it is a measure closely tracked by management to evaluate BP’s operating performance and to make financial, strategic and operating decisions and because it may help investors to understand and evaluate, in the same manner as management, the underlying trends in BP’s operational performance on a comparable basis, period on period, by adjusting for the effects of these non-operating items and fair value accounting effects. The nearest equivalent measure on an IFRS basis for the group is profit or loss attributable to BP shareholders. The nearest equivalent measure on an IFRS basis for segments is RC profit or loss before interest and taxation. Underlying RC profit or loss per share is a non-GAAP measure. Earnings per share is defined in Note 6. Underlying RC profit or loss per share is calculated using the same denominator. The numerator used is underlying RC profit or loss attributable to BP shareholders rather than profit or loss attributable to BP shareholders. BP believes it is helpful to disclose the underlying RC profit or loss per share because this measure may help investors to understand and evaluate, in the same manner as management, the underlying trends in BP’s operational performance on a comparable basis, period on period. The nearest equivalent measure on an IFRS basis is basic earnings per share based on profit or loss for the period attributable to BP shareholders. Upstream operating efficiency is calculated as production for BP operated sites, excluding US Lower 48 and adjusted for certain items including entitlement impacts in our production-sharing agreements divided by installed production capacity for BP operated sites, excluding US Lower 48. Installed production capacity is the agreed rate achievable (measured at the export end of the system) when the installed production system (reservoir, wells, plant and export) is fully optimized and operated at full rate with no planned or unplanned deferrals. Upstream unit production cost is calculated as production cost divided by units of production. Production cost does not include ad valorem and severance taxes. Units of production are barrels for liquids and thousands of cubic feet for gas. Amounts disclosed are for BP subsidiaries only and do not include BP’s share of equity-accounted entities.
35
BP p.l.c. Group results Second quarter and half year 2017
Legal proceedings The following discussion sets out the material developments in the group’s material legal proceedings during the first half of 2017. For a full discussion of the group’s material legal proceedings, see pages 261-265 of BP Annual Report and Form 20-F 2016. Deepwater Horizon accident and oil spill (the Incident) Plaintiffs’ Steering Committee (PSC) settlements – Economic and Property Damages Settlement Agreement The Economic and Property Damages Settlement established a court-supervised settlement claims programme to resolve certain economic and property damage claims arising from the Incident.
Following numerous court decisions, on 31 March 2015, the United States district court in New Orleans denied the PSC motion seeking to alter or amend a revised policy relating to business economic loss claims. Such policy required the matching of revenue with the expenses incurred by claimants to generate that revenue, even where the revenue and expenses were recorded at different times. The PSC appealed the district court decision and, on 22 May 2017, the Fifth Circuit issued an opinion upholding the policy in part and reversing the policy in part. The Fifth Circuit ordered that the portion of the policy upheld, which covers the substantial majority of the remaining business economic loss claims, be applied as the governing methodology for all applicable business economic loss claims. BP filed a petition for a rehearing which was denied on 21 June 2017. On 5 July 2017, the district court issued an order instructing the court supervised settlement programme on how to implement the Fifth Circuit’s opinion. BP continues to evaluate the impact of the Fifth Circuit’s decision on undetermined business economic loss claims, and claims under appeal within the programme, and is considering its next steps in relation to this order. See Note 2 on page 19 for further information.
Cautionary statement In order to utilize the ‘safe harbor’ provisions of the United States Private Securities Litigation Reform Act of 1995 (the ‘PSLRA’), BP is providing the following cautionary statement: The discussion in this results announcement contains certain forecasts, projections and forward-looking statements – that is, statements related to future, not past events – with respect to the financial condition, results of operations and businesses of BP and certain of the plans and objectives of BP with respect to these items. These statements may generally, but not always, be identified by the use of words such as ‘will’, ‘expects’, ‘is expected to’, ‘aims’, ‘should’, ‘may’, ‘objective’, ‘is likely to’, ‘intends’, ‘believes’, ‘anticipates’, ‘plans’, ‘we see’ or similar expressions. In particular, among other statements, expectations regarding the expected quarterly dividend payment and timing of such payment; expectations regarding 2017 net debt, organic capital expenditure and divestment proceeds; expectations regarding the adjusted effective tax rate in 2017; expectations regarding Upstream third-quarter 2017 reported production; expectations regarding Downstream third-quarter 2017 refining margins and North American heavy crude oil differentials; plans and expectations with respect to the start-up of new Upstream projects; expectations with respect to new Upstream production through 2020; expectations regarding Rosneft operational and financial information for the first half of 2017; expectations with respect to the timing and amount of future payments relating to the Gulf of Mexico oil spill; and expectations that claims arising under the 2012 PSC settlement will be substantially paid by the end of 2018; are all forward looking in nature. By their nature, forward-looking statements involve risk and uncertainty because they relate to events and depend on circumstances that will or may occur in the future and are outside the control of BP. Actual results may differ materially from those expressed in such statements, depending on a variety of factors, including: the specific factors identified in the discussions accompanying such forward-looking statements; the receipt of relevant third party and/or regulatory approvals; the timing and level of maintenance and/or turnaround activity; the timing and volume of refinery additions and outages; the timing of bringing new fields onstream; the timing, quantum and nature of certain divestments; future levels of industry product supply, demand and pricing, including supply growth in North America; OPEC quota restrictions; PSA effects; operational and safety problems; potential lapses in product quality; economic and financial market conditions generally or in various countries and regions; political stability and economic growth in relevant areas of the world; changes in laws and governmental regulations; regulatory or legal actions including the types of enforcement action pursued and the nature of remedies sought or imposed; the actions of prosecutors, regulatory authorities and courts; delays in the processes for resolving claims; exchange rate fluctuations; development and use of new technology; recruitment and retention of a skilled workforce; the success or otherwise of partnering; the actions of competitors, trading partners, contractors, subcontractors, creditors, rating agencies and others; our access to future credit resources; business disruption and crisis management; the impact on our reputation of ethical misconduct and non-compliance with regulatory obligations; trading losses; major uninsured losses; decisions by Rosneft’s management and board of directors; the actions of contractors; natural disasters and adverse weather conditions; changes in public expectations and other changes to business conditions; wars and acts of terrorism; cyber-attacks or sabotage; and other factors discussed elsewhere in this report and under “Risk factors” in BP Annual Report and Form 20-F 2016 as filed with the US Securities and Exchange Commission.
Contacts
London Houston
Press Office David Nicholas Brett Clanton +44 (0)20 7496 4708 +1 281 366 8346
Investor Relations Jessica Mitchell Brian Sullivan bp.com/investors +44 (0)20 7496 4962 +1 281 892 3421