Embed Size (px)
Citation preview

© WCRI 2017
Minnesota Workers’ Compensation Summit September 19, 2017
Sharon E. Belton, Ph.D.
Senior Public Policy Analyst
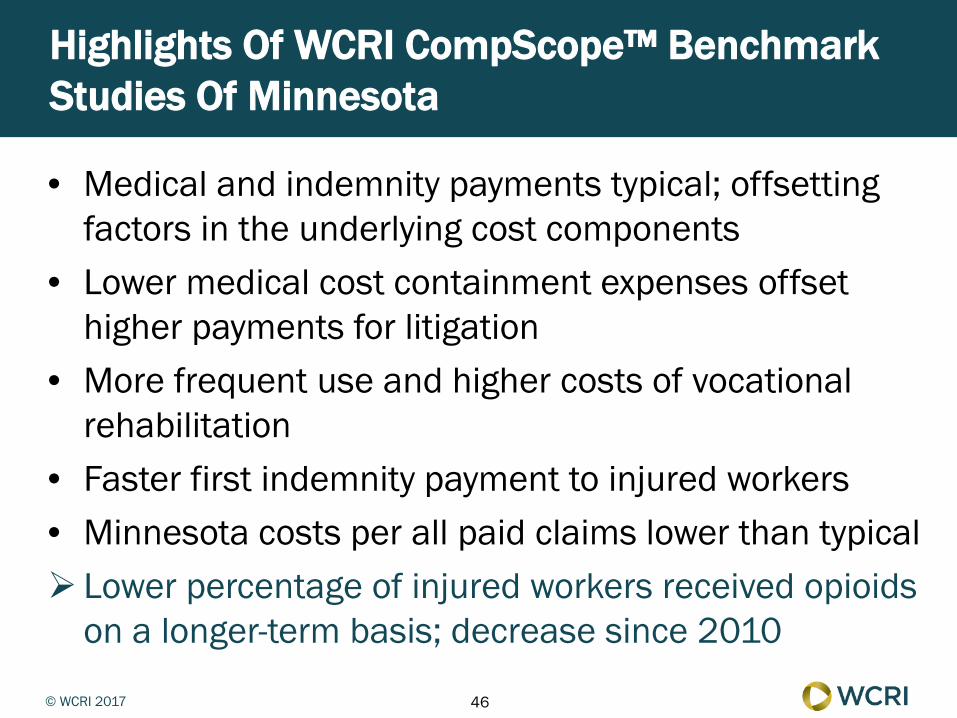
Highlights Of WCRI CompScope™ Benchmark Studies Of Minnesota
© WCRI 2017
WCRI Approach
• Mission “Be a catalyst for significant improvements in WC systems, providing the public with objective, credible, high-quality research on important public policy issues.”
• Studies focus on benefit delivery system • Do not make recommendations or take positions on
issues
2

© WCRI 2017
MN
CompScope™ Worker
Outcomes
Longer-Term Dispensing Of
Opioids
MCC Inventory
Medical Price Index Physician
Dispensing In WC
Prescription Benchmarks
Hospital
Payment Index
Interstate Variations In
Use Of Opioids
Hospital/ASC FS Inventory
WCRI Provides Broad Scope Of Studies That Include Minnesota
ASC: Ambulatory Surgery Center. FS: Fee Schedule. MCC: Medical Cost Containment
3

© WCRI 2017
Scope Of CompScope™ Multistate Benchmarks
4
CompScope™ Medical
CompScope™ • Benefit amounts
• Timeliness • Medical costs • Disability duration • Defense attorney
involvement • Vocational rehabilitation use • Benefit delivery expenses
• Medical costs • Medical prices • Utilization of services • By provider type • By service type

© WCRI 2017
Highlights Of WCRI CompScope™ Benchmark Studies Of Minnesota
• Medical and indemnity payments typical; offsetting factors in the underlying cost components
• Lower medical cost containment expenses offset higher payments for litigation
• More frequent use and higher costs of vocational rehabilitation
• Faster first indemnity payment to injured workers • Minnesota costs per all paid claims lower than typical • Lower percentage of injured workers received opioids
on a longer-term basis; decrease since 2010
5

© WCRI 2017
$0$5,000
$10,000$15,000$20,000$25,000$30,000
MA MI KY CA AR TX FL MN NC GA PA NJ IA IL LA WI IN VA
Minnesota Medical Payments Per Claim Typical Of Study States
6
Claims With > 7 Days Of Lost Time, Adjusted For Injury/Industry Mix Source: CompScope™ Benchmarks For Minnesota, 17th Edition (2017)
$11,418
$0$5,000
$10,000$15,000$20,000$25,000$30,000
MA CA MI TX NC AR MN KY GA FL PA LA IL NJ IA IN VA WI
Aver
age
Med
ical
Pay
men
t/Cl
aim
2015/16 (12 months of experience)
2013/16 (36 months of experience)
$15,917

© WCRI 2017
Chiropractor Outpatient PT/OT
Reporting Of Major Types Of Medical Providers And Services
7
Facility payments to freestanding ambulatory surgery centers are reported under the physician category. PT/OT: Physical/Occupational Therapist
Nonhospital Providers Hospital Providers
Physician Inpatient
Treat./Operating/Recovery
Physical Medicine
Laboratory
Minor Radiology
Major Radiology
Evaluation & Management
Emergency
Physical Medicine
Pain Management Injections
Neurological/Neuromuscular Testing
Minor Radiology
Major Surgery
Major Radiology
Evaluation & Management Emergency
© WCRI 2017
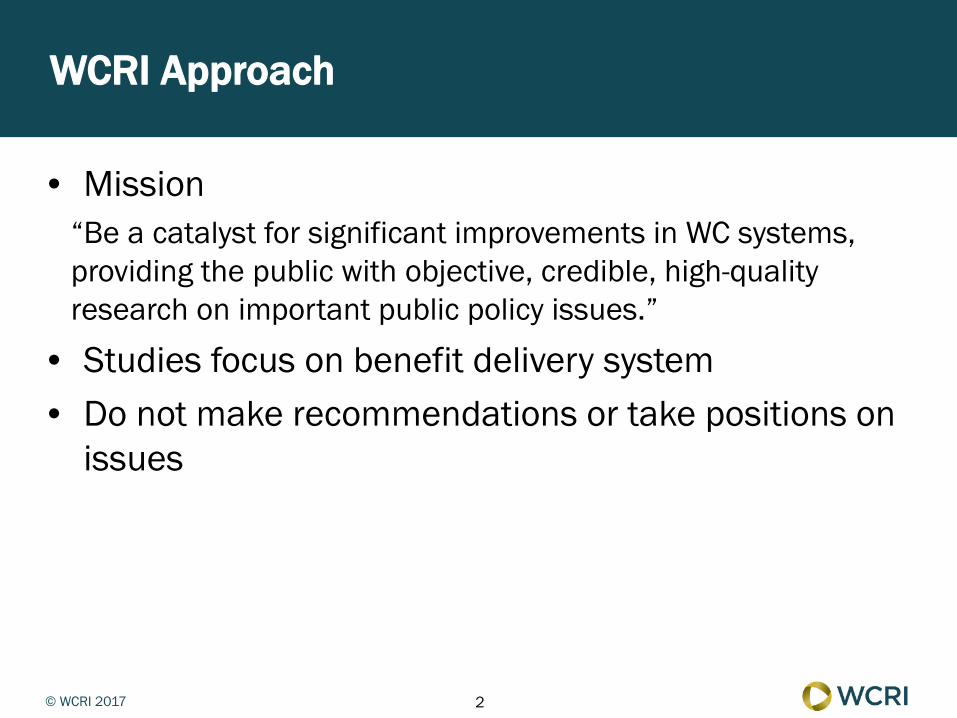
Average Medical Payment Per Claim: A Function Of Price And Utilization
8
Average Medical Payment Per Claim
Price Utilization
Unit Price Index (provider/service)
Utilization Index (provider/service)
% Of Claims (provider/service)
# Of Services/Claim (volume)
Resource Intensity
# Of Visits/Claim # Of Services/Visit
© WCRI 2017
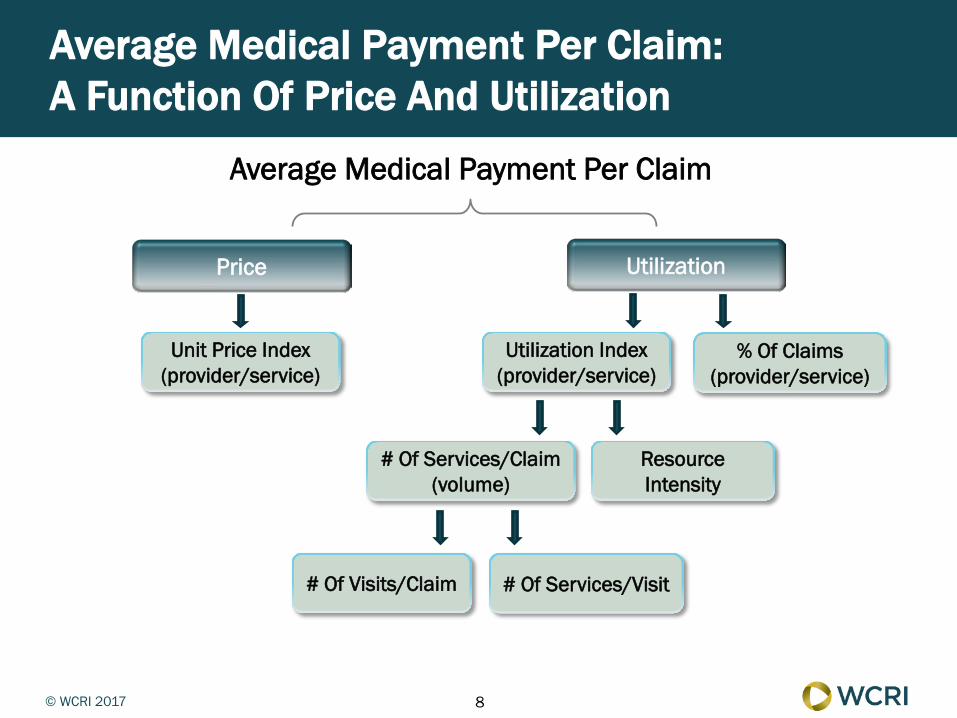
Nonhospital Payments In Minnesota 16% Lower Than Typical Study State
9
2015/16 Claims With > 7 Days Of Lost Time, Adjusted For Injury/Industry Mix Source: CompScope™ Medical Benchmarks For Minnesota, 18th Edition (forthcoming)
$0
$2,000
$4,000
$6,000
$8,000
$10,000
$12,000
$14,000
MA MI AR CA MN KY NC TX FL PA IA LA GA VA NJ WI IL IN
$5,964
Median State: $7,066
Aver
age
Non
hosp
ital P
aym
ent/
Clai
m
Preliminary Findings – Subject To Change

© WCRI 2017
Nonhospital Utilization In Minnesota Lowest Of The Study States
10
Utilization Indices For Nonhospital Services 2015/16 Claims With > 7 Days Of Lost Time, Adjusted For Injury/Industry Mix Source: CompScope™ Medical Benchmarks For Minnesota, 18th Edition (forthcoming)
0
20
40
60
80
100
120
140
MN MA WI AR IA KY TX MI CA LA GA FL NC VA IN NJ PA IL
Utili
zatio
n (m
edia
n =
100)
Preliminary Findings – Subject To Change
© WCRI 2017
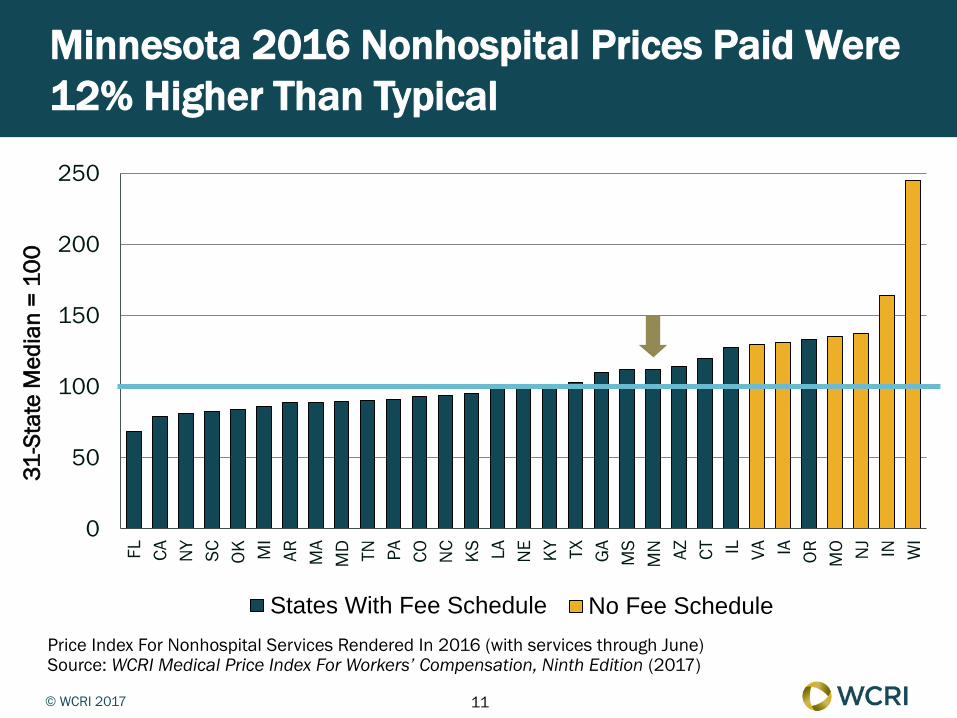
Minnesota 2016 Nonhospital Prices Paid Were 12% Higher Than Typical
11
Price Index For Nonhospital Services Rendered In 2016 (with services through June) Source: WCRI Medical Price Index For Workers’ Compensation, Ninth Edition (2017)
0
50
100
150
200
250
FL CA NY SC OK MI
AR MA
MD TN PA CO NC KS LA NE KY TX GA
MS
MN AZ CT IL VA IA OR MO NJ IN WI
States With Fee Schedule No Fee Schedule
31-S
tate
Med
ian
= 10
0

© WCRI 2017
Lower To Typical % Reported “Big Problems” Getting Services And Providers
12
Case-Mix Adjusted. Workers With > 7 Days Of Lost Time Source: Comparing Outcomes For Injured Workers In Minnesota (2016)
16%
0%5%
10%15%20%25%
WI MI PA MA CT VA MN IA IN AR TN NC GA KY FL
% W
ith “
Big
Prob
lem
s” G
ettin
g
Serv
ices
The
y W
ante
d
15-State Median: 17%
11%
0%5%
10%15%20%25%
WI MN VA MA KY PA MI CT GA AR IA TN NC IN FL
% R
epor
ting
“Big
Pr
oble
ms”
Get
ting
Des
ired
Prov
ider
15-State Median: 14%
© WCRI 2017
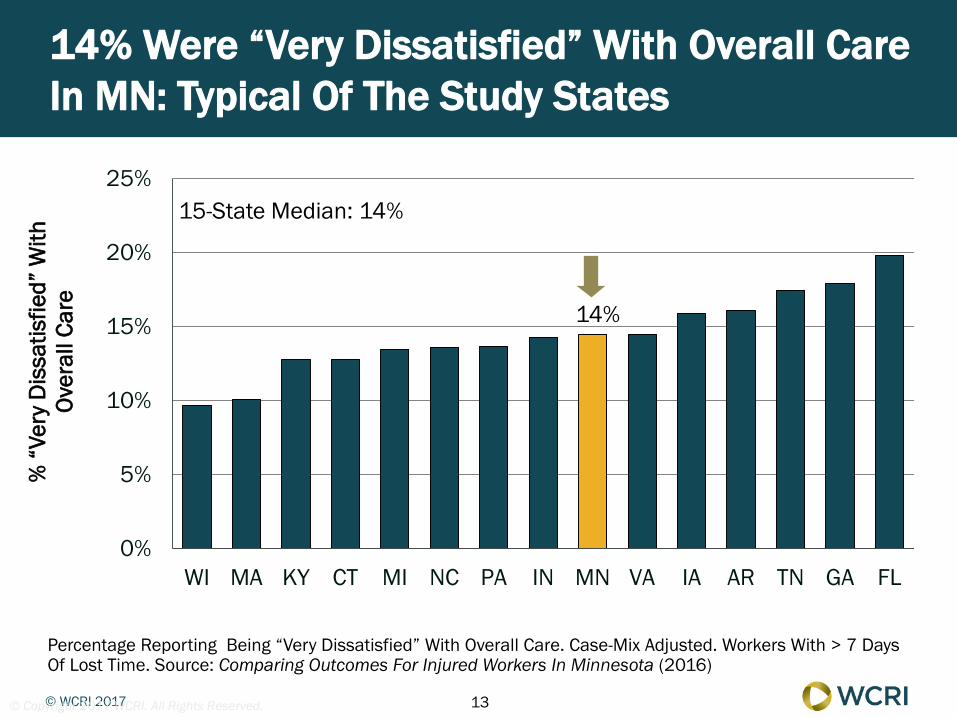
14% Were “Very Dissatisfied” With Overall Care In MN: Typical Of The Study States
13
Percentage Reporting Being “Very Dissatisfied” With Overall Care. Case-Mix Adjusted. Workers With > 7 Days Of Lost Time. Source: Comparing Outcomes For Injured Workers In Minnesota (2016)
14%
0%
5%
10%
15%
20%
25%
WI MA KY CT MI NC PA IN MN VA IA AR TN GA FL
% “
Very
Dis
satis
fied”
With
Ov
eral
l Car
e
© Copyright 2017 WCRI. All Rights Reserved.
15-State Median: 14%

© WCRI 2017
Minnesota Hospital Payments Typical Of The 18 Study States
14
2015/16 Claims With > 7 Days Of Lost Time, Adjusted For Injury/Industry Mix Source: CompScope™ Medical Benchmarks For Minnesota, 18th Edition (forthcoming)
$0
$2,000
$4,000
$6,000
$8,000
$10,000
$12,000
$14,000
MA CA MI KY AR TX GA NC IN PA MN IL NJ LA IA FL VA WI
Median State: $8,099
Aver
age
Hos
pita
l Pay
men
t/Cl
aim
Preliminary Findings – Subject To Change

© WCRI 2017
Larger Share Of MN Medical Payments To Hospital Providers, Especially Outpatient
15
2015/16 Claims With > 7 Days Of Lost Time, Adjusted For Injury/Industry Mix Source: CompScope™ Medical Benchmarks For Minnesota, 18th Edition (forthcoming)
0%5%
10%15%20%25%30%35%40%45%50%55%
CA GA IN NJ IL TX NC MA MI VA FL LA WI MN PA AR KY IA
49%
% O
f Med
ical
Pay
men
ts T
o
Hos
pita
l Pro
vide
rs
MN Relative To Median State*
Nonhospital 50% 53% Lower
Hospital 49% 46% Higher
Outpatient 32% 25% Higher
Inpatient 17% 17% Typical
* The “median state” column does not add up to 100% because the median state may vary depending on the distribution of states’ values for each of four measures shown in the table.
Preliminary Findings – Subject To Change

© WCRI 2017
0%
10%
20%
30%
LA CA GA TX NJ FL AR NC VA KY IN MI PA WI IL IA MN MA
Hospital Outpatient Evaluation And Management
Higher % Of Claims With Hospital Outpatient Office Visits And Physical Medicine In MN
16
2015/16 Claims With > 7 Days Of Lost Time, Adjusted For Injury/Industry Mix Source: CompScope™ Medical Benchmarks For Minnesota, 18th Edition (forthcoming)
0%
10%
20%
30%
40%
FL CA GA NC NJ LA VA TX IN IL AR PA KY MI MA MN IA WI
% O
f Cla
ims
Hospital Outpatient Physical Medicine
% O
f Cla
ims
Preliminary Findings – Subject To Change

© WCRI 2017
Increase In % Of Claims With Hospital Outpatient Office Visits In Minnesota
17
Claims With Hospital Outpatient Services As A Percentage Of Claims With > 7 Days Of Lost Time At 12 Months Of Experience, Not Adjusted For Injury/Industry Mix. E&M: Evaluation & Management. ppt: Percentage Points Source: CompScope™ Medical Benchmarks For Minnesota, 18th Edition (forthcoming)
0%
10%
20%
30%
40%
50%
60%
OtherServices
MinorRadiology
Emergency PhysicalMedicine
Treatment,Operating,Recovery
Room
Clinic/E&M MajorRadiology
% O
f Cla
ims
2008/09 2009/10 2010/11 2011/12 2012/13 2013/14 2014/15 2015/16
2008/09 To 2015/16
2010/11 To 2015/16
Clinic/E&M +10.1 ppt +4.2 ppt
Preliminary Findings – Subject To Change

© WCRI 2017
MN Hospital Outpatient Payments Per Claim 16 Percent Higher Than Median State
18
2015/16 Claims With > 7 Days Of Lost Time, Adjusted For Injury/Industry Mix Source: CompScope™ Medical Benchmarks For Minnesota, 18th Edition (forthcoming)
$0$1,000$2,000$3,000$4,000$5,000$6,000$7,000$8,000$9,000
$10,000
CA MA AR GA MI TX NJ NC IN KY PA MN IL FL IA VA LA WI
Median State: $4,841
$5,628
Aver
age
Hos
pita
l Out
patie
nt
Paym
ent/
Clai
m
Preliminary Findings – Subject To Change

© WCRI 2017
Summary Of Minnesota Medical Fee Regulations By Provider Type
19
Sources: National Inventory Of Workers’ Compensation Fee Schedules For Hospitals And Ambulatory Surgical Centers (2010); Workers’ Compensation Medical Cost Containment Inventory (2015)
Provider Approach To Fee Regulation Nonhospital Medicare resource-based relative value scale (RBRVS) based fee schedule;
multiple conversion factors updated October 1 (does not cover anesthesia, home health care, ambulatory care, or medical equipment)
Hospital Outpatient 100+ beds: lower of the maximum fee that applies to any service included in the relative value fee schedule, 85% of usual and customary charge, 85% of prevailing charge, or facility’s actual charge < 100 beds: usual and customary charge, unless commissioner or judge deems charge is unreasonably excessive
ASCs Lower of the maximum fee that applies to any service included in the relative value fee schedule, 85% of usual and customary charge, 85% of prevailing charge, or the facility’s actual charge
Hospital Inpatient* 100+ beds: 85% of usual and customary charge, 85% of prevailing charge, or facility’s actual charge < 100 beds: usual and customary charge, unless commissioner or judge deems charge is unreasonably excessive
* A new Medicare diagnosis-related group (DRG) based approach became effective in MN on January 1, 2016.
© WCRI 2017
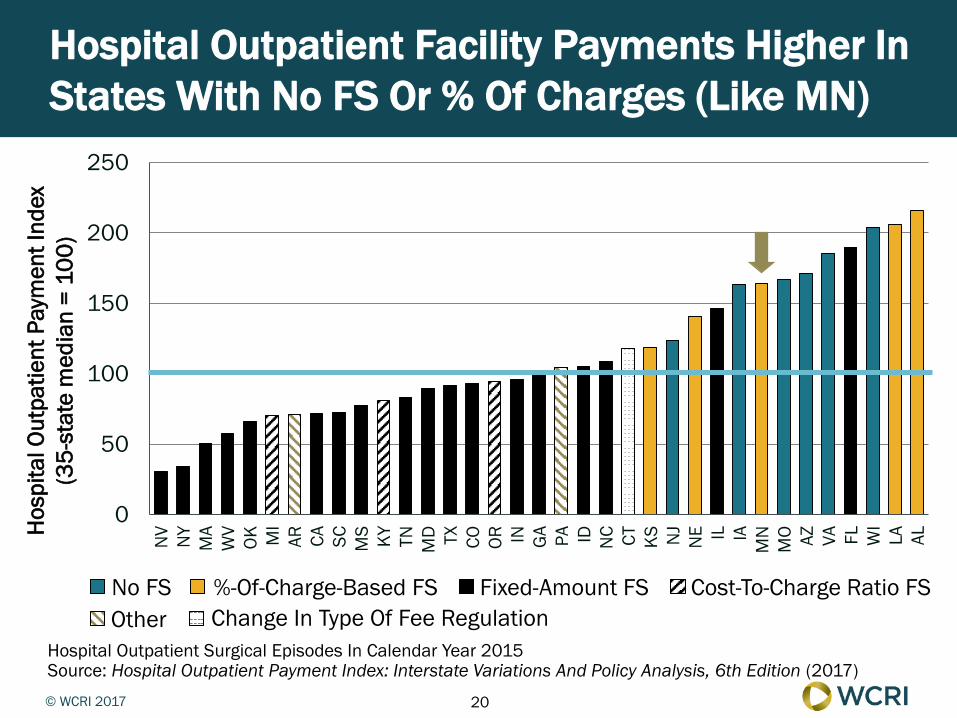
Hospital Outpatient Facility Payments Higher In States With No FS Or % Of Charges (Like MN)
20
Hospital Outpatient Surgical Episodes In Calendar Year 2015 Source: Hospital Outpatient Payment Index: Interstate Variations And Policy Analysis, 6th Edition (2017)
0
50
100
150
200
250N
V NY
MA
WV
OK MI
AR CA SC MS KY TN MD TX CO OR IN GA PA ID NC CT KS NJ
NE IL IA
MN
MO AZ VA FL WI
LA ALHos
pita
l Out
patie
nt P
aym
ent I
ndex
(3
5-st
ate
med
ian
= 10
0)
No FS %-Of-Charge-Based FS Fixed-Amount FS Cost-To-Charge Ratio FS Other Change In Type Of Fee Regulation
© WCRI 2017
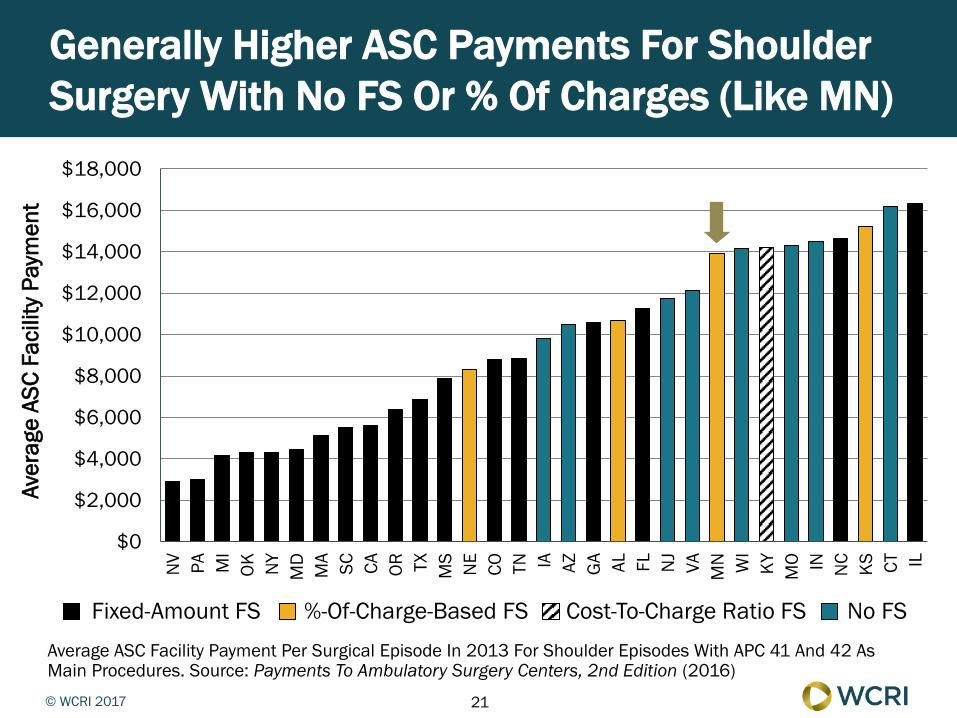
Generally Higher ASC Payments For Shoulder Surgery With No FS Or % Of Charges (Like MN)
21
Average ASC Facility Payment Per Surgical Episode In 2013 For Shoulder Episodes With APC 41 And 42 As Main Procedures. Source: Payments To Ambulatory Surgery Centers, 2nd Edition (2016)
$0
$2,000
$4,000
$6,000
$8,000
$10,000
$12,000
$14,000
$16,000
$18,000N
V PA MI
OK NY
MD
MA SC CA OR TX MS NE
CO TN IA AZ GA AL FL NJ
VA MN WI
KY MO IN NC KS CT IL
Aver
age
ASC
Faci
lity
Paym
ent
No FS %-Of-Charge-Based FS Fixed-Amount FS Cost-To-Charge Ratio FS

© WCRI 2017
New MN Inpatient Fee Regulation (For Discharges On Or After 1/1/16)
• Maximum payment = 200% of Medicare DRG • If charge exceeds $175,000*, payment will be 75% of the
usual and customary • Critical access hospitals (79) = 100% of usual and
customary
• When hospital submits an electronic bill, and a DRG applies, it must be paid in full or denied within 30 days • Payors may not request additional information • Line-item adjustments are not allowed • Post-payment audits allowed if initiated within 6 months
22
* Threshold Updated Annually
© WCRI 2017
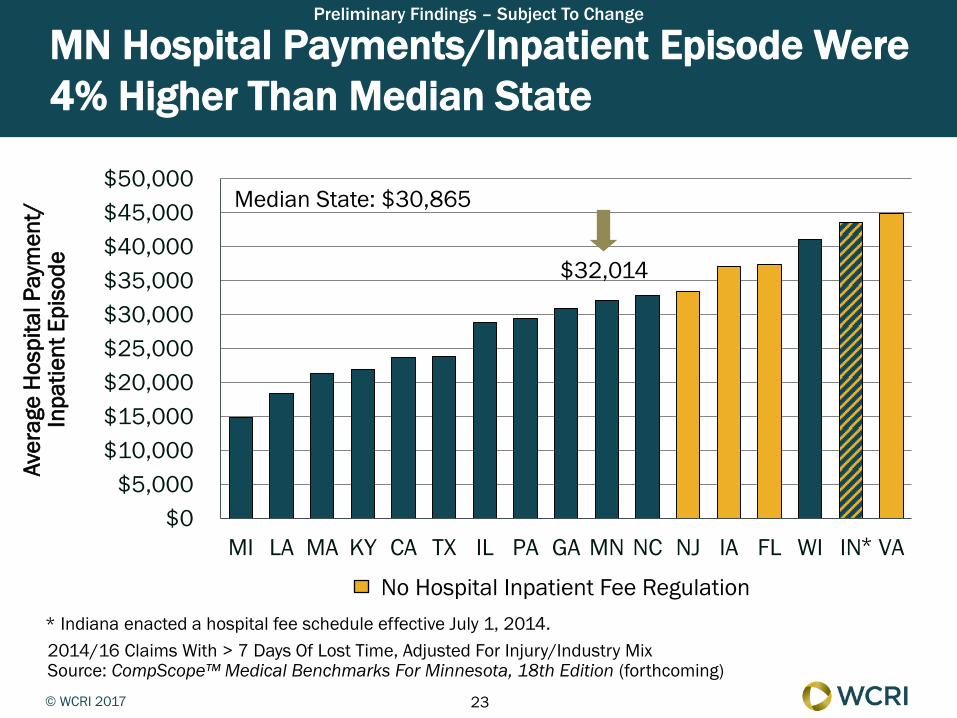
MN Hospital Payments/Inpatient Episode Were 4% Higher Than Median State
23
2014/16 Claims With > 7 Days Of Lost Time, Adjusted For Injury/Industry Mix Source: CompScope™ Medical Benchmarks For Minnesota, 18th Edition (forthcoming)
$0$5,000
$10,000$15,000$20,000$25,000$30,000$35,000$40,000$45,000$50,000
MI LA MA KY CA TX IL PA GA MN NC NJ IA FL WI IN VA
Median State: $30,865
$32,014
No Hospital Inpatient Fee Regulation
Aver
age
Hos
pita
l Pay
men
t/
Inpa
tient
Epi
sode
* Indiana enacted a hospital fee schedule effective July 1, 2014.
*
Preliminary Findings – Subject To Change

© WCRI 2017
MN Had A Typical Percentage Of Claims With Inpatient Episodes
24
2014/16 Claims With > 7 Days Of Lost Time, Adjusted For Injury/Industry Mix Source: CompScope™ Medical Benchmarks For Minnesota, 18th Edition (forthcoming)
0%
1%
2%
3%
4%
5%
6%
7%
8%
9%
CA WI MA NC IL GA MN KY IA IN TX FL MI VA NJ PA LA
Median State: 6.6%
6.5%
% O
f Cla
ims
With
Inpa
tient
Epi
sode
s Preliminary Findings – Subject To Change
© WCRI 2017
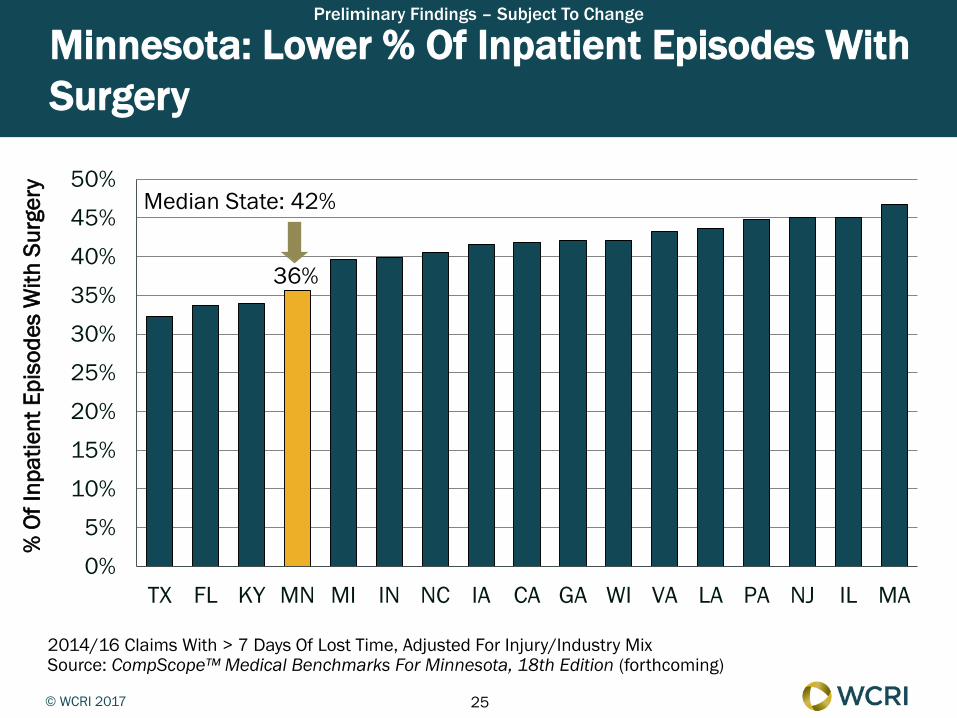
Minnesota: Lower % Of Inpatient Episodes With Surgery
25
2014/16 Claims With > 7 Days Of Lost Time, Adjusted For Injury/Industry Mix Source: CompScope™ Medical Benchmarks For Minnesota, 18th Edition (forthcoming)
0%
5%
10%
15%
20%
25%
30%
35%
40%
45%
50%
TX FL KY MN MI IN NC IA CA GA WI VA LA PA NJ IL MA
36%
% O
f Inp
atie
nt E
piso
des
With
Sur
gery
Median State: 42%
Preliminary Findings – Subject To Change

© WCRI 2017
Lower Indemnity Payments In Minnesota Compared With All Other Study States
26
2013/16 Claims With > 7 Days Of Lost Time, Adjusted For Injury/Industry Mix And Wages Source: CompScope™ Benchmarks For Minnesota, 17th Edition (2017)
$0
$5,000
$10,000
$15,000
$20,000
$25,000
$30,000
$35,000
IN WI TX AR MI FL NJ MN KY MA VA CA IL IA LA PA GA NC
Aver
age
Inde
mni
ty P
aym
ent/
Clai
m
Median State: $18,269
$15,210
© WCRI 2017
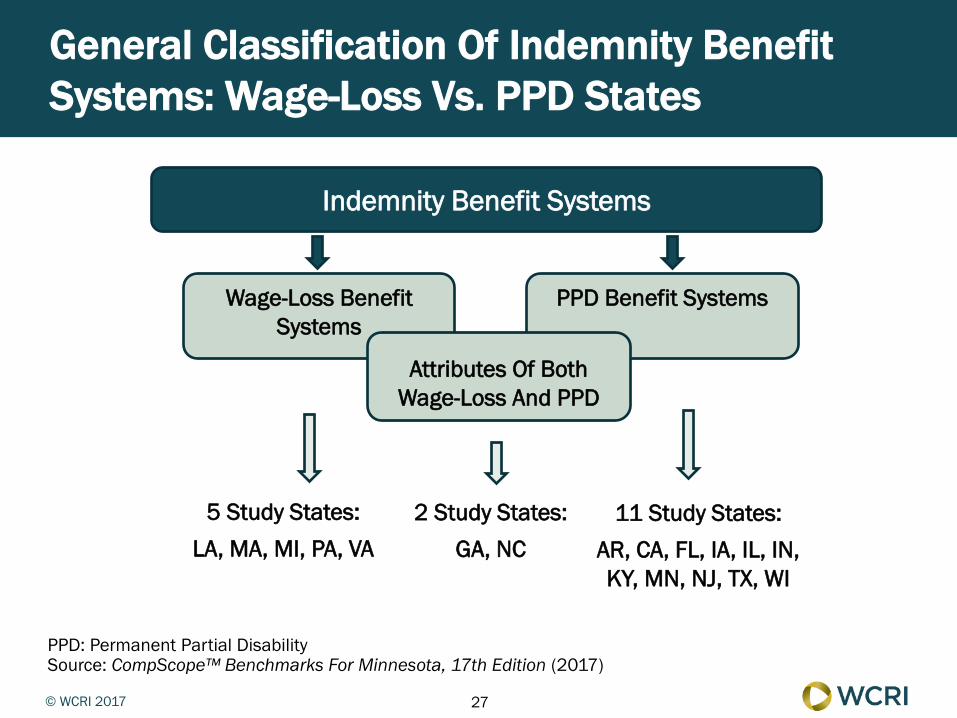
General Classification Of Indemnity Benefit Systems: Wage-Loss Vs. PPD States
27
PPD: Permanent Partial Disability Source: CompScope™ Benchmarks For Minnesota, 17th Edition (2017)
Indemnity Benefit Systems
Wage-Loss Benefit Systems
PPD Benefit Systems
5 Study States: LA, MA, MI, PA, VA
11 Study States: AR, CA, FL, IA, IL, IN, KY, MN, NJ, TX, WI
2 Study States: GA, NC
Attributes Of Both Wage-Loss And PPD

© WCRI 2017
Offsetting Components Contributed To Indemnity Payments In Minnesota
28
2013/16 Claims With > 7 Days Of Lost Time, Adjusted For Injury/Industry Mix And Wages. AWW: Average Weekly Wage. TD: Temporary Disability. Source: CompScope™ Benchmarks For Minnesota, 17th Edition (2017)
Average Indemnity Benefit Per Claim
Temporary Disability Benefits PPD/Lump-Sum Payments
Weekly TD Benefit Rate (based on AWW)
Average Duration Of TD Benefits
% Of Claims With TD Benefits
% Of Claims With PPD/Lump-Sum Payments
Average PPD/Lump-Sum Payment Per Claim
MN Vs. Other Non-Wage-Loss States
Higher
Lower
Higher
Typical
Higher
© WCRI 2017
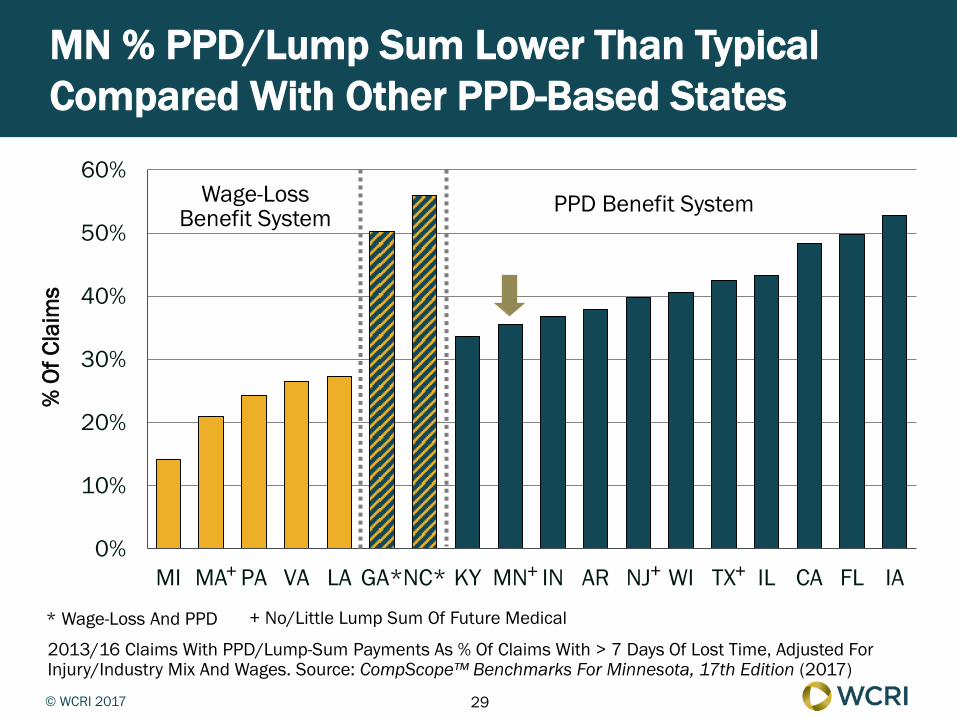
MN % PPD/Lump Sum Lower Than Typical Compared With Other PPD-Based States
29
2013/16 Claims With PPD/Lump-Sum Payments As % Of Claims With > 7 Days Of Lost Time, Adjusted For Injury/Industry Mix And Wages. Source: CompScope™ Benchmarks For Minnesota, 17th Edition (2017)
0%
10%
20%
30%
40%
50%
60%
MI MA PA VA LA GA*NC* KY MN IN AR NJ WI TX IL CA FL IA
% O
f Cla
ims
Wage-Loss Benefit System PPD Benefit System
* Wage-Loss And PPD
+ + + +
+ No/Little Lump Sum Of Future Medical
© WCRI 2017
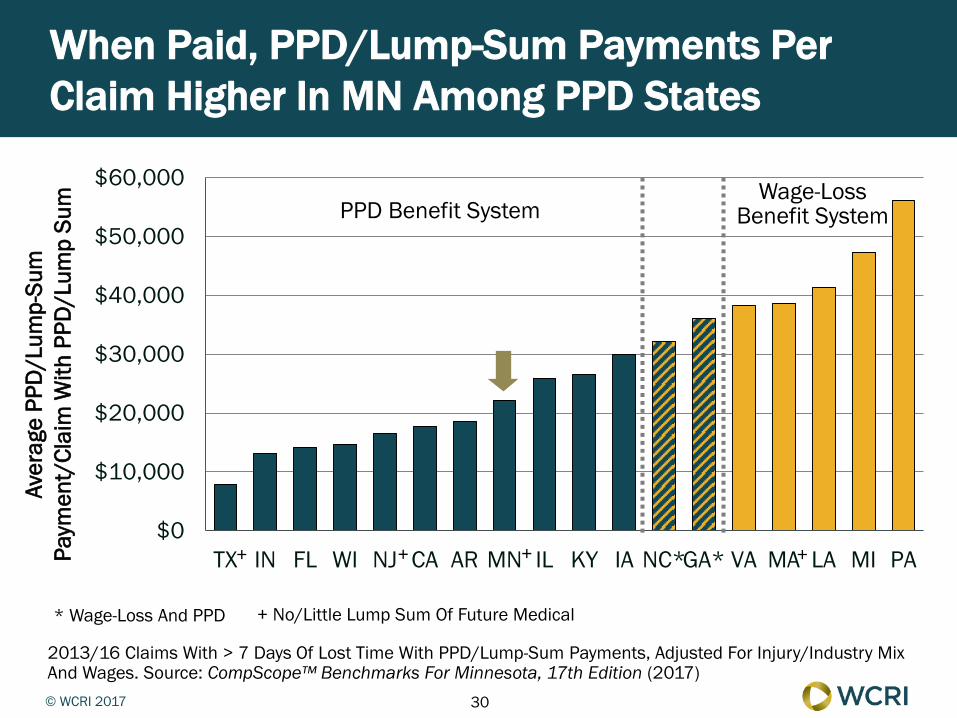
When Paid, PPD/Lump-Sum Payments Per Claim Higher In MN Among PPD States
30
2013/16 Claims With > 7 Days Of Lost Time With PPD/Lump-Sum Payments, Adjusted For Injury/Industry Mix And Wages. Source: CompScope™ Benchmarks For Minnesota, 17th Edition (2017)
$0
$10,000
$20,000
$30,000
$40,000
$50,000
$60,000
TX IN FL WI NJ CA AR MN IL KY IA NC*GA* VA MA LA MI PA
* Wage-Loss And PPD + No/Little Lump Sum Of Future Medical
+ + + +
Wage-Loss Benefit System PPD Benefit System
Aver
age
PPD
/Lum
p-Su
m
Paym
ent/
Clai
m W
ith P
PD/L
ump
Sum

© WCRI 2017
Duration Of Temporary Disability In Minnesota Was Typical
31
2013/16 Claims With > 7 Days Of Lost Time, Adjusted For Injury/Industry Mix And Wages Source: CompScope™ Benchmarks For Minnesota, 17th Edition (2017)
11 11 11 12 13 14 14
16 16 19
22 20 21
15
19 23 23
31
0
5
10
15
20
25
30
35
WI FL IA IN AR MN NJ TX KY IL CA NC*GA* MI VA PA MA LA
Tem
pora
ry D
isab
ility
Dur
atio
n (w
eeks
)
PPD Benefit System Wage-Loss Benefit System
* Wage-Loss And PPD

© WCRI 2017
Highlights Of WCRI CompScope™ Benchmark Studies Of Minnesota
• Medical and indemnity payments typical; offsetting factors in the underlying cost components
Lower medical cost containment expenses offset higher payments for litigation
• More frequent use and higher costs of vocational rehabilitation
• Faster first indemnity payment to injured workers • Minnesota costs per all paid claims lower than typical • Lower percentage of injured workers received opioids
on a longer-term basis; decrease since 2010
32

© WCRI 2017
Minnesota Benefit Delivery Expenses Per Claim 14% Lower Than Typical
33
2013/16 Claims With > 7 Days Of Lost Time And Benefit Delivery Expenses, Adjusted For Injury/Industry Mix Source: CompScope™ Benchmarks For Minnesota, 17th Edition (2017)
$0
$2,000
$4,000
$6,000
$8,000
$10,000
$12,000
WI MA IN AR MI MN IA VA KY TX FL NC GA IL PA NJ LA CA
Median State: $6,003
$5,164
Aver
age
Bene
fit D
eliv
ery
Expe
nse/
Clai
m W
ith E
xpen
ses
© WCRI 2017
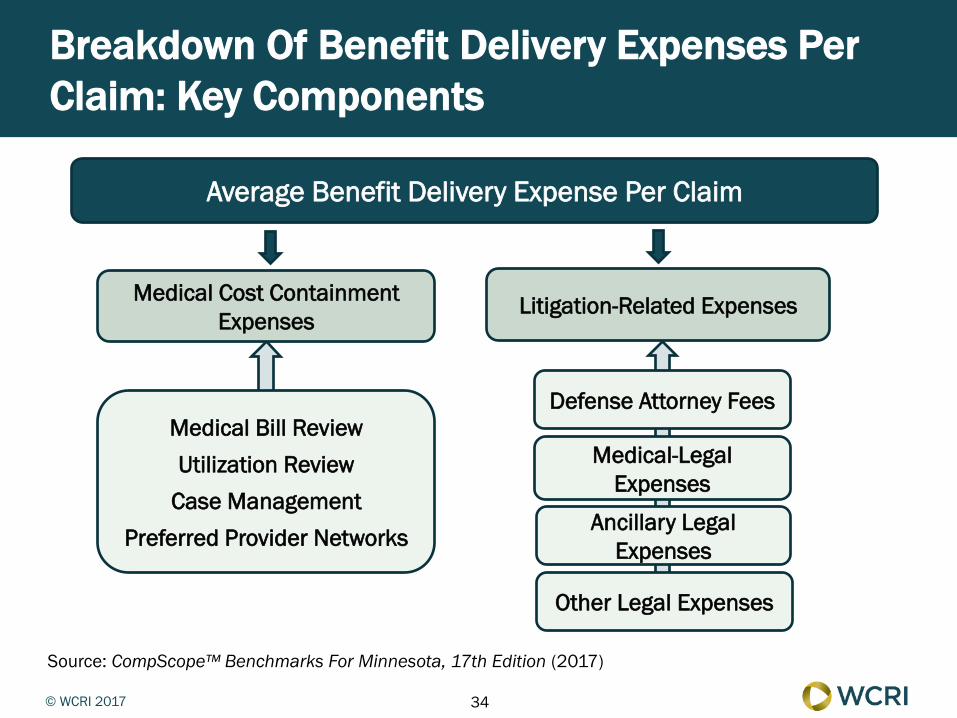
Breakdown Of Benefit Delivery Expenses Per Claim: Key Components
34
Source: CompScope™ Benchmarks For Minnesota, 17th Edition (2017)
Average Benefit Delivery Expense Per Claim
Medical Cost Containment Expenses
Litigation-Related Expenses
Medical Bill Review Utilization Review
Case Management Preferred Provider Networks
Medical-Legal Expenses
Defense Attorney Fees
Other Legal Expenses
Ancillary Legal Expenses

© WCRI 2017
Lower Medical Cost Containment Expenses In MN Offset Higher Payments For Litigation
35
2013/16 Claims With > 7 Days Of Lost Time, Adjusted For Injury/Industry Mix Source: CompScope™ Benchmarks For Minnesota, 17th Edition (2017)
Performance Measure MN 18-State Median Difference Multistate
Ranking
Benefit Delivery Expenses/Claim With Expenses $5,164 $6,003 -14% Lowest
Medical Cost Containment Expenses/Claim $2,168 $3,432 -37% Lower
% Of Claims With Defense Attorneys (payments > $500) 25% 30% -5 ppt Slightly
Lower
Defense Attorney Payments Per Claim (payments > $500) $7,525 $5,420 39% Higher
% Of Claims With Medical-Legal Expenses 22% 25% -3 ppt Typical
Medical-Legal Expenses/Claim $2,952 $1,946 52% Higher

© WCRI 2017
Slightly Lower % Defense Attorney Involvement, But Higher Payments
36
2013/16 Claims With > 7 Days Of Lost Time, Adjusted For Injury/Industry Mix Source: CompScope™ Benchmarks For Minnesota, 17th Edition (2017)
25%
0%10%20%30%40%50%60%
TX WI IN MI AR MN MA IA KY VA PA LA NC FL CA IL GA NJ
$7,525
$0
$2,000
$4,000
$6,000
$8,000
$10,000
NJ IN MA IL AR VA WI NC KY TX MI FL IA PA CA GA MN LA
% Of Claims With Defense Attorney Payments
Average Defense Attorney Payment Per Claim

© WCRI 2017
MN DR Process: Lower Litigation Rate; But Cases Requiring Attorney May Be More Complex
• Extensive use of informal dispute resolution (DR) • Informal assistance and alternative DR forums may
resolve issues without attorneys; contributes to lower percentage with defense attorneys
• Ombudsman program implemented in September 2011
• Cases that go to formal hearings may be more complex, requiring more work hours • May be more meetings under multi-level, multi-agency
dispute resolution process; contributes to higher payments per claim for defense attorneys
37

© WCRI 2017
Highlights Of WCRI CompScope™ Benchmark Studies Of Minnesota
• Medical and indemnity payments typical; offsetting factors in the underlying cost components
• Lower medical cost containment expenses offset higher payments for litigation
More frequent use and higher costs of vocational rehabilitation
• Faster first indemnity payment to injured workers • Minnesota costs per all paid claims lower than typical • Lower percentage of injured workers received opioids
on a longer-term basis; decrease since 2010
38

© WCRI 2017
Higher Use And Cost Of Vocational Rehabilitation Services In Minnesota
39
2013/16 Claims With > 7 Days Of Lost Time, Adjusted For Injury/Industry Mix AR, GA, IA, IN, KY, NJ, TX, and WI are excluded from the above charts due to small cell sizes. Source: CompScope™ Benchmarks For Minnesota, 17th Edition (2017)
0%
5%
10%
15%
20%
FL PA NC MA IL MI VA CA LA MN
$0
$2,000
$4,000
$6,000
$8,000
FL MI PA IL CA MA NC LA VA MN
% Of Claims With Vocational Rehabilitation (VR) Expenses
Average VR Expense Per Claim With VR Expenses

© WCRI 2017
Highlights Of WCRI Benchmark Studies Of Minnesota
• Medical and indemnity payments typical; offsetting factors in the underlying cost components
• Lower medical cost containment expenses offset higher payments for litigation
• More frequent use and higher costs of vocational rehabilitation
Faster first indemnity payment to injured workers • Minnesota costs per all paid claims lower than typical • Lower percentage of injured workers received opioids
on a longer-term basis; decrease since 2010
40

© WCRI 2017
Faster First Indemnity Payment To Injured Workers In Minnesota
41
2015/16 Claims With 1st Indemnity Payment Within 21 Days Of Injury As A % Of Claims With > 7 Days Of Lost Time, Adjusted For Injury/Industry Mix. Source: CompScope™ Benchmarks For Minnesota, 17th Edition (2017)
0%
10%
20%
30%
40%
50%
60%
70%
NC VA GA IN IL PA KY CA FL LA MI IA NJ WI TX MN AR MA
% O
f Cla
ims
Median State: 46% 56%

© WCRI 2017
Faster Payment Upon Notice Drove Faster 1st Indemnity Payment In Minnesota
42
2015/16 Claims With > 7 Days Of Lost Time, Adjusted For Injury/Industry Mix Source: CompScope™ Benchmarks For Minnesota, 17th Edition (2017)
Minnesota 18-State Median
% Of Claims With 1st Indemnity Payment Within 21 Days Of Injury 56% 46%
% Of Claims Reported To Payor Within 3 Days Of Injury 58% 60%
% Of Claims With 1st Indemnity Payment Within 14 Days Of Payor Notice
56% 43%

© WCRI 2017
Highlights Of WCRI CompScope™ Benchmark Studies Of Minnesota
• Medical and indemnity payments typical; offsetting factors in the underlying cost components
• Lower medical cost containment expenses offset higher payments for litigation
• More frequent use and higher costs of vocational rehabilitation
• Faster first indemnity payment to injured workers Minnesota costs per all paid claims lower than typical • Lower percentage of injured workers received opioids
on a longer-term basis; decrease since 2010
43
© WCRI 2017
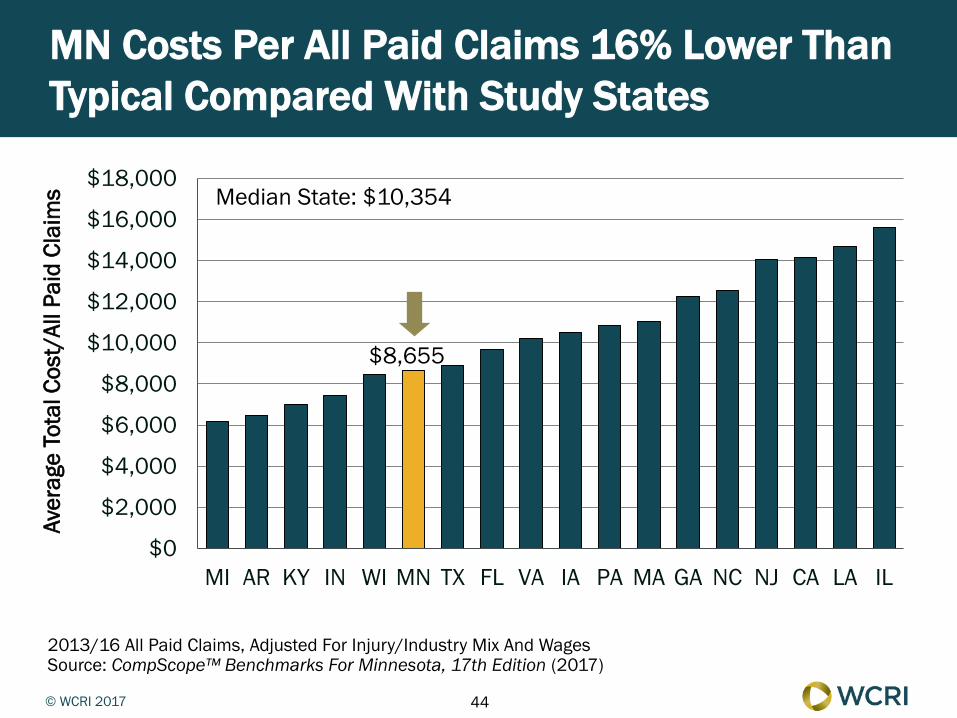
MN Costs Per All Paid Claims 16% Lower Than Typical Compared With Study States
44
2013/16 All Paid Claims, Adjusted For Injury/Industry Mix And Wages Source: CompScope™ Benchmarks For Minnesota, 17th Edition (2017)
$0
$2,000
$4,000
$6,000
$8,000
$10,000
$12,000
$14,000
$16,000
$18,000
MI AR KY IN WI MN TX FL VA IA PA MA GA NC NJ CA LA IL
Aver
age
Tota
l Cos
t/Al
l Pai
d Cl
aim
s Median State: $10,354
$8,655

© WCRI 2017
Typical % Of MN Workers Had More Than Seven Days Of Lost Time After Injury
45
2013/16 Claims With > 7 Days Of Lost Time As A % Of All Paid Claims, Adjusted For Injury/Industry Mix And Wages. Source: CompScope™ Benchmarks For Minnesota, 17th Edition (2017)
0%
5%
10%
15%
20%
25%
30%
35%
IN AR KY MI VA WI PA IA MN GA NC LA FL TX IL CA NJ MA
% O
f Cla
ims
Median State: 21%
20%
© WCRI 2017
Highlights Of WCRI CompScope™ Benchmark Studies Of Minnesota
• Medical and indemnity payments typical; offsetting factors in the underlying cost components
• Lower medical cost containment expenses offset higher payments for litigation
• More frequent use and higher costs of vocational rehabilitation
• Faster first indemnity payment to injured workers • Minnesota costs per all paid claims lower than typical Lower percentage of injured workers received opioids
on a longer-term basis; decrease since 2010
46

© WCRI 2017
Minnesota Lower Or Typical Of 26 States On Most Metrics Of Opioid Use
47
Nonsurgical Claims With > 7 Days Of Lost Time, Injuries From October 2012 To September 2013, Rx Filled Through March 2015. Source: Interstate Variations In Use Of Opioids, 4th Edition (2017)
Metrics Of Opioid Use MN 26-State Median
WI Compared With Median State
% Of Claims With Pain Medications That Had Opioids 78% 73% Fairly Typical
% Of Claims With Pain Medications That Had Two Or More Opioid Rx 44% 41% Typical
Avg. MEA Per Claim With Opioids (milligrams) 1,168 1,400 Lower
Avg. Number Of Opioid Rx/Claim With Opioids 3.3 3.5 Typical
Avg. Number Of Opioid Pills/Claim With Opioids 154 176 Lower
Avg. MEA Per Pill (milligrams) 7.6 8.2 Typical
© WCRI 2017
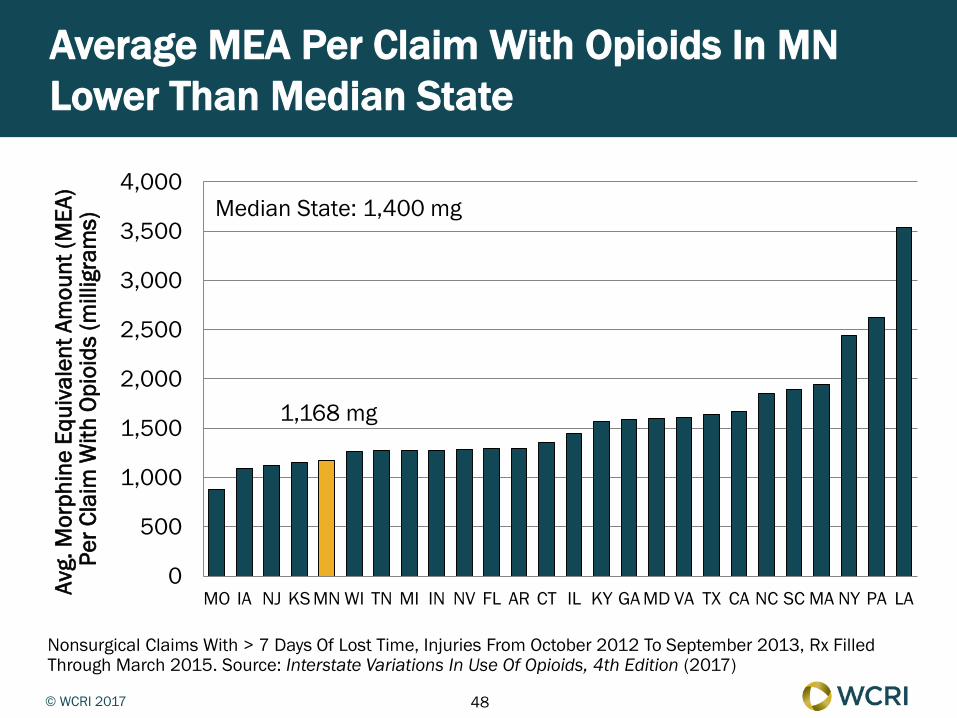
Average MEA Per Claim With Opioids In MN Lower Than Median State
48
Nonsurgical Claims With > 7 Days Of Lost Time, Injuries From October 2012 To September 2013, Rx Filled Through March 2015. Source: Interstate Variations In Use Of Opioids, 4th Edition (2017)
1,168 mg
0
500
1,000
1,500
2,000
2,500
3,000
3,500
4,000
MO IA NJ KS MN WI TN MI IN NV FL AR CT IL KY GA MD VA TX CA NC SC MA NY PA LAAvg.
Mor
phin
e Eq
uiva
lent
Am
ount
(MEA
) Pe
r Cla
im W
ith O
pioi
ds (m
illig
ram
s) Median State: 1,400 mg

© WCRI 2017
Longer-Term Dispensing Of Opioids In MN: About 5% Injured Workers (Typical)
49
Nonsurgical Claims With > 7 Days Of Lost Time, Injuries From October 2012 Through September 2013, Prescriptions Filled Through March 2015. Source: Longer-Term Dispensing Of Opioids, 4th Edition (2017)
0%
5%
10%
15%
20%
KS NJ MO WI IN NV IA AR TN FL MN MI IL MD CT KY VA MA NY GA CA NC TX PA SC LA% O
f Cla
ims
With
Opi
oids
Tha
t Rec
eive
d
Opio
ids
On A
Lon
ger-T
erm
Bas
is Median State: 5.7%
5.0%

© WCRI 2017
Decrease In % Of Longer-Term Opioid Dispensing In Minnesota
50
Nonsurgical Claims With > 7 Days Of Lost Time, Injuries From October 2012 To September 2013, Rx Filled Through March 2015 Compared With Injuries From October 2009 To September 2010 With Rx Filled Through March 2012. Source: Longer-Term Dispensing Of Opioids, 4th Edition (2017)
-5.0
-4.0
-3.0
-2.0
-1.0
0.0
1.0
2.0
KY NY TN MI KS MA MN AR CT TX FL CA NV NC MD NJ PA IL MO GA WI IN IA VA SC LA
Chan
ge In
% O
f Cla
ims
With
Opi
oids
Tha
t Re
ceiv
ed O
pioi
ds O
n A
Long
er-T
erm
Bas
is
From
201
0/12
To
2013
/15

© WCRI 2017
Thank You For Your Attention!
• For comments/questions about the findings:
Follow us on social media:
51
Sharon Belton Senior Public Policy Analyst
[email protected] 715-302-8483
Patrick Robinson Regional Director
[email protected] 225-485-8701
© WCRI 2017
Other WCRI Studies Of Interest For Minnesota
• CompScope™ Medical Benchmarks for Minnesota, 18th Edition (forthcoming) • CompScope™ Benchmarks for Minnesota, 17th Edition (2017) • WCRI Medical Price Index for Workers’ Compensation, Ninth Edition (2017) • Hospital Outpatient Payment Index: Interstate Variations and Policy Analysis, 6th
Edition (2017) • Longer-Term Dispensing of Opioids, 4th Edition (2017) • Interstate Variations in Use of Opioids, 4th Edition (2017) • A Multistate Perspective on Physician Dispensing, 2011–2014 (2017) • CompScope™ Medical Benchmarks for Minnesota, 17th Edition (2016) • Comparing Outcomes for Injured Workers in Minnesota (2016) • Payments to Ambulatory Surgery Centers, 2nd Edition (2016) • Comparing Payments to Ambulatory Surgery Centers and Hospital Outpatient
Departments, 2nd Edition (2016) • Workers’ Compensation MCC: National Inventory, 2015 (2015) • National Inventory of WC Fee Schedules for Hospitals and Ambulatory Surgical
Centers (2010) 52