Embed Size (px)
Citation preview

8 August 2019
Kerry Group - Interim Management Report for the half year ended 30 June 2019 Kerry Group, the global taste & nutrition and consumer foods group reports business performance for the half year ended 30 June 2019.
HIGHLIGHTS
• Group revenue of €3.6 billion reflecting 3.3% volume growth
— Taste & Nutrition +3.8% volume growth
— Consumer Foods +0.6% volume growth
• Reported revenue +10.7%
• Group trading margin +20bps to 10.7%
— Taste & Nutrition +20bps to 13.3%
— Consumer Foods margins maintained at 7.0%
• Adjusted EPS of 164.1 cent – up 8.4% on a constant currency basis
• Basic EPS of 135.5 cent (H1 2018: 128.3 cent)
• Interim dividend per share increased 11.9% to 23.5 cent
• Free cash flow of €195m (H1 2018: €201m)
• Full year guidance updated
Edmond Scanlon – Chief Executive Officer “We are pleased with business performance in the period, as the Group continued to deliver volume growth ahead of the market while expanding trading margins in line with expectations. While heightened consumer pricing and uncertainty impacted market volume growth rates in some developed markets, our unique and industry-leading business model and integrated taste and nutrition positioning continued to deliver significant value for our customers in meeting rapidly evolving consumer needs. We are excited by the ongoing enhancement of our product mix and the development of our innovation pipeline. Good progress has been made on the integration of recent acquisitions, which are performing very well. We are updating our guidance and expect to achieve growth in adjusted earnings per share of 7% to 9% in constant currency.”
Contact Information
Media
Catherine Keogh VP Corporate Affairs & Communications
+353 66 7182304 [email protected]
Investor Relations
Marguerite Larkin Chief Financial Officer +353 66 7182292 [email protected]
William Lynch Head of Investor Relations +353 66 7182292 [email protected]
Website
www.kerrygroup.com
Kerry Group plc – Interim Management Report 2019 1

INTERIM MANAGEMENT REPORT For the half year ended 30 June 2019
Group Performance Group reported revenue increased by 10.7%, reflecting volume growth of 3.3%, neutral pricing, contribution from acquisitions of 4.7%, and a favourable translation currency impact of 2.7%.
Group trading margin increased by 20bps, reflecting good growth driven by operating leverage, portfolio enhancement, efficiencies, impact of foreign currency and acquisitions, partially offset by Brexit risk management costs, investments for growth and increased net investment on the KerryExcel programme.
Constant currency adjusted earnings per share increased by 8.4% to 164.1 cent (H1 2018 currency adjusted: 151.4 cent). Basic earnings per share increased by 5.6% to 135.5 cent (H1 2018: 128.3 cent).
The interim dividend of 23.5 cent per share represents an increase of 11.9% over the 2018 interim dividend. The Group achieved free cash flow of €195m in the period (H1 2018: €201m).
The Marketplace The food & beverage industry and end-to-end supply chain continue to evolve at pace, as consumers are demanding more and are challenging traditional business models.
Market volumes in some developed economies experienced softening in the period due to the impact of higher prices at a consumer level. Developing markets continued to change rapidly, with localisation, regulatory changes and home delivery driving increased new product development.
Major global consumer trends such as plant-based diets, authenticity, healthfulness, convenience, clean label, sustainability and premiumisation, tailored to local consumer preferences continue to generate increased innovation opportunities.
The application of Kerry’s leading taste and nutrition technology portfolio through our unique business model continues to drive significant value for our customers as they seek to meet rapidly changing consumer demands and increase speed to market.
Business Reviews
Taste & Nutrition
H1 2019 Growth
Revenue €2,915m 3.8%¹
Trading margin 13.3% +20bps
¹ volume growth
• Volume growth driven by Meat, Snacks and Beverage End Use Markets (EUMs)
• Pricing flat – reflecting broadly neutral raw material costs in the period
• Trading margin +20bps – key drivers were enhanced product mix, operating leverage and efficiencies, partially offset by investments for growth and Brexit risk management costs
Kerry’s nutrition and wellbeing technology portfolio had a strong performance in the period, as demand for great-tasting products with improved nutritional attributes continued to accelerate across the globe. Our unique taste and nutrition positioning, food science expertise and deep understanding of the intersection of taste and nutrition attributes were the drivers of increased innovation across a wide range of applications. This led to good sales growth in customised solutions incorporating in particular Kerry’s fermented ingredients, broad protein portfolio, probiotics, fibre systems, botanicals and natural extracts.
Kerry Group plc – Interim Management Report 2019 2

Developing market growth continued to be strong at 9.1%, with APMEA developing markets being the main driver. Foodservice performed well, with growth of 5.3% despite some softness in the North American market at the beginning of the year. The Group also completed the acquisitions of Southeastern Mills (SEM) and Ariake U.S.A., Inc in the period.
Americas Region
• 2.7% volume growth
• Solid performance in North America, driven by Meat, Snacks and Dairy EUMs
• LATAM performed well
Reported revenue in the region increased by 19.1% to €1,556m primarily reflecting volume growth, foreign currency translation and significant contribution from acquisitions of 9.9%.
North America delivered good volume growth, while market volumes growth rates softened as heightened consumer pricing impacted overall consumption in the period. LATAM performed well with good growth in Mexico and solid performances in Brazil and Central America.
Kerry’s Meat EUM delivered strong growth, as our industry-leading portfolio continued to support customers as they innovate to meet evolving consumer demands for new regional flavours, cleaner labels, natural shelf-life preservation and plant-based alternatives. This performance was complemented by the acquisition of Southeastern Mills (SEM) in the period which performed very well.
The Snacks EUM delivered good growth through healthier snacking and new world taste experiences, particularly in LATAM. The Dairy EUM benefitted from the ongoing evolution of the ice cream & desserts category towards premiumisation, lower-calorie and plant-based offerings.
While the Beverage EUM was impacted by a softer start to the year in Foodservice, it benefitted from a number of innovations utilising Ganeden® probiotics and Wellmune® immunity enhancing technologies. The Meals EUM was impacted by softness, particularly in the ambient and chilled categories.
The global Pharma EUM had a good performance, led by strong growth in excipients in North America.
The recently acquired Fleischmann’s (FVC) business performed well and the Group also completed the acquisition of Ariake U.S.A., Inc in the period. These acquisitions further enhance Kerry's leading authentic taste and clean label technology portfolio, which the Group plans to leverage in meeting increased demands across a broader range of applications.
Europe Region
• 2.2% volume growth
• Good performance in Beverage, Meat and Snacks EUMs
• Foodservice delivered strong growth
Reported revenue in the region increased by 2.5% to €718m primarily reflecting volume growth.
Kerry’s development and applications expertise helped customers improve and broaden their product offerings to meet a diverse range of local consumer preferences right across the region.
The Beverage EUM achieved strong broad-based growth, particularly in Foodservice, as customers enhanced their beverage offerings across their menus, with a number of ‘better for you’ and seasonal product launches incorporating Kerry’s botanicals, natural extracts and sugar reduction technologies.
The Meat EUM performed very well, with multi-texture coating systems delivering new sensorial taste experiences, and in addition a number of successful cleaner label launches. Good business development was also achieved in plant-based meat alternatives, as Kerry’s offering was enhanced by the recent JV with Ojah.
The Snacks EUM performed well, with a number of new launches with new authentic world flavours.
Kerry Group plc – Interim Management Report 2019 3

The Dairy EUM was impacted by softer demand in the ice cream category during the period. International dairy markets were relatively stable in the period, reflecting less volatility in global supply / demand dynamics. The Confectionary EUM achieved good growth through a number of local novel taste LTOs across the region.
APMEA Region
• 9.6% volume growth
• Strong growth in Meat, Beverage and Snacks EUMs
• Progressing strategic expansion and business development across the region
Reported revenue in the region increased by 13.3% to €608m primarily reflecting volume growth and the contribution from business acquisitions.
The Group continued to selectively deploy the Kerry business model on a country-by-country basis in the period. This approach was key in supporting our customers as they meet evolving local consumer demands that continue to drive growth right across the region.
Kerry’s Meat EUM delivered excellent growth with a range of innovations across both Foodservice and Retail customers to meet key consumer preferences for local authentic taste, value, food safety and home delivery.
The Beverage EUM delivered strong growth underpinned by a number of successful launches into nutritional beverages and a range of foodservice applications. The branded DaVinci range enjoyed strong growth into independent distributors.
The Snacks EUM delivered strong growth, with innovation centred around the localisation of Western taste profiles incorporating both sweet and savoury technologies.
We continued to make good progress in expanding our capacity and processing capabilities in the region. Our strategic expansion in China progressed well, as we upgraded the recently acquired SIAS facility to serve our customers in the Greater Beijing region, while we continued the expansion programme at our Nantong facility aligned to the strategic deployment of our technologies in the region. The Group also opened a new facility in Tumkur, India, which will serve the rapidly expanding South West Asia market and invested in expanding our capabilities in the Middle East region further to the acquisition of AATCO at the end of 2018.
Kerry Group plc – Interim Management Report 2019 4

Consumer Foods
H1 2019 Growth
Revenue €689m 0.6%¹
Trading margin 7.0% 0bps
¹ volume growth
• Solid performance led by brands with private label challenged
• Pricing (0.3%) reflective of input costs which were not fully recovered
• Trading margin maintained after incurring Brexit risk management costs
The market landscape continued to be challenged in the period. Lower consumer confidence was reflected through a more cautious consumer, while structural changes across the retail environment continue to drive change along the end-to-end supply chain.
Reported revenue increased by 0.6% to €689m, reflecting volume growth, pricing, and a translation currency tailwind.
‘Everyday Fresh’ performed in line with expectations. Richmond delivered solid performance led by growth in chicken sausages, while the Denny brand in Ireland experienced strong growth. The traditional spreads category continued to be challenged, however Kerry outperformed with our spreadable butter offering addressing consumer preferences.
‘Convenience Meal Solutions’ continued to be impacted by reduced promotional activity, but was offset by a number of new business wins through ethnic ready meals in the period. Frozen ready meals delivered a solid performance across the range. At the end of the period, the Group announced that it will cease operations at its production facility in Burton from the start of September, while we will continue our efforts to find alternative solutions for the site.
‘Food to Go’ performed well, as strong growth in Cheestrings was supported by a number of innovations. Fridge Raiders also extended its snacking range with the launch of a number of new products during the period to reach a broader consumer market. The realignment programme is progressing to plan.
Kerry Group plc – Interim Management Report 2019 5

Financial Review
H1 2019 H1 2018
Analysis of Results % Change €’m €’m
Revenue 10.7% 3,568.9 3,225.3
Trading profit 12.6% 382.9 340.0 Trading margin 10.7% 10.5% Computer software amortisation (12.9) (14.9)
Finance costs (net) (38.9) (33.8)
Adjusted earnings before taxation 331.1 291.3
Income taxes (excluding non-trading items) (41.1) (36.5)
Adjusted earnings after taxation 290.0 254.8
Brand related intangible asset amortisation (16.4) (12.7)
Non-trading items (net of related tax) (34.2) (15.4)
Profit after taxation 239.4 226.7
EPS EPS Cent Cent
Basic EPS 5.6% 135.5 128.3 Brand related intangible asset amortisation
9.3 7.2
Non-trading items (net of related tax) 19.3 8.7
Adjusted* EPS 13.8% %
164.1 144.2
Impact of retranslating prior period adjusted EPS at current period average exchange rates
- 7.2
Constant Currency Adjusted* EPS 8.4% 164.1 151.4
* Before brand related intangible asset amortisation and non-trading items (net of related tax)
Analysis of Results
Revenue On a reported basis Group revenue increased by 10.7% to €3.6 billion (H1 2018: €3.2 billion), including volume growth of 3.3%, neutral pricing, a positive translation currency impact of 2.7% and contribution from business acquisitions of 4.7%.
H1 2018: Group reported revenue +1.4%, volume +3.6%, pricing +0.6%, transaction currency (0.1%), translation currency (6.6%), acquisitions +3.9%.
In Taste & Nutrition, reported revenue increased by 13.0% to €2.9 billion (H1 2018: €2.6 billion), including volume growth of 3.8%, neutral pricing, a positive translation currency impact of 3.3% and contribution from business acquisitions of 5.9%.
H1 2018: Taste & Nutrition reported revenue +1.4%, volume +4.1%, pricing +0.6%, translation currency (7.9%), acquisitions +4.6%.
In Consumer Foods, reported revenue increased by 0.6% to €689m (H1 2018: €685m), including volume growth of 0.6%, pricing of (0.3%) and a positive translation currency impact of 0.3%.
H1 2018: Consumer Foods reported revenue +1.2%, volume +1.3%, pricing +0.9%, transaction currency (0.4%), translation currency (1.6%), acquisitions +1.0%.
Kerry Group plc – Interim Management Report 2019 6

Trading Profit & Margin Group trading profit increased by 12.6% to €382.9m (H1 2018: €340.0m).
Group trading profit margin increased by 20 basis points to 10.7%, reflecting good growth driven by operating leverage, portfolio enhancement, efficiencies, foreign currency translation and acquisitions, partially offset by Brexit risk management costs, investments for growth and increased net investment on the KerryExcel programme.
Trading profit margin in Taste & Nutrition increased by 20 basis points to 13.3%, reflecting good growth driven by operating leverage, portfolio enhancement, efficiencies, and foreign currency translation, partially offset by acquisitions, Brexit risk management costs and investments for growth. Trading profit margin in Consumer Foods was maintained at 7.0%, reflecting portfolio enhancement and efficiencies, offset by pricing and Brexit risk management costs.
Finance Costs (net)
Finance costs (net) for the period increased by €5.1m to €38.9m (H1 2018: €33.8m) primarily due to acquisition activity and the impact of IFRS 16 ‘Leases’, partially offset by cash generation, positive interest rates and a reduction in pension interest.
Impact of IFRS 16 ‘Leases’
In January 2019 the Group adopted the new accounting standard (IFRS 16 ‘Leases’), which had the impact of reducing net operating expenses by €1.4m on a like-for-like basis, and the effect of increasing finance costs by €2.3m on transition.
Taxation The tax charge for the period, before non-trading items was €41.1m (H1 2018: €36.5m) which represents an effective tax rate of 13.0% which is in line with year-end (H1 2018: 13.1%).
Acquisitions During the period, the Group completed three acquisitions at a total cost of €327.2m including Ariake U.S.A., Inc. and Southeastern Mills’ North American coatings and seasonings business (SEM).
Non-Trading Items
The Group recorded €34.2m of costs net of tax (H1 2018: €15.4m) including costs associated with the integration of 2018 and 2019 acquisitions and the Consumer Foods Realignment Programme.
Adjusted EPS
Adjusted EPS in constant currency increased by 8.4% in the period (H1 2018: +9.0%). Adjusted EPS in reporting currency increased by 13.8% to 164.1 cent (H1 2018: 144.2 cent).
Basic EPS
Basic EPS increased by 5.6% to 135.5 cent in the period (H1 2018: 128.3 cent).
Kerry Group plc – Interim Management Report 2019 7
Free Cash Flow The Group achieved free cash flow of €194.8m (H1 2018: €200.6m). This decrease is primarily due to increased investments in working capital and capital expenditure.
Free Cash Flow H1 2019 H1 2018
€’m €’m Trading profit 382.9 340.0
Depreciation (net) 94.0 66.8
Movement in average working capital (77.3) (29.6)
Pension contributions paid less pension expense (11.2) (21.7)
Cash flow from operations 388.4 355.5
Finance costs paid (net) (30.4) (22.8)
Income taxes paid (28.7) (18.2)
Capital expenditure (134.5) (113.9)
Free cash flow 194.8 200.6
Balance Sheet A summary balance sheet as at 30 June 2019 is provided below:
H1 2019 H1 2018 FY 2018
€’m €’m €’m
Property, plant & equipment 1,928.8 1,607.9 1,767.0
Intangible assets 4,380.0 3,728.6 4,095.6
Other non-current assets 171.1 198.1 189.7
Current assets 2,453.5 2,141.3 2,271.4
Total assets 8,933.4 7,675.9 8,323.7
Current liabilities 2,018.9 1,696.5 1,650.8
Non-current liabilities 2,728.0 2,205.8 2,638.5
Total liabilities 4,746.9 3,902.3 4,289.3
Net assets 4,186.5 3,773.6 4,034.4
Shareholders’ equity 4,186.5 3,773.6
4,034.4
Property, Plant & Equipment
Property, plant & equipment increased by €161.8m to €1,928.8m (Dec 2018: €1,767.0m, H1 2018: €1,607.9m) due to additions made in the period and the impact of the change in the lease accounting policy, offset by the depreciation charge.
Intangible Assets Intangible assets increased by €284.4m to €4,380.0m (Dec 2018: €4,095.6m, H1 2018: €3,728.6m) due to acquisitions made in the period offset by the amortisation charge.
Current Assets Current assets increased by €182.1m to €2,453.5m (Dec 2018: €2,271.4m, H1 2018: €2,141.3m), mainly due to increases in inventory and trade and other receivables.
Retirement Benefits At the balance sheet date, the net deficit for all defined benefit schemes (after deferred tax) was €64.4m (Dec 2018: €44.0m, H1 2018: €35.4m). The increase in the net deficit from year end was driven primarily by adverse movements in discount rates.
Kerry Group plc – Interim Management Report 2019 8

Net Debt At 30 June 2019, net debt was €1,918.2m. This increase of €294.7m relative to the December 2018 net debt of €1,623.5m reflects cash flow generated offset by investment in acquisitions and the dividends paid in the period.
In June 2019, the Group agreed a new five year €1.1bn revolving credit facility which extends the maturity profile of the Group’s available credit facilities.
Return on Average Capital Employed (ROACE) The Group achieved ROACE of 11.9% (H1 2018: 12.4%) reflective of acquisitions and investments.
Key Financial Covenants
A portion of Group financing facilities are subject to financial covenants as set out in their facility agreements. The Group’s balance sheet is in a healthy position. With a net debt to EBITDA* ratio of 1.9 times, the organisation has sufficient headroom to support future growth plans. Group Treasury monitors compliance with all financial covenants and at 30 June the key covenants were as follows:
Covenant
H1 2019 Times
H1 2018 Times
FY 2018 Times
Net debt: EBITDA* Maximum 3.5 1.9 1.5 1.7 EBITDA: Net interest* Minimum 4.0 (30 June 2018: 4.75) 14.4 14.8 14.7
*Calculated in accordance with lenders’ facility agreements which take account of adjustments as outlined in the financial definitions accompanying the Interim Financial Statements.
Related Party Transactions There were no changes in related party transactions from the 2018 Annual Report that could have a material effect on the financial position or performance of the Group in the first half of the year.
Exchange Rates Group results are impacted by fluctuations in exchange rates year-on-year versus the euro. The average rates below are the principal rates used for the translation of results. The closing rates below are used to translate assets and liabilities at period end.
Average Rates Closing Rates H1 2019 H1 2018 H1 2019 H1 2018
Australian Dollar 1.60 1.57 1.63 1.58
Brazilian Real 4.38 4.12 4.37 4.39
British Pound Sterling 0.87 0.88 0.89 0.89
Mexican Peso 21.68 23.05 21.76 23.13
Malaysian Ringgit 4.65 4.78 4.72 4.69
Russian Ruble 73.73 71.22 71.38 73.41
South African Rand 16.16 14.73 16.09 15.90
US Dollar 1.13 1.21 1.14 1.17
Principal Risks & Uncertainties Details of the principal risks and uncertainties facing the Group can be found in the 2018 Annual Report on pages 76 to 85. These risks include but are not limited to; portfolio management, Brexit, geopolitical risks, business acquisition and divestiture, quality, food safety & regulatory, talent management, information security and cybercrime, margin management, Kerryconnect, intellectual property management, taxation and treasury. In the second half of the year we will continue to closely monitor the potential implications of the UK’s anticipated exit from the EU on 31 October 2019. The Group actively manages all risks through its control and risk management process.
Kerry Group plc – Interim Management Report 2019 9

Going Concern The Group Condensed Consolidated Interim Financial Statements have been prepared on the going concern basis of accounting. The Directors report that they have satisfied themselves that the Group is a going concern, having adequate resources to continue in operational existence for the foreseeable future. In forming this view, the Directors have reviewed the Group’s budget for a period not less than 12 months, the medium term plans as set out in the rolling five year plan, and have taken into account the cash flow implications of the plans, including proposed capital expenditure, and compared these with the Group’s committed borrowing facilities and projected gearing ratios.
Dividend
The Board has declared an interim dividend of 23.5 cent per share (an increase of 11.9% on the 2018 interim dividend of 21.0 cent) payable on 15 November 2019 to shareholders registered on the record date 18 October 2019.
Future Prospects Kerry continues to adapt to the rapidly changing marketplace, investing in and further developing the Kerry business model to consistently outperform our markets and respond to evolving local consumer trends and customer requirements through industry leading innovation. Taste & Nutrition has a strong innovation pipeline with good growth prospects, particularly in developing markets where business footprint expansion and roll out of our consumer led in-country approach continues. Consumer Foods continues to realign the core and invest in adjacencies, whilst navigating the current UK uncertain environment. The Group will continue to invest in business development and pursue M&A opportunities aligned to strategic growth priorities. In 2019 the Group expects to deliver adjusted earnings per share growth of 7% to 9% on a constant currency basis.
Kerry Group plc – Interim Management Report 2019 10

Responsibility Statement The Directors are responsible for preparing the Half Yearly Financial Report in accordance with the Transparency (Directive 2004/109/EC) Regulations 2007 of Ireland (S.I. No. 277 of 2007) (“the Regulations”), the Transparency Rules of the Central Bank of Ireland and with IAS 34 “Interim Financial Reporting” as adopted by the European Union.
The Directors confirm that to the best of their knowledge:
• the Group Condensed Consolidated Interim Financial Statements for the half year ended 30 June 2019 have been prepared in accordance with the international accounting standard applicable to interim financial reporting adopted pursuant to the procedure provided for under Article 6 of the Regulation (EC) No. 1606/2002 of the European Parliament and of the Council of 19 July 2002;
• the Interim Management Report includes a fair review of the important events that have occurred during the first six months of the financial year, and their impact on the Group Condensed Consolidated Interim Financial Statements for the half year ended 30 June 2019, and a description of the principal risks and uncertainties for the remaining six months;
• the Interim Management Report includes a fair review of the related party transactions that have occurred during the first six months of the current financial year and that have materially affected the financial position or the performance of the Group during that period, and any changes in the related parties’ transactions described in the last Annual Report that could have a material effect on the financial position or performance of the Group in the first six months of the current financial year.
On behalf of the board Edmond Scanlon Marguerite Larkin Chief Executive Officer Chief Financial Officer 7 August 2019
Disclaimer: Forward Looking Statements This Announcement contains forward looking statements which reflect management expectations based on currently available data. However actual results may differ materially from those expressed or implied by these forward looking statements. These forward looking statements speak only as of the date they were made and the Company undertakes no obligation to publicly update any forward looking statement, whether as a result of new information, future events or otherwise.
Kerry Group plc – Interim Management Report 2019 11

for the half year ended 30 June 2019
Before
Non-Trading Non-Trading Half year Half year Year
Items Items ended ended ended
30 June 2019 30 June 2019 30 June 2019 30 June 2018 31 Dec. 2018
Unaudited Unaudited Unaudited Unaudited Audited
Notes €'m €'m €'m €'m €'m
Revenue 2 3,568.9 - 3,568.9 3,225.3 6,607.6
Trading profit 2 382.9 - 382.9 340.0 805.6
Intangible asset amortisation (29.3) - (29.3) (27.6) (53.8)
Non-trading items 3 - (42.3) (42.3) (19.9) (66.9)
Operating profit 353.6 (42.3) 311.3 292.5 684.9
Finance income 4 0.2 - 0.2 0.2 0.5
Finance costs 4 (39.1) - (39.1) (34.0) (67.5)
314.7 (42.3) 272.4 258.7 617.9
Income taxes (41.1) 8.1 (33.0) (32.0) (77.4)
Profit after taxation attributable to owners of the parent 273.6 (34.2) 239.4 226.7 540.5
Earnings per A ordinary share Cent Cent Cent205.5
- basic 5 135.5 128.3 305.9
- diluted 5 135.4 128.2 305.7
Condensed Consolidated Income Statement
Continuing operations
Profit before taxation
Kerry Group plc – Interim Management Report 2019 12

for the half year ended 30 June 2019
Half year Half year Year
ended ended ended
30 June 2019 30 June 2018 31 Dec. 2018
Unaudited Unaudited Audited
€'m €'m €'m
Profit after taxation attributable to owners of the parent 239.4 226.7 540.5
Other comprehensive income:
Items that are or may be reclassified subsequently to profit or loss:
Fair value movements on cash flow hedges 7.6 (3.6) 2.2
Cash flow hedges - reclassified to profit or loss from equity 0.1 (1.4) (2.5)
Net change in cost of hedging 1.5 - (2.0)
Deferred tax effect of fair value movements on cash flow hedges (1.2) 0.5 (0.2)
Exchange difference on translation of foreign operations 23.6 (2.6) (0.9)
Fair value movement on revaluation of financial assets held at fair value through other comprehensive income - - (1.9)
Items that will not be reclassified subsequently to profit or loss:
Re-measurement on retirement benefits obligation (34.7) 60.6 34.5
Deferred tax effect of re-measurement on retirement benefits obligation 5.1 (9.8) (6.3)
2.0 43.7 22.9
241.4 270.4 563.4
Condensed Consolidated Statement of Comprehensive Income
Net income recognised directly in other comprehensive income
Total comprehensive income
Kerry Group plc – Interim Management Report 2019 13
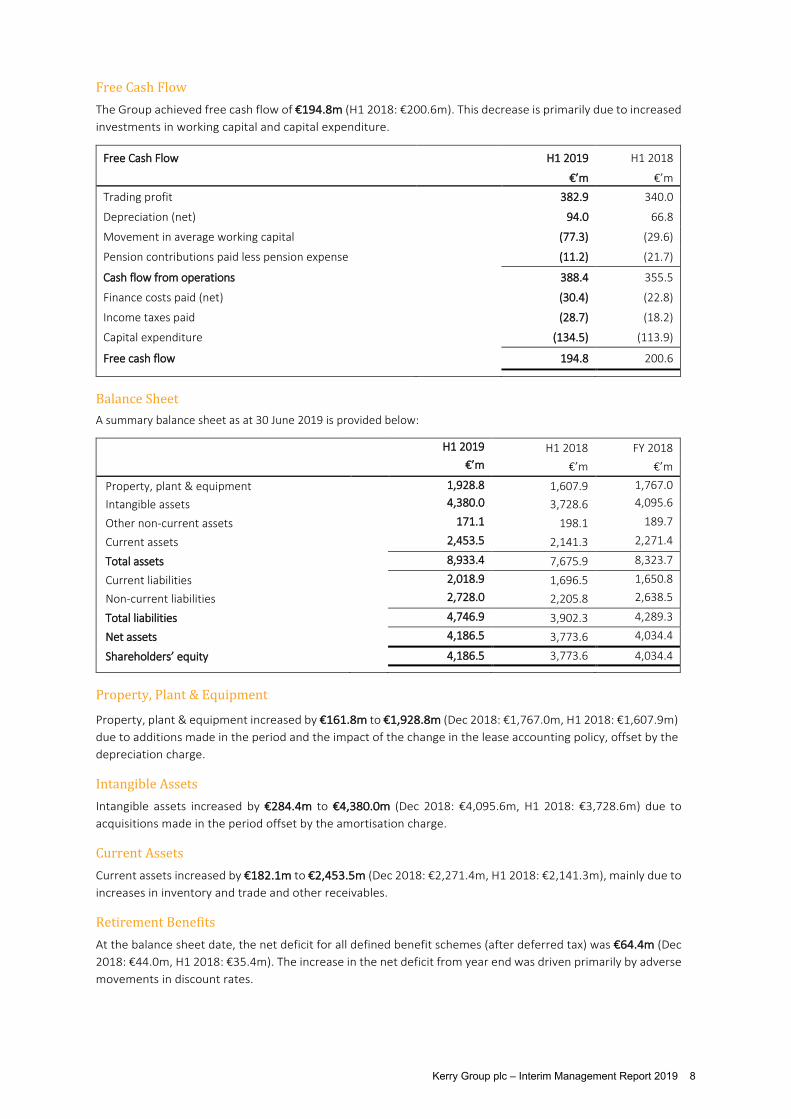
Condensed Consolidated Balance Sheet
as at 30 June 2019
30 June 2019 30 June 2018 31 Dec. 2018
Unaudited Unaudited Audited
Notes €'m €'m €'m
Non-current assets
Property, plant and equipment 1,928.8 1,607.9 1,767.0
Intangible assets 4,380.0 3,728.6 4,095.6
Financial asset investments 39.5 40.3 35.3
Investment in associates and joint ventures 15.9 19.6 15.6
Other non-current financial instruments 79.3 92.5 101.7
Deferred tax assets 36.4 45.7 37.1
6,479.9 5,534.6 6,052.3
Current assets
Inventories 1,029.8 848.4 877.8
Trade and other receivables 1,093.2 989.8 967.8
Cash at bank and in hand 11 267.4 290.3 413.8
Other current financial instruments 61.1 10.3 10.0
Assets classified as held for sale 2.0 2.5 2.0
2,453.5 2,141.3 2,271.4
Total assets 8,933.4 7,675.9 8,323.7
Current liabilities
Trade and other payables 9 1,663.4 1,497.7 1,482.1
Borrowings and overdrafts 11 201.1 30.7 13.8
Other current financial instruments 5.2 8.1 11.0
Tax liabilities 123.9 122.4 122.4
Provisions 24.9 35.7 20.3
Deferred income 0.4 1.9 1.2
2,018.9 1,696.5 1,650.8
Non-current liabilities
Borrowings 11 2,107.9 1,743.7 2,119.7
Other non-current financial instruments 0.2 11.4 5.6
Retirement benefits obligation 7 77.0 44.6 53.2
Other non-current liabilities 10 167.3 96.2 82.6
Deferred tax liabilities 324.8 250.8 324.1
Provisions 29.8 37.7 32.1
Deferred income 21.0 21.4 21.2
2,728.0 2,205.8 2,638.5
Total liabilities 4,746.9 3,902.3 4,289.3
Net assets 4,186.5 3,773.6 4,034.4
Issued capital and reserves attributable to owners of the parent
Share capital 12 22.0 22.0 22.0
Share premium 398.7 398.7 398.7
Other reserves (167.7) (214.6) (207.3)
Retained earnings 3,933.5 3,567.5 3,821.0
Shareholders' equity 4,186.5 3,773.6 4,034.4
Kerry Group plc – Interim Management Report 2019 14

Share
Capital
Share
Premium
Other
Reserves
Retained
Earnings Total
Note €'m €'m €'m €'m €'m
At 1 January 2018 22.0 398.7 (214.4) 3,366.9 3,573.2
Profit after tax attributable to owners of the parent - - - 226.7 226.7
Other comprehensive (expense)/income - - (7.6) 51.3 43.7
Total comprehensive (expense)/income - - (7.6) 278.0 270.4
Dividends paid 6 - - - (77.4) (77.4)
Share-based payment expense - - 7.4 - 7.4
At 30 June 2018 - unaudited 22.0 398.7 (214.6) 3,567.5 3,773.6
Profit after tax attributable to owners of the parent - - - 313.8 313.8
Other comprehensive income/(expense) - - 2.5 (23.3) (20.8)
Total comprehensive income - - 2.5 290.5 293.0
Dividends paid 6 - - - (37.0) (37.0)
Share-based payment expense - - 4.8 - 4.8
At 31 December 2018 - audited 22.0 398.7 (207.3) 3,821.0 4,034.4
Adjustment on initial application of IFRS 16 'Leases' - - - (9.4) (9.4)
Adjusted balances at 1 January 2019 22.0 398.7 (207.3) 3,811.6 4,025.0
Profit after tax attributable to owners of the parent - - - 239.4 239.4
Other comprehensive income/(expense) - - 32.8 (30.8) 2.0
Total comprehensive income - - 32.8 208.6 241.4
Dividends paid 6 - - - (86.7) (86.7)
Share-based payment expense - - 6.8 - 6.8
At 30 June 2019 - unaudited 22.0 398.7 (167.7) 3,933.5 4,186.5
Other Reserves comprise the following:
FVOCI
Capital
Redemption
Reserve
Other
Undenominated
Capital
Share-Based
Payment
Reserve
Translation
Reserve
Hedging
Reserve
Cost of
Hedging
Reserve Total
€'m €'m €'m €'m €'m €'m €'m €'m
At 1 January 2018 3.5 1.7 0.3 51.1 (255.8) (15.2) - (214.4)
Total comprehensive expense - - - - (2.6) (5.0) - (7.6)
Share-based payment expense - - - 7.4 - - - 7.4
At 30 June 2018 - unaudited 3.5 1.7 0.3 58.5 (258.4) (20.2) - (214.6)
Total comprehensive (expense)/income (1.9) - - - 1.7 4.7 (2.0) 2.5
Share-based payment expense - - - 4.8 - - - 4.8
At 31 December 2018 - audited 1.6 1.7 0.3 63.3 (256.7) (15.5) (2.0) (207.3)
Total comprehensive income - - - - 23.6 7.7 1.5 32.8
Share-based payment expense - - - 6.8 - - - 6.8
At 30 June 2019 - unaudited 1.6 1.7 0.3 70.1 (233.1) (7.8) (0.5) (167.7)
Condensed Consolidated Statement of Changes in Equityfor the half year ended 30 June 2019
Kerry Group plc – Interim Management Report 2019 15

Condensed Consolidated Statement of Cash Flows
for the half year ended 30 June 2019
Half year Half year Year
ended ended ended
30 June 2019 30 June 2018 31 Dec. 2018
Unaudited Unaudited Audited
Notes €'m €'m €'m
Operating activities
Trading profit 382.9 340.0 805.6
Adjustments for:
Depreciation (net) 94.0 66.8 134.1
Change in working capital (133.5) (66.9) (78.8)
Pension contributions paid less pension expense (11.2) (21.7) (40.0)
Payments on non-trading items (29.3) (17.3) (59.8)
Exchange translation adjustment (0.5) (0.1) 0.5
Cash generated from operations 302.4 300.8 761.6
Income taxes paid (28.7) (18.2) (46.1)
Finance income received 0.2 0.1 0.5
Finance costs paid (30.6) (22.9) (65.0)
Net cash from operating activities 243.3 259.8 651.0
Investing activities
Purchase of assets (net) (123.8) (122.4) (296.1)
Proceeds from the sale of assets 6.4 8.3 10.6
Capital grants received - 0.2 -
Purchase of businesses (net of cash acquired) 13 (324.0) (86.0) (476.8)
Payments relating to previous acquisitions (5.3) (8.7) (11.9)
Purchase of share in associates and joint ventures - (15.6) (14.5)
Income received from joint ventures 0.2 - -
Disposal of businesses - - -
Net cash used in investing activities (446.5) (224.2) (788.7)
Financing activities
Payment of lease liabilities (17.1) - -
Dividends paid 6 (86.7) (77.4) (114.4)
Issue of share capital 12 - - -
Net movement on borrowings (net of swaps) 151.6 (5.9) 350.2
Net cash movement due to financing activities 47.8 (83.3) 235.8
Net (decrease)/increase in cash and cash equivalents (155.4) (47.7) 98.1
Cash and cash equivalents at beginning of period 403.9 305.6 305.6
Exchange translation adjustment on cash and cash equivalents 2.3 1.7 0.2
Cash and cash equivalents at end of period 11 250.8 259.6 403.9
Reconciliation of Net Cash Flow to Movement in Net Debt
Net (decrease)/increase in cash and cash equivalents (155.4) (47.7) 98.1
Cash flow from debt financing (145.0) 5.9 (350.2)
Changes in net debt resulting from cash flows (300.4) (41.8) (252.1)
Fair value movement on interest rate swaps (net of adjustment to borrowings) 7.9 (4.0) (2.6)
Exchange translation adjustment on net debt (2.2) (15.8) (27.1)
Movement in net debt in the period (294.7) (61.6) (281.8)
Net debt at beginning of period (1,623.5) (1,341.7) (1,341.7)
Net debt at end of period 11 (1,918.2) (1,403.3) (1,623.5)
Kerry Group plc – Interim Management Report 2019 16
Notes to the Condensed Consolidated Interim Financial Statements
for the half year ended 30 June 2019
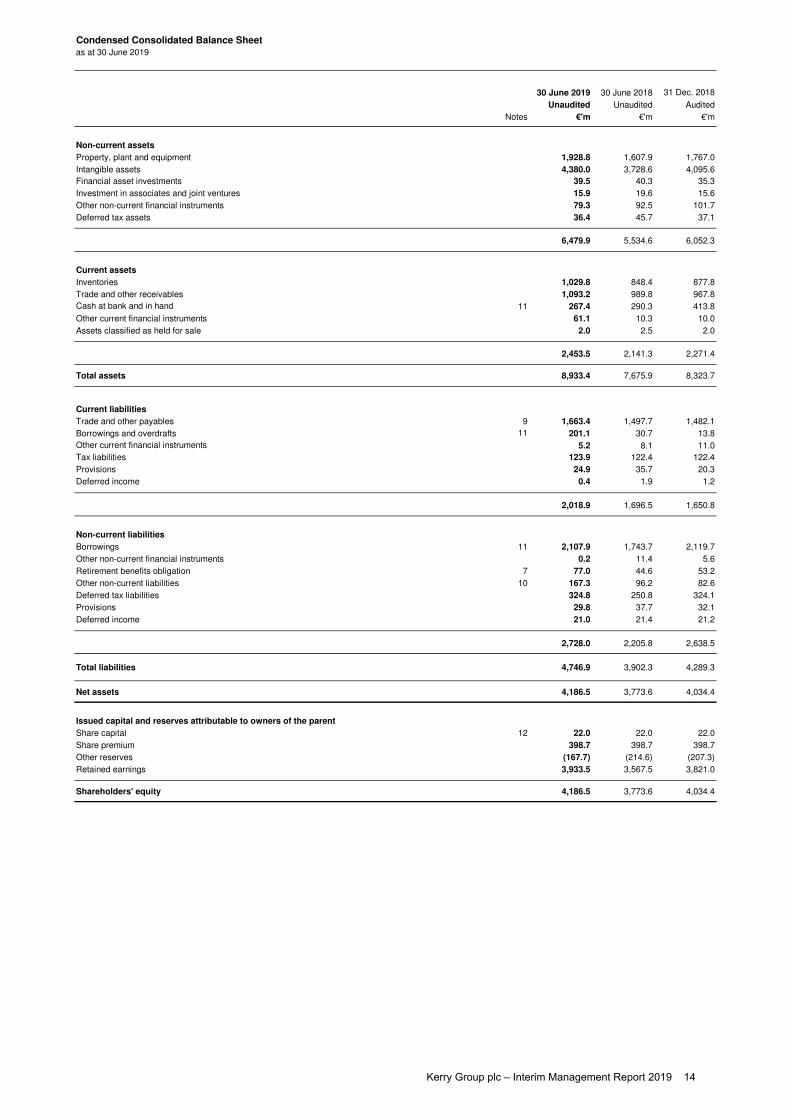
1. Accounting policies
Leasing
Effective Date
- IFRS 16 Leases 1 January 2019
- IFRIC 23 Uncertainty over Income Tax Treatments 1 January 2019
Effective Date
- IFRS 17 Insurance Contracts 1 January 2021
The following Standards and Interpretations are effective for the Group from 1 January 2019 but do not have a material effect on
the results or financial position of the Group:
At the commencement date of the lease, the Group recognises a right-of-use asset and a lease liability on the balance sheet. The right-of-use asset is measured at
cost, which consists of the initial measurement of the lease liability, any initial direct costs incurred by the Group in setting up/entering into the lease, an estimate of
any costs to dismantle and remove the asset at the end of the lease and any payments made in advance of the lease commencement date (net of any incentive
received).
The Group depreciates right-of-use assets on a straight-line basis from the lease commencement date to the earlier of the end of the useful life or the end of the
lease term. The carrying amounts of right-of-use assets are reviewed at each balance sheet date to determine whether there is any indication of impairment. An
impairment loss is recognised when the carrying value of an asset exceeds its recoverable amount.
The Group measures the lease liability at the present value of the lease payments unpaid at that date, discounted using the applicable incremental borrowing rate.
Lease payments included in the measurement of the lease liability comprises of fixed or variable payments (based on an index or rate), amounts expected to be
payable under a residual value guarantee and payments arising from options reasonably certain to be exercised.
Subsequent to the initial measurement, the liability will be reduced for payments made and increased for the interest applied and it is remeasured to reflect any
reassessment or contract modifications. When the lease liability is remeasured, the corresponding adjustment is reflected in the right-of-use asset or in the
Consolidated Income Statement if the right-of-use asset is already reduced to zero.
The Group has elected to record short-term leases of less than 12 months and leases of low-value assets as defined in IFRS 16 as an operating expense in the
Consolidated Income Statement on a straight-line basis over the lease term.
These Condensed Consolidated Interim Financial Statements for the half year ended 30 June 2019 have been prepared in accordance with the requirements of IAS
34 'Interim Financial Reporting' and using accounting policies consistent with International Financial Reporting Standards as adopted by the European Union. The
accounting policies applied by the Group in these Condensed Consolidated Interim Financial Statements are the same as those detailed in the 2018 Annual Report
except for changes in accounting policies in respect of IFRS 16 'Leases' for H1 2019 outlined below:
Critical accounting estimates and judgements - Leasing
The significant judgements made by management in applying the Group's accounting policies and the key source of estimation uncertainty were the same as those
described in the 2018 Annual Report, except for the new judgements and estimation uncertainty related to lessee accounting under IFRS 16, which are described
below.
In determining the incremental borrowing rate for lease contracts/liabilities the Group, where possible, has utilised external benchmarked information and takes into
consideration credit rating, applicable margin for lease by currency, interest rate for the lease term and applies a currency premium where applicable.
The Group has applied judgement to determine the lease term of contracts that include renewal options. If the Group is reasonably certain to exercise such options
this impacts the lease term, which significantly affects the amount of lease liabilities and right-of-use assets recognised.
The Group reassesses these estimates and judgements if a significant event or a significant change in circumstances occurs.
Leases policy applicable before 1 January 2019
Annual rentals payable under operating leases are charged to the Consolidated Income Statement on a straight-line basis over the period of the lease.
The following Standard is not yet effective for the Group and is not expected to have a material effect on the results or financial
position of the Group:
IFRS 16, published in January 2016, replaces the existing standard IAS 17 'Leases'. IFRS 16 eliminates the
classification of leases as either operating leases or finance leases for lessees. It introduces a single lessee
accounting model, which requires a lessee to recognise assets and liabilities for all leases with a term of more
than 12 months with certain exceptions and to recognise depreciation of lease assets separately from interest on
lease liabilities in the income statement.
The Group has adopted IFRS 16 using the modified retrospective approach, under which the cumulative effect of
initial application of €12.1m and a deferred tax asset of €2.7m was recognised in retained earnings at 1 January
2019. Accordingly, the comparative information presented for 2018 has not been restated - i.e. it is presented, as
previously reported, under IAS 17 and related interpretations. Right-of-use assets for property leases were
measured on transition as if the new rules had always been applied. All other right-of-use assets were measured
at the amount of the lease liability on adoption.
As at 31 December 2018, the Group had non-cancellable operating lease commitments of €83.1m and finance
lease commitments of €nil. Of these commitments, approximately €1.0m relate to short-term leases and €0.1m
are low-value leases which will be recognised on a straight-line basis as an expense in the Condensed
Consolidated Income Statement. The Group has recognised right-of-use assets of €95.2m and lease liabilities of
€107.3m on 1 January 2019, the transition date. A reconciliation explaining the difference between the IAS 17
operating lease commitments at year end and the lease liability at the date of transition to IFRS 16 'Leases' has
been included in note 8. The weighted average incremental borrowing rate applied to lease liabilities at the date
of initial application was 6.7%. The Group has also elected not to separate non-lease components from lease
components, and instead account for each lease component and any associated non-lease components as a
single lease component further increasing the lease liability at 1 January 2019.
Kerry Group plc – Interim Management Report 2019 17

Notes to the Condensed Consolidated Interim Financial Statements (continued)for the half year ended 30 June 2019
2. Analysis by business segment
Half year Half year Year
ended ended ended
30 June 2019 30 June 2018 31 Dec. 2018
Unaudited Unaudited Audited
€'m €'m €'m
External revenue
- Taste & Nutrition 2,882.2 2,543.6 5,272.4
- Consumer Foods 686.7 681.7 1,335.2
3,568.9 3,225.3 6,607.6
Inter-segment revenue
- Taste & Nutrition 32.6 35.4 78.2
- Consumer Foods 2.7 3.7 3.8
- Group Eliminations and Unallocated (35.3) (39.1) (82.0)
- - -
Total revenue
- Taste & Nutrition 2,914.8 2,579.0 5,350.6
- Consumer Foods 689.4 685.4 1,339.0
- Group Eliminations and Unallocated (35.3) (39.1) (82.0)
3,568.9 3,225.3 6,607.6
Trading profit
- Taste & Nutrition 388.1 338.9 805.3
- Consumer Foods 48.0 47.8 100.1
- Group Eliminations and Unallocated (53.2) (46.7) (99.8)
382.9 340.0 805.6
Intangible asset amortisation (29.3) (27.6) (53.8)
Non-trading items (42.3) (19.9) (66.9)
Operating profit 311.3 292.5 684.9
Finance income 0.2 0.2 0.5
Finance costs (39.1) (34.0) (67.5)
Profit before taxation 272.4 258.7 617.9
Income taxes (33.0) (32.0) (77.4)
Profit after taxation attributable to owners of the parent 239.4 226.7 540.5
Half year Half year Year
ended ended ended
30 June 2019 30 June 2018 31 Dec. 2018
Unaudited Unaudited Audited
€'m €'m €'m
Revenue by location of external customers
Europe 1,404.4 1,381.6 2,757.0
Americas 1,556.3 1,306.9 2,745.3
APMEA* 608.2 536.8 1,105.3
3,568.9 3,225.3 6,607.6
*Asia Pacific, Middle East and Africa
Information about geographical areas
The Group has determined it has two reportable segments: Taste & Nutrition and Consumer Foods. The Taste & Nutrition segment manufactures and distributes an
innovative portfolio of taste and nutrition solutions and functional ingredients & actives for the global food, beverage and pharmaceutical industries. The Consumer
Foods segment manufactures and supplies added value branded and consumer branded chilled food products to the Irish, UK and selected international markets.
The accounting policies of the reportable segments are the same as those detailed in the Statement of accounting policies in the 2018 Annual Report. Under IFRS 15
'Revenue from Contracts with Customers' revenue is primarily recognised at a point in time. Revenue recorded over time during the period was not material to the
Group.
Kerry Group plc – Interim Management Report 2019 18

Notes to the Condensed Consolidated Interim Financial Statements (continued)
3. Non-trading items
Half year Half year Year
ended ended ended
30 June 2019 30 June 2018 31 Dec. 2018
Unaudited Unaudited Audited
Notes €'m €'m €'m
Acquisition integration and restructuring costs (i) (18.5) (13.7) (44.2)
Consumer Foods Realignment Programme (ii) (25.1) - -
Consumer Foods Brexit Currency Mitigation Programme (iii) - (5.1) (17.3)
Profit/(loss) on disposal of businesses and assets (iv) 1.3 (1.1) (5.4)
(42.3) (19.9) (66.9)
Tax on above (i)-(iv) 8.1 4.5 11.8
(34.2) (15.4) (55.1)
(i) Acquisition integration and restructuring costs
(iv) Profit/(loss) on disposal of businesses and assets
4. Finance income and costs
Half year Half year Year
ended ended ended
30 June 2019 30 June 2018 31 Dec. 2018
Unaudited Unaudited Audited
€'m €'m €'m
0.2 0.2 0.5
(39.7) (32.8) (66.3)
Interest rate derivative 1.0 - 0.2
(38.7) (32.8) (66.1)
(0.4) (1.2) (1.4)
Finance costs (39.1) (34.0) (67.5)
for the half year ended 30 June 2019
(ii) Consumer Foods Realignment Programme
During the period, acquisition integration and restructuring costs of €18.5m (30 June 2018: €13.7m; 31 December 2018: €44.2m) primarily related to costs of integrating
acquisitions into the Group's operations and transaction expenses incurred in completing recent acquisitions. These costs reflect the closure of factories, relocation of
resources and the restructuring of operations in order to integrate the businesses into the existing Kerry operating model. In the period ended 30 June 2019, a tax credit
of €4.2m (30 June 2018: a tax credit of €3.4m; 31 December 2018: a tax credit of €10.1m) arose due to tax deductions available on acquisition integration and
restructuring costs.
(iii) Consumer Foods Brexit Currency Mitigation Programme
The Consumer Foods business commenced a programme in 2019 to simplify its structure and streamline its footprint to grow and outperform in our core markets and
invest and expand into adjacencies. The charge relating to this in 2019 is €25.1m, which reflects redundancies, relocation of resources and the streamlining of
operations. The associated tax credit is €3.6m (30 June 2018: a tax credit of €nil; 31 December 2018: a tax credit of €nil).
Net interest cost on retirement benefits obligation
In 2018, certain sourcing and production activities were relocated and other activities restructured as a consequence of Brexit in order to reduce the Group's sterling
transaction exposure. The charge relating to this in 2019 is €nil (30 June 2018: a charge of €5.1m; 31 December 2018: a charge of €17.3m) and the associated tax
credit is €nil (30 June 2018: a tax credit of €0.9m; 31 December 2018: a tax credit of €2.2m).
The Group disposed of property, plant and equipment primarily in the UK, USA and India for a consideration of €6.4m resulting in a profit of €1.3m during the period.
During 2018, the Group disposed of property, plant and equipment primarily in Italy, Malaysia and the USA for a consideration of €10.6m resulting in a loss of €1.0m. In
2018, the Group disposed of investments in associates for a combined consideration of €1.1m resulting in a loss of €4.4m.
A net tax credit of €0.3m (30 June 2018: a net tax credit of €0.2m; 31 December 2018: a net tax charge of €0.5m) arose on the disposal of businesses and assets.
There were no impairments of assets held for sale recorded in the period.
Finance income:
Interest income on deposits
Finance costs:
Interest payable
Kerry Group plc – Interim Management Report 2019 19

5. Earnings per A ordinary share
EPS
cent €'m
EPS
cent €'m
EPS
cent €'m
Basic earnings per share
Profit after taxation attributable to owners of the parent 135.5 239.4 128.3 226.7 305.9 540.5
Diluted earnings per share
135.4 239.4 128.2 226.7 305.7 540.5
30 June 2019 30 June 2018 31 Dec. 2018
Unaudited Unaudited Audited
Number of Shares m's m's m's
Basic weighted average number of shares 176.7 176.7 176.7
Impact of share options outstanding 0.1 0.1 0.1
Diluted weighted average number of shares 176.8 176.8 176.8
6. Dividends
Half year Half year Year
ended ended ended
30 June 2019 30 June 2018 31 Dec. 2018
Unaudited Unaudited Audited
€'m €'m €'m
86.7 77.4 77.4
- - 37.0
86.7 77.4 114.4
7. Retirement benefits obligation
Half year Half year Year
ended ended ended
30 June 2019 30 June 2018 31 Dec. 2018
Unaudited Unaudited Audited
€'m €'m €'m
Net recognised deficit in plans before deferred tax (77.0) (44.6) (53.2)
Net related deferred tax asset 12.6 9.2 9.2
Net recognised deficit in plans after deferred tax (64.4) (35.4) (44.0)
Amounts recognised as distributions to equity shareholders in the period
Interim 2018 dividend of 21.00 cent per A ordinary share paid 16 November 2018
The net deficit recognised in the Condensed Consolidated Balance Sheet for the Group's defined benefit post-retirement schemes was as follows:
Final 2018 dividend of 49.20 cent per A ordinary share paid 10 May 2019
(Final 2017 dividend of 43.90 cent per A ordinary share paid 18 May 2018)
Since the end of the period, the Board has proposed an interim dividend of 23.50 cent per A ordinary share which amounts to €41.5m. The payment date for the
interim dividend will be 15 November 2019 to shareholders registered on the record date as at 18 October 2019. These Condensed Consolidated Interim Financial
Statements do not reflect this dividend.
At 30 June 2019, the net deficit before deferred tax for defined benefit post-retirement schemes was €77.0m (30 June 2018: €44.6m; 31 December 2018: €53.2m).
This was calculated by rolling forward the defined benefit post-retirement schemes' liabilities at 31 December 2018 to reflect material movements in underlying
assumptions over the period while the defined benefit post-retirement schemes' assets at 30 June 2019 are measured at market value. The increase in the net deficit
before deferred tax of €23.8m was driven primarily by adverse movements in discount rates.
Unaudited Audited
Notes to the Condensed Consolidated Interim Financial Statements (continued)for the half year ended 30 June 2019
Profit after taxation attributable to owners of the parent
30 June 2019 30 June 2018 31 Dec. 2018
Unaudited
Half year
ended
Year
ended
Half year
ended
Kerry Group plc – Interim Management Report 2019 20

Notes to the Condensed Consolidated Interim Financial Statements (continued)
for the half year ended 30 June 2019
8. Leasing
i) Right-of-use assets
i.i) Property, plant and equipment analysis
Property, plant and equipment
Right-of-use assets*
*The Group have applied the modified retrospective transition approach and have not restated comparative amounts for the periods prior to first adoption.
i.ii) Right-of-use assets analysis
Land and
Buildings Total
€'m €'m
Cost
At 31 December 2018 - -
Adjustment on initial application of IFRS 16 'Leases' at 1 January 2019 71.3 95.2
Businesses acquired 0.3 0.3
Additions 16.5 19.8
At 30 June 2019 - unaudited 88.1 115.3
Accumulated depreciation
At 31 December 2018 - -
Charge during the financial period 10.5 16.4
At 30 June 2019 - unaudited 10.5 16.4
Carrying value
At 1 January 2019 - unaudited 71.3 95.2
At 30 June 2019 - unaudited 77.6 98.9
The right-of-use assets above consist of:
-
-
-
ii) Lease disclosures
ii.i) Amounts recognised in the Condensed Consolidated Income Statement: Half year
ended
30 June 2019
Unaudited
€'m
Depreciation charged during the financial period 16.4
Expenses relating to short-term leases 1.2
Expenses relating to leases of low-value assets, excluding short-term leases of low-value assets 0.1
Interest on lease liabilities*:
- on transition to IFRS 16 2.3
- 2019 additions 0.7
*included in interest payable
2.7
-
land and buildings for warehouse space, offices and manufacturing locations. The lease terms vary and range from 1 to 94 years with an average of 8 years for
buildings and an average of 55 years for land;
motor vehicles for management and sales functions and trucks for distribution in specific businesses. The lease terms for motor vehicles range from 1 to 8 years with
an average of 4 years.
machinery, equipment, tools, furniture and other equipment when combined are insignificant to the total leased assets portfolio and have an average lease term of 4 to
5 years; and
3.2
At 1 January 2019, on transition to IFRS 16, the Group recognised right-of-use assets of €95.2m and lease liabilities of €107.3m. The Group recorded the difference of
€12.1m and the related deferred tax asset of €2.7m in retained earnings.
3.2
10.7
11.8
2.7
12.1
10.6
Motor
Vehicles
€'m
-
12.1
-
1.7
13.8
-
13.4
1.6
-
11.8
-
€'m
Equipment
and
Machinery
Plant,
30 June 2019
ended
Half year
1,928.8
98.9
1,829.9
€'m
Unaudited
Kerry Group plc – Interim Management Report 2019 21

Notes to the Condensed Consolidated Interim Financial Statements (continued)
for the half year ended 30 June 2019
8. Leasing (continued)
ii) Lease disclosures (continued)
ii.ii) Amounts recognised in the Condensed Consolidated Statement of Cash Flows: Half year
ended
30 June 2019
Unaudited
€'m
Total cash outflow for leases during the period* 21.4
*includes interest expense, principle repayments of lease liabilities and short-term and low-value lease expenses
ii.iii) At the balance sheet date the Group had commitments under non-cancellable leases which fall due as follows: Half year
ended
30 June 2019
Unaudited
€'m
Within 1 year 30.4
Within 2 to 5 years 56.3
After 5 years 23.5
110.2
iii) Reconciliation of IAS 17 lease commitments and IFRS 16 lease liability
€'m
Future minimum lease payments under non-cancellable operating leases as at 31 December 2018 83.1
- additional leases identified for acquisitions as part of the measurement period 6.2
- future lease payments on renewal options that are reasonably certain 26.7
- non-lease components 14.3
- future lease payments on short-term leases (1.0)
- future lease payments on low-value leases (0.1)
Total future lease payments 129.2
Effect of discounting (21.9)
Lease liability at 1 January 2019 - unaudited 107.3
9. Trade and other payables
Half year Half year Year
ended ended ended
30 June 2019 30 June 2018 31 Dec. 2018
Unaudited Unaudited Audited
€'m €'m €'m
Trade payables 1,255.2 1,030.2 1,285.9
Other payables and accruals 370.8 456.8 186.1
Lease liabilities 30.4 - -
Deferred payments on acquisition of businesses 7.0 10.7 10.1
1,663.4 1,497.7 1,482.1
10. Other non-current liabilities
Half year Half year Year
ended ended ended
30 June 2019 30 June 2018 31 Dec. 2018
Unaudited Unaudited Audited
€'m €'m €'m
Other payables and accruals 87.5 96.2 82.6
Lease liabilities 79.8 - -
167.3 96.2 82.6
All of the above balances are due within 2 to 5 years except for lease liabilities; analysis of lease liabilities is included in note 8.
Kerry Group plc – Interim Management Report 2019 22

Notes to the Condensed Consolidated Interim Financial Statements (continued)
for the half year ended 30 June 2019
11. Financial instruments
Liabilities Derivatives
Financial Assets/ at Fair Value Designated as Assets/
(Liabilities) at through Hedging (Liabilities) at
Amortised Cost Profit or Loss Instruments FVOCI Total
€'m €'m €'m €'m €'m
Assets:
Interest rate swaps - - 123.4 - 123.4
Cash at bank and in hand 267.4 - - - 267.4
267.4 - 123.4 - 390.8
Liabilities:
Interest rate swaps - - - - -
Bank overdrafts (16.6) - - - (16.6)
Bank loans (499.9) - - - (499.9)
Senior notes (1,763.0) (29.5) - - (1,792.5)
Borrowings and overdrafts (2,279.5) (29.5) - - (2,309.0)
(2,279.5) (29.5) - - (2,309.0)
At 30 June 2019 - unaudited (2,012.1) (29.5) 123.4 - (1,918.2)
Assets:
Interest rate swaps - - 92.2 - 92.2
Cash at bank and in hand 290.3 - - - 290.3
290.3 - 92.2 - 382.5
Liabilities:
Interest rate swaps - - (11.4) - (11.4)
Bank overdrafts (30.7) - - - (30.7)
Bank loans - - - - -
Senior notes (1,737.9) (5.8) - - (1,743.7)
Borrowings and overdrafts (1,768.6) (5.8) - - (1,774.4)
(1,768.6) (5.8) (11.4) - (1,785.8)
At 30 June 2018 - unaudited (1,478.3) (5.8) 80.8 - (1,403.3)
Assets:
Interest rate swaps - - 101.7 - 101.7
Cash at bank and in hand 413.8 - - - 413.8
413.8 - 101.7 - 515.5
Liabilities:
Interest rate swaps - - (5.5) - (5.5)
Bank overdrafts (9.9) - - - (9.9)
Bank loans (355.4) - - - (355.4)
Senior notes (1,755.0) (13.2) - - (1,768.2)
Borrowings and overdrafts (2,120.3) (13.2) - - (2,133.5)
(2,120.3) (13.2) (5.5) - (2,139.0)
At 31 December 2018 - audited (1,706.5) (13.2) 96.2 - (1,623.5)
Part of the Group's debt portfolio includes US$750m of senior notes issued in 2013 and US$408m of senior notes issued in 2010. At the time of issuance US$250m of the
2013 senior notes and US$500m of the 2010 US$600m senior notes were swapped, using cross currency swaps, to euro. US$192m of the 2010 senior notes were repaid in
January 2017 and the related swaps matured at that date. In addition, the Group holds €750m of senior notes issued in 2015, of which €175m were swapped, using cross
currency swaps, to US dollar.
The adjustment to senior notes classified under liabilities at fair value through profit or loss of €29.5m (30 June 2018: €5.8m; 31 December 2018: €13.2m) represents the
part adjustment to the carrying value of debt from applying fair value hedge accounting for interest rate risk. This amount is primarily offset by the fair value adjustment on the
corresponding hedge items being the underlying cross currency interest rate swaps.
i) The following table outlines the financial assets and liabilities in relation to net debt held by the Group at the balance sheet date:
All Group borrowings are guaranteed by Kerry Group plc. No assets of the Group have been pledged to secure the borrowings.
Kerry Group plc – Interim Management Report 2019 23

Notes to the Condensed Consolidated Interim Financial Statements (continued)for the half year ended 30 June 2019
11. Financial instruments (continued)
Total Pre CCS Impact of CCS Total after CCS
Half year ended Half year ended Half year ended Half year ended Year ended
30 June 2019 30 June 2019 30 June 2019 30 June 2018 31 Dec. 2018
Unaudited Unaudited Unaudited Unaudited Audited
€'m €'m €'m €'m €'m
Euro (1,105.0) (404.0) (1,509.0) (1,018.3) (1,336.3)
Sterling 47.0 - 47.0 86.0 50.9
US Dollar (902.3) 404.0 (498.3) (524.3) (402.4)
Other 42.1 - 42.1 53.3 64.3
(1,918.2) - (1,918.2) (1,403.3) (1,623.5)
On demand & Up to
up to 1 year 2 years 2 - 5 years > 5 years Total
€'m €'m €'m €'m €'m
Cash at bank and in hand 267.4 - - - 267.4
Interest rate swaps 44.2 - 44.9 34.3 123.4
Bank overdrafts (16.6) - - - (16.6)
Bank loans - (1.4) (498.5) - (499.9)
Senior notes (184.5) - (775.1) (832.9) (1,792.5)
At 30 June 2019 - unaudited 110.5 (1.4) (1,228.7) (798.6) (1,918.2)
Cash at bank and in hand 290.3 - - - 290.3
Interest rate swaps - 40.0 14.2 26.6 80.8
Bank overdrafts (30.7) - - - (30.7)
Bank loans - - - - -
Senior notes - (181.3) (743.9) (818.5) (1,743.7)
At 30 June 2018 - unaudited 259.6 (141.3) (729.7) (791.9) (1,403.3)
Cash at bank and in hand 413.8 - - - 413.8
Interest rate swaps - 42.8 28.0 25.4 96.2
Bank overdrafts (9.9) - - - (9.9)
Bank loans (3.9) (1.5) (350.0) - (355.4)
Senior notes - (183.5) (760.8) (823.9) (1,768.2)
At 31 December 2018 - audited 400.0 (142.2) (1,082.8) (798.5) (1,623.5)
a) Fair value of financial instruments carried at fair value
-
-
-
30 June 2019 30 June 2018 31 Dec. 2018
Fair Value Unaudited Unaudited Audited
Hierarchy €'m €'m €'m
Financial assets
Interest rate swaps: Non-current Level 2 79.2 92.2 101.7
Current Level 2 44.2 - -
Forward foreign exchange contracts: Non-current Level 2 0.1 0.3 -
Current Level 2 16.9 10.3 10.0
Financial asset investments: Fair value through profit or loss Level 1 34.2 33.1 30.0
Level 3 5.3 7.2 5.3
Financial liabilities
Interest rate swaps: Non-current Level 2 - (11.4) (5.5)
Forward foreign exchange contracts: Non-current Level 2 (0.2) - (0.1)
Current Level 2 (5.2) (8.1) (11.0)
ii) The Group's exposure to interest rates on financial assets and liabilities are detailed in the table below including the impact of cross currency swaps (CCS) on the
currency profile of net debt:
iv) Fair value of financial instruments
iii) The following table details the maturity profile of the Group's net debt:
At 30 June 2019, the Group had undrawn committed bank facilities of €600m, comprising primarily of a revolving credit facility maturing in 2024.
During the period, the Group agreed a new 5 year €1.1bn revolving credit facility maturing in June 2024 replacing the existing facility which was due to mature in
April 2022. The facility includes two 1-year extension options which may only be exercised on the 1st
and 2nd
anniversary. If both were exercised this would extend
maturity to June 2026. The new facility incorporates a margin adjustment linked to achievement of certain sustainability metrics.
quoted prices in active markets for identical assets or liabilities (Level 1);
Financial instruments recognised at fair value are analysed between those based on:
those involving inputs other than quoted prices included in Level 1 that are observable for the assets or liabilities, either directly (as prices) or indirectly (derived
from prices) (Level 2); and
There have been no transfers between levels during the current or prior financial period.
Fair value through other
comprehensive income
those involving inputs for the assets or liabilities that are not based on observable market data (unobservable inputs) (Level 3).
Kerry Group plc – Interim Management Report 2019 24

Notes to the Condensed Consolidated Interim Financial Statements (continued)for the half year ended 30 June 2019
11. Financial instruments (continued)
b) Fair value of financial instruments carried at amortised cost
Carrying Fair Carrying Fair Carrying Fair
Amount Value Amount Value Amount Value
30 June 2019 30 June 2019 30 June 2018 30 June 2018 31 Dec. 2018 31 Dec. 2018
Fair Value Unaudited Unaudited Unaudited Unaudited Audited Audited
Hierarchy €'m €'m €'m €'m €'m €'m
Financial liabilities
Senior notes - Public Level 2 (1,404.0) (1,465.6) (1,387.3) (1,382.9) (1,398.6) (1,377.0)
Senior notes - Private Level 2 (359.0) (376.9) (350.6) (355.3) (356.4) (358.8)
(1,763.0) (1,842.5) (1,737.9) (1,738.2) (1,755.0) (1,735.8)
c) Valuation principles
The fair value of financial assets and liabilities are determined as follows:
-
-
-
-
Net debt reconciliation
Cash at bank
and in hand
Interest Rate
Swaps
Overdrafts
due within
1 year
Borrowings
due within
1 year
Borrowings
due after
1 year Net debt
€'m €'m €'m €'m €'m €'m
At 31 December 2017 - audited 312.5 87.5 (6.9) (6.4) (1,728.4) (1,341.7)
Cash flows (23.1) - (24.6) 6.5 (0.6) (41.8)
Foreign exchange adjustments 0.9 0.4 0.8 (0.1) (17.8) (15.8)
Other non-cash movements - (7.1) - - 3.1 (4.0)
At 30 June 2018 - unaudited 290.3 80.8 (30.7) - (1,743.7) (1,403.3)
Cash flows 125.0 - 20.8 (4.0) (352.1) (210.3)
Foreign exchange adjustments (1.5) 0.2 - 0.1 (10.1) (11.3)
Other non-cash movements - 15.2 - - (13.8) 1.4
At 31 December 2018 - audited 413.8 96.2 (9.9) (3.9) (2,119.7) (1,623.5)
Cash flows (148.8) - (6.6) 3.9 (148.9) (300.4)
Foreign exchange adjustments 2.4 - (0.1) - (4.5) (2.2)
Other non-cash movements - 27.2 - (184.5) 165.2 7.9
At 30 June 2019 - unaudited 267.4 123.4 (16.6) (184.5) (2,107.9) (1,918.2)
Net debt is a non-IFRS financial measure however it is included as management determined it is a useful indicator of the Group's ability to meet financial commitments and
invest in new strategic opportunities.
Except as defined in the following table, it is considered that the carrying amounts of financial assets and financial liabilities recognised at amortised cost in the Condensed
Consolidated Interim Financial Statements approximate their fair values.
the fair values of financial instruments that are not based on observable market data (unobservable inputs) requires entity specific valuation techniques; and
assets and liabilities with standard terms and conditions and traded on active liquid markets are determined with reference to quoted market prices. This includes equity
investments;
other financial assets and liabilities (excluding derivatives) are determined in accordance with generally accepted pricing models based on discounted cash flow
analysis using prices from observable current market transactions and dealer quotes for similar instruments. This includes interest rate swaps and forward foreign
exchange contracts which are determined by discounting the estimated future cash flows;
derivative financial instruments are calculated using quoted prices. Where such prices are not available, a discounted cash flow analysis is performed using the
applicable yield curve for the duration of the instruments. Forward foreign exchange contracts are measured using quoted forward exchange rates and yield curves
derived from quoted interest rates adjusted for counterparty credit risk, which is calculated based on credit default swaps of the respective counterparties. Interest rate
swaps are measured at the present value of future cash flows estimated and discounted based on the applicable yield curves derived from quoted interest rates
adjusted for counterparty credit risk which is calculated based on credit default swaps of the respective counterparties.
Kerry Group plc – Interim Management Report 2019 25

Notes to the Condensed Consolidated Interim Financial Statements (continued)for the half year ended 30 June 2019
12. Share capital
Half year Half year Year
ended ended ended
30 June 2019 30 June 2018 31 Dec. 2018
Unaudited Unaudited Audited
€'m €'m €'m
Authorised
280,000,000 A ordinary shares of 12.50 cent each 35.0 35.0 35.0
Allotted, called-up and fully paid (A ordinary shares of 12.50 cent each)
At beginning of the financial period 22.0 22.0 22.0
Shares issued during the financial period - - -
At end of the financial period 22.0 22.0 22.0
Kerry Group plc has one class of ordinary share which carries no right to fixed income.
Shares issued during the period
The total number of shares in issue at 30 June 2019 was 176,477,146 (30 June 2018: 176,287,141; 31 December 2018: 176,298,416).
13. Business combinations
During the period, the Group completed a total of three acquisitions, all of which are 100% owned by the Group.
Acquired Principal activity
January
March
March
14.
15.
During the period a total of 178,730 A ordinary shares each with a nominal value of 12.50 cent, were issued at nominal value per share under the Long Term Incentive
Plan and Short Term Incentive Plans.
Southeastern Mills, located in the USA, is a leading food manufacturer specialising in coating and
seasoning systems.
Acquisition
Southeastern Mills
Ariake U.S.A., Inc.
Muskvale Flavours & Fragrances
Ariake is an integrated natural seasonings manufacturer, based in the USA.
Muskvale Flavours & Fragrances, based in Australia, creates and sells flavours and fragrances.
The total consideration for these acquisitions was €327.2m, net of cash acquired of €3.2m resulting in a cash outflow of €324.0m. There was no deferred element
recognised. Transaction expenses related to these acquisitions were charged against non-trading items in the Group's Condensed Consolidated Income Statement
during the period and represented less than one percent of the total consideration.
The provisional fair value of net assets acquired before combination were €229.6m and the Group recognised goodwill on these acquisitions of €97.6m. Given that the
valuation of the fair value of assets and liabilities recently acquired is still in progress, these values are determined provisionally. The goodwill is attributable to the
expected profitability, revenue growth, future market development and assembled workforce of the acquired businesses and the synergies expected to arise within the
Group after the acquisitions. €97.6m of goodwill recognised is expected to be deductible for income tax purposes.
The acquisition method of accounting has been used to consolidate the businesses acquired in the Group's Condensed Consolidated Interim Financial Statements.
Due to the fact that these acquisitions were recently completed, the revenue and results included in the Group's reported figures are not material. For the acquisitions
completed in 2018, to date, there have been no material revisions of the provisional fair value adjustments since the initial values were established.
These unaudited Condensed Consolidated Interim Financial Statements for the half year ended 30 June 2019 are not full financial statements and were not reviewed
by the auditors. The Board of Directors approved these Condensed Consolidated Interim Financial Statements on 7 August 2019. The figures disclosed relating to 31
December 2018 have been derived from the consolidated financial statements which were audited, received an unqualified audit report and have been filed with the
Registrar of Companies. This report should be read in conjunction with the 2018 Annual Report which was prepared in accordance with International Financial
Reporting Standards (IFRS) and the International Financial Reporting Interpretations Committee (IFRIC) and those parts of the Companies Act 2014 applicable to
companies reporting under IFRS. The Group financial statements have also been prepared in accordance with IFRS adopted by the European Union ('EU') which
comprise standards and interpretations approved by the International Accounting Standards Board ('IASB'). The Group financial statements comply with Article 4 of the
EU IAS Regulation. IFRS adopted by the EU differs in certain respects from IFRS issued by the IASB. References to IFRS refer to IFRS adopted by the EU.
These unaudited Condensed Consolidated Interim Financial Statements have been prepared on the going concern basis of accounting. The Directors report that they
have satisfied themselves that the Group is a going concern, having adequate resources to continue in operational existence for the foreseeable future. In forming this
view, the Directors have reviewed the Group’s budget for a period not less than 12 months, the medium term plans as set out in the rolling five year plan, and have
taken into account the cash flow implications of the plans, including proposed capital expenditure, and compared these with the Group’s committed borrowing facilities
and projected gearing ratios.
The Group performs quantitative and qualitative assessments of each acquisition in order to determine whether it is material for the purposes of separate disclosure
under IFRS 3 'Business Combinations'. None of the acquisitions completed during the period were considered sufficiently material to warrant separate disclosure.
In relation to seasonality, trading profit is lower in the first half of the year due to the nature of the food business and stronger trading in December. While revenue is
relatively evenly spread, margin has traditionally been higher in the second half of the year due to product mix and the timing of promotional activity. There is also a
material change to the levels of working capital between December and June mainly due to the seasonal nature of the dairy and crop-based businesses.
As permitted by the Transparency (Directive 2004/109/EC) Regulations 2007 this Interim Report is available on www.kerrygroup.com. However, if a physical copy is
required, please contact the Corporate Affairs department.
General information
Events after the Balance Sheet date
Since the period end, the Group has proposed an interim dividend of 23.50 cent per A ordinary share (see note 6).
There have been no other significant events, outside of the ordinary course of business, affecting the Group since 30 June 2019.
Kerry Group plc – Interim Management Report 2019 26

FINANCIAL DEFINITIONS
1. Revenue
Volume growth
Revenue Reconciliation
H1 2019
Volume
growth Price
Transaction
currency
Acquisitions/
Disposals
Translation
currency
Reported
revenue
growth
Taste & Nutrition 3.8% - - 5.9% 3.3% 13.0%
Consumer Foods 0.6% (0.3%) - - 0.3% 0.6%
Group 3.3% - - 4.7% 2.7% 10.7%
H1 2018
Taste & Nutrition 4.1% 0.6% 0.0% 4.6% (7.9%) 1.4%
Consumer Foods 1.3% 0.9% (0.4%) 1.0% (1.6%) 1.2%
Group 3.6% 0.6% (0.1%) 3.9% (6.6%) 1.4%
2. EBITDA
H1 2019 H1 2018
€'m €'m
239.4 226.7
(0.2) (0.2)
39.1 34.0
33.0 32.0
42.3 19.9
29.3 27.6
Depreciation (including impairment) 94.0 66.8
EBITDA 476.9 406.8
3. Trading Profit
H1 2019 H1 2018
€'m €'m
Operating profit 311.3 292.5
Intangible asset amortisation 29.3 27.6
Non-trading items 42.3 19.9
Trading profit 382.9 340.0
4. Trading Margin
H1 2019 H1 2018
€'m €'m
Trading profit 382.9 340.0
Revenue 3,568.9 3,225.3
Trading margin 10.7% 10.5%
5. Operating Profit
H1 2019 H1 2018
€'m €'m
Profit before tax 272.4 258.7
Finance income (0.2) (0.2)
Finance costs 39.1 34.0
Operating profit 311.3 292.5
Intangible asset amortisation
Income taxes
Non-trading items
Profit after taxation attributable to owners of the parent
Volume growth is an important metric as it is seen as the key driver of top-line business improvement. This is used as the key revenue metric, as Kerry
operates a pass-through pricing model with its customers to cater for raw material price fluctuations. Pricing therefore impacts like-for-like revenue
growth positively or negatively depending on whether raw material prices move up or down. A full reconciliation to reported revenue growth is detailed
in the revenue reconciliation below.
This represents the sales growth year-on-year, excluding pass-through pricing on raw material costs, currency impacts, acquisitions (net of disposals)
and rationalisation volumes.
EBITDA represents profit before finance income and costs, income taxes, depreciation (including impairment), intangible asset amortisation and non-
trading items.
Finance income
Finance costs
Trading profit refers to the operating profit generated by the businesses before intangible asset amortisation and gains or losses generated from non-
trading items. Trading profit represents operating profit before specific items that are not reflective of underlying trading performance and therefore
hinder comparison of the trading performance of the Group’s businesses, either year-on-year or with other businesses.
Trading margin represents trading profit, expressed as a percentage of revenue.
Operating profit is profit before income taxes, finance income and finance costs.
Kerry Group plc – Interim Management Report 2019 27

6. Adjusted Earnings Per Share and Growth in Adjusted Earnings Per Share on a Constant Currency Basis
H1 2019 H1 2018
EPS EPS
cent cent
Basic earnings per share 135.5 128.3
Brand related intangible asset amortisation 9.3 7.2
Non-trading items (net of related tax) 19.3 8.7
Adjusted earnings per share 164.1 144.2
Impact of retranslating prior period adjusted earnings per share at current period average exchange rates - 7.2
Adjusted earnings per share on a constant currency basis 164.1 151.4
Growth in adjusted earnings per share on a constant currency basis 8.4% 9.0%
7. Free Cash Flow
H1 2019 H1 2018
€'m €'m
243.3 259.8
56.2 37.3
29.3 17.3
(123.8) (122.4)
Payment of lease liabilities (17.1) -
6.4 8.3
- 0.2
0.5 0.1
Free cash flow 194.8 200.6
8. Cash Conversion
Cash conversion is defined as free cash flow, expressed as a percentage of adjusted earnings after tax.
H1 2019 H1 2018
€'m €'m
Free cash flow 194.8 200.6
Profit after taxation attributable to owners of the parent 239.4 226.7
Brand related intangible asset amortisation 16.4 12.7
Non-trading items (net of related tax) 34.2 15.4
Adjusted earnings after tax 290.0 254.8
Cash Conversion 67% 79%
9. Financial Ratios
H1 2019 H1 2018
Covenant Times Times
Net debt: EBITDA Maximum 3.5 1.9 1.5
EBITDA: Net interest Minimum 4.0 (30 June 2018: 4.75) 14.4 14.8
10. Net Debt
The Net debt: EBITDA and EBITDA: Net interest ratios disclosed are calculated in accordance with lenders' facility agreements using an adjusted
EBITDA, adjusted finance costs (net of finance income) and an adjusted net debt value to adjust for the impact of non-trading items, acquisitions net of
disposals and deferred payments in relation to acquisitions. As outlined on page 174 of the 2018 Annual Report these ratios are calculated in
accordance with lenders' facility agreements and these agreements specifically require these adjustments in the calculation.
Net cash from operating activities
The growth in adjusted earnings per share on a constant currency basis is provided as it is considered more reflective of the Group’s underlying trading
performance. Adjusted earnings is profit after taxation attributable to owners of the parent before brand related intangible asset amortisation and non-
trading items (net of related tax). These items are excluded in order to assist in the understanding of underlying earnings. A full reconciliation of
adjusted earnings per share to basic earnings per share is provided below. Constant currency eliminates the translational effect that arises from
changes in foreign currency year-on-year. The growth in adjusted earnings per share on a constant currency basis is calculated by comparing current
year adjusted earnings per share, to the prior year adjusted earnings per share retranslated at current year average exchange rates.
Free cash flow is trading profit plus depreciation, movement in average working capital, capital expenditure, payment of lease liabilities, pension costs
less pension expense, finance costs paid (net) and income taxes paid.
Free cash flow is seen as an important indicator of the strength and quality of the business and of the availability to the Group of funds for reinvestment
or for return to shareholders. Movement in average working capital is used when calculating free cash flow as management believes this provides a
more accurate measure of the increase or decrease in working capital needed to support the business over the course of the period rather than at two
distinct points in time and more accurately reflects fluctuations caused by seasonality and other timing factors. Average working capital is the sum of
each month's working capital over 12 months. Below is a reconciliation of free cash flow to the nearest IFRS measure, which is 'Net cash from
operating activities'.
Expenditure on acquisition integration and restructuring costs
Capital grants received
Exchange translation adjustment
Purchase of assets (net)
Proceeds from the sale of property, plant and equipment
Net debt comprises of borrowings and overdrafts, derivative financial instruments and cash at bank and in hand. See full reconciliation of net debt in
note 11 of these Condensed Consolidated Interim Financial Statements.
Difference between movement in monthly average working capital and movement in the period end working capital
Kerry Group plc – Interim Management Report 2019 28

11. Average Capital Employed
H1 2019 2018 H1 2018 2017 H1 2017
€'m €'m €'m €'m €'m
Shareholders' funds 4,186.5 4,034.4 3,773.6 3,573.2 3,250.4
Goodwill amortised (pre conversion to IFRS) 527.8 527.8 527.8 527.8 527.8
Adjusted equity 4,714.3 4,562.2 4,301.4 4,101.0 3,778.2
Net debt 1,918.2 1,623.5 1,403.3 1,341.7 1,221.7
Total 6,632.5 6,185.7 5,704.7 5,442.7 4,999.9
Average capital employed 6,174.3 5,777.7 5,382.4
12. Return on Average Capital Employed (ROACE)
12 months to 12 months to
H1 2019 H1 2018 FY 2018
€'m €'m €'m
Profit after tax attributable to owners of the parent 553.2 590.1 540.5
Non-trading items (net of tax) 73.9 (12.6) 55.1
Brand related intangible asset amortisation 32.5 25.6 28.8
Net finance costs 72.1 65.0 67.0
Adjusted profit 731.7 668.1 691.4
Average capital employed 6,174.3 5,382.4 5,777.7
Return on average capital employed 11.9% 12.4% 12.0%
Average capital employed is calculated by taking an average of the shareholders' funds and net debt over the last three reported balance sheets plus
an additional €527.8m relating to goodwill written off to reserves pre conversion to IFRS.
This measure is defined as profit after tax attributable to owners of the parent before non-trading items (net of related tax), brand related intangible
asset amortisation and finance income and costs expressed as a percentage of average capital employed.
Kerry Group plc – Interim Management Report 2019 29

Kerry GroupPrince’s StreetTraleeCo. KerryIreland
T:+ 353 66 718 2000F:+ 353 66 718 2961
www.kerrygroup.com
Kerry Group mark


![Kerry Group[1]](https://img.pdfslide.us/doc/110x75/577d24331a28ab4e1e9bda48/kerry-group1.jpg)