Embed Size (px)
Citation preview
Candidates answer on the Question Paper.A calculator may be used for this paper.
OCR SUPPLIED MATERIALS:Periodic table
OTHER MATERIALS REQUIRED:PencilRuler (cm/mm)
DC (SLM/CGW) 4115471353 97128/1© OCR 2014 [D/601/6476]
READ INSTRUCTIONS OVERLEAF
Candidateforename
Centrenumber
Candidatenumber
Candidatesurname
OXFORD CAMBRIDGE AND RSA EXAMINATIONSGCSE
B742/02GATEWAY SCIENCE CHEMISTRY B
Chemistry modules C4, C5, C6(Higher Tier)
MONDAY 16 JUNE 2014: MorningDURATION: 1 hour 30 minutes
plus your additional time allowance
MODIFIED ENLARGED
2
INSTRUCTIONS TO CANDIDATES
Write your name, centre number and candidate number in the boxes on the first page. Please write clearly and in capital letters.
Use black ink. HB pencil may be used for graphs and diagrams only.
Answer ALL the questions.
Read each question carefully. Make sure you know what you have to do before starting your answer.
Write your answer to each question in the space provided. Additional paper may be used if necessary but you must clearly show your candidate number, centre number and question number(s).
INFORMATION FOR CANDIDATES
The quality of written communication is assessed in questions marked with a pencil ( ).
The number of marks is given in brackets [ ] at the end of each question or part question.
The total number of marks for this paper is 85.
Any blank pages are indicated.

3
BLANK PAGE

4
Answer ALL the questions.
SECTION A – Module C4
1 Look at the table. It shows information about the Group 1 metals.
Element Symbol Electronic structure
Melting point in
°C
Boiling point in °C
Atomic radius in nm
lithium Li 2.1 181 1342 0.152
sodium Na 2.8.1 883 0.185
potassium K 2.8.8.1 64 760 0.227
rubidium Rb 2.8.18.8.1 39 688
(a) Predict the melting point of sodium and the atomic radius of rubidium.
Write your answers in the table. [2]
(b) Sodium reacts with water.
Sodium hydroxide, NaOH, and hydrogen, H2, are made.
Write a BALANCED SYMBOL equation for this reaction.
________________________________________ [2]
(c) The Group 1 elements all react in a similar way.
Explain why.
__________________________________________
________________________________________ [1]
5
(d) Sodium reacts with fluorine. Sodium ions and fluoride ions are made.
The electronic structure of fluorine is 2.7.
Draw a ‘dot and cross’ diagram to show the electronic structure of a sodium ion and of a fluoride ion. Include the charges on the ions.
[2]
[TOTAL: 7]
6
2 This question is about atomic structure and bonding.
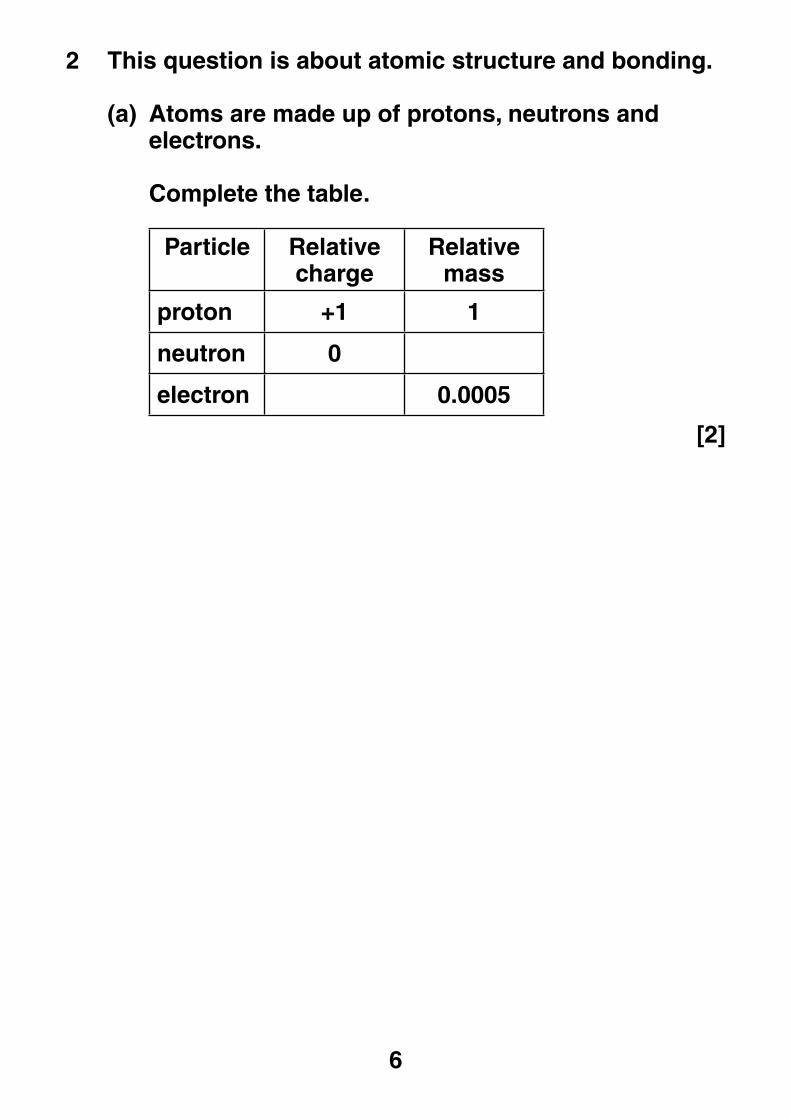
(a) Atoms are made up of protons, neutrons and electrons.
Complete the table.
Particle Relative charge
Relative mass
proton +1 1
neutron 0
electron 0.0005
[2]
7
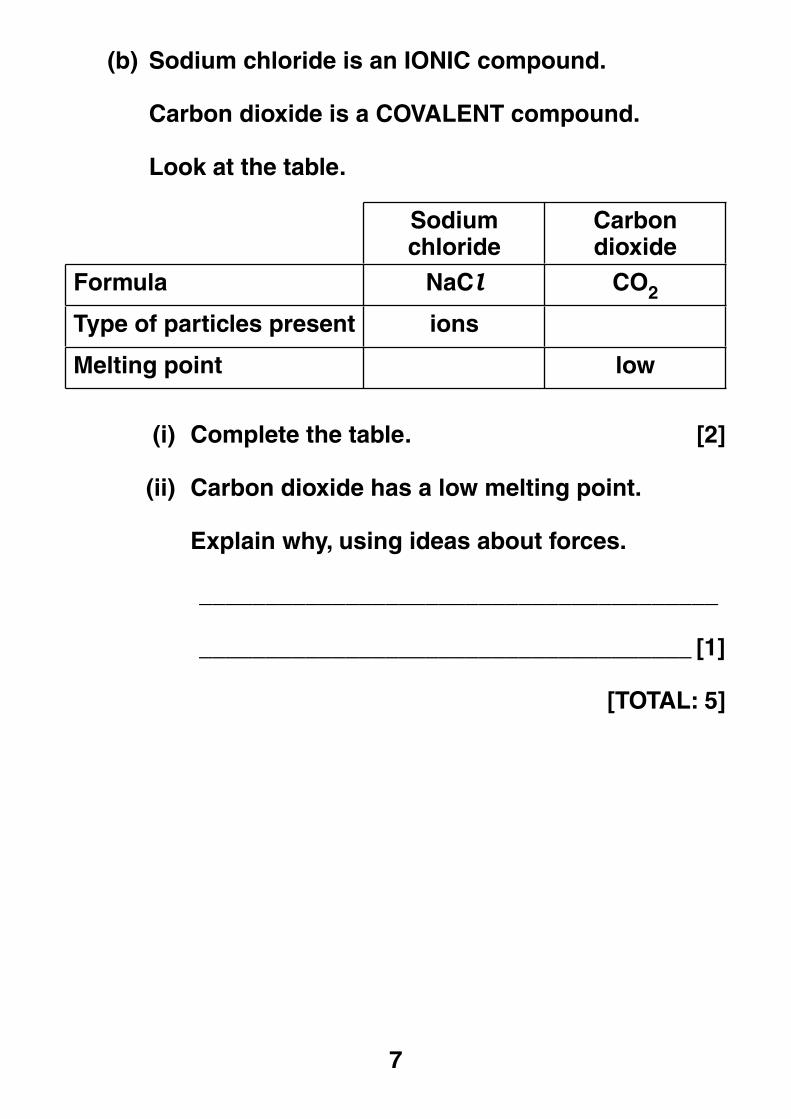
(b) Sodium chloride is an IONIC compound.
Carbon dioxide is a COVALENT compound.
Look at the table.
Sodium chloride
Carbon dioxide
Formula NaCl CO2
Type of particles present ions
Melting point low
(i) Complete the table. [2]
(ii) Carbon dioxide has a low melting point.
Explain why, using ideas about forces.
_______________________________________
_____________________________________ [1]
[TOTAL: 5]

8
3 An aluminium atom can be shown as
2713
Al
(a) What can be deduced from this information about the structure of an aluminium atom and the position of aluminium in the Periodic Table?
The quality of written communication will be assessed in your answer to this question.
__________________________________________
__________________________________________
__________________________________________
__________________________________________
__________________________________________
__________________________________________
__________________________________________
__________________________________________
__________________________________________
__________________________________________
__________________________________________
________________________________________ [6]
9
(b) Rutherford was a scientist who contributed to the development of the theory of atomic structure.
He worked with two other scientists called Geiger and Marsden.
Write about Geiger and Marsden’s experiment and how it contributed to the development of ideas about atomic structure.
__________________________________________
__________________________________________
__________________________________________
________________________________________ [2]
[TOTAL: 8]
10
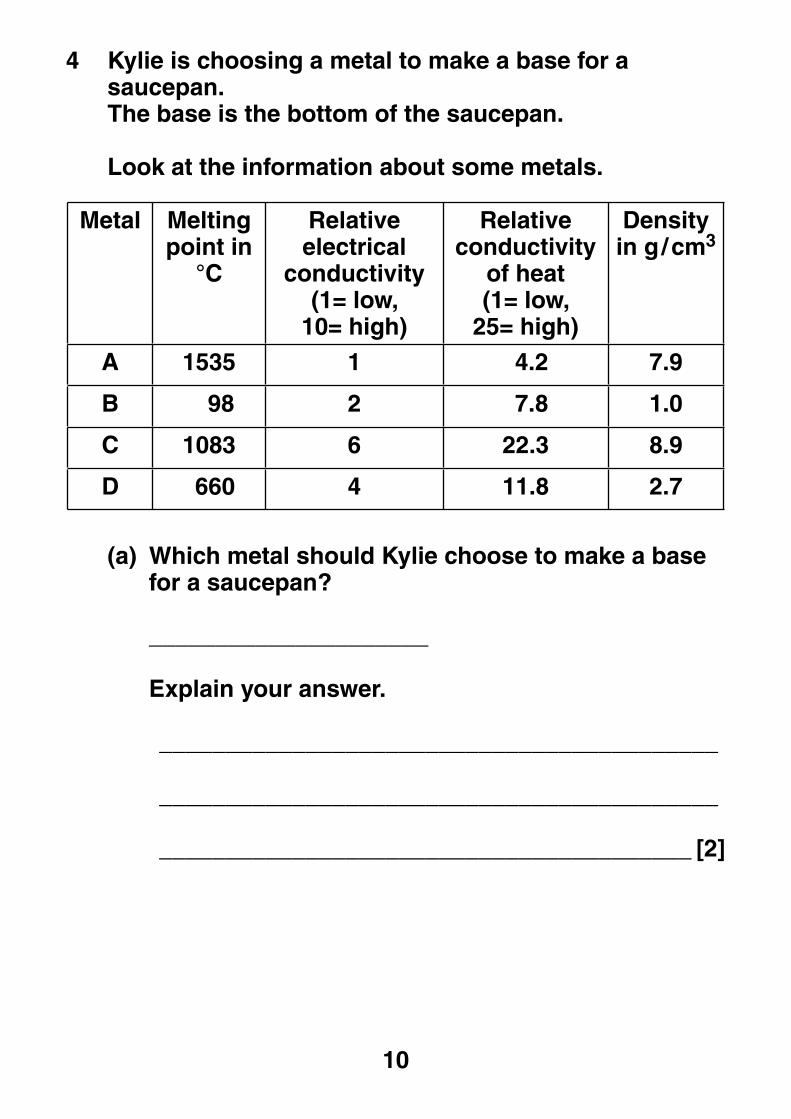
4 Kylie is choosing a metal to make a base for a saucepan.
The base is the bottom of the saucepan.
Look at the information about some metals.
Metal Melting point in
°C
Relative electrical
conductivity(1= low,
10= high)
Relative conductivity
of heat(1= low,
25= high)
Densityin g / cm3
A 1535 1 4.2 7.9
B 98 2 7.8 1.0
C 1083 6 22.3 8.9
D 660 4 11.8 2.7
(a) Which metal should Kylie choose to make a base for a saucepan?
_____________________
Explain your answer.
__________________________________________
__________________________________________
________________________________________ [2]
11
(b) Describe METALLIC BONDING and explain why metals are good conductors of electricity.
You may wish to draw a labelled diagram.
__________________________________________
__________________________________________
________________________________________ [3]
[Total: 5]
12
SECTION B – Module C5
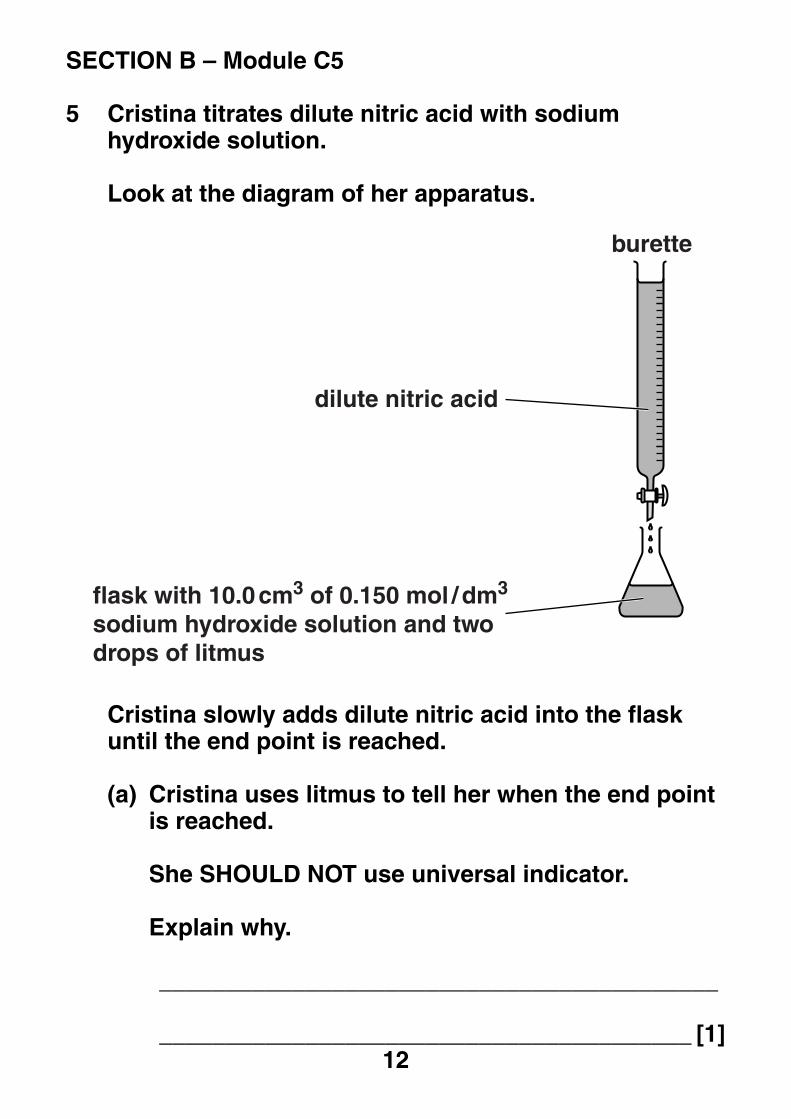
5 Cristina titrates dilute nitric acid with sodium hydroxide solution.
Look at the diagram of her apparatus.
burette
flask with 10.0 cm3 of 0.150 mol / dm3
sodium hydroxide solution and twodrops of litmus
dilute nitric acid
Cristina slowly adds dilute nitric acid into the flask until the end point is reached.
(a) Cristina uses litmus to tell her when the end point is reached.
She SHOULD NOT use universal indicator.
Explain why.
__________________________________________
________________________________________ [1]
13
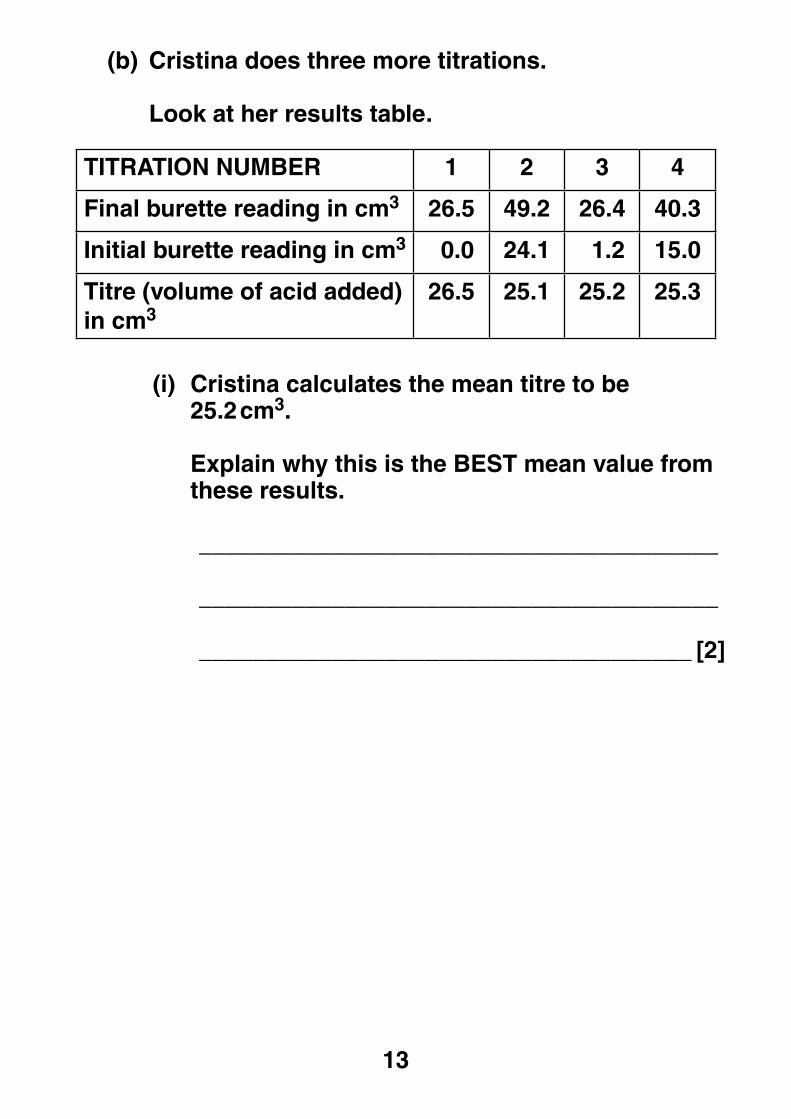
(b) Cristina does three more titrations.
Look at her results table.
TITRATION NUMBER 1 2 3 4
Final burette reading in cm3 26.5 49.2 26.4 40.3
Initial burette reading in cm3 0.0 24.1 1.2 15.0
Titre (volume of acid added) in cm3
26.5 25.1 25.2 25.3
(i) Cristina calculates the mean titre to be 25.2 cm3.
Explain why this is the BEST mean value from these results.
_______________________________________
_______________________________________
_____________________________________ [2]
14
(ii) Cristina uses 10.0 cm3 of sodium hydroxide solution.
The concentration of the sodium hydroxide solution is 0.150 mol / dm3.
Calculate the number of moles of sodium hydroxide in 10.0 cm3 of this solution.
_______________________________________
_______________________________________
number of moles = ______________ [1]
(iii) Look at the equation for the reaction between nitric acid and sodium hydroxide.
HNO3 + NaOH NaNO3 + H2O
Use the information from parts (i) and (ii) to calculate the concentration of the nitric acid.
Give your answer to THREE significant figures.
_______________________________________
_______________________________________
_______________________________________
_______________________________________
concentration of nitric acid
= ____________ mol / dm3 [2]
[TOTAL: 6]
15
6 There are many compounds that contain carbon and hydrogen only.
(a) Pentane has the formula CH3(CH2)3CH3.
Calculate the molar mass of pentane.
The relative atomic mass, Ar , of H = 1 and of C = 12.
__________________________________________
__________________________________________
molar mass = ______________ g / mol [1]
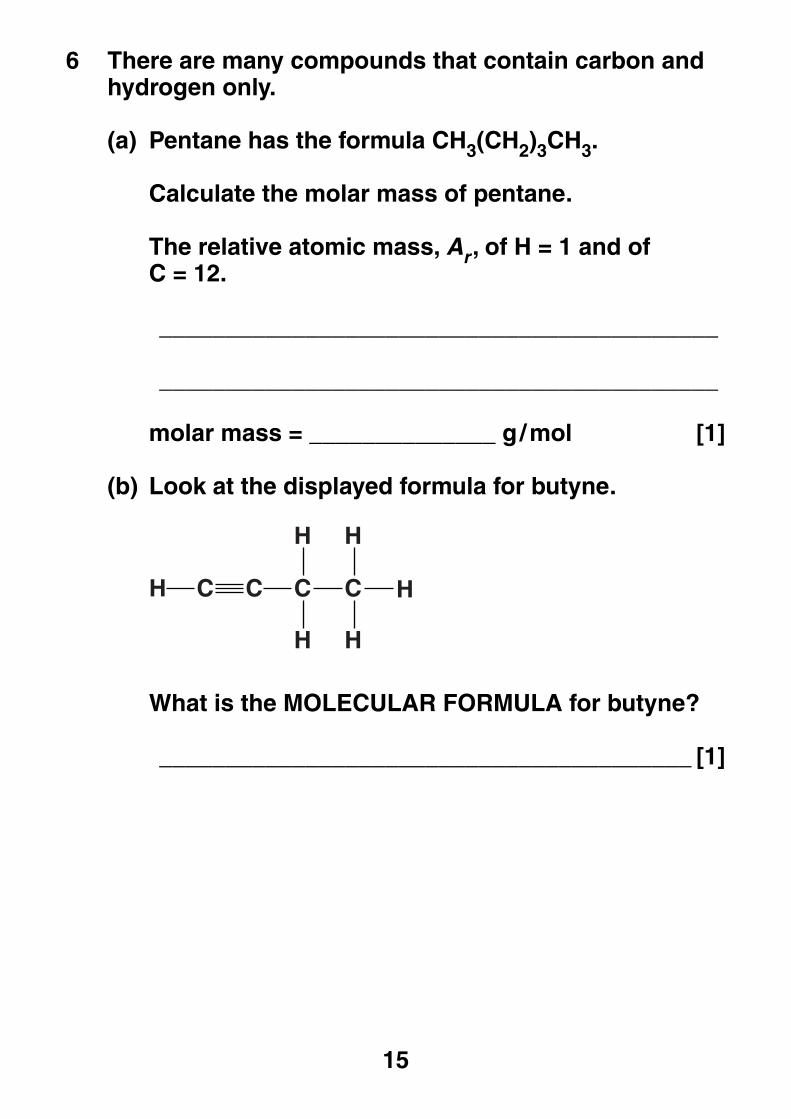
(b) Look at the displayed formula for butyne.
CCCH
H
H
H
H
HC
What is the MOLECULAR FORMULA for butyne?
________________________________________ [1]
16
(c) Look at the molecular formula of some compounds.
Which TWO compounds have the same EMPIRICAL formula?
Choose from
CH4 C2H2
C2H6 C3H4
C2H4 C6H6
answer ______________ and _______________ [1]
17
(d) David analyses a sample of a gas.
He finds it contains 1.2 g of carbon and 0.4 g of hydrogen.
Calculate the empirical formula for this gas.
__________________________________________
__________________________________________
__________________________________________
empirical formula is ______________ [2]
[TOTAL: 5]
18
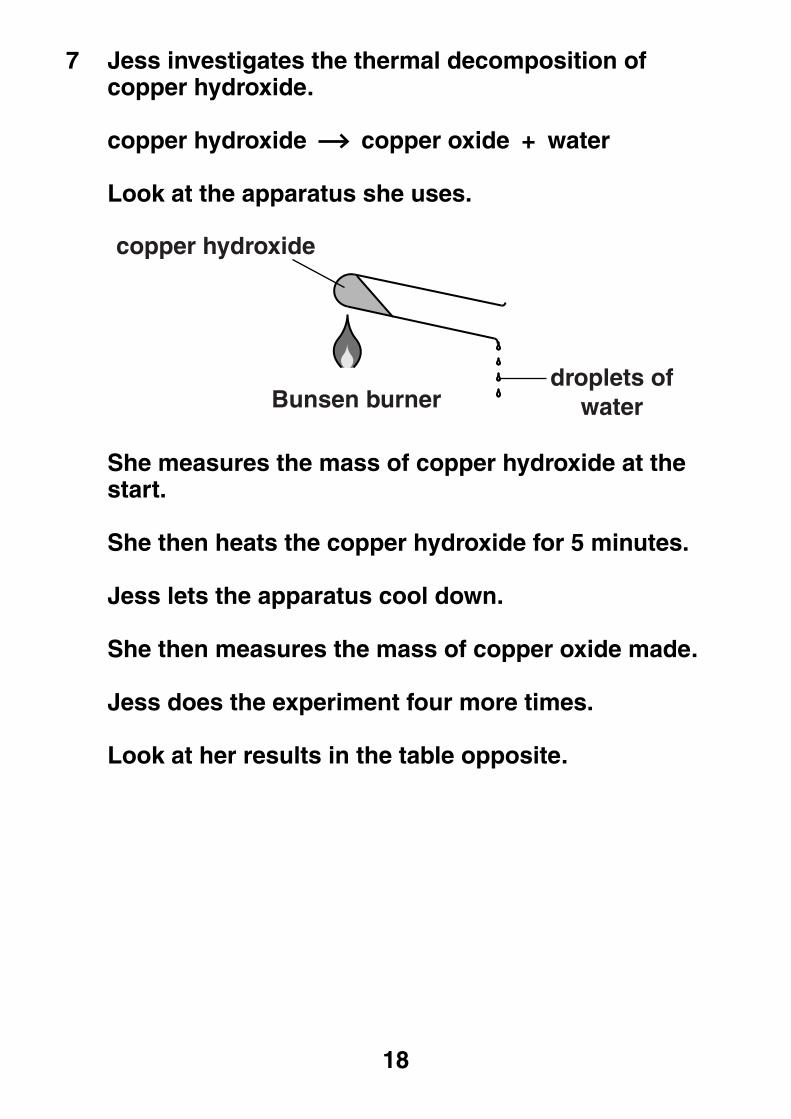
7 Jess investigates the thermal decomposition of copper hydroxide.
copper hydroxide copper oxide + water
Look at the apparatus she uses.
droplets ofwaterBunsen burner
copper hydroxide
She measures the mass of copper hydroxide at the start.
She then heats the copper hydroxide for 5 minutes.
Jess lets the apparatus cool down.
She then measures the mass of copper oxide made.
Jess does the experiment four more times.
Look at her results in the table opposite.
19
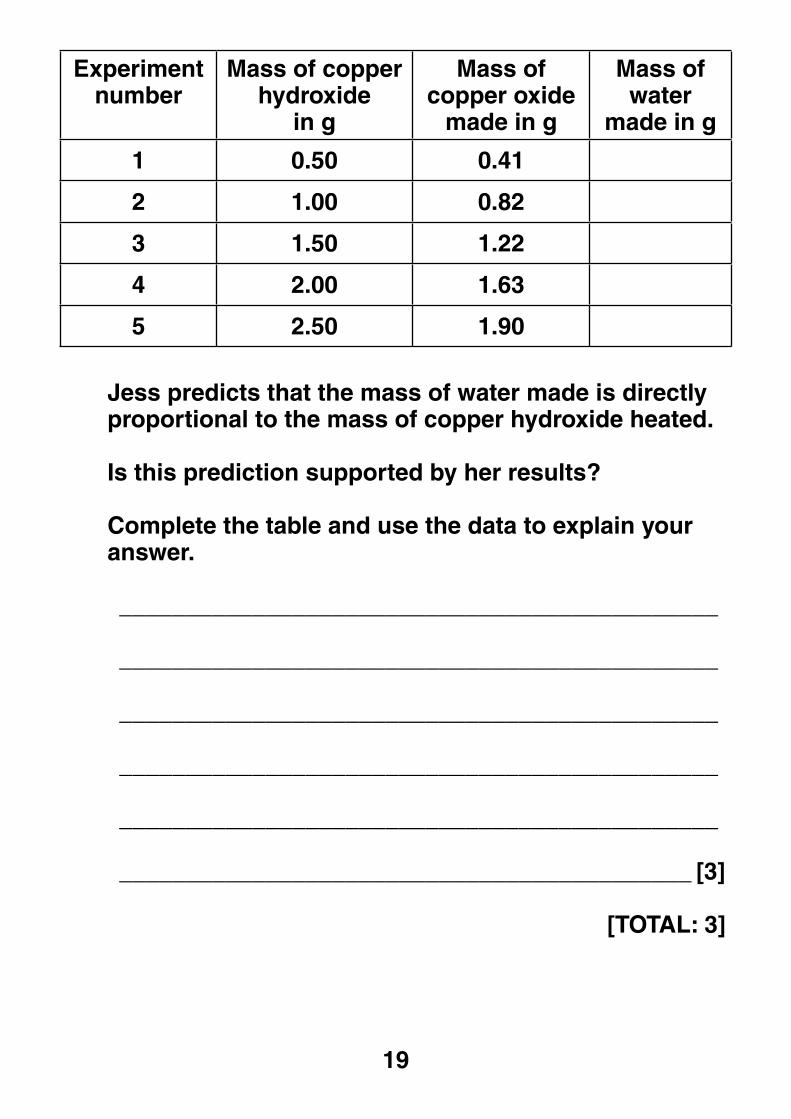
Experiment number
Mass of copper hydroxide
in g
Mass of copper oxide
made in g
Mass of water
made in g
1 0.50 0.41
2 1.00 0.82
3 1.50 1.22
4 2.00 1.63
5 2.50 1.90
Jess predicts that the mass of water made is directly proportional to the mass of copper hydroxide heated.
Is this prediction supported by her results?
Complete the table and use the data to explain your answer.
_____________________________________________
_____________________________________________
_____________________________________________
_____________________________________________
_____________________________________________
___________________________________________ [3]
[TOTAL: 3]
20
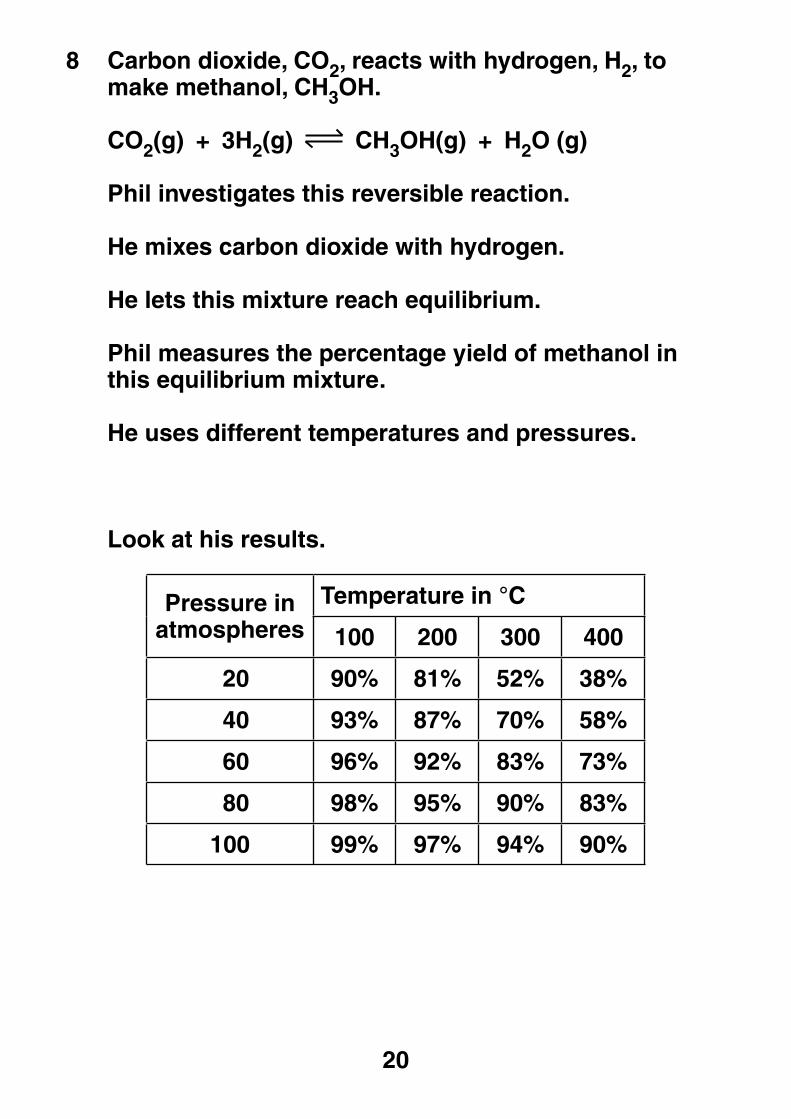
8 Carbon dioxide, CO2, reacts with hydrogen, H2, to make methanol, CH3OH.
CO2(g) + 3H2(g) CH3OH(g) + H2O (g)
Phil investigates this reversible reaction.
He mixes carbon dioxide with hydrogen.
He lets this mixture reach equilibrium.
Phil measures the percentage yield of methanol in this equilibrium mixture.
He uses different temperatures and pressures.
Look at his results.
Pressure in atmospheres
Temperature in °C
100 200 300 400
20 90% 81% 52% 38%
40 93% 87% 70% 58%
60 96% 92% 83% 73%
80 98% 95% 90% 83%
100 99% 97% 94% 90%
21
(a) The percentage yield and position of equilibrium change with temperature, pressure and concentration of carbon dioxide.
Describe how the percentage yield of methanol changes with temperature and with pressure.
Describe how, and explain why, the position of equilibrium changes as extra carbon dioxide is added to the equilibrium mixture.
The quality of written communication will be assessed in your answer to this question.
__________________________________________
__________________________________________
__________________________________________
__________________________________________
__________________________________________
__________________________________________
__________________________________________
__________________________________________
__________________________________________
__________________________________________
__________________________________________
________________________________________ [6]

22
(b) Phil works as part of a team of research chemists.
It is a good idea for scientists to work as part of a team when solving scientific problems.
Explain why.
__________________________________________
__________________________________________
________________________________________ [2]
[TOTAL: 8]

23
BLANK PAGE
24
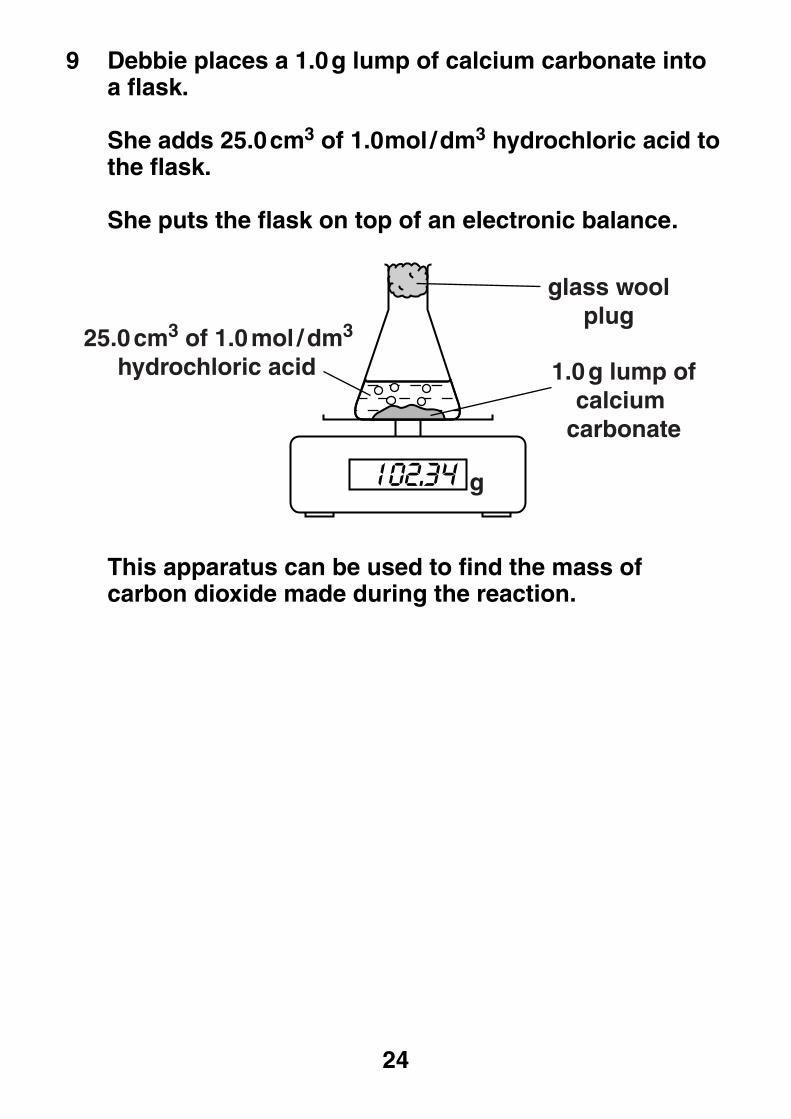
9 Debbie places a 1.0 g lump of calcium carbonate into a flask.
She adds 25.0 cm3 of 1.0 mol / dm3 hydrochloric acid to the flask.
She puts the flask on top of an electronic balance.
g
glass woolplug
1.0 g lump ofcalcium
carbonate
25.0 cm3 of 1.0 mol / dm3
hydrochloric acid
This apparatus can be used to find the mass of carbon dioxide made during the reaction.

25
(a) Debbie repeats the experiment.
This time she uses 25.0 cm3 of 1.0 mol / dm3 ETHANOIC ACID instead of hydrochloric acid.
The reaction is much slower because ethanoic acid is a weak acid.
Explain why weak acids react MORE SLOWLY than strong acids.
__________________________________________
__________________________________________
________________________________________ [1]
(b) Debbie wants to measure the VOLUME of carbon dioxide made during the reaction.
Draw a labelled diagram of the apparatus she should use.
[2]
[TOTAL: 3]
26
SECTION C – Module C6
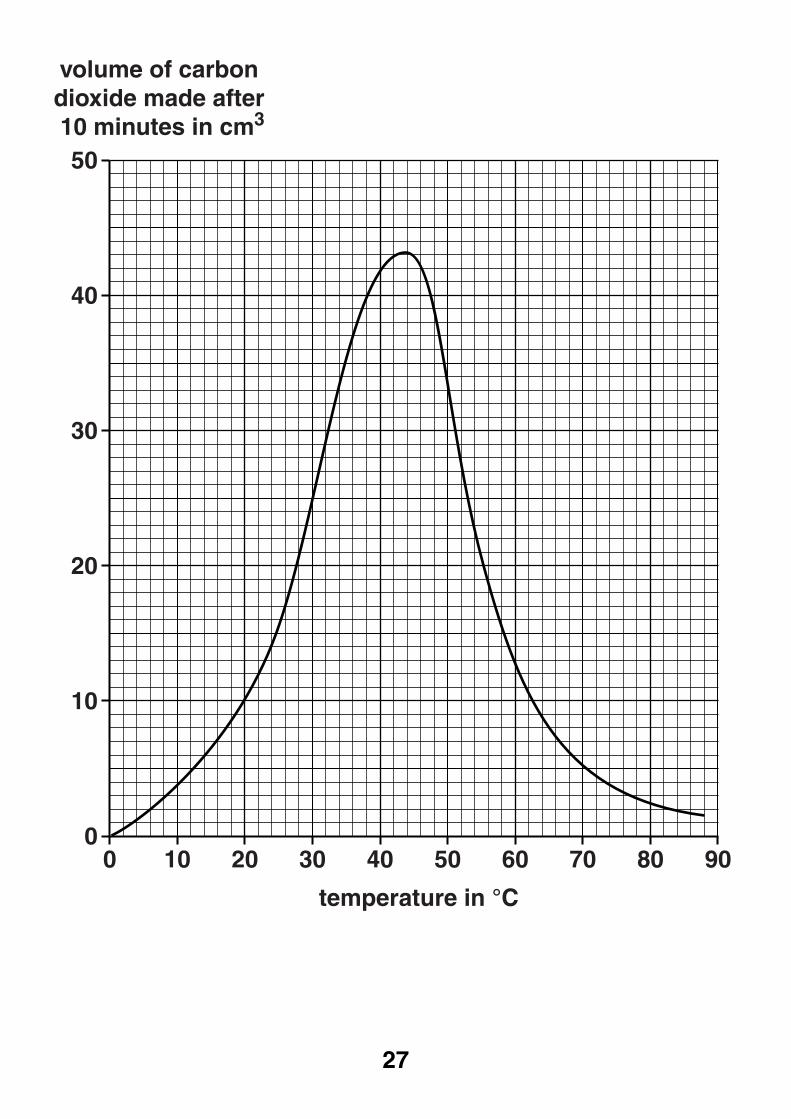
10 Ethanol can be made by the fermentation of glucose.
Tina and Tommy investigate the fermentation of glucose.
They use 50 cm3 of glucose solution and 1 g of yeast.
Tina and Tommy measure the volume of carbon dioxide made after 10 minutes.
They do the experiment at different temperatures.
Look at the graph opposite. It shows their results.
(a) (i) What is the volume of carbon dioxide made at 60 °C?
answer ______________ cm3 [1]
(ii) At what temperature is the reaction fastest?
answer ______________ °C
Explain your answer.
_______________________________________
_____________________________________ [2]
27
00
10
20
30
40
50
10 20 30 40 50
temperature in °C
volume of carbon dioxide made after 10 minutes in cm3
60 70 80 90

28
(b) Glucose reacts to make carbon dioxide and ethanol.
Look at the formulas.
Substance Formula
glucose C6H12O6
carbon dioxide CO2
ethanol C2H5OH
Write down the BALANCED SYMBOL equation for this reaction.
________________________________________ [2]
(c) The general formula for an alcohol is
CnH2n+1OH
Propanol contains three carbon atoms.
(i) Write the formula for propanol.
_____________________________________ [1]
(ii) Draw the DISPLAYED FORMULA of propanol.
[1]
[TOTAL: 7]
29
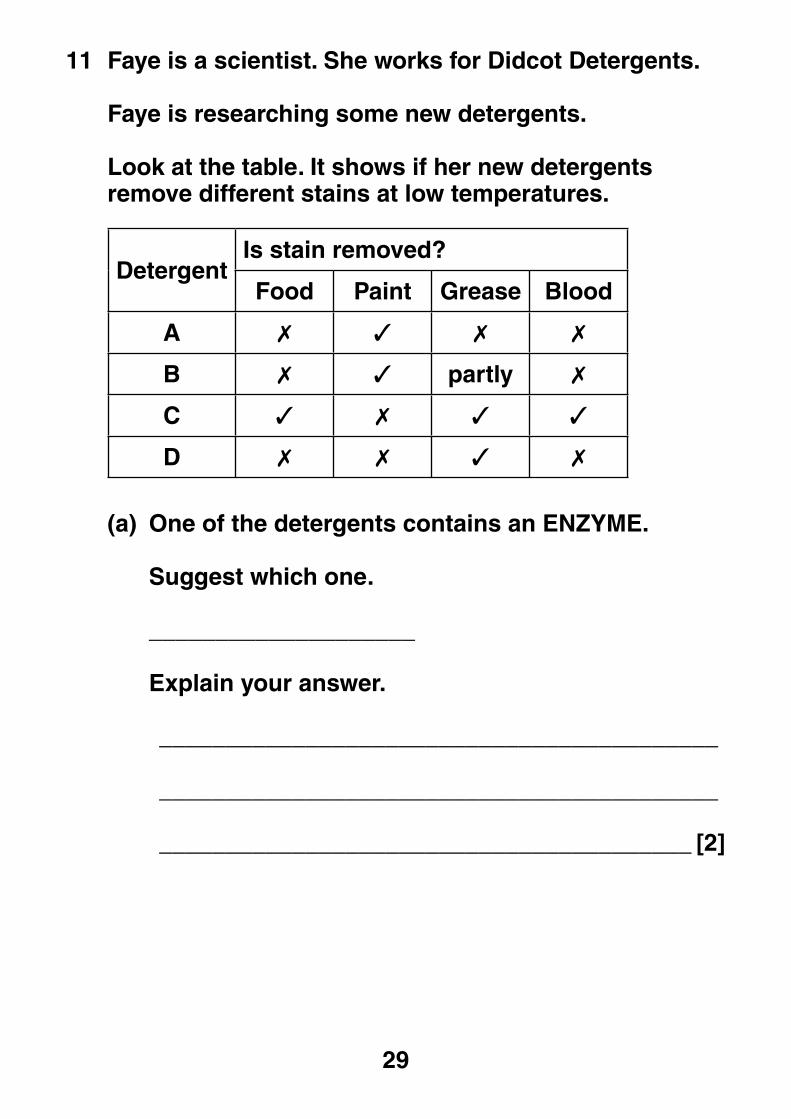
11 Faye is a scientist. She works for Didcot Detergents.
Faye is researching some new detergents.
Look at the table. It shows if her new detergents remove different stains at low temperatures.
DetergentIs stain removed?
Food Paint Grease Blood
A ✗ ✓ ✗ ✗
B ✗ ✓ partly ✗
C ✓ ✗ ✓ ✓
D ✗ ✗ ✓ ✗
(a) One of the detergents contains an ENZYME.
Suggest which one.
____________________
Explain your answer.
__________________________________________
__________________________________________
________________________________________ [2]
30
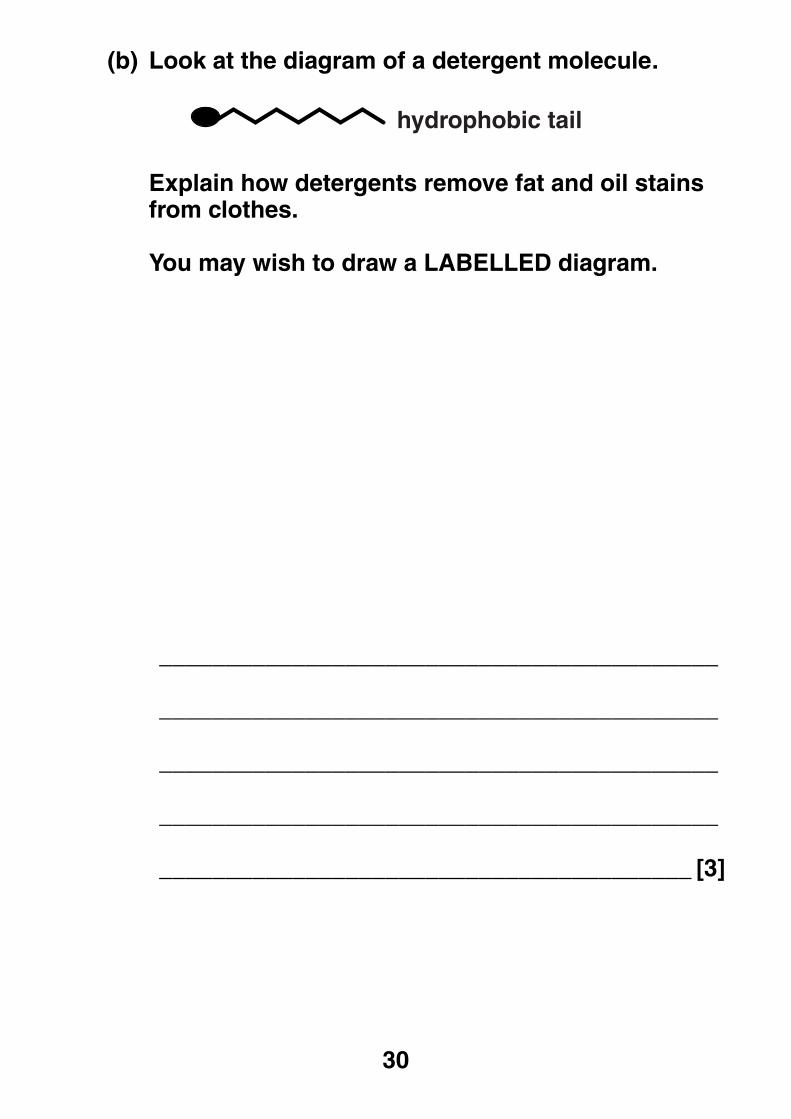
(b) Look at the diagram of a detergent molecule.
hydrophobic tail
Explain how detergents remove fat and oil stains from clothes.
You may wish to draw a LABELLED diagram.
__________________________________________
__________________________________________
__________________________________________
__________________________________________
________________________________________ [3]
31
(c) Some fats are UNSATURATED.
Describe a chemical test to show that a fat is unsaturated.
test _______________________________________
result _____________________________________
__________________________________________[2]
[TOTAL: 7]
32
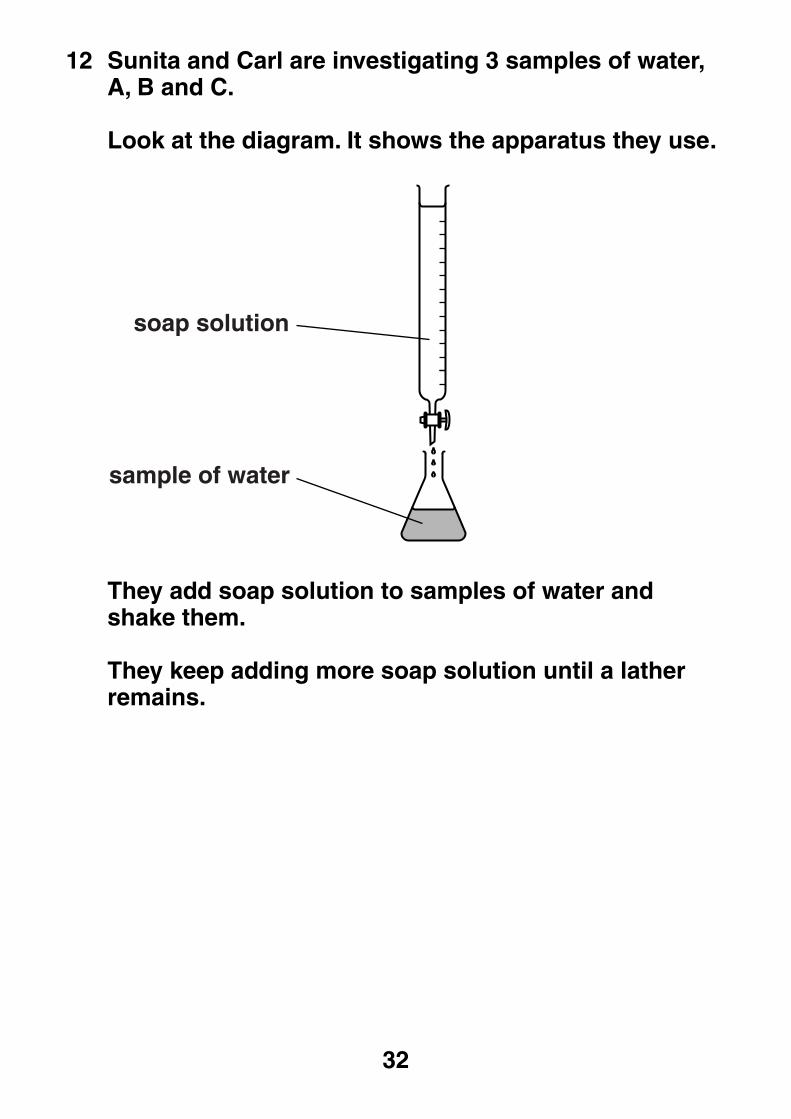
12 Sunita and Carl are investigating 3 samples of water, A, B and C.
Look at the diagram. It shows the apparatus they use.
soap solution
sample of water
They add soap solution to samples of water and shake them.
They keep adding more soap solution until a lather remains.
33
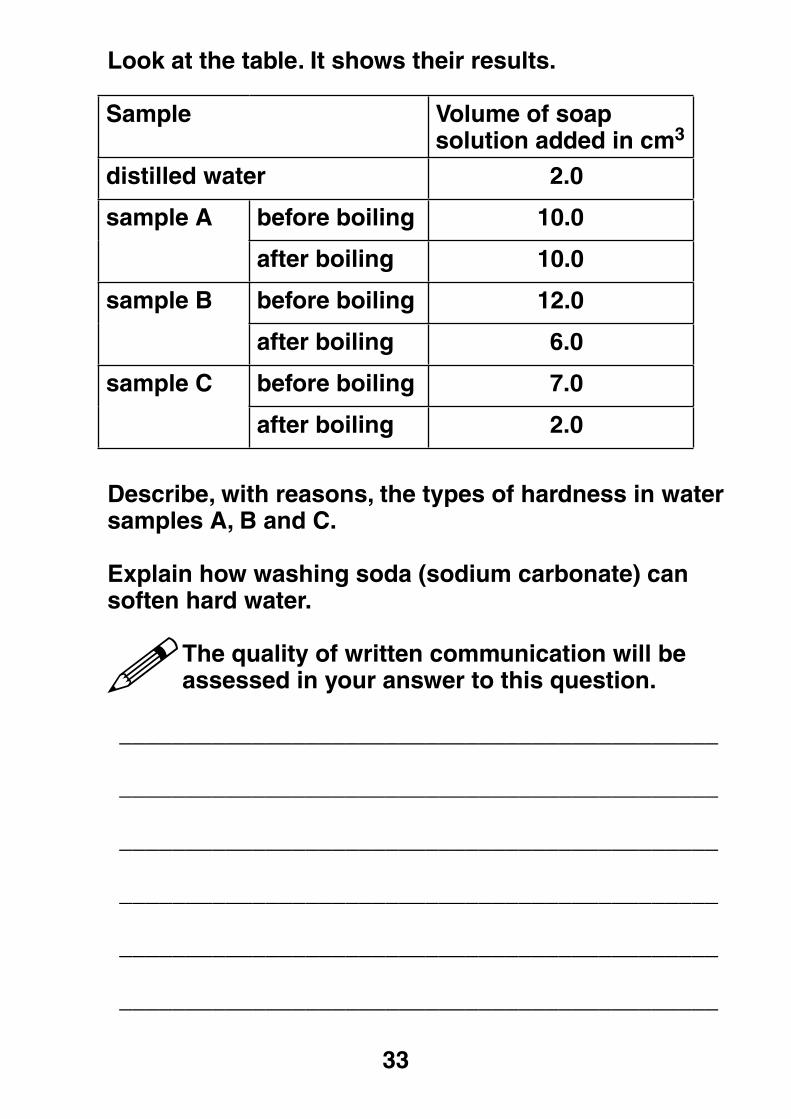
Look at the table. It shows their results.
Sample Volume of soap solution added in cm3
distilled water 2.0
sample A before boiling 10.0
after boiling 10.0
sample B before boiling 12.0
after boiling 6.0
sample C before boiling 7.0
after boiling 2.0
Describe, with reasons, the types of hardness in water samples A, B and C.
Explain how washing soda (sodium carbonate) can soften hard water.
The quality of written communication will be assessed in your answer to this question.
_____________________________________________
_____________________________________________
_____________________________________________
_____________________________________________
_____________________________________________
_____________________________________________
34
_____________________________________________
_____________________________________________
_____________________________________________
_____________________________________________
_____________________________________________
___________________________________________ [6]
[TOTAL: 6]
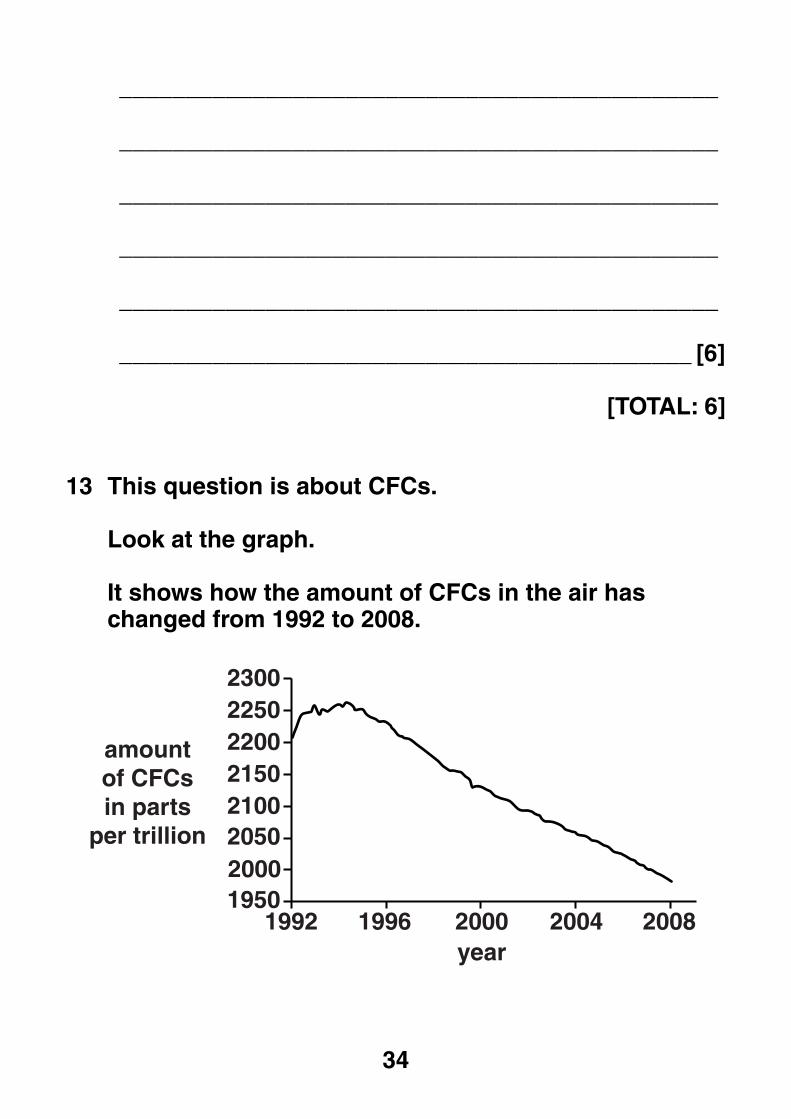
13 This question is about CFCs.
Look at the graph.
It shows how the amount of CFCs in the air has changed from 1992 to 2008.
2300225022002150
amountof CFCsin parts
per trillion2100205020001950
1992 1996 2000year
2004 2008
35
(a) Describe the pattern shown on the graph.
Explain why this has happened.
__________________________________________
__________________________________________
__________________________________________
________________________________________ [2]
(b) Scientists’ attitudes to CFCs have changed since CFCs were first introduced in the 1950s.
Describe how and explain why.
__________________________________________
__________________________________________
__________________________________________
__________________________________________
________________________________________ [3]
[TOTAL: 5]
36
SECTION D
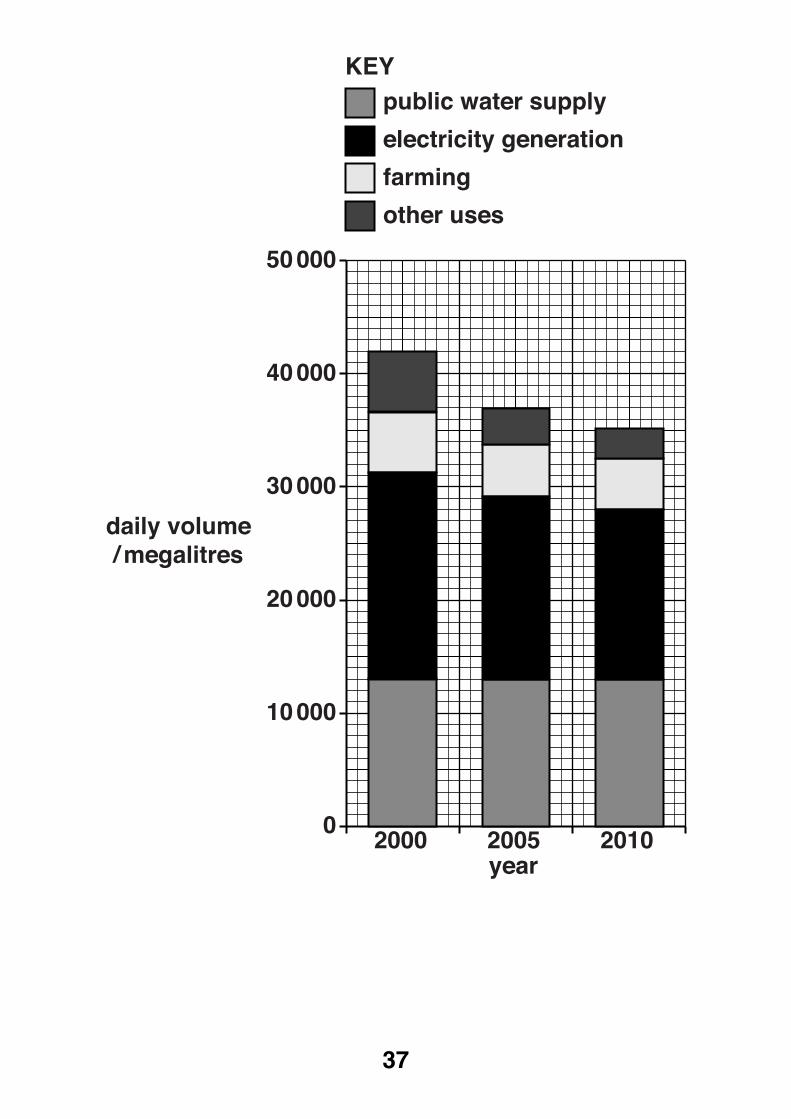
14 Water is a very important resource in the world.
(a) Look at the bar chart opposite.
It shows the uses of water in the United Kingdom in the years 2000, 2005 and 2010.
(i) The volume of water used each day decreased from the year 2000 to 2010.
Suggest why there has been a DECREASE.
Use information from the bar chart.
_______________________________________
_____________________________________ [1]
(ii) Look at the data for the year 2000.
The volume of water used for PUBLIC WATER SUPPLY was 13 000 megalitres.
Show that the percentage of the water used for the public water supply was 30.95%.
_______________________________________
_______________________________________
_____________________________________ [2]
37
daily volume/ megalitres
0
10 000
20 000
30 000
40 000
50 000
2000 2005year
2010
public water supply
electricity generation
farming
other uses
KEY
38
(iii) The VOLUME of water used for public water supply did not change between the years 2000 and 2010.
Describe how the PERCENTAGE of water used for the public water supply changed between the years 2000 and 2010.
_____________________________________ [1]

39
BLANK PAGE
40
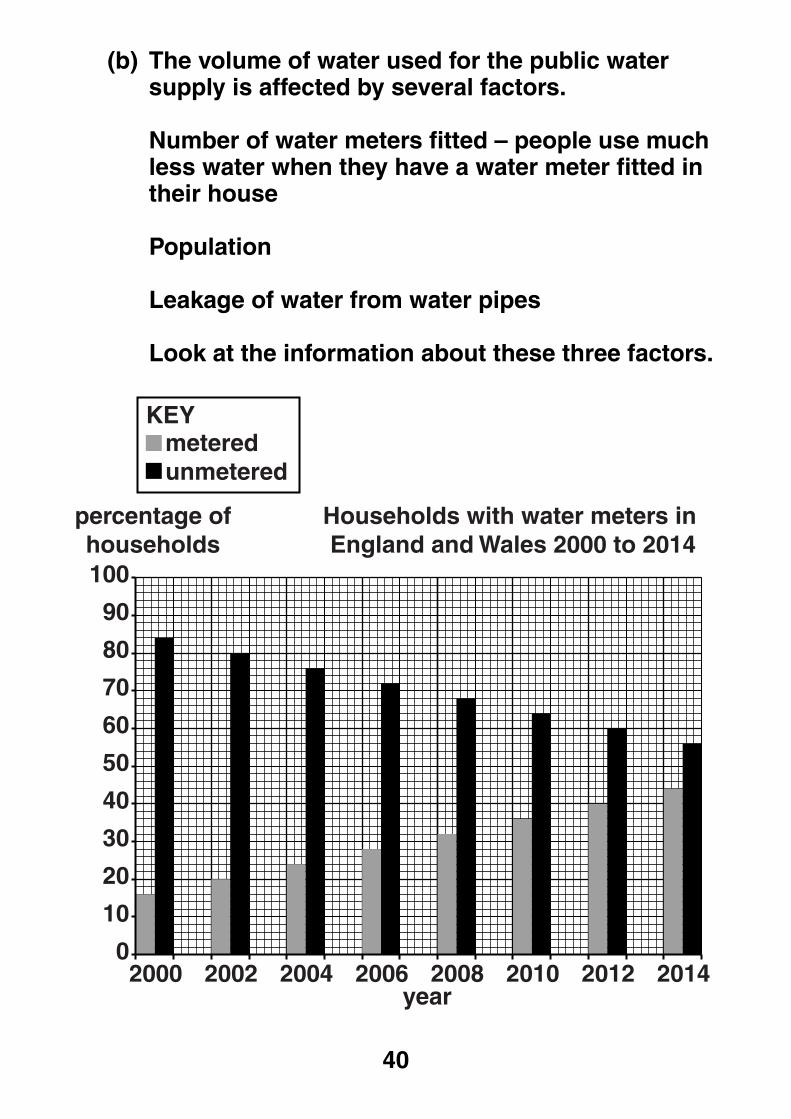
(b) The volume of water used for the public water supply is affected by several factors.
Number of water meters fitted – people use much less water when they have a water meter fitted in their house
Population
Leakage of water from water pipes
Look at the information about these three factors.
0
20
40
60
80
100
10
30
50
70
90
2000 2002 2004year
percentage ofhouseholds
2006 2008 2010 2012 2014
meteredunmetered
KEY
Households with water meters in England and Wales 2000 to 2014
41
50
54
58
62
66
52
56
60
64
2000 2005 2010year
millionsof
people
2015 2020 2025 2030
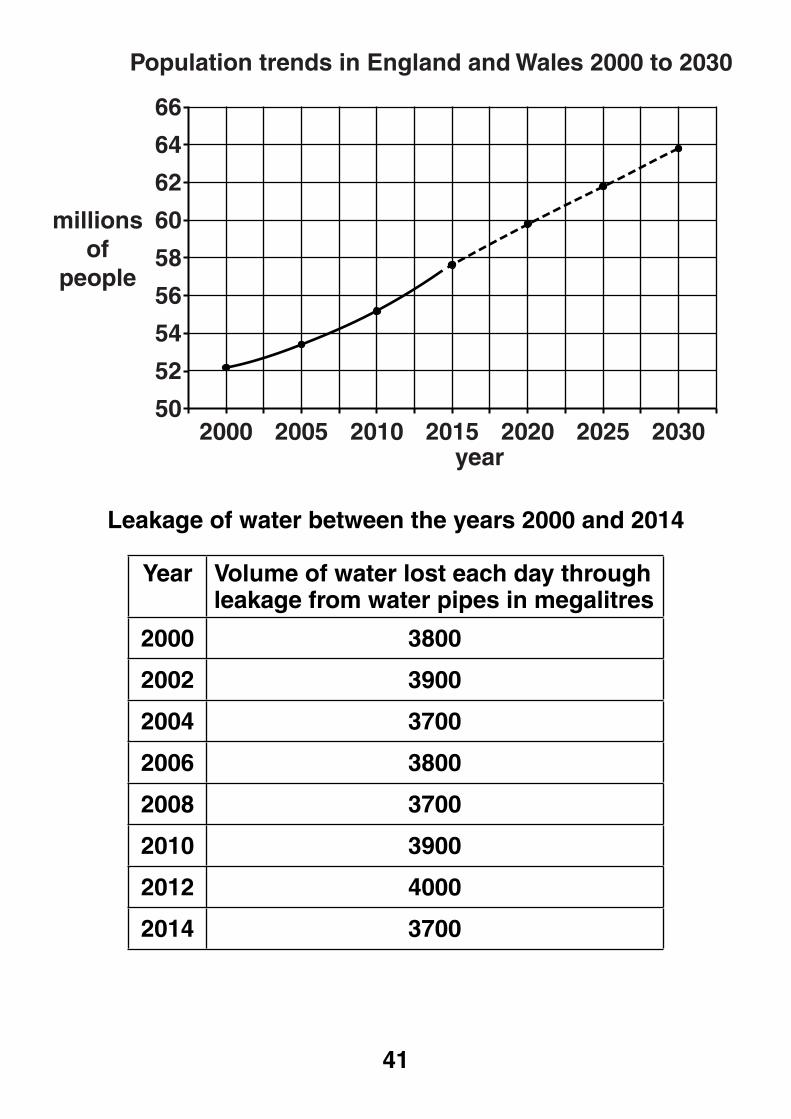
Population trends in England and Wales 2000 to 2030
Leakage of water between the years 2000 and 2014
Year Volume of water lost each day through leakage from water pipes in megalitres
2000 3800
2002 3900
2004 3700
2006 3800
2008 3700
2010 3900
2012 4000
2014 3700
42
Scientists want to predict the volume of water needed for public water supply in future years.
In 2014, the volume of water needed each day was 16 000 megalitres.
Suggest the future trend in the volume of water needed for public water supply.
Explain your answer.
Use information about the three factors in your explanation.
__________________________________________
__________________________________________
__________________________________________
__________________________________________
__________________________________________
________________________________________ [3]

43
BLANK PAGE
44
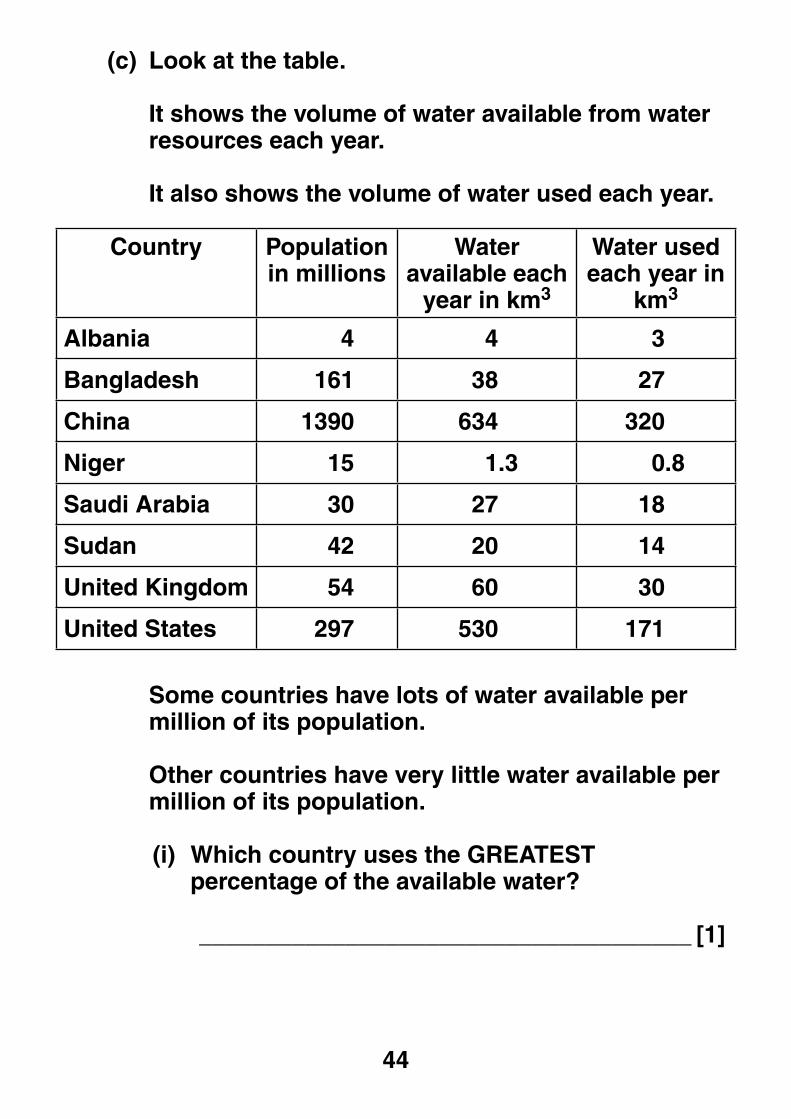
(c) Look at the table.
It shows the volume of water available from water resources each year.
It also shows the volume of water used each year.
Country Population in millions
Water available each
year in km3
Water used each year in
km3
Albania 4 4 3
Bangladesh 161 38 27
China 1390 634 320
Niger 15 1.3 0.8
Saudi Arabia 30 27 18
Sudan 42 20 14
United Kingdom 54 60 30
United States 297 530 171
Some countries have lots of water available per million of its population.
Other countries have very little water available per million of its population.
(i) Which country uses the GREATEST percentage of the available water?
_____________________________________ [1]
45
(ii) Write the name of the country most likely to have a shortage of water for its population.
Explain your answer. Use data from the table.
_______________________________________
_______________________________________
_______________________________________
_____________________________________ [2]
[TOTAL: 10]
END OF QUESTION PAPER

46
BLANK PAGE

47
BLANK PAGE

48* 4 1 1 5 4 7 1 3 5 3 *
Copyright Information
OCR is committed to seeking permission to reproduce all third-party content that it uses in its assessment materials. OCR has attempted to identify and contact all copyright holders whose work is used in this paper. To avoid the issue of disclosure of answer-related information to candidates, all copyright acknowledgements are reproduced in the OCR Copyright Acknowledgements Booklet. This is produced for each series of examinations and is freely available to download from our public website (www.ocr.org.uk) after the live examination series.If OCR has unwittingly failed to correctly acknowledge or clear any third-party content in this assessment material, OCR will be happy to correct its mistake at the earliest possible opportunity.For queries or further information please contact the Copyright Team, First Floor, 9 Hills Road, Cambridge CB2 1GE. OCR is part of the Cambridge Assessment Group; Cambridge Assessment is the brand name of University of Cambridge Local Examinations Syndicate (UCLES), which is itself a department of the University of Cambridge.