Embed Size (px)
Citation preview

Higher Order Higher Order SystemsSystems

In this presentation……
Part 1 – Genetic Regulatory Networks
Part 2 – Molecular Pathways
Part 3 – Protein Interactions
Part 4 – Modeling Regulatory Networks

Part
1
Genetic Genetic Regulatory Regulatory NetworksNetworks

Genetic regulatory networks

Higher order systems
• Although genes and proteins can be studied individually, more insight into their functions can be gained by studying higher-order systems, that is, molecular pathways and networks, cells, tissues, organs and whole organisms
• This allows their physical and functional interactions to be determined in the widest possible context
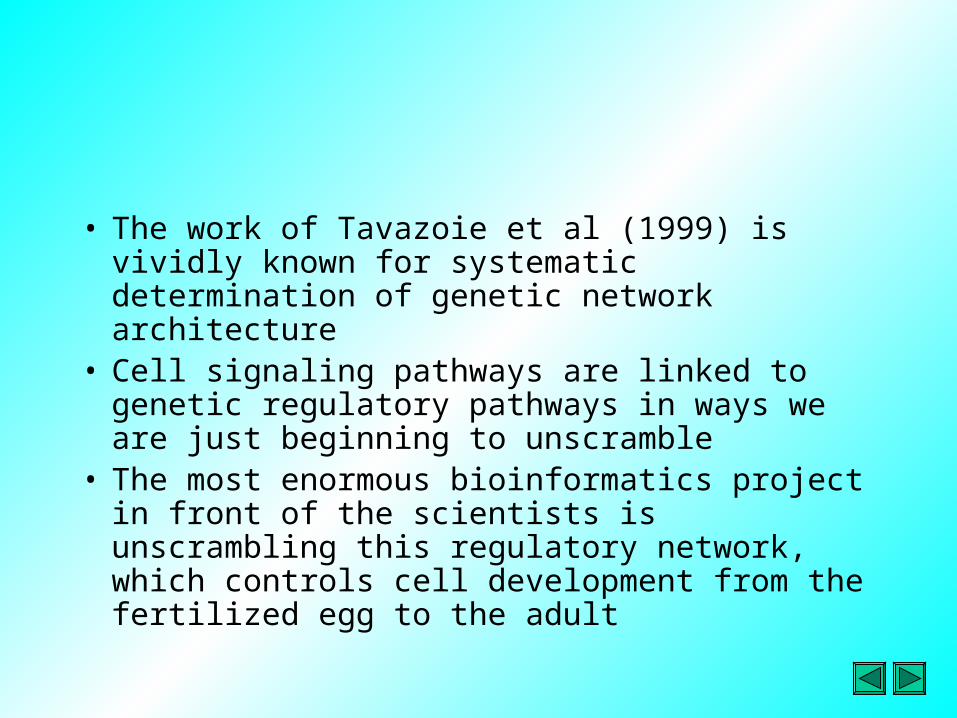
• The work of Tavazoie et al (1999) is vividly known for systematic determination of genetic network architecture
• Cell signaling pathways are linked to genetic regulatory pathways in ways we are just beginning to unscramble
• The most enormous bioinformatics project in front of the scientists is unscrambling this regulatory network, which controls cell development from the fertilized egg to the adult

• It would become possible to know which gene to perturb – or which sequence of genes to perturb, and in what order – to guide a cancer cell to nonmalignant behaviour or to apoptosis [programmed to cell death]
• Or to guide the regeneration of some tissues, so that if someone has lost half of the pancreas, the damaged portion could be regenerated
• Or to regenerate the beta cells in people who have diabetes

• Suppose about 10 genes are picked out that are known to regulate one another, then a circuit could be built about their behaviour. It is a good thing and one should do this but the down side will be that those 10 genes have inputs from other genes outside that circuit. Therefore, it is like taking a little chunk of the circuitry that is embedded in a much larger circuit of thousands of genes in it. The behaviour can not be then properly assessed as to how and what impact the outside genes would create

• It is known for years that every neuron in the lobster gastric ganglia [a nerve bundle going to the animal’s digestive system], all the synaptic connections and the neurotransmitters
• There would be 13 or 20 neurons in the ganglion and still its behaviour cannot be figured out
• No mathematician would ever think that understanding a system with 13 variables is going to be an easy thing to do

• In the human genome case, there would be more than 100,000 variables i.e. there would be 2100,000 states, which is roughly 1030,000
• So even if genes are treated to be on or off, there are 1030,000 states (which is false as genes show graded level of activity)
• It is mind boggling because the number of particles in known universe is 1080

Types of pathways
• Molecular pathways
• Metabolic pathways
• Signaling and regulatory pathways
• Protein interaction networks

Part
2
Molecular Molecular PathwaysPathways
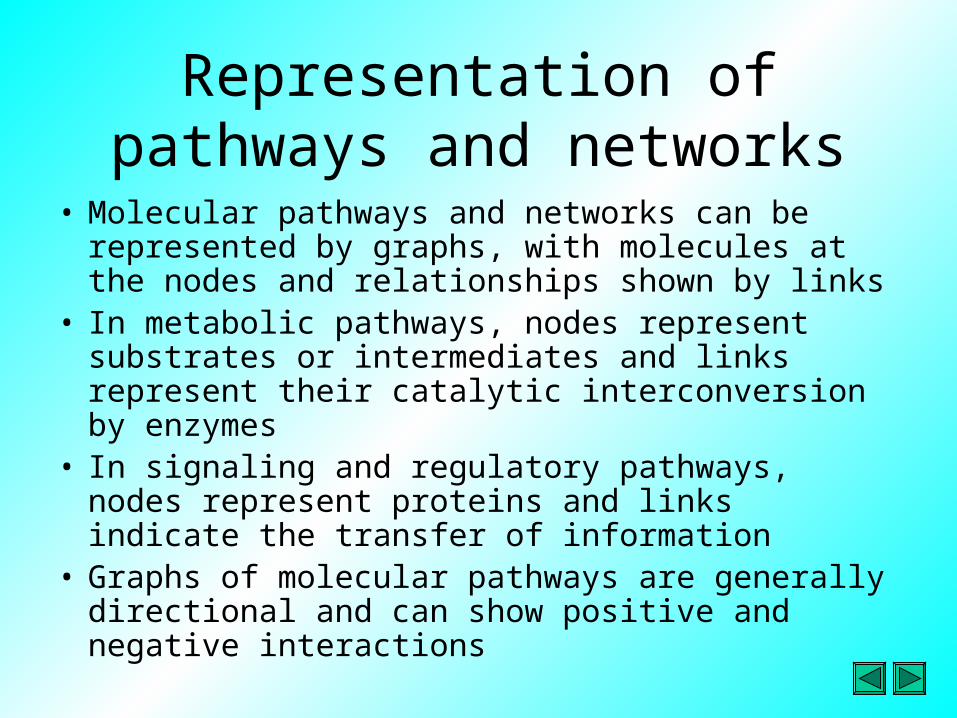
Representation of pathways and networks
• Molecular pathways and networks can be represented by graphs, with molecules at the nodes and relationships shown by links
• In metabolic pathways, nodes represent substrates or intermediates and links represent their catalytic interconversion by enzymes
• In signaling and regulatory pathways, nodes represent proteins and links indicate the transfer of information
• Graphs of molecular pathways are generally directional and can show positive and negative interactions

Reconstruction of molecular pathways
• Pathways and networks can be mapped directly by substrate feeding experiments and in vitro enzyme assays
• More recently, a number of indirect but high-throughput methods have been developed thanks to the advent of functional genomics
• These methods include pathway reconstruction from expression data, protein interaction and comprehensive mutagenesis programs

Modeling molecular pathways
• Mathematical models of biochemical reactions are often based on differential equations that predict the change in concentration of particular molecules over time
• Simultaneous differential equations can be used to model entire pathways and several software applications are available for this task, including GEPASI and BioQuest

• There are limitations to the use of simultaneous differential equations and these have been addressed through the development of stochastic models based on the Gillespie algorithm, which is incorporated into programs such as StochSim

Subgraph with main interactions between GAD and GABA-receptors, derived from the linear model. P. D'haeseleer, X. Wen, S. Fuhrman, and R. Somogyi (1999) Linear Modeling of mRNA Expression Levels During CNS Development and Injury
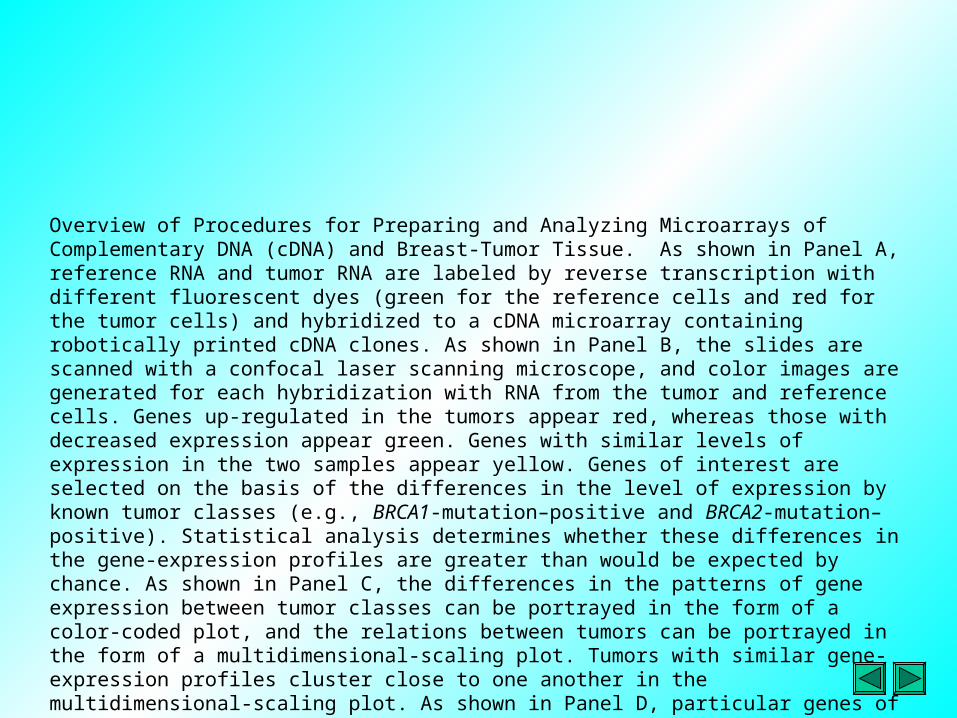
Overview of Procedures for Preparing and Analyzing Microarrays of Complementary DNA (cDNA) and Breast-Tumor Tissue. As shown in Panel A, reference RNA and tumor RNA are labeled by reverse transcription with different fluorescent dyes (green for the reference cells and red for the tumor cells) and hybridized to a cDNA microarray containing robotically printed cDNA clones. As shown in Panel B, the slides are scanned with a confocal laser scanning microscope, and color images are generated for each hybridization with RNA from the tumor and reference cells. Genes up-regulated in the tumors appear red, whereas those with decreased expression appear green. Genes with similar levels of expression in the two samples appear yellow. Genes of interest are selected on the basis of the differences in the level of expression by known tumor classes (e.g., BRCA1-mutation–positive and BRCA2-mutation–positive). Statistical analysis determines whether these differences in the gene-expression profiles are greater than would be expected by chance. As shown in Panel C, the differences in the patterns of gene expression between tumor classes can be portrayed in the form of a color-coded plot, and the relations between tumors can be portrayed in the form of a multidimensional-scaling plot. Tumors with similar gene-expression profiles cluster close to one another in the multidimensional-scaling plot. As shown in Panel D, particular genes of interest can be further studied through the use of a large number of arrayed, paraffin embedded tumor specimens, referred to as tissue microarrays. As shown in Panel E, immunohistochemical analyses of hundreds or thousands of these arrayed biopsy specimens can be performed in order to extend the microarray findings.
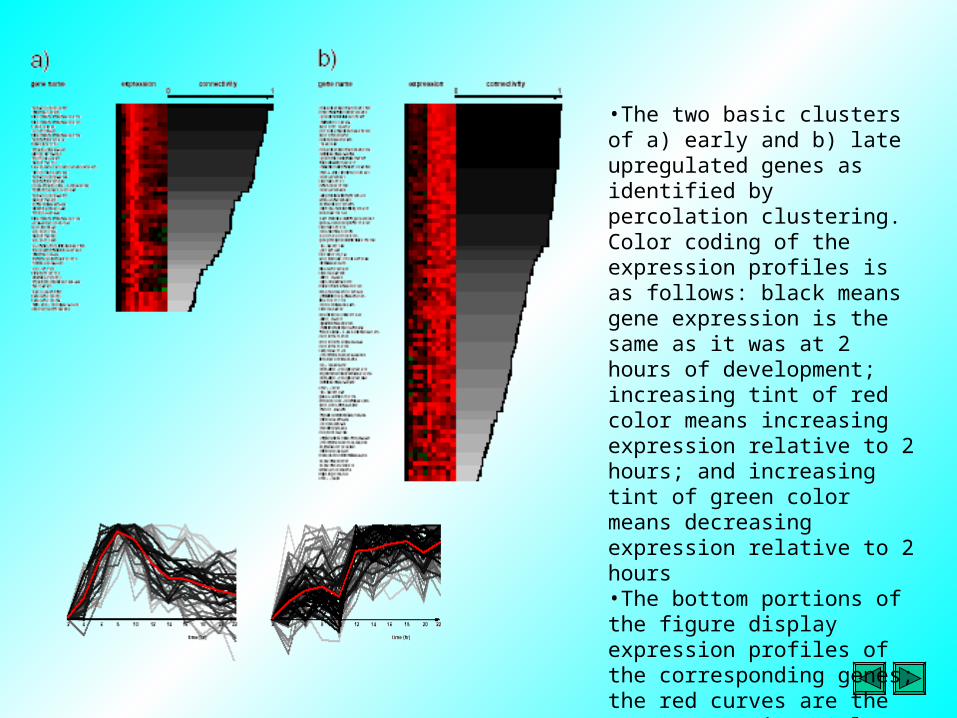
•The two basic clusters of a) early and b) late upregulated genes as identified by percolation clustering. Color coding of the expression profiles is as follows: black means gene expression is the same as it was at 2 hours of development; increasing tint of red color means increasing expression relative to 2 hours; and increasing tint of green color means decreasing expression relative to 2 hours•The bottom portions of the figure display expression profiles of the corresponding genes; the red curves are the mean expression. Only genes whose connectivity to the cluster origins is greater than 20% were included in these plots.
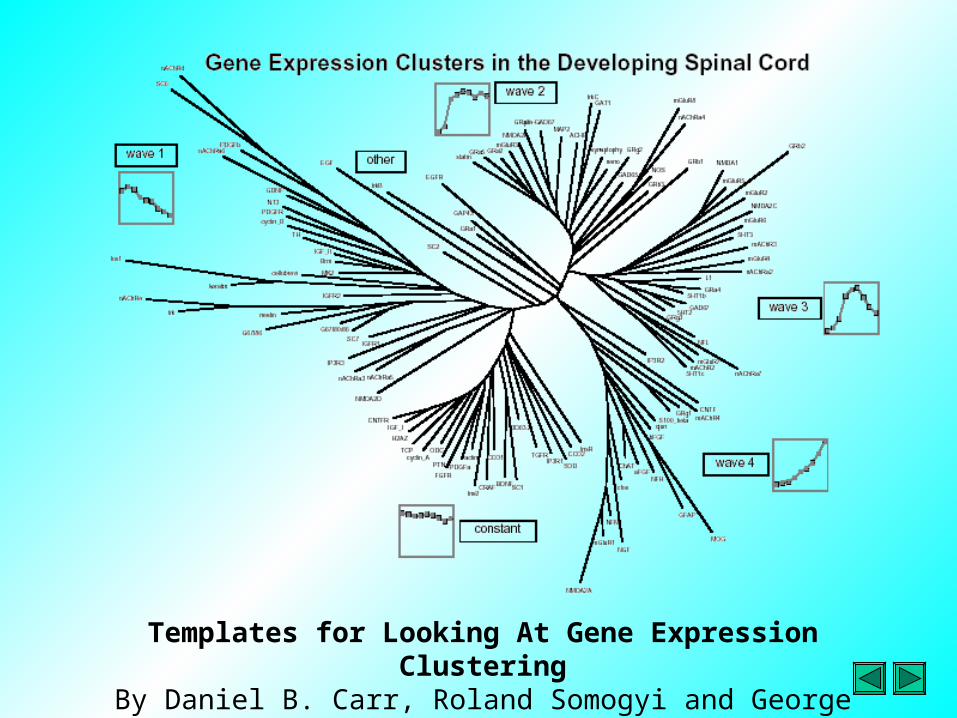
Templates for Looking At Gene Expression ClusteringBy Daniel B. Carr, Roland Somogyi and George Michaels

Gene co-expression pairs in CNS development and injury
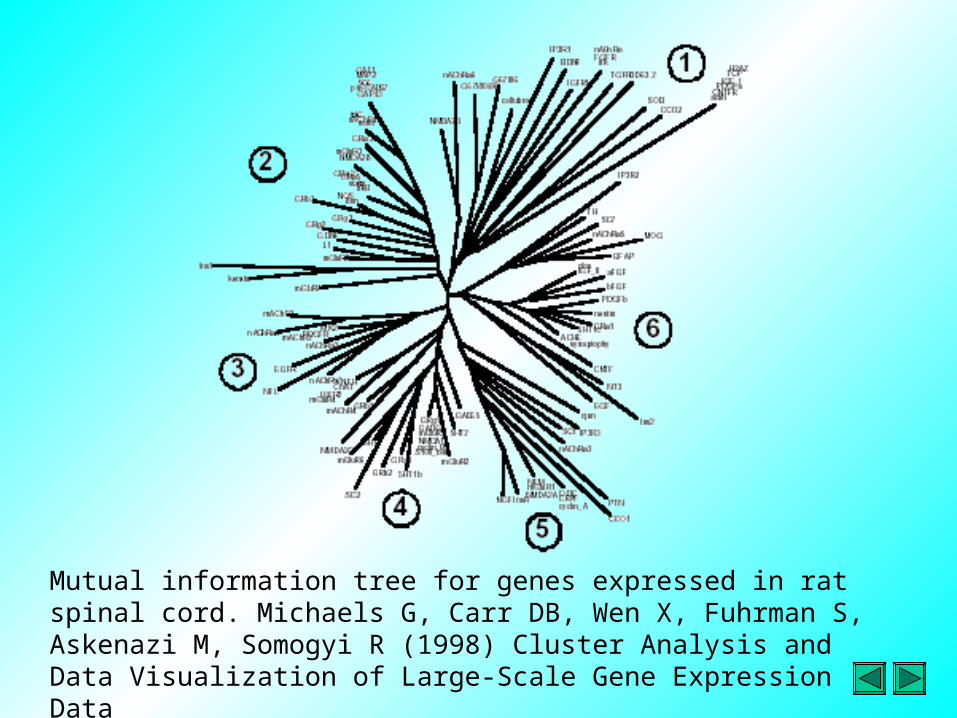
Mutual information tree for genes expressed in rat spinal cord. Michaels G, Carr DB, Wen X, Fuhrman S, Askenazi M, Somogyi R (1998) Cluster Analysis and Data Visualization of Large-Scale Gene Expression Data

Gene expression waves. (a) Normalized gene expression trajectories from Fig. 2 are shown grouped by ‘‘waves’’ determined by Euclidean distance clustering. Graphs show average normalized expression pattern or ‘‘wave’’ over the nine time points for all the genes in each cluster (the time of birth is marked by a vertical line). Within each wave, genes are grouped according to gene families, not according to proximity as determined by Euclidean distance. (b) Euclidean distance tree of all gene expression patterns (for annotated tree, see http://rsb.info.nih.govymol-physiolyPNASytree.html). Major branches correspond to waves in a. (c) Plots of all normalized time series, highlighting wave 3 (Left, white lines) and a subcluster of wave 3 (Right, white lines plotted on top of remaining genes of wave 3 in red). Subclusters (secondary branching) were selected by visual inspection from tree in b; e.g., the plotted time series of the wave 3 subcluster correspond to branchlet highlighted in white within wave 3 in b. (d) PCA. Principal components projection viewed as a three-dimensional stereo plot. Each point mapped in three-dimensional space represents an expression time series corresponding to a gene in Fig. 2. Highlighted points correspond to Euclidean distance wave 3 (red triangles), wave 4 (green squares), and the remaining genes (blue octagons)

Molecular pathway resources
• There are many resources for viewing molecular pathways on the Internet
• One of the most comprehensive for metabolic pathways is KEGG and this also shows a selected range of regulatory pathways
• An important feature of such resources is that the contents of the maps are integrated with other databases by way of hyperlinks
Part
3
Protein Protein InteractionsInteractions

Interactions and pathways• Proteins that physically interact with each
other may be involved in the same molecular pathway or network, or may form part of a multi-subunit complex
• Using this principle, pathways can be reconstructed based on evidence of protein interactions
• However, information from other sources – e.g. gene expression patterns and mutant phenotypes – may also be useful

Handling Y2H data• Yeast two-hybrid (Y2H) screens produce large
amounts of protein interaction data, but there is a relatively high level of spurious results (false positives and false negatives)
• This problem can be addressed by scoring interactions for reliability, based either on the repeatability of interactions over multiple experiments, or by the number of times a given bait will trap independent clones representing the same prey
• Even so, similar large-scale screens tend to identify different (although) overlapping sets of interactions

Protein interaction databases
• Several databases have been set up to store the interaction data arising from large-scale Y2H screens
• However, much more information on protein interactions is available in the scientific literature and a current challenge in bioinformatics is the assimilation of these interaction data from diverse sources

The interactome
• It is sum of all protein interactions in the cell• The simplest way to represent protein
interactions is a graph with proteins as nodes and interactions as links
• However, when large numbers of proteins are considered, the graphs become too complex
• They can be simplified by clustering functionally similar proteins, resulting in a functional interaction map that links fundamental cellular processes

Part
4
Modeling Modeling Regulatory Regulatory NetworksNetworks

The cell• It can be regarded as a compartmentalized set
of molecular pathways and networks distributed in space and restricted by membranes
• Any model of a cell must incorporate these features
• A useful modeling resource is Virtual Cell, in which the cell is defined as a collection of structures, molecules, reactions and fluxes
• The user can define biological or mathematical models for cell function

Modeling tissues and organs• Tissues and organs comprise organized
population of interdependent cells• Modeling depends on an accurate description
of the geometry of the tissue and must include any time-dependent processes
• For example, modeling the heart requires a description of its anatomy and the way in which action potentials are propagated
• The model must take into account the fact that cardiac muscle is an anisotropic system

Modeling organisms
• In order to model an entire organism, it is necessary to have a sound understanding of the principles underlying development
• For most multicellular organisms there is too little information and the developmental program too complex for this to be achieved

Nematode C. elegans modeled• The nematode has a number of features that make it
an ideal system upon which to base a developmental model
• It is a simple organism (it has about 1000 somatic cells) whose somatic cell lineage is invariant, making perturbations in development very easy to identify
• The genome has been sequenced; indeed, it was the first genome of a multicellular organism to be sequenced
• It also relatively easy to study the physiology of this organism, and hence a complete wiring diagram of C. elegans nervous system is available

Modeling spaces
• Models of C. elegans development have been generated based on the concept of three spaces:– Genomic space– Cellular space– Developmental space
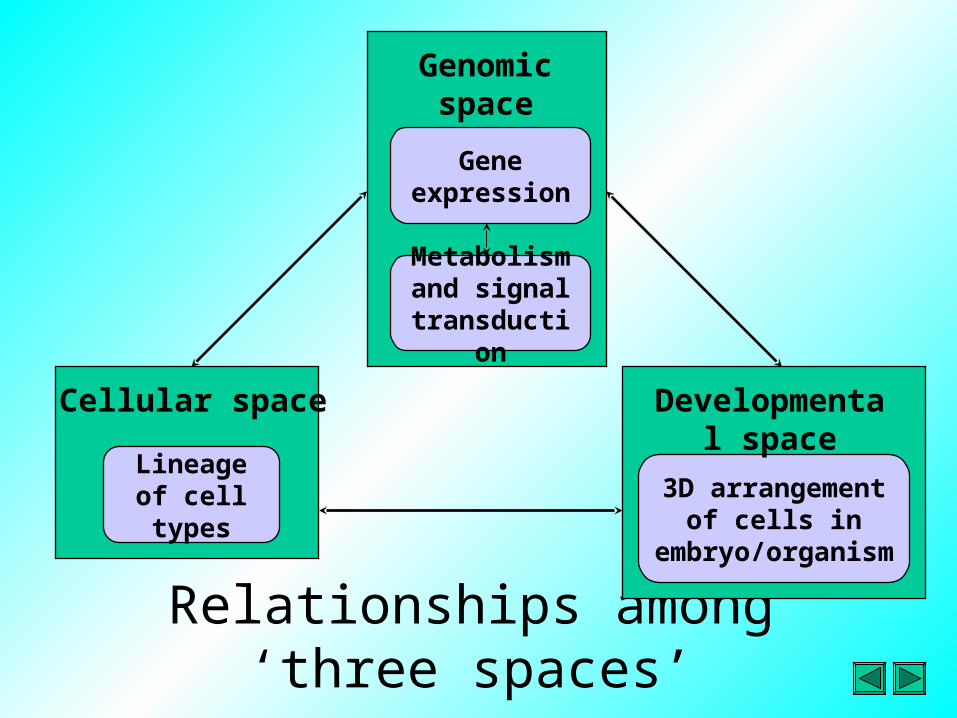
Relationships among ‘three spaces’
3D arrangement of cells in
embryo/organism
Developmental space
Lineage of cell types
Cellular space
Metabolism and signal
transduction
Genomic space
Gene expression