Embed Size (px)
Citation preview

Creative Education, 2017, 8, 1044-1068 http://www.scirp.org/journal/ce
ISSN Online: 2151-4771 ISSN Print: 2151-4755
DOI: 10.4236/ce.2017.87076 June 8, 2017
Higher Education Quality and Student Satisfaction Nexus: Evidence from Zambia
Bruce Mwiya, Justice Bwalya, Beenzu Siachinji, Shem Sikombe, Hillary Chanda, Moffat Chawala
School of Business, Copperbelt University, Kitwe, Zambia
Abstract This paper contributes to the service quality literature by applying the service performance (SERVPERF) model in an under-researched Zambian universi-ties context. Therefore, it examines the influence of each service quality di-mension on overall service satisfaction and behavioural intentions in terms of loyalty and positive word of mouth. Based on a quantitative correlational de-sign, primary data were collected from 656 senior final year undergraduate students at one public university. The findings indicate that service quality performance dimensions (tangibility, reliability, responsiveness, empathy and assurance) are each significantly positively related to overall customer satis-faction which in turn affects behavioural intentions. For scholars, administra-tions and policy makers, the study shows that the service performance model is a valid and useful framework for assessing and monitoring how students form their service quality perceptions and behavioural intentions. This paper is the first to extend the service performance model of service quality into the under researched developing country context of higher education in Zambia.
Keywords Service Quality, University, Customer Satisfaction, Zambia
1. Introduction
In the 21st century, the purpose of universities is threefold: Knowledge creation, utilising and sharing (van Schalkwyk & Steenkamp, 2014; Umashankar & Dutta, 2007). In education, students are customers who come in contact with universi-ties at a fee for the purpose of acquiring knowledge and skills (Abili, Thani, Mokhtarian, & Rashidi, 2011; Doherty, 2008). All this is undertaken in order to equip, enrich and extend human understanding for social and economic devel-opment. Therefore, to enhance national competitiveness, university education should be the leading system for preparing and equipping the workers to be-
How to cite this paper: Mwiya, B., Bwalya, J., Siachinji, B., Sikombe, S., Chanda, H., & Chawala, M. (2017). Higher Education Qual-ity and Student Satisfaction Nexus: Evi-dence from Zambia. Creative Education, 8, 1044-1068. https://doi.org/10.4236/ce.2017.87076 Received: April 14, 2017 Accepted: June 5, 2017 Published: June 8, 2017 Copyright © 2017 by authors and Scientific Research Publishing Inc. This work is licensed under the Creative Commons Attribution International License (CC BY 4.0). http://creativecommons.org/licenses/by/4.0/
Open Access

B. Mwiya et al.
1045
come highly skilled, creative, innovative and professional. Therefore, an evalua-tion of education service quality becomes important.
The higher education sector in Zambia is divided into two subsectors: the universities subsector and the subsector in relation to colleges and trade insti-tutes. The Higher Education Authority (HEA) is a government institution estab-lished under an Act of parliament No. 4 of 2013. The purpose of the HEA is to register and regulate universities in order to ensure quality of delivery of servic-es. The HEA is expected to provide this oversight by offering quality assurance, regulatory and advisory services. However, besides registering new universities, the HEA is yet to begin executing the other responsibilities related to service quality. Since political independence from the British in 1964 to the year 2000, the country only had 2 public universities. However, from the year 2000 to 2017, the number of public universities has increased to 6 while the number of private universities has grown from 0 to 55 (Higher Education Authority, 2017). This entails that competition in the subsector has grown but mechanisms to assess and monitor service quality are yet to be devised let alone implemented. This necessitates baseline studies on the quality of higher education services from the perspectives of various stakeholders.
Universities require information and feedback on the quality of academic and administrative services they provide. This would enable them to set priorities for resource allocation, strengthen competitive capabilities for marketing and pro-motion purposes and seek differentiation from competitors (Cardona & Bravo, 2012; Lam, Fong, Lauder, & Lam, 2002). The quality of university education is fundamental to a country’s development because university prepares the profes-sionals who should be effective and efficient managers as well as technocrats in private and public firms to meet the various current and future needs of society (Pereira, Oliveira, Tinoca, Amante et al., 2009). Thus, universities need to keep in perspective the ultimate needs and interests of students, employers, alumni, parents, sponsors and government, inter alia (Rózsa, 2013). Students are consi-dered to be the most important stakeholder of educational quality. This is be-cause it affects them directly both in the short and long term. In fact, scholars indicate that satisfaction of other stakeholders such as parents, employers, sponsors and regulators is dependent on the satisfaction of students (Ahmed, Nawaz, Ahmad et al., 2010).
Globally, there is a small but growing body of literature on service quality in higher education. Prior studies exploring service quality in higher education in Colombia (Cardona & Bravo, 2012), Jordan (Twaissi & Al-Kilani, 2015), Petruz-zellis, D’Uggento & Romanazzi (2006) in Italy and Portugal (Brochado, 2009), suggest that customer satisfaction can be explained by perceived service quality. However, besides Helgesen and Nesset (2007) in Norway as well as Brown & Mazzarol (2009) in Australia and Ali et al. (2016) in Malaysia who explore the link between student satisfaction and loyalty, there is a shortage of studies link-ing service quality, student satisfaction and behavioural intentions of loyalty and positive word of mouth. The implication is that, to maintain relevance and as-

B. Mwiya et al.
1046
sure their own survival, universities, whether in developed or developing coun-tries, should deliberately put in place mechanisms to assess, monitor and im-prove appropriate elements of service quality. Unfortunately, African countries are under-researched in terms of university service quality and this limits gene-ralisability of prior research conclusions. In fact, literature with a Zambian con-text is non-existent. Reproducibility and replicability are at the heart of science and critical to the development of knowledge in any scientific field (Evan-schitzky et al., 2007). The Academy of Management Journal (AMJ), globally the top most journal in business and management research, indicates that replica-tion research is important for enhanced confidence in existing knowledge even for seemingly well understood relationships. This is especially so if a) internal or external validity issues are not yet settled for whatever reasons (e.g. limited con-texts of prior research) and b) there is an empirically established relationship that should serve as a basis for broad theorising in a field or that has compa-ny-wide or public policy implications (Eden, 2002; Miller & Bamberger, 2016: p. 314).
Zambia is a lower middle-income country with per capital income at US$, 1490 (World Bank, 2017). The country has a collectivist culture where people regard themselves as “we” rather than “I”, thus individuals feel responsible for the well-being of others including the organisations they belong to or study in (Mwiya, 2014; Hofstede, 2017). In addition, culturally, Zambia has high power distance and low masculinity scores (Hofstede, 2017) and so individuals are ex-pected not only to respect and not question authority but also to be seen to be supportive of others. This may have an influence on how individuals evaluate service quality elements. Therefore, it would be insightful for scholars, practi-tioners and policy to explore if prior research findings can hold in such a differ-ent context.
The consequences of lack of research in the Zambian context are that stake-holders have no context specific evidence of the applicability of frameworks in extant literature to assess quality, develop strategies and set resource allocation priorities to improve quality. The lack of context specific research evidence en-tails that universities have inadequate information on their capabilities and areas requiring improvement in order to meet/exceed the expectations of stakehold-ers. Moreover, while the three public and prominent universities still have larger market share, competition is increasing due to a proliferation of private and public universities in Zambia from 2 in 1990 to 61 in 2016 (Ministry of Educa-tion Report, 2016; Higher Education Authority, 2017).
Therefore, the aim of this study is to assess the applicability of the service quality model (SERVPERF) in the under-researched Zambian universities con-text and to examine the effect of perceived service quality on student satisfaction and behavioural intentions. The rest of the paper is structured as follows: firstly, extant literature is reviewed and hypotheses developed; secondly, the methods and measurement model are described before reporting and discussing the findings of the study. Lastly, conclusions, limitations and directions for future research are highlighted.

B. Mwiya et al.
1047
2. Literature Review and Hypotheses 2.1. Service Quality and Customer Satisfaction in
Higher Education
The Concept of Quality in Higher Education The concept of quality applied to goods is not extendable to the services sector
(Parasuraman, Zeithaml, & Berry, 1985). This is because while goods have phys-ical cues for inferring quality, quality in services is underpinned by “experience” and “credence” factors. In addition, because services are performance-oriented, intangible, heterogeneous and inseparable, it is challenging to measure quality (Abili, Thani, & Afarinandehbin, 2012). Furthermore, it is also not easy to pro-vide the same quality to all customers all the time. Scholars indicate that service quality is the single most essential competence for survival, sustainability and growth, even for higher education institutions (van Schalkwyk & Steenkamp, 2014). Scholars also indicate that it is becoming more difficult to attract stu-dents, since the new generation of students has more influence, greater aware-ness as consumers, becoming more interactive and selective about the future (Zafiropoulos & Vrana, 2008).
Generally, service quality is the overall assessment of a service by either a cus-tomer or any other stakeholder; does the service meet/exceed expectations i.e. is it fit for purpose (Eshghi, Roy, & Ganguli, 2008). It is a judgement or attitude relating to the overall excellence or superiority of a service (Khodayari & Kho-dayari, 2011). Simply put, perceived service quality is an overall evaluation of the goodness or badness of a service (Twaissi & Al-Kilani, 2015). Providing high service quality helps not only to retain the existing customers but also to attract new ones as a consequence of positive recommendations to other stakeholders e.g. prospective students, employers, guardians, sponsors and regulators (Ladha-ri, 2009; Negi, 2009). This entails that universities operating in a competitive en-vironment have to consider how to deliver high quality service to meet the needs of stakeholders (DeShields Jr., Kara, & Kaynak, 2005). Institution-wide student feedback about the quality of their total educational experience is an area of grow-ing activity in universities globally (Cardona & Bravo, 2012; Zineldin, 2007).
Service Quality Frameworks in Higher Education Generally, there is a preponderance of literature on service quality in relation
to different service industries and sectors. Regarding the proper definition of service quality and how it should be measured, there has been debate among re-searchers. For instance, research shows that there is no consensus on the defini-tion of “service quality” in higher education institutions which by extension has raised controversy in measurement methodologies (Doherty, 2008; Brochado, 2009). Therefore, a number of service quality frameworks are being employed to assess service quality.
To assess service quality in universities, some studies have used SERVQUAL (Service Quality) model developed by Parasuraman et al. (1988). According to the authors, service quality can be measured by focusing on five key dimensions namely, reliability, assurance, tangibility, empathy and responsiveness (Parasu-

B. Mwiya et al.
1048
raman, Zeithaml, & Berry, 1988). Service quality level is thus determined by comparing customer perceptions with expectations. While customer perceptions are subjective evaluations of actual service experience, expectations are reference points against which actual service is judged (Brochado, 2009; Zeithaml, Bitner, & Gremler, 2006). Despite its popular application, the SERVQUAL has been cri-ticised by some scholars for its shortcomings at both conceptual and operational levels (Buttle, 1996). To overcome the shortcomings, the SERVPERF (Service Performance) model was developed. SERVPERF is a variant of the SERVQUAL model that adopts a performance based approach to measuring service quality by focusing only on the perceptions component (Brochado, 2009; Cronin Jr. & Taylor, 1994).
More recently, some other frameworks have been proposed in a quest to im-prove accuracy in assessing university service quality. Icli and Anil (2014) pro-posed a new scale, called HEDQUAL, for measuring service quality in higher education institutions. This model has only been assessed in Master of Business Administration (MBA) programmes. The scale focuses on five key dimensions namely, academic quality, administrative service quality, library service quality, quality of providing career opportunities and supporting services (Icli & Anil, 2014). Other studies have employed the HEdPERF model which is a 41-item scale focusing not only on academic aspects but also the service environment (Abdullah, 2006; Brochado, 2009; Ali et al., 2016). The authors conceptualise academic quality as comprising five dimensions namely, non-academic aspects, academic aspects, reputation of learning institution, access and programme issues.
Last but not least, Zineldin (2007) proposed a framework, called 5Q. This comprises five key dimensions namely, quality of object, quality of process, quality of infrastructure, quality of interaction and communication, as well as quality of atmosphere (Zineldin, 2007; Zineldin, Akdag, & Vasicheva, 2011). According to the author, quality of object implies the education services or the reason students are studying while quality of process refers to how the object is delivered. Whereas quality of infrastructure focuses on the basic resources needed to deliver educational services, the quality of interaction and communi-cation measures the relationships between the institution and the students as well as how these are managed. Lastly, quality of atmosphere refers to trust, se-curity and competitive positioning reflecting the institution.
Despite the lack of consensus in measurement methodologies for service qual-ity in higher education, the SERVQUAL framework has been widely recognised and applied to assess quality from the students’ perspective (Abili, Thani, & Afa-rinandehbin, 2012; Saadati, 2012; Seymour, 1992; Twaissi & Al-Kilani, 2015). However, comparing the two most popular models, i.e. SERVQUAL and SERVPERF, research has empirically tested and proven the latter to be a better measure of service quality (Adil, Akhtar, & Khan, 2013; Brochado, 2009; Cronin Jr. & Taylor, 1992; Dabholkar, Shepherd, & Thorpe, 2000). In addition, Dabhol-kar et al. (2000) posit that the SERVPERF model is appropriate if the objective is to determine causal relationships for service quality dimensions. Based on these

B. Mwiya et al.
1049
reasons, the present research employed the SERVPERF model to assess quality in higher education.
Customer Satisfaction in Higher Education Customer satisfaction has been defined as the experience that a customer has
with a service encounter in reference to what was expected (Oliver, 1980; Zei-thaml, Bitner, & Gremler, 2009; Zeithaml et al., 2006). It is outcome related whereby the customer com-pares what they had before and after experiencing a product or service (Aydin, Ozer, & Rasil, 2005; Oliver, 1999). In simple terms, it is the feeling associated with the out-come that is equal or beyond what was ex-pected. Satisfaction is thus based on the ability of a service provider to meet or surpass the expectations of a customer (Khan & Matlay, 2009; Rezaei, Rezaei, Alipour, & Salehi, 2011). Marketing literature indicates that satisfaction operates at two levels namely; transaction-specific and overall i.e. general (Yi, 1991). Transaction specific satisfaction is related to each and every encounter with a product while Overall satisfaction is the cumulative sum of all the previous sa-tisfactions (Johnson & Fornell, 1991; Jones & Suh, 2000; Rezaei et al., 2011).
With respect to higher education, García-Aracil (2009) argue that there is no gener-ally accepted definition of customer satisfaction (García-Aracil, 2009). Nevertheless, there seems to be a consensus as regards conceptualising the stu-dent as the main customer of higher education institutions towards whom ser-vice performances are centred (Senthilkumar & Arulraj, 2011; Yunus, Ishak, & Razak, 2010). Indeed, this why in reference to universities some studies employ the phrase “student satisfaction” as opposed to “customer satisfaction” (Cardona & Bravo, 2012; Farahmandian, Minavand, & Afshardost, 2013; de Jager & Gba-damosi, 2013; Sumaedi, Bakti, & Metasari, 2011; Yunus et al., 2010). Stu-dents’ satisfaction reflects outcome related experiences with university services in comparison to pre–consumption expectations. Likewise, the totality of satisfac-tions with specific service encounters leads to overall students’ satisfaction. Stu-dent satisfaction is deemed as an important construct for understanding beha-vioural intentions or outcomes at the individual student level. It is also essential for considering strategies that may be used to attract and retain students for fu-ture programmes at an organisational level (Negricea, Edu, & Avram, 2014).
In relation to measurement approaches, customer satisfaction models have focused on the service quality gap (Parasuraman, Zeithaml, & Berry, 1994) which com-pares expectations to actual service delivered (Oliver, 1980; Rezaei et al., 2011). On the other hand, some studies have used use a single item measure to assess overall customer satisfaction (Aydin et al., 2005; Caruana, Money, & Berthon, 2000; Ismail, Harson, Ibrahim, & Isa, 2006; de Jager & Gbadamosi, 2010; Theodorakis, Kambitsis, & Laios, 2001). In this study, student satisfaction is evaluated using a single item measure to capture overall satisfaction of stu-dents.
2.2. Service Quality, Customer Satisfaction and Behavioural Outcomes
Extant literature indicates that quality of a service is an antecedent to overall sa-
B. Mwiya et al.
1050
tisfaction for students (Arambewela & Hall, 2006; Cardona & Bravo, 2012; Naik, Gantasala, & Prabhakar, 2010; Parasuraman et al., 1994; Zineldin, 2007). de Jag-er and Gbadamosi (2010) posit that quality of service affects students’ overall experience and success of programmes as it ensures continued students’ patro-nage. A recent study by Jiewanto et al. (2012) also concluded that service quality has a positive impact on student satisfaction. Further, previous research shows that there is a relationship between service quality dimensions and behavioural outcomes. For instance, in Jordan, Twaissi and Al-Kilani (2015) studied the im-pact of perceived service quality on students’ behavioural intentions and found that the perceived reliability, tangibility and assurance dimensions had an effect on the students’ intentions to recommend their university to others.
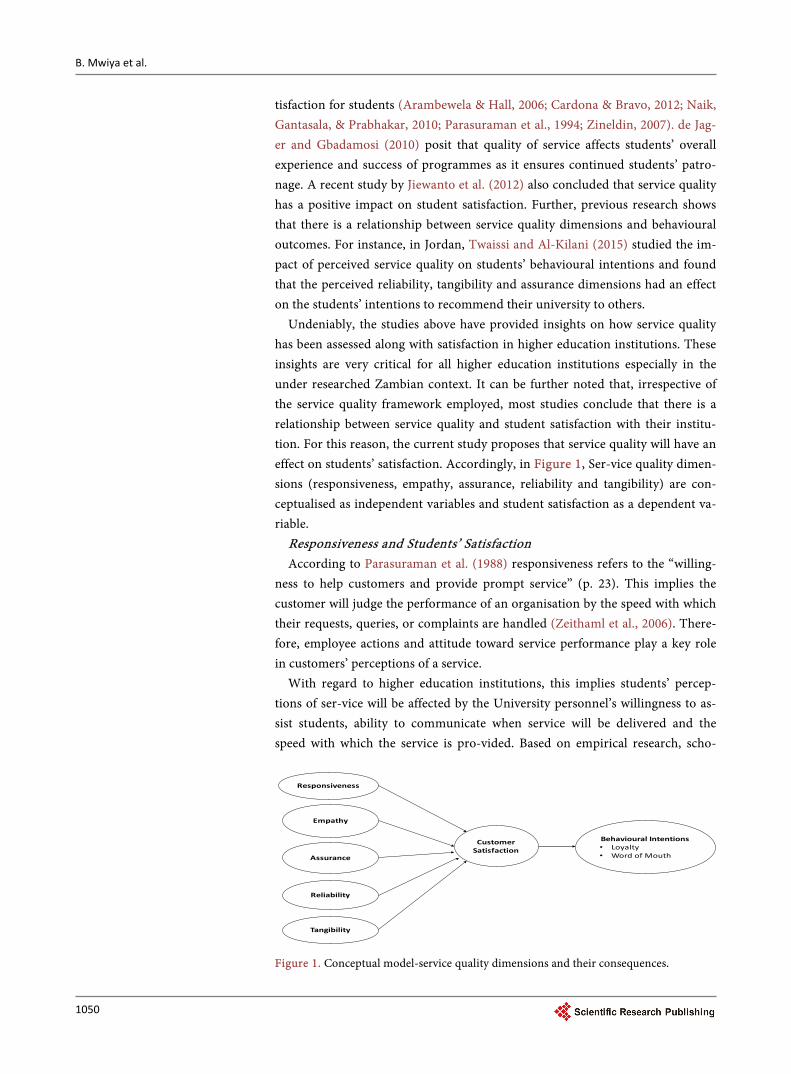
Undeniably, the studies above have provided insights on how service quality has been assessed along with satisfaction in higher education institutions. These insights are very critical for all higher education institutions especially in the under researched Zambian context. It can be further noted that, irrespective of the service quality framework employed, most studies conclude that there is a relationship between service quality and student satisfaction with their institu-tion. For this reason, the current study proposes that service quality will have an effect on students’ satisfaction. Accordingly, in Figure 1, Ser-vice quality dimen-sions (responsiveness, empathy, assurance, reliability and tangibility) are con-ceptualised as independent variables and student satisfaction as a dependent va-riable.
Responsiveness and Students’ Satisfaction According to Parasuraman et al. (1988) responsiveness refers to the “willing-
ness to help customers and provide prompt service” (p. 23). This implies the customer will judge the performance of an organisation by the speed with which their requests, queries, or complaints are handled (Zeithaml et al., 2006). There-fore, employee actions and attitude toward service performance play a key role in customers’ perceptions of a service.
With regard to higher education institutions, this implies students’ percep-tions of ser-vice will be affected by the University personnel’s willingness to as-sist students, ability to communicate when service will be delivered and the speed with which the service is pro-vided. Based on empirical research, scho-
Figure 1. Conceptual model-service quality dimensions and their consequences.
Empathy
Assurance
Reliability
Customer Satisfaction
Behavioural Intentions• Loyalty• Word of Mouth
Tangibility
Responsiveness

B. Mwiya et al.
1051
lars in Australia (Arambewela & Hall, 2006), Pakistan (Kundi, Khan, Qureshi, Khan, & Akhar, 2014), Malaysia (Wei & Ramalu, 2011) and Indonesia (Jiewanto, Laurens, & Nelloh, 2012) establish that responsiveness has an impact on stu-dents’ satisfaction. That is, students that perceive a University as responsive will be more satisfied than those that do not. Therefore, this study posits as follows:
H1: responsiveness positively influences student satisfaction with education services
Empathy and Students’ Satisfaction Parasuraman et al. (1988) explain empathy as “caring, individualised attention
given to customers” (p. 23). Typically, the individual customer forms percep-tions of actual service based on how the treatment they get makes them feel spe-cial, unique and that their needs are understood (Zeithaml et al., 2006). In other words, empathy relates to the interactional quality (Pollack, 2008). In relation to higher education, empathy reflects such things as giving individualised attention and understanding the needs of students by all university staff that interact with students. Empirical research in Malaysia (Wei & Ramalu, 2011), Iran (Rezaei et al., 2011) and in Pakistan (Kundi et al., 2014) concluded that empathy has an in-fluence on students’ satisfaction. Thus, the higher the perceived empathy, the more satisfied the student will be and vice versa. Consequently, this study post-ulates as follows:
H2: empathy has a positive relationship with student satisfaction with educa-tion services
Assurance and Students’ Satisfaction Parasuraman et al. (1988) refer to assurance as “employees’ knowledge and
courtesy and their ability to inspire trust and confidence” (p. 23). According to Pollack (2008), assurance is also concerned with the quality of interaction. Ideally, this refers to the extent to which an individual feels the organisation in-stils trust and confidence (Zeithaml et al., 2006). As regards higher education in-stitutions, assurance implies that students judge service performance based on the politeness, courteousness, friendliness and ability of university staff to ex-plain clearly the aspects of a service. Empirically prior research in Columbia (Cardona & Bravo, 2012), Indonesia (Jiewanto et al., 2012; Sumaedi et al., 2011) and Malaysia (Farahmandian, Minavand, & Afshardost, 2013; Yunus et al., 2010) establish that there is positive relationship between assurance and students’ sa-tisfaction. There-fore, this study hypothesises as follows:
H3: assurance has a positive effect on student satisfaction with education ser-vices
Reliability and Students’ Satisfaction Parasuraman et al. (1988) conceptualise reliability as the “ability to perform
the promised service dependably and accurately” (p. 23). This generally entails that the firm delivers on its promises regarding outcome and core service attributes (Zeithaml et al., 2006). For the customer, what is important is not only what the firm promises but whether or not it actually delivers on those promises. Little wonder, Pollack (2008) relates reliability to outcome quality. In terms of

B. Mwiya et al.
1052
higher education institutions, reliability reflects the university’s ability to provide the service at the promised times, keeping students’ records (academic reports, students’ results, etc.) and performing error-free services. Empirically studies in Romania (Negricea et al., 2014), Australia (Sultan & Wong, 2012) and Malaysia (Hasan, Ilias, Rahman, & Razak, 2009; Hassan & Ibrahim, 2010) concluded that reliability has an influence on students’ satisfaction. Thus, students are more satis-fied if the perceived reliability quality is high. Therefore, the study proposes that:
H4: reliability positively influences students’ satisfaction with education ser-vices
Tangibility and Students’ Satisfaction Parasuraman et al. (1988) define tangibles as the “appearance of physical facil-
ities, equipment, personnel, and written materials” (p. 23). Tangibility in other words relates to the physical environment quality (Pollack, 2008). Since services are intangible by nature, tangible elements enable individuals to form percep-tions of service based on what they see. In higher education institutions, the tan-gibility aspects refer to the things that students see to judge a service. These visi-ble things include equipment (e.g. computers, projectors, etc.), physical facilities (buildings, furniture, and classroom environment), printed university material and the university personnel’s appearance. Empirical studies in Malaysia (Fa-rahmandian, Minavand, & Afshardost, 2013; Rajab, Rahman, & Shaari, 2011), Pakistan (Kundi et al., 2014), Jordan (Twaissi & Al-Kilani, 2015), establish that tangibility has an influence on student satisfaction. Likewise, the higher the per-ceived tangibility, the more satisfied the student will be. In line with this, the study suggests that:
H5: tangibility positively influences students’ satisfaction with education ser-vices
Student Satisfaction and Behavioural Intentions Scholars in marketing indicate that there is a link between customer satisfac-
tion and customer loyalty (Walsh et al., 2009). This is because a firm that con-sistently provides good quality products helps to reduce perceived risks in the minds of the customers and therefore reduces the need for customers to search for alternative service provides. This reduces transaction costs. Walsh et al. (2009: p. 193) adduces evidence, based on a German energy company customers, that this would result in customer loyalty reflected in repeat business. In addi-tion, other scholars (Sundaram, Mitra, & Webster, 1998: p. 3) in the USA adduce evidence form customers of automobile and electronic products that, based on experience with the physical goods of the firm, consumers engage in positive word of mouth for various reasons including helping the receiving of the infor-mation; helping the entity that provides high quality products and positive ser-vice experience; and penalising the firm that does not give a positive service ex-perience. This study extends these concepts of loyalty and positive word of mouth to the university service context. When it comes to university students, it is expected that those students who express satisfaction with the service offered by their university, would also express loyalty to the university and engage in

B. Mwiya et al.
1053
positive word of mouth to others about the university. Practically, this entails that loyalty will be reflected in the intention to pursue further studies with the same university and positive word of mouth would be reflected in the intention to recommend the university to other people such as friends and relatives. Therefore, the study posits as follows:
H6: Student Satisfaction is positively related to Loyalty to the University; H7: Student Satisfaction is positively associated with positive word of mouth
about the university. Based on the foregoing hypotheses, the conceptual Model in Figure 1 reflect
the direction of influence in the relationships between customer student satisfac-tion and service quality elements of responsiveness, empathy, reliability, assur-ance and tangibility.
3. Methods and Measurement
Population, sample and Data Collection The purpose of this study was to examine the relationship between the five
dimensions of higher education service quality and customer satisfaction. As such it employed a quantitative correlational design (Creswell, 2012; Saunders et al., 2009). Prior studies exploring service quality in higher education in Colom-bia (Cardona & Bravo, 2012), Jordan (Twaissi & Al-Kilani, 2015) and Portugal (Brochado, 2009) have used a similar approach. In line with extant literature highlighting the need for universities to have on-going mechanisms to obtain institution-wide student feedback about the quality of their total educational ex-perience (Cardona & Bravo, 2012), this study focused on the student population of one of the oldest and largest public universities in an under-researched de-veloping country context of Zambia.
Mindful of external validity, with a total student population of 12,000 (final year undergraduate students at 3000), the minimum required representative sample size would be 341, at confidence level of 95% and margin of error of 5% (Saunders et al., 2009: p. 212, 585). To reduce the likelihood of low response rate 700 questionnaires were distributed; 656 were dully completed and returned to the researchers representing a 93.7% response rate. Final year students were par-ticularly targeted because they had been at the university for more than 3 years and so they had more experience with the quality of various services. Addition-ally, impending graduation compels them to consider whether to start looking for employment or pursue further studies and at which university.
The study employed proportionate stratified sampling in selecting the sample elements based on different faculties. As for data collection, a survey was under-taken by using a self-administered questionnaire. With the help of faculty mem-bers, the questionnaire was distributed to students before the commencement of class and was collected at the end of the class. Before administering the ques-tionnaire, the purpose of the study was explained to the respondents and then for those willing to participate, informed consent was signed by the participants prior to data collection. The resulting sample profile is given in Table 1 below

B. Mwiya et al.
1054
Table 1. Respondents’ profile.
Variables
Mean Frequency Percentage
Age (years)
26.47
Gender
Male
325 49.54
Female
331 50.46
Field of Study
Business
514 78.83
Non-Business
138 21.17
showing 656 full time final year undergraduate students, 50.46% female and 49.54% male, 78.83 % business students and the rest non-business students in natural sciences, natural resources and engineering degree programmes. The gender profile and the average age at 26.47 in the sample are typical of final year university students in Zambia (Mwiya, 2014: p. 156).
Measurement Model Validity
To assure internal validity, the questionnaire comprised 27 items adapted from prior similar studies in Portugal, South Africa, and Jordan (Cronin Jr. & Taylor, 1994; Brochado, 2009; van Schalkwyk & Steenkamp, 2014). The questionnaire comprised the 22 items on the five dimensions of higher education service qual-ity. Additionally, there was 1 item on overall customer satisfaction (“Iam satis-fied with overall educational experience at this university”). Further, 2 items were included to assess the behavioural intentions of loyalty (“I intend to later come back and pursue my postgraduate studies at this University’, and “After I graduate, I Intend to participate and financially contribute to the Alumni initia-tives to help my University”). Lastly, 2 items were included regarding the like-lihood of spreading positive word of mouth about the institution (“I would recommend to employers to employ graduates from my University” and “Based on my experience at the University, I would recommend this University to my friends and family”). All the items were gauged on a five-point Likert scale ranging from 1 = “strongly disagree” to 5 = “strongly Agree”. The questionnaire was pilot tested before mass distribution to ensure the questions were clear and where necessary correctly rephrased.
Factor analysis was performed (since sample was >150) to establish unidi-mensionality of constructs and validity of the independent variables (Pallant, 2016). Specifically, exploratory factor analysis with principal components extrac-tion and Varimax rotation was conducted. The assumptions for factorability of the data (with correlation coefficients above 0.30) were fulfilled since the Kais-er-Meyer-Olkin measure of sampling adequacy was 0.945 (minimum value re-quired 0.60), and Bartlett’s Test of Sphericity was significant (Approx. Chi-square = 7130.496, df = 23, p = 0.000). The cumulative percentage variance explained was 64.7%. To check for consistency and stability of items, Table 2 il-lustrates the factor loadings resulting in clear five dimensions of service quality

B. Mwiya et al.
1055
Table 2. Factor and reliability analyses for constructs.
Items Components
1 2 3 4 5
Tangibility 0.633
My university has up to date equipment 0.633
My university has physical facilities (e.g. buildings and furniture) that are attractive, visually appealing and stylish
0.557
Personnel at my university are well dressed and neat at all times 0.773
The materials at my University (e.g. pamphlets and study material) suit the image of the university
0.654
Reliability
when my university promises to do something by a certain time, it does so
0.688
When the students have problems, the personnel of my university are sympathetic and reassuring
0.741
My University is dependent and provides the service correctly the first time
0.696
My University provides services at the time promises it promises to do so
0.709
My University keeps its records accurately (e.g. accounts, academia reports, Student`s results etc.)
0.712
Responsiveness
My University tells students when services will be rendered
0.694
Students receive fast (prompt) service delivery from the University personnel
0.753
Lecturers at my University are willing to assist students
0.765
Personnel of the University are not too busy to respond to students' requests promptly
0.674
Assurance
Students are able to trust the personnel of the University
0.523
Personnel at my University inspire confidence
0.538
Personnel at my University are polite
0.640
Personnel receive adequate support from my University management to improve the performance of its services
0.745
Empathy
Students receive individualized attention from administrative personnel (e.g. doing something extra for students).
0.780
Lecturers give students individual attention
0.674
Personnel at my University know what the needs of their students are (e.g. recognizing students as clients)
0.649
The University personnel have the students' best interest at heart.
0.672
The University personnel are easily accessible to students (e.g. available to see or to contact by phone, email etc.)
0.714
Eigen Value 9.621 1.729 1.105 1.003 1.001
Variance Explained (64.680%) 21.897 17.247 9.154 8.619 7.772
Cronbach Alpha 0.763 0.852 0.708 0.830 0.869

B. Mwiya et al.
1056
with Eigen values above 1. All Cronbach’s Alpha values were above the mini-mum threshold of 0.70 (Pallant, 2016).
Prior to further bivariate and multivariate analyses, checks for missing data, outliers and normality were conducted on the scale data. Descriptive statistics revealed that missing data for the variables and respondents ranged between 1.2% and 3.3%. Missing data under 10% for each respondent or variable can generally be ignored because it does not have a significant adverse effect on any analyses. With regard to outliers, inspection of boxplots and comparison of ac-tual means with the 5% trimmed means for the variables revealed no extreme scores with strong influence on the means (Pallant, 2016). In relation to normal-ity for all variables, kurtosis and skewness were within the acceptable ±1 range for psychometric tests (George & Mallery, 2003).
4. Results
Correlation analyses Pearson correlation analysis was performed to assess the direction and
strengthen of relationships among all variables. Table 3 presents the correla-tions, means and standard deviations of the dependent variables (overall cus-tomer satisfaction, positive word of mouth and loyalty), independent variables (perceived responsiveness, perceived empathy, perceived assurance, perceived reliability, perceived tangibility) and control variables (actual age and gender). The results in Table 3 show relatively low correlations among variables (all of them below 0.8). This entails that multicollinearity is not a problem (Tabachnik, Fidell, & Tabachnick, 2007). Firstly, for the control variables, though both age and gender are positively correlated with customer satisfaction only age is sig-nificant. This means that older individuals are more likely to report satisfaction. Among several explanations, this could be because older individuals are less over-particular about their choices; probably because they understand the cons-
Table 3. Mean, Standard Deviation (SD) and correlation matrix.
Variable Mean SD N 1 2 3 4 5 6 7 8 9
1 Customer Satisfaction 3.239 1.048 641
2 Loyalty 3.201 0.934 645 0.438**
3 Positive Word of Mouth 3.843 0.919 639 0.563** 0.546**
4 Actual age 26.470 5.765 656 0.141** 0.214** 0.125**
5 Gender 0.500 0.500 653 0.025 −0.029 −0.030 0.073
6 Perceived Responsiveness 3.014 0.791 653 0.291** 0.297** 0.241** 0.246** 0.014
7 Perceived Empathy 2.831 0.929 653 0.299** 0.295** 0.296** 0.278** −0.067 0.635**
8 Perceived Assurance 2.866 0.898 653 0.308** 0.304** 0.278** 0.275** −0.067 0.679** 0.744**
9 Perceived Reliability 2.691 0.886 653 0.328** 0.336** 0.276** 0.232** −0.031 0.655** 0.582** 0.603**
10 Perceived Tangibility 2.749 0.789 653 0.373** 0.320** 0.290** 0.193** −0.055 0.548** 0.517** 0.562** 0.674**
**Correlation is significant is significant at the 0.01 level (2-tailed).

B. Mwiya et al.
1057
traints the country and the public university operates under. Another explana-tion is the notion that Zambia is a collectivist and feminine society with high power distance (Hofstede, 2017). Therefore, older individuals are more likely to conform to norms of society which dictate that one needs to be seen to respect authority and supportive of societal institutions. As a consequence, older indi-viduals would be less inclined to complain about any dissatisfaction with service quality.
Secondly, Table 3 indicates that student satisfaction is positively significantly correlated (all sig. ≤ 0.01) with each service quality dimension of university edu-cation i.e. tangibility (r = 0.373), reliability (r = 0.328), assurance (0.308), empa-thy (r = 0.299) and perceived responsiveness (r = 0.291). The effect sizes are generally medium based on Cohen’s criteria i.e. small = 0.10 to 0.29, medium .30 to 0.49 and large = 0.50 to 1.00 (Cohen, 1988). Thirdly, the significant positive correlations indicate that the higher the level of customer satisfaction, the higher the level of loyalty (r = 0.438, p < 0.01 with medium effect size, r2 = 0.205) and positive word of mouth (r = 0.563, p < 0.01 with large effect size, r2 = 0.317). This supports H6 and H7, which postulate that customer satisfaction is positively related to student loyalty and positive word of mouth recommendations. This means that individuals who are satisfied with the education service at the uni-versity are more likely to encourage friends and relatives to pursue their studies at the same university and they are also more likely to encourage employers to employ graduates from that university. Similarly, students who are satisfied with the education service are more likely to intend to return to the same university to pursue further studies or support the university as part of the alumni.
Hierarchical Regression analyses To evaluate the ability of the multiple regression model (where the service
quality dimensions are the explanatory variables) to predict customer satisfac-tion (outcome variable), after controlling for age and gender, hierarchical re-gression analysis was conducted. Table 4 presents the results with overall cus-tomer satisfaction as a dependent variable. The overall customer satisfaction model hypothesises that perceived responsiveness, perceived empathy, perceived assurance, perceived reliability and perceived tangibility are the main determi-nants of overall customer satisfaction (Rod, Ashill, Shao, & Carruthers, 2009). From Table 4, preliminary checks indicate that multicollinearity is not a prob-lem because the variance inflation factor (VIF) values were lower than 5 for the independent and control variables (Koe, 2016; Pallant, 2016). Further, all regres-sion coefficients are in the expected positive direction.
Model 1 shows the base model with control variables only i.e. actual age and gender. The control variables make a combined significant contribution of ad-justed multiple coefficient of determination (R-Square) of 1.7% and multiple correlation coefficient of (R) 0.141, representing a combined small effect size. Individually, actual age is significant while gender is not. The rationale for sig-nificant influence of age on customer satisfaction may be that as students progress to higher levels of study they become experienced and mature and are

B. Mwiya et al.
1058
Table 4. Hierarchical regression analyses.
Variable Model 1 Model 2 Model 3 Model 4 Model 5 Model 6 VIF
Beta, t, Beta, t, Beta, t, Beta, t, Beta, t, VIF
Control Variables Actual age 0.140***, 3.495 0.072, 1.818 0.047, 1.173 0.040, 1.002 0.034, 0.845 0.034, 0.866 1.112
Gender 0.015, 0.713 0.016, 0.411 0.032, 0.827 0.037, 0.827 0.040, 1.058 0.046, 1.241 1.025
Independent Variables
Perceived Responsiveness
0.273***, 6.888 0.161***, 3.245 0.115*, 2.136 0.038, 0.658 0.019, 0.338 2.364
Perceived Empathy
0.186***, 3.712 0.119*, 2.005 0.087, 1.459 0.074, 1.234 2.503
Perceived Assurance
0.133*, 2.137 0.099, 1.584 0.056, 0.905 2.822
Perceived Reliability
0.186***, 3.543 0.068, 1.186 2.431
Perceived Tangibility
0.243***, 4.658 1.990
R 0.141 0.300 0.332 0.341 0.367 0.405
R Square 0.020 0.090 0.110 0.117 0.134 0.164
Adjusted R Square 0.017 0.086 0.104 0.109 0.126 0.154
F-statistic 6.303** 20.333*** 19.01*** 16.209*** 15.855*** 17.148***
***sig < 0.001 (0.1 percent); **sig < 0.01 (1 percent); *sig < 0.05 (5 percent); VIF = Variance Inflation factor.
able to appreciate the significance of the university compared to other universi-ties in the country. It is also possible that older students are less over-particular in their preferences.
In model 2, in addition to control variables, perceived responsiveness is in-troduced and a significant combined effect occurs (adjusted R2 = 8.6% from 1.7%), with R = 0.300 representing a combined medium effect size. Individually, only perceived responsiveness makes a significant contribution. For responsive-ness, this means that the higher the level of perception among customers (stu-dents) that university personnel are willing and actually providing prompt ser-vice and helping them to achieve their goals, the higher the levels of customer satisfaction. Therefore, H1, which postulates that responsiveness positively in-fluences students’ satisfaction with the education service at university, has been supported.
In model 3, in addition to control variables and perceived responsiveness, perceived empathy is introduced and a significant combined effect occurs (ad-justed R2 of 10.4% from 8.6%), with R = 0.332 representing a combined medium effect size. Individually, only perceived responsiveness and perceived empathy make a significant contribution. For empathy, this means that as customers (students) perceive that university personnel are willing to take care of the cus-tomers by providing individualistic attention and rendering ears to their prob-lems and effectively addressing their concerns and demands (Blery et al., 2009), their levels of satisfaction with the service will be higher. Therefore, H2, which postulates that perceived empathy positively influences students’ satisfaction with the education services from the university, has been supported.

B. Mwiya et al.
1059
In model 4, in addition to control variables, perceived responsiveness, and empathy, another variable i.e. perceived assurance is introduced and a signifi-cant combined effect occurs (adjusted R2 = 10.9% from 10.4%), with R = 0.341 representing a combined medium effect size. Individually, perceived respon-siveness, empathy and assurance make a significant contribution. This means that customers (students) who perceive that university personnel possess know-ledge and relevant ability and therefore inspire trust and confidence in providing the promised services to customers (Blery et al., 2009) are more likely to report higher satisfaction with the service. Therefore, H3, which postulates that per-ceived assurance positively influences students’ satisfaction with the education service, has been supported.
In model 5, in addition to control variables, perceived responsiveness, empa-thy and assurance, another variable i.e. perceived reliability is introduced and a significant combined effect occurs (adjusted R2 = 12.6% from 10.9%), with R = 0.367 representing a combined medium effect size. Individually, only perceived reliability makes a statistically significant contribution. This means that the more customers (students) perceive university personnel as having the ability and ac-tually fulfilling the promised service in a committed manner, truthfully and con-sistently (Blery et al., 2009), the more they will report customer satisfaction. Therefore, H4, which postulates that perceived reliability positively influences students’ satisfaction with the education service, has been supported.
In model 6, in addition to control variables, perceived responsiveness, empa-thy, assurance and reliability, the last independent variable i.e. perceived tangi-bility is introduced. A significant combined effect occurs (adjusted R2 = 16.4% from 12.6%), with R = 0.405 representing a combined medium effect size. Indi-vidually, only perceived tangibility makes a statistically significant contribution. This means that customers (students) appreciate the overall outlook of the uni-versity, its physical appearance as being visually appealing and stylish (Blery et al., 2009) would report higher customer satisfaction. Therefore, H5, which post-ulates that perceived tangibility positively influences students’ satisfaction with the education service, has been supported.
Based on the correlation matrix (Table 3) hierarchical regression (Table 4), Table 5 below summarises the results of hypotheses testing.
Table 5. Results of hypotheses testing.
# Hypotheses Statistic Test Results
H1 Responsiveness is positively related to Student Satisfaction B = 0.273*** Regression Supported
H2 Empathy is positively related to Student Satisfaction B = 0.186*** Regression Supported
H3 Assurance positively influences Student Satisfaction B = 0.133* Regression Supported
H4 Reliability is positively associated with Student Satisfaction B = 0.186*** Regression Supported
H5 Tangibility is positively correlated with Student Satisfaction B = 0.243*** Regression Supported
H6 Student Satisfaction is positively associated with Loyalty R = 0.438** Correlation Supported
H7 Student Satisfaction is positively associated with Word of Mouth R = 0.563*** Correlation Supported
***sig < 0.001(0.1 percent); **sig < 0.01 (1 percent); *sig < 0.05 (5 percent).

B. Mwiya et al.
1060
Lastly, Model 6 in Table 4 also presents the multiple regression with all the control and independent variables’ effects on overall customer satisfaction re-flected. When all the variables are considered in totality, while all the variables make a positive contribution, only perceived tangibility remains statistically sig-nificant and has the largest contribution based on the beta values i.e. perceived tangibility: Beta = 0.243, p < 0.001, perceived reliability: Beta = 0.068, p > 0.05, perceived assurance: Beta = 0.056, p > 0.05, perceived empathy: Beta = 0.074, p > 0.05, perceived responsiveness: Beta = 0.0.019, p > 0.05.
5. Discussion
The findings in this study suggest that perceived responsiveness, empathy, as-surance, reliability and tangibility each significantly influence overall customer satisfaction in public universities in Zambia. Based on the comprehensive mul-tiple regression model, the largest predictor of satisfaction is perceived tangibili-ty. However, the correlation results indicate that inter-correlations among the dimensions of service quality range between R = 0.517 to R = 0.714, representing a large size effect. This means that perceptions of good performance in one qual-ity dimension positively influences perceptions in the other dimensions. The implication is that service quality elements should be monitored, developed and improved as a whole and not in isolation from each other.
The findings from this study have supported the conceptual model and all the hypothesised relationships. This means that the higher the level of perceived good service performance in tangibles, reliability, assurance, empathy and res-ponsiveness to customer’s needs, the higher the level of customer satisfaction. In turn, customer satisfaction positively influences customer loyalty intentions and positive word of mouth. These findings resonate with prior studies in Colombia (Cardona & Bravo, 2012), Jordan (Twaissi & Al-Kilani, 2015) and Portugal (Brochado, 2009) that found that customer satisfaction is significantly influ-enced by the five service quality dimensions. This entails that even in collectivist, lower middle income countries, service quality dimensions are valid predictors of customer satisfaction.
Further, this study is among the few to offer empirical evidence, based on the SERVPERF scale, that student satisfaction positively influences behavioural in-tentions of loyalty and positive word of mouth. This means that individuals who are satisfied with the education service at the university are more likely to en-courage friends and relatives to pursue their studies at the same university and they are also more likely to encourage employers to employ graduates from that university. Similarly, students who are satisfied with the education service are more likely to intend to return to the same university to pursue further studies or support the university as part of the alumni.
Lastly, the finding that older individuals are more likely to report satisfaction is very interesting. Among several explanations, this could be because older in-dividuals are less over-particular about their choices; probably because they un-derstand the constraints the country and the public university operates under.

B. Mwiya et al.
1061
Another explanation is the notion that Zambia is a collectivist and feminine so-ciety with high power distance (Hofstede, 2017). Therefore, older individuals, pressured by society to lead by example, are more likely to conform to norms of society which dictate that one needs to be seen to respect authority and suppor-tive of societal institutions. As a consequence, older individuals would be less in-clined to complain about any dissatisfaction with service quality.
6. Conclusions, Contribution and Implications
The purpose of this research was to apply the service performance (SERVPERF) model in a Zambian context and determine the influence of each service quality dimension on overall service satisfaction. The study was based on a quantitative correlational design where primary sample data were collected from 656 final year undergraduate students at one public university in Zambia. The main find-ings indicate that each of the five dimensions of service quality performance di-mensions (tangibility, reliability, responsiveness, empathy and assurance) is sig-nificantly and positively related to overall customer satisfaction, which in turn is related to loyalty and positive word of mouth.
The contributions of this research are threefold. Firstly, prior studies explor-ing service quality in higher education in Colombia (Cardona & Bravo, 2012), Jordan (Twaissi & Al-Kilani, 2015), Petruzzellis, D’Uggento & Romanazzi (2006) in Italy and Portugal (Brochado, 2009), suggest that customer satisfaction can be explained by perceived service quality. However, African countries are under- researched and this limits generalisability of research conclusions. In fact, hi-therto, literature with a Zambian context is non-existent. The consequences of lack of research in the Zambian context entail that stakeholders have no basis for developing strategies and setting resource allocation priorities to improve service quality based on context specific conclusions. Therefore, this study has contri-buted to filling this contextual gap in knowledge, thus extending the generalisa-bility of prior research conclusions and improving external validity (Eden, 2002; Miller & Bamberger, 2016; Evanschitzky et al., 2007). Indeed, the study has con-firmed the applicability of the SERVPERF model in a collectivist, high power distance, feminine and lower middle income country like Zambia.
Secondly, besides Helgesen and Nesset (2007) in Norway as well as Brown & Mazzarol (2009) in Australia and Ali et al. (2016) in Malaysia who explore the link between student satisfaction and loyalty, there is a shortage of studies link-ing service quality, student satisfaction and behavioural intentions of loyalty and positive word of mouth. This study is among the few to offer empirical evidence, based on the SERVPERF scale that student satisfaction positively influences be-havioural intentions of loyalty and positive word of mouth. Thirdly, the study contributes evidence that older individuals in a collectivist, high power distance and feminine society are more likely to report customer satisfaction. This is per-haps because they are more likely to feel pressure to conform to the norms of so-ciety and to be seen to be supportive of societal institutions. As a consequence, older individuals would be less inclined to complain about dissatisfaction with

B. Mwiya et al.
1062
service quality. Implications for scholars, administrations and policy makers are that the ser-
vice performance model (SERVPERF) is a valid and useful framework for as-sessing and monitoring how the primary stakeholders form their service quality perceptions of higher education. Therefore, customer satisfaction is a function of perceptions of performance in the service quality dimensions of tangibility, re-liability, responsiveness, assurance and empathy. The study’s findings also imply that perceptions of good performance in one quality dimension positively influ-ence perceptions in the other dimensions of quality. This means that service quality elements should be monitored, developed and improved as a whole and not in isolation from each other. This also means that the higher the level of perceived good service performance in tangibles, reliability, assurance, empathy and responsiveness to customers’ needs, the higher the level of customer satis-faction. In turn, students who are satisfied with the education service are more likely to pursue further studies at the same university, support the university as alumni and engage in positive word of mouth to friends, family, employers and other stakeholders about the university.
Limitations and Directions for Future Research
Being a cross sectional study, this research could only offer a snapshot of the phenomenon. Thus, only correlation rather than causality can be inferred. In future longitudinal studies conducted annually as an all-encompassing, holistic and recognised higher education service quality evaluation system would help institutions to assess and monitor their service quality performance. Additional-ly, since the sample was limited to one public university, in future a sample drawn from public and private universities would improve generalizability of the conclusions. This would also help compare service quality and customer satis-faction between private and public universities.
Acknowledgements
The authors wish to thank Sandra Muzeya, Chiluba Mbulo and Nicole Mweema for data entry support.
References Abdullah, F. (2006). Measuring Service Quality in Higher Education: HEdPERF versus
SERVPERF. Marketing Intelligence & Planning, 24, 31-47. https://doi.org/10.1108/02634500610641543
Abili, K., Thani, F. N., & Afarinandehbin, M. (2012). Measuring University Service Qual-ity by Means of SERVQUAL Method. Asian Journal on Quality, 13, 204-211. http://www.emeraldinsight.com/doi/abs/10.1108/15982681211287766 https://doi.org/10.1108/15982681211287766
Abili, K., Thani, F. N., Mokhtarian, F., & Rashidi, M. M. (2011). Assessing Quality Gap of University Services. Asian Journal on Quality, 12, 167-175. http://www.emeraldinsight.com/doi/pdf/10.1108/15982681111158724 https://doi.org/10.1108/15982681111158724

B. Mwiya et al.
1063
Adil, M., Akhtar, A., & Khan, M. (2013). Refinement of Internet Banking Service Quality Scale: A Confirmatory Factor Analysis Approach. International Journal of Services and Operations Management, 14, 336. http://www.inderscienceonline.com/doi/abs/10.1504/IJSOM.2013.052094 https://doi.org/10.1504/ijsom.2013.052094
Ahmed, I., Nawaz, M., Ahmad, Z. et al. (2010). Does Service Quality Affect Students’ Performance? Evidence from Institutes of Higher Learning. African Journal of Business Management, 4, 2527-2533. http://search.proquest.com/openview/7d8459a7f381844dcf82762dc9413f9f/1?pq-origsite=gscholar&cbl=816394
Ali, F., Zhou, Y., Hussain, K., Nair, P. K., & Ragavan, N. A. (2016). Does Higher Educa-tion Service Quality Effect Student Satisfaction, Image and Loyalty? A Study of Inter-national Students in Malaysian Public Universities. Quality Assurance in Education, 24, 70-94. https://doi.org/10.1108/QAE-02-2014-0008
Arambewela, R., & Hall, J. (2006). A Comparative Analysis of International Education Sa-tisfaction Using SERVQUAL. Journal of Services Research, 6, 141-163.
Aydin, S., Ozer, G. O., & Rasil, A. (2005). Customer Loyalty and the Effect of Switching Costs as a Moderator Variable. Marketing Intelligence and Planning, 23, 89-103. https://doi.org/10.1108/02634500510577492
Blery, E., Batistatos, N., Papastratou, E., Perifanos, I., Remoundaki, G., & Retsina, M. (2009). Service Quality and Customer Retention in Mobile Telephony. Journal of Tar-geting, Measurement and Analysis for Marketing, 17, 27-37. https://doi.org/10.1057/jt.2008.26
Brochado, A. (2009). Comparing Alternative Instruments for Measuring Service Quality in Higher Education. Quality Assurance in Education, 17, 174-190. https://doi.org/10.1108/09684880910951381
Brown, R. M., & Mazzarol, T. W. (2009). The Importance of Institutional Image to Stu-dent Satisfaction and Loyalty within Higher Education. Higher Education, 58, 81-95. https://doi.org/10.1007/s10734-008-9183-8
Buttle, F. (1996). SERVQUAL: Review, Critique, Research Agenda. European Journal of Marketing, 30, 8-32. http://www.emeraldinsight.com/doi/abs/10.1108/03090569610105762 https://doi.org/10.1108/03090569610105762
Cardona, M., & Bravo, J. (2012). Service Quality Perceptions in Higher Education Institu-tions: The Case of a Colombian University. Estudios Gerenciales, 28, 23-29. http://www.sciencedirect.com/science/article/pii/S0123592312700049 https://doi.org/10.1016/S0123-5923(12)70004-9
Caruana, A., Money, A. H., & Berthon, P. R. (2000). Service Quality and Satisfaction— The Moderating Role of Value. European Journal of Marketing, 34, 1338-1352. https://doi.org/10.1108/03090560010764432
Cohen, J. W. (1988). Statistical Power Analysis for the Behavioral Sciences (2nd ed.). Hillsdale, NJ: Lawrence Erlbaum Associates.
Creswell, J. (2012). Educational Research: Planning, Conducting, and Evaluating Qualita-tive Research (4th Edition). Thousand Oaks, CA: Pearson Education.
Cronin Jr., J. J., & Taylor, S. (1992). Measuring Service Quality: A Reexamination and Extension. The Journal of Marketing, 56, 55-68. http://www.jstor.org/stable/1252296 https://doi.org/10.2307/1252296
Cronin Jr., J., & Taylor, S. (1994). SERVPERF versus SERVQUAL: Reconciling Perfor-mance-Based and Perceptions-Minus-Expectations Measurement of Service Quality.

B. Mwiya et al.
1064
Journal of Marketing, 58, 125-131. https://doi.org/10.2307/1252256
Dabholkar, P. A., Shepherd, C. D., & Thorpe, D. I. (2000). A Comprehensive Framework for Service Quality: An Investigation of Critical Conceptual and Measurement Issues through a Longitudinal Study. Journal of Retailing, 76, 139-173. https://doi.org/10.1016/S0022-4359(00)00029-4
de Jager, J., & Gbadamosi, G. (2010). Specific Remedy for Specific Problem: Measuring Service Quality in South African Higher Education. Higher Education, 60, 251-267. http://link.springer.com/article/10.1007/s10734-009-9298-6 https://doi.org/10.1007/s10734-009-9298-6
de Jager, J., & Gbadamosi, G. (2013). Predicting Students’ Satisfaction through Service Quality in Higher Education. The International Journal of Management Education, 11, 107-118. http://www.sciencedirect.com/science/article/pii/S1472811713000347 https://doi.org/10.1016/j.ijme.2013.09.001
DeShields Jr., O. J., Kara, A., & Kaynak, E. (2005). Determinants of Business Student Sa-tisfaction and Retention in Higher Education: Applying Herzberg’s Two-Factor Theory. International Journal of Educational Management, 19, 128-139. http://www.emeraldinsight.com/doi/pdf/10.1108/09513540510582426 https://doi.org/10.1108/09513540510582426
Doherty, G. D. (2008). On Quality in Education. Quality Assurance in Education, 16, 255-265. https://doi.org/10.1108/09684880810886268
Eden, D. (2002). From the Editors. Academy of Management Journal, 45, 841-846. https://doi.org/10.5465/AMJ.2002.7718946
Eshghi, A., Roy, S., & Ganguli, S. (2008). Service Quality and Customer Satisfaction: An Empirical Investigation in Indian Mobile Telecommunications Services. The Marketing Management Journal, 18, 119-144.
Evanschitzky, H., Baumgarth, C., Hubbard, R., & Armstrong, J. S. (2007). Replication Re-search’s Disturbing Trend. Journal of Business Research, 60, 411-415. https://doi.org/10.1016/j.jbusres.2006.12.003
Farahmandian, S., Minavand, H., & Afshardost, M. (2013). Perceived Service Quality and Student Satisfaction in Higher Education. IOSR Journal of Business and Management, 12, 65-74. https://doi.org/10.9790/487X-1246574
García-Aracil, A. (2009). European Graduates’ Level of Satisfaction with Higher Educa-tion. Higher Education, 57, 1-21. https://doi.org/10.1007/s10734-008-9121-9
George, D., & Mallery, P. (2003). Using SPSS for Windows Step by Step: A Simple Guide and Reference (4th ed.). London: Pearson Education.
Hasan, H. F. A., Ilias, A., Rahman, R. A., & Razak, M. Z. A. (2009). Service Quality and Student Satisfaction: A Case Study at Private Higher Education Institutions. Interna-tional Business Research, 1, 163-175. http://www.ccsenet.org/journal/index.php/ibr/article/view/982 https://doi.org/10.5539/ibr.v1n3p163
Hassan, A., & Ibrahim, M. (2010). Designing Quality e-Learning Environments for High-er Education. Educational Research, 1, 186-197. https://www.researchgate.net/profile/Mohamed_Elhoseny4/publication/275891526_Design-ing_quality_e-learning_environments_for_higher_education/links/5548ef3a0cf205bce7abfd68.pdf
Helgesen, Ø., & Nesset, E. (2007). What Accounts for Students’ Loyalty? Some Field Study Evidence. International Journal of Educational Management, 21, 126-143. https://doi.org/10.1108/09513540710729926

B. Mwiya et al.
1065
Higher Education Authority (2017). Registered Universities. http://www.hea.org.zm/index.php/en/registered-universities
Hofstede, G. (2017). What about Zambia? On Cultural Dimensions. https://geert-hofstede.com/zambia.html
Icli, G., & Anil, N. (2014). The HEDQUAL Scale: A New Measurement Scale of Service Quality for MBA Programs in Higher Education. South African Journal of Business Management, 45, 31-43. https://journals.co.za/content/busman/45/3/EJC159440
Ismail, I., Harson, H., Ibrahim, N. S., & Isa, M. (2006). Service Quality, Client Satisfaction and Loyalty Towards Audit Firms: Perceptions of Malaysian Public Listed Companies. Managerial Auditing Journal, 21, 738-756. https://doi.org/10.1108/02686900610680521
Jiewanto, A., Laurens, C., & Nelloh, L. (2012). Influence of Service Quality, University Image, and Student Satisfaction toward WOM Intention: A Case Study on Universitas Pelita Harapan Surabaya. Procedia-Social and Behavioral Sciences, 40, 16-23. https://doi.org/10.1016/j.sbspro.2012.03.155
Johnson, M. D., & Fornell, C. (1991). A Framework for Comparing Customer Satisfaction across Individuals and Product Categories. Journal of Economic Psychology, 12, 267- 286. https://doi.org/10.1016/0167-4870(91)90016-M
Jones, M. A., & Suh, J. (2000). Transaction-Specific Satisfaction and Overall Satisfaction: An Empirical Analysis. Journal of Services Marketing, 14, 147-159. https://doi.org/10.1108/08876040010371555
Khan, H., & Matlay, H. (2009). Implementing Service Excellence in Higher Education. Education + Training, 51, 769-780. https://doi.org/10.1108/00400910911005299
Khodayari, F., & Khodayari, B. (2011). Service Quality in Higher Education. Interdiscip-linary Journal of Research in Business, 1, 38-46. http://higheducation.idsc.gov.eg/upload/quality%20in%20higher%20education_03_01_ pdf.م_28_04_2012
Koe, W.-L. (2016). The Relationship between Individual Entrepreneurial Orientation (IEO) and Entrepreneurial Intention. Journal of Global Entrepreneurship Research, 6, 13. https://doi.org/10.1186/s40497-016-0057-8
Kundi, G. M., Khan, S. M., Qureshi, Q. A., Khan, Y., & Akhar, R. (2014). Impact of Ser-vice Quality on Customer Satisfaction in Higher Education. (A Case Study of Gomal University, DI Khan, Khyber Pakhtunkhwa Pakistan). Higher Education, 4, 23-28.
Ladhari, R. (2009). Service Quality, Emotional Satisfaction, and Behavioural Intentions: A Study in the Hotel Industry. Managing Service Quality: An International Journal, 19, 308-331. http://www.emeraldinsight.com/doi/abs/10.1108/09604520910955320 https://doi.org/10.1108/09604520910955320
Lam, C., Fong, D., Lauder, I., & Lam, T. (2002). The Effect of Health-Related Quality of Life (HRQOL) on Health Service Utilisation of a Chinese Population. Social Science & Medicine, 55, 1635-1646. https://doi.org/10.1016/S0277-9536(01)00296-9
Miller, C. C., & Bamberger, P. (2016). Exploring Emergent and Poorly Understood Phe-nomena in the Strangest of Places: The Footprint of Discovery in Replications, Me-ta-Analyses, and Null Findings. Academy of Management Discoveries, 2, 313-319. https://doi.org/10.5465/amd.2016.0115
Ministry of Education Report (2016). List of Recognised Universities in Zambia. Lusaka. http://www.moe.gov.zm/index.php/component/content/article/54-directory/146-universities
Mwiya, B. M. K. (2014). The Impact of Entrepreneurship Education on the Relationships between Institutional and Individual Factors and Entrepreneurial Intention of Univer-sity Graduates: Evidence from Zambia. Doctoral Dissertation.

B. Mwiya et al.
1066
Naik, C. K., Gantasala, S. B., & Prabhakar, G. V. (2010). Service Quality (SERVQUAL) and Its Effect on Customer Satisfaction in Retailing. European Journal of Social Sciences, 16, 231-243. https://pdfs.semanticscholar.org/d124/e866687313a05a8ae38c2cd8d7f49e257830.pdf
Negi, R. (2009). Determining Customer Satisfaction through Perceived Service Quality: A Study of Ethiopian Mobile Users. International Journal of Mobile Marketing, 4, 31.
Negricea, C., Edu, T., & Avram, M. (2014). Establishing Influence of Specific Academic Quality on Student Satisfaction. Social and Behavioral Sciences, 116, 4430-4435.
Oliver, R. (1980). A Cognitive Model of the Antecedents and Consequences of Satisfac-tion Decisions. Journal of Marketing Research, 17, 460-469. http://www.jstor.org/stable/3150499 https://doi.org/10.2307/3150499
Oliver, R. L. (1999). Whence Consumer Loyalty? Journal of Marketing, 63, 33-44. https://doi.org/10.2307/1252099
Pallant, J. (2016). SPSS Survival Manual: A Step By Step Guide to Data Analysis Using SPSS Program (6th ed.). London, UK: McGraw-Hill Education.
Parasuraman, A., Zeithaml, V., & Berry, L. (1985). A Conceptual Model of Service Quali-ty and its Implications for Future Research. The Journal of Marketing, 49, 41-50. http://www.jstor.org/stable/1251430 https://doi.org/10.2307/1251430
Parasuraman, A., Zeithaml, V., & Berry, L. (1988). Servqual: A Multiple-Item Scale for Measuring Consumer Perceptions of Service Quality. Journal of Retailing, 64, 12. http://search.proquest.com/openview/7d007e04d78261295e5524f15bef6837/1?pq-origsite=gscholar&cbl=41988
Parasuraman, A., Zeithaml, V., & Berry, L. (1994). Reassessment of Expectations as a Comparison Standard in Measuring Service Quality: Implications for Further Research. The Journal of Marketing, 58, 111-124. http://www.jstor.org/stable/1252255 https://doi.org/10.2307/1252255
Pereira, A., Oliveira, I., Tinoca, L., Amante, L. et al. (2009). Evaluating Continuous As-sessment Quality in Competence-Based Education Online: The Case of the e-Folio. European Journal of Open, Distance and E-Learning, No. 2. http://www.eurodl.org/?p=archives&year=2009&halfyear=2&article=373
Petruzzellis, L., D’Uggento, A. M., & Romanazzi, S. (2006). Student Satisfaction and Quality of Service in Italian Universities. Managing Service Quality: An International Journal, 16, 349-364. https://doi.org/10.1108/09604520610675694
Pollack, B. (2008). The Nature of the Service Quality and Satisfaction Relationship: Em-pirical Evidence for the Existence of Satisfiers and Dissatisfiers. Managing Service Quality: An International Journal, 18, 537-558. http://www.ingentaconnect.com/content/mcb/108/2008/00000018/00000006/art00001 https://doi.org/10.1108/09604520810920059
Rajab, A., Rahman, H. A., & Shaari, R. (2011). International Students’ Perception towards the Education Quality. International Journal of Social Sciences and Humanity Studies, 3, 49-58.
Rezaei, M., Rezaei, H., Alipour, H., & Salehi, S. (2011). Service Quality, Client Satisfaction and Client Personality in the Public Companies. Australian Journal of Basic and Ap-plied Sciences, 5, 483-491. http://www.academia.edu/download/45230235/Service_Quality_Client_Satisfaction_and_20160430-19526-7jdi1j.pdf
Rod, M., Ashill, N. J., Shao, J., & Carruthers, J. (2009). An Examination of the Relation-

B. Mwiya et al.
1067
ship between Service Quality Dimensions, Overall Internet Banking Service Quality and Customer Satisfaction: A New Zealand Study. Marketing Intelligence & Planning, 27, 103-126. https://doi.org/10.1108/02634500910928344
Rózsa, Z. (2013). Assessment of Perceived Quality of SEMPA Educational Services. The 7th International Days of Statistics and Economics, Prague, 19-21 September 2013, 1221-1228. https://msed.vse.cz/files/2013/74-Rozsa-Zoltan-paper.pdf
Saadati, S. (2012). The Measurement Education Services Quality Payam Noor University of Garmsar with Using of Servqual Model. Journal of Basic and Applied Scientific Re-search, 2, 6337-6343.
Saunders, M. N. K., Lewis, P. & Thornhill, A. (2009). Research Methods for Business Stu-dents (5th Edition). London: Pearson Education.
Senthilkumar, N., & Arulraj, A. (2011). SQM-HEI—Determination of Service Quality Measurement of Higher Education in India. Journal of Modelling in Management, 6, 60-78. https://doi.org/10.1108/17465661111112502
Seymour, D. T. (1992). On Q: Causing Quality in Higher Education. Riverside, NJ: Mac-millan Publishing Company. http://eric.ed.gov/?id=ED350951
Sultan, P., & Wong, H. Y. (2012). Service Quality in a Higher Education Context: An In-tegrated Model. Asia Pacific Journal of Marketing and Logistics, 24, 755-784. https://doi.org/10.1108/13555851211278196
Sumaedi, S., Bakti, I. G. M. Y., & Metasari, N. (2011). The Effect of Students’ Perceived Service Quality and Perceived Price on Student Satisfaction. Management Science and Engineering, 5, 88-97.
Sundaram, D. S., Mitra, K., & Webster, C. (1998). Word-of-Mouth Communications: A Motivational Analysis. In J. W. Alba, & J. W. Hutchinson (Eds.), NA—Advances in Consumer Research (Vol. 25, pp. 527-531). Provo, UT: Association for Consumer Re-search. http://acrwebsite.org/volumes/8208/volumes/v25/NA-25
Tabachnik, B., Fidell, L., & Tabachnick B, F. L. (2007). Using Multivariate Statistics. NY: Harper Collins College Publishers (Internatio). London: Pearson Education.
Theodorakis, N., Kambitsis, C., & Laios, A. (2001). Relationship between Measures of Service Quality and Satisfaction of Spectators in Professional Sports. Managing Service Quality: An International Journal, 11, 431-438. https://doi.org/10.1108/09604520110410638
Twaissi, N. M., & Al-Kilani, M. H. (2015). The Impact of Perceived Service Quality on Students Intentions in Higher Education in a Jordanian Government University. In-ternational Business Research, 8, 81-92. https://doi.org/10.5539/ibr.v8n5p81
Umashankar, V., & Dutta, K. (2007). Balanced Scorecards in Managing Higher Education Institutions: An Indian Perspective. International Journal of Educational Management, 21, 54-67. https://doi.org/10.1108/09513540710716821
van Schalkwyk, R. D., & Steenkamp, R. J. (2014). The Exploration of Service Quality and Its Measurement for Private Higher Education Institutions. Southern African Business Review, 18, 83-107.
Walsh, G., Mitchell, V. W., Jackson, P. R., & Beatty, S. E. (2009). Examining the Antece-dents and Consequences of Corporate Reputation: A Customer Perspective. British Journal of Management, 20, 187-203. https://doi.org/10.1111/j.1467-8551.2007.00557.x
Wei, C. C., & Ramalu, S. S. (2011). Students Satisfaction with University: Does Service Quality Matter? International Journal of Educational, 3, 1-15.
World Bank (2017). Lower Middle Income Countries. http://data.worldbank.org/income-level/lower-middle-income

B. Mwiya et al.
1068
Yi, Y. (1991). A Critical Review of Consumer Satisfaction. In V. A. Zeithaml (Ed.), Re-view of Marketing 1990 (pp. 68-123). Chicago, IL: American Marketing Association.
Yunus, N. K., Ishak, S., & Razak, A. Z. A. A. (2010). Motivation, Empowerment, Service Quality and Polytechnic Students’ Level of Satisfaction in Malaysia. International Journal of Business and Social Science, 1, 120-128.
Zafiropoulos, C., & Vrana, V. (2008). Service Quality Assessment in a Greek Higher Education Institute. Journal of Business Economics and Management, 9, 33-45. http://www.tandfonline.com/doi/abs/10.3846/1611-1699.2008.9.33-45 https://doi.org/10.3846/1611-1699.2008.9.33-45
Zeithaml, V. A., Bitner, M. J., & Gremler, D. D. (2006). Services Marketing: Integrating Customer Focus across the Firm. Boston, MA: McGraw-Hill/Irwin. http://library.wur.nl/WebQuery/clc/1809666
Zeithaml, V. A., Bitner, M. J., & Gremler, D. D. (2009). Services Marketing: Integrating Customer Focus across the Firm (5th ed.). Singapore: McGraw-Hill and Irwin.
Zineldin, M. (2007). The Quality of Higher Education and Student Satisfaction Self- Assessment and Review Process a Term Philosophy and 5Qs Model. Paper presented at 2nd International Conference Education, Economics, and Law: Traditions and Innova-tions, Vaxjo University, Sweden.
Zineldin, M., Akdag, H., & Vasicheva, V. (2011). Assessing Quality in Higher Education: New Criteria for Evaluating Students’ Satisfaction. Quality in Higher Education, 17, 231-243. http://www.tandfonline.com/doi/abs/10.1080/13538322.2011.582796 https://doi.org/10.1080/13538322.2011.582796
Submit or recommend next manuscript to SCIRP and we will provide best service for you:
Accepting pre-submission inquiries through Email, Facebook, LinkedIn, Twitter, etc. A wide selection of journals (inclusive of 9 subjects, more than 200 journals) Providing 24-hour high-quality service User-friendly online submission system Fair and swift peer-review system Efficient typesetting and proofreading procedure Display of the result of downloads and visits, as well as the number of cited articles Maximum dissemination of your research work
Submit your manuscript at: http://papersubmission.scirp.org/ Or contact [email protected]