Embed Size (px)
Citation preview
Copperbelt Energy Corporation Plc
Annual earnings presentationfor the year ended 31 December 2014
www.cecinvestor.com
Contents
Page
Sub Saharan power potential 7
The Nigerian opportunity 11
Zambian mining sector growth 12
Group structure 13
Regulatory events 14
Financial results 17
Focus on AEDC 26
Pipeline 32
Outlook 34
www.cecinvestor.com 1
Your presenters
www.cecinvestor.com 2
Owen SilavweManaging Director
Owen was appointed Managing Director for CEC Plc inAugust 2014, having served as Managing Director –Operations (in charge of the Operations Division of thebusiness) since 2013. Prior to his current role, he servedas the Chief Operations Officer for the Company fromMarch 2012. Owen has previously held the position ofCommercial Director responsible for organic businessdevelopment and other commercial aspects of theCompany’s Operations division. Having served invarious positions within CEC, including System PlanningEngineer, Projects Engineer, Projects Manager andBusiness Development Manager, Owen rose throughthe ranks to his current position. He has been one of themain contributors to reforming contractor procurementprocesses in CEC as well as financing andimplementation structures of organic business growth
projects. Owen holds a Bachelor of ElectricalEngineering degree from the University of Zambia anda Master of Science in Power Engineering fromChalmers University in Sweden.
Your presenters
www.cecinvestor.com 3
Mutale MukukaChief Financial Officer
Mutale was appointed Group Chief Financial Officer inAugust, 2014. Prior to this appointment, he was the first CFOfor subsidiary CEC Africa and had also served as CEC Africa’s
Regional Head - West Africa, based in Abuja, Nigeria. He ledthe business development and financing transactions foracquisition of equity interest in Abuja Electricity DistributionCompany and North South Power. Other senior positions heheld within the Group include that of Director - CorporateFinance for CEC Plc, Manager Corporate Finance and
Business Planning Head. As CFO, he is responsible for drivingfinancial strategy, financial operations and control as well asoverseeing statutory reporting across several jurisdictions.Mutale has over 14 years of experience covering a numberof industries in project development, corporate finance, taxplanning, project structuring, financial reporting and control.He started his career in audit, and joined CEC Plc in 2003,having previously worked for the Zambia Revenue Authority.He is a qualified UK Chartered Management Accountantand a Fellow of the Zambia Institute of CharteredAccountants.
Statements in this presentation (including all other media) that are not historical facts or
information may be forward-looking statements.
These forward-looking statements are based on information available at the time the
statements are made and/or management's belief as of that time with respect to
future events and involve risks and uncertainties that could cause actual results and
outcomes to be materially different. Important factors that could cause such
differences include, but are not limited to the loss of key customers, the disruption to
operations, economic conditions, political conditions, regulatory issues and reduction in
demand.
Forward looking statements
4
How to access information on CEC
We’re connecting with investors
http://cecinvestor.com/investorconnect-2/
5
How to access pan African power sector news
Pan-African power sector news is published through our Twitter
– follow us!
https://twitter.com/cecinvestor
6
CEC
Sub-Saharan power sector potential
www.cecinvestor.com 7
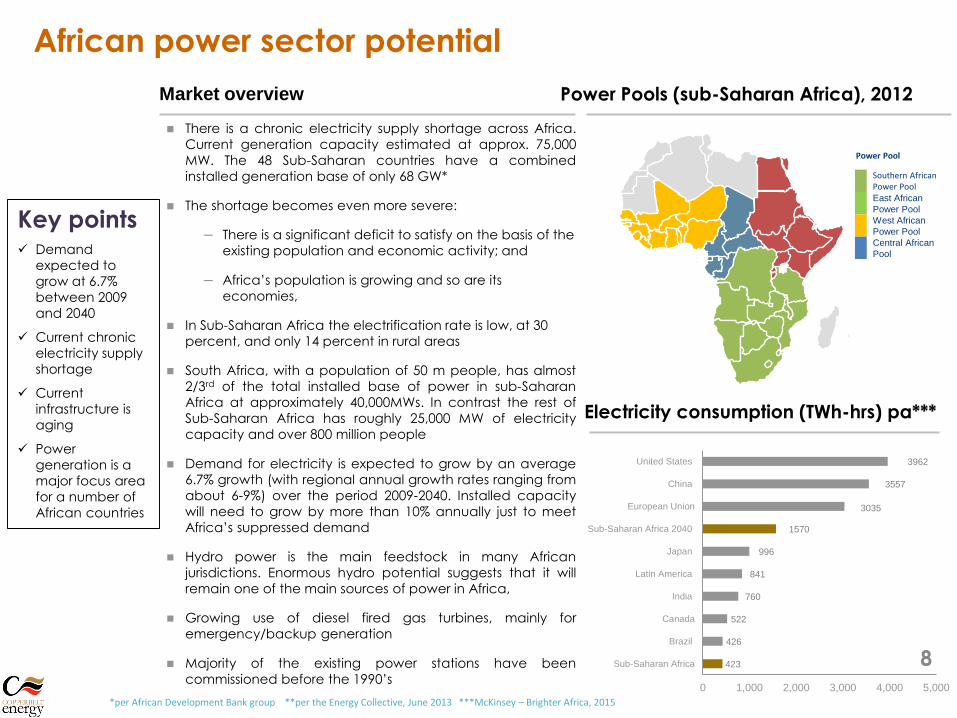
Market overview
There is a chronic electricity supply shortage across Africa.
Current generation capacity estimated at approx. 75,000
MW. The 48 Sub-Saharan countries have a combined
installed generation base of only 68 GW*
The shortage becomes even more severe:
– There is a significant deficit to satisfy on the basis of the
existing population and economic activity; and
– Africa’s population is growing and so are its
economies,
In Sub-Saharan Africa the electrification rate is low, at 30
percent, and only 14 percent in rural areas
South Africa, with a population of 50 m people, has almost
2/3rd of the total installed base of power in sub-Saharan
Africa at approximately 40,000MWs. In contrast the rest of
Sub-Saharan Africa has roughly 25,000 MW of electricity
capacity and over 800 million people
Demand for electricity is expected to grow by an average
6.7% growth (with regional annual growth rates ranging from
about 6-9%) over the period 2009-2040. Installed capacity
will need to grow by more than 10% annually just to meet
Africa’s suppressed demand
Hydro power is the main feedstock in many African
jurisdictions. Enormous hydro potential suggests that it will
remain one of the main sources of power in Africa,
Growing use of diesel fired gas turbines, mainly for
emergency/backup generation
Majority of the existing power stations have been
commissioned before the 1990’s
Power Pools (sub-Saharan Africa), 2012
Power Pool
Southern African Power Pool
East African
Power Pool
West African
Power Pool
Central African
Pool
Key points Demand
expected to
grow at 6.7%
between 2009
and 2040
Current chronic
electricity supply
shortage
Current
infrastructure is
aging
Power
generation is a
major focus area
for a number of
African countries
Electricity consumption (TWh-hrs) pa***
*per African Development Bank group **per the Energy Collective, June 2013 ***McKinsey – Brighter Africa, 2015
423
426
522
760
841
996
1570
3035
3557
3962
0 1,000 2,000 3,000 4,000 5,000
Sub-Saharan Africa
Brazil
Canada
India
Latin America
Japan
Sub-Saharan Africa 2040
European Union
China
United States
African power sector potential
8
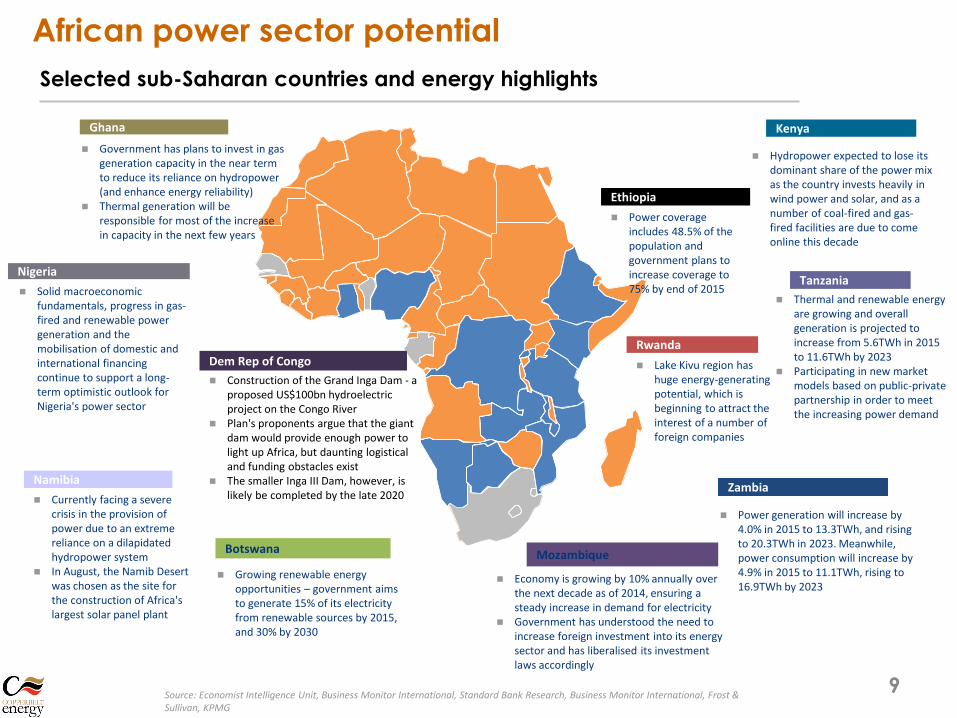
Selected sub-Saharan countries and energy highlights
Ethiopia
Power coverage includes 48.5% of the population and government plans to increase coverage to 75% by end of 2015
Ghana
Government has plans to invest in gas generation capacity in the near term to reduce its reliance on hydropower (and enhance energy reliability)
Thermal generation will be responsible for most of the increase in capacity in the next few years
Nigeria
Solid macroeconomic fundamentals, progress in gas-fired and renewable power generation and the mobilisation of domestic and international financing continue to support a long-term optimistic outlook for Nigeria's power sector
Namibia
Currently facing a severe crisis in the provision of power due to an extreme reliance on a dilapidated hydropower system
In August, the Namib Desert was chosen as the site for the construction of Africa's largest solar panel plant
Botswana Mozambique
Economy is growing by 10% annually over the next decade as of 2014, ensuring a steady increase in demand for electricity
Government has understood the need to increase foreign investment into its energy sector and has liberalised its investment laws accordingly
Zambia
Power generation will increase by 4.0% in 2015 to 13.3TWh, and rising to 20.3TWh in 2023. Meanwhile, power consumption will increase by 4.9% in 2015 to 11.1TWh, rising to 16.9TWh by 2023
Tanzania
Thermal and renewable energy are growing and overall generation is projected to increase from 5.6TWh in 2015 to 11.6TWh by 2023
Participating in new market models based on public-private partnership in order to meet the increasing power demand
Kenya
Hydropower expected to lose its dominant share of the power mix as the country invests heavily in wind power and solar, and as a number of coal-fired and gas-fired facilities are due to come online this decade
Growing renewable energy opportunities – government aims to generate 15% of its electricity from renewable sources by 2015, and 30% by 2030
Rwanda
Lake Kivu region has huge energy-generating potential, which is beginning to attract the interest of a number of foreign companies
Source: Economist Intelligence Unit, Business Monitor International, Standard Bank Research, Business Monitor International, Frost & Sullivan, KPMG
Dem Rep of Congo
Construction of the Grand Inga Dam - a proposed US$100bn hydroelectric project on the Congo River
Plan's proponents argue that the giant dam would provide enough power to light up Africa, but daunting logistical and funding obstacles exist
The smaller Inga III Dam, however, is likely be completed by the late 2020
African power sector potential
9
5
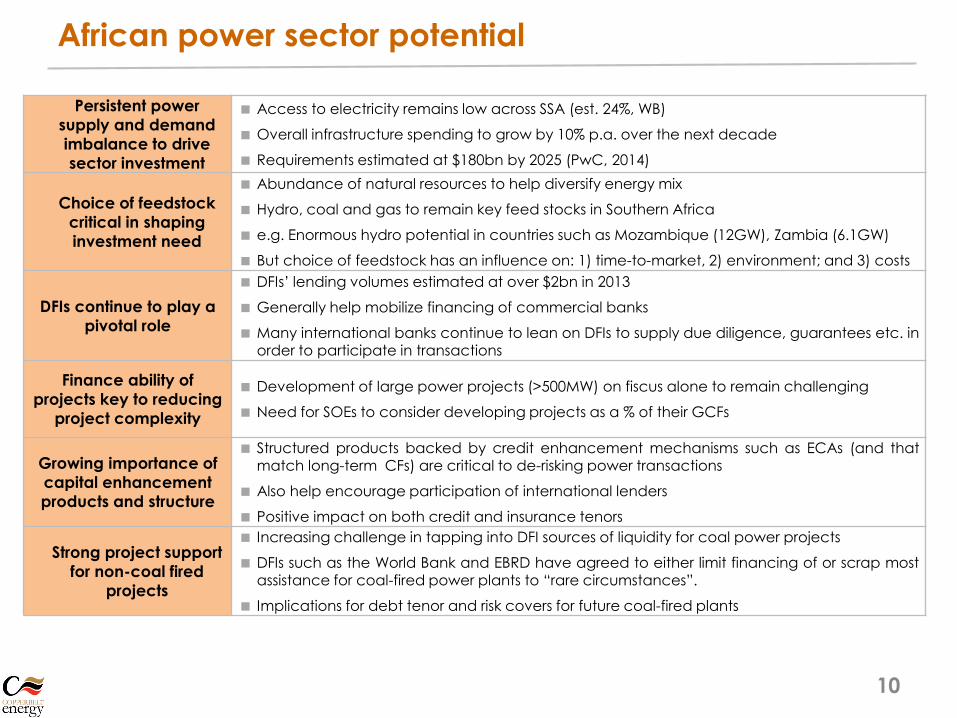
Persistent power
supply and demand
imbalance to drive
sector investment
Access to electricity remains low across SSA (est. 24%, WB)
Overall infrastructure spending to grow by 10% p.a. over the next decade
Requirements estimated at $180bn by 2025 (PwC, 2014)
Choice of feedstock
critical in shaping
investment need
Abundance of natural resources to help diversify energy mix
Hydro, coal and gas to remain key feed stocks in Southern Africa
e.g. Enormous hydro potential in countries such as Mozambique (12GW), Zambia (6.1GW)
But choice of feedstock has an influence on: 1) time-to-market, 2) environment; and 3) costs
DFIs continue to play a
pivotal role
DFIs’ lending volumes estimated at over $2bn in 2013
Generally help mobilize financing of commercial banks
Many international banks continue to lean on DFIs to supply due diligence, guarantees etc. inorder to participate in transactions
Finance ability of
projects key to reducing
project complexity
Development of large power projects (>500MW) on fiscus alone to remain challenging
Need for SOEs to consider developing projects as a % of their GCFs
Growing importance of
capital enhancement
products and structure
Structured products backed by credit enhancement mechanisms such as ECAs (and thatmatch long-term CFs) are critical to de-risking power transactions
Also help encourage participation of international lenders
Positive impact on both credit and insurance tenors
Strong project support
for non-coal fired
projects
Increasing challenge in tapping into DFI sources of liquidity for coal power projects
DFIs such as the World Bank and EBRD have agreed to either limit financing of or scrap mostassistance for coal-fired power plants to “rare circumstances”.
Implications for debt tenor and risk covers for future coal-fired plants
African power sector potential
10
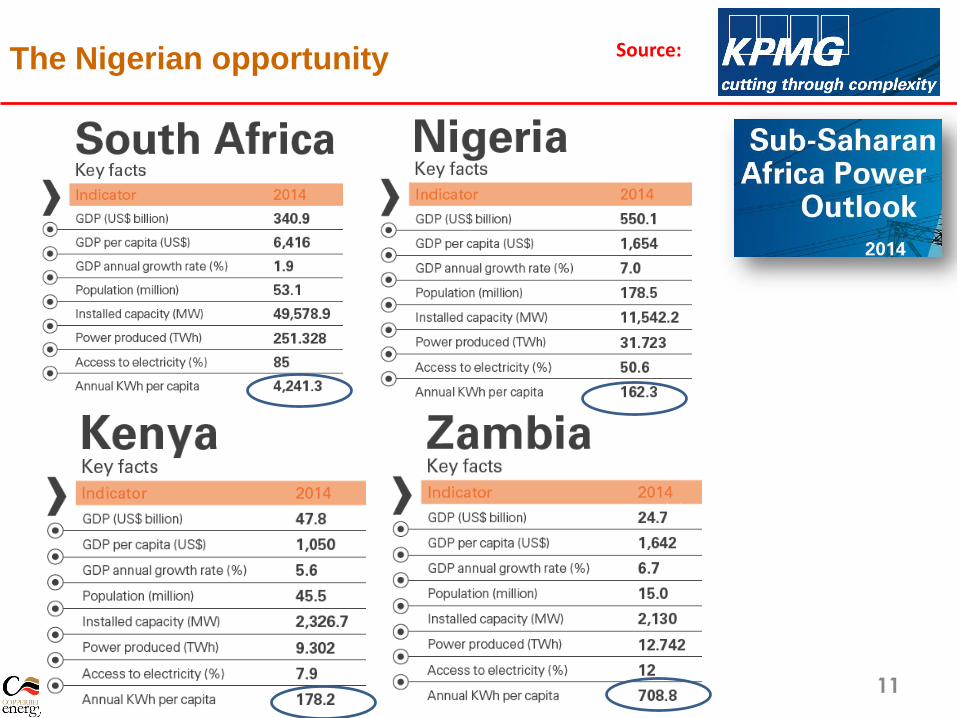
The Nigerian opportunity
11
Source:
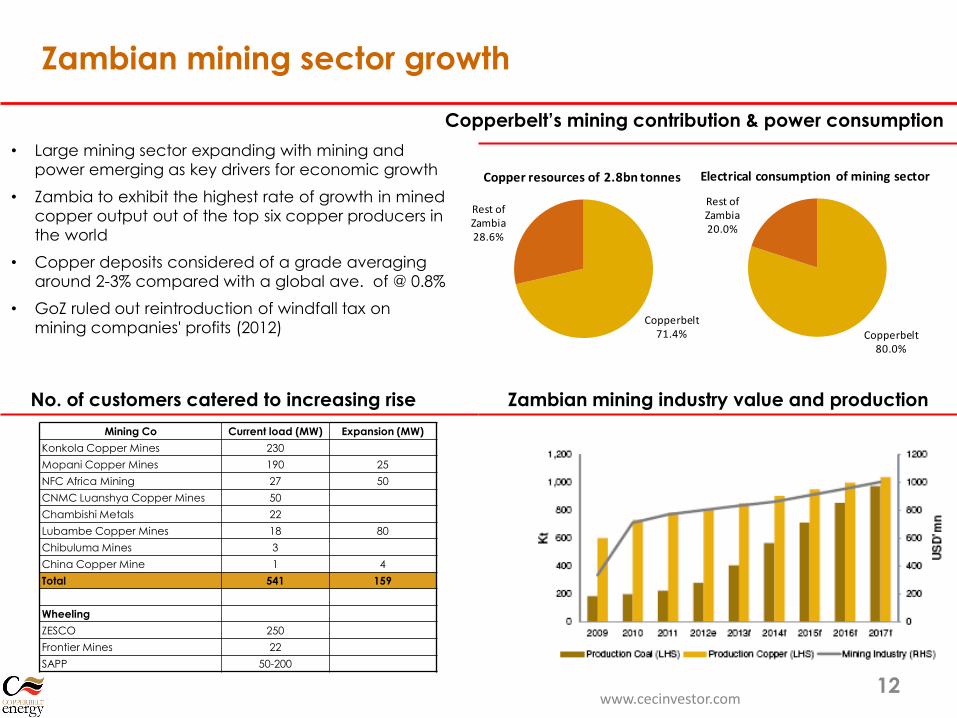
Zambian mining sector growth
12
Copperbelt’s mining contribution & power consumption
Zambian mining industry value and production
• Large mining sector expanding with mining and
power emerging as key drivers for economic growth
• Zambia to exhibit the highest rate of growth in mined
copper output out of the top six copper producers in
the world
• Copper deposits considered of a grade averaging
around 2-3% compared with a global ave. of @ 0.8%
• GoZ ruled out reintroduction of windfall tax on
mining companies' profits (2012)
No. of customers catered to increasing rise
Mining Co Current load (MW) Expansion (MW)
Konkola Copper Mines 230
Mopani Copper Mines 190 25
NFC Africa Mining 27 50
CNMC Luanshya Copper Mines 50
Chambishi Metals 22
Lubambe Copper Mines 18 80
Chibuluma Mines 3
China Copper Mine 1 4
Total 541 159
Wheeling
ZESCO 250
Frontier Mines 22
SAPP 50-200
Copperbelt71.4%
Rest of Zambia28.6%
Copper resources of 2.8bn tonnes
Copperbelt80.0%
Rest of Zambia20.0%
Electrical consumption of mining sector
www.cecinvestor.com
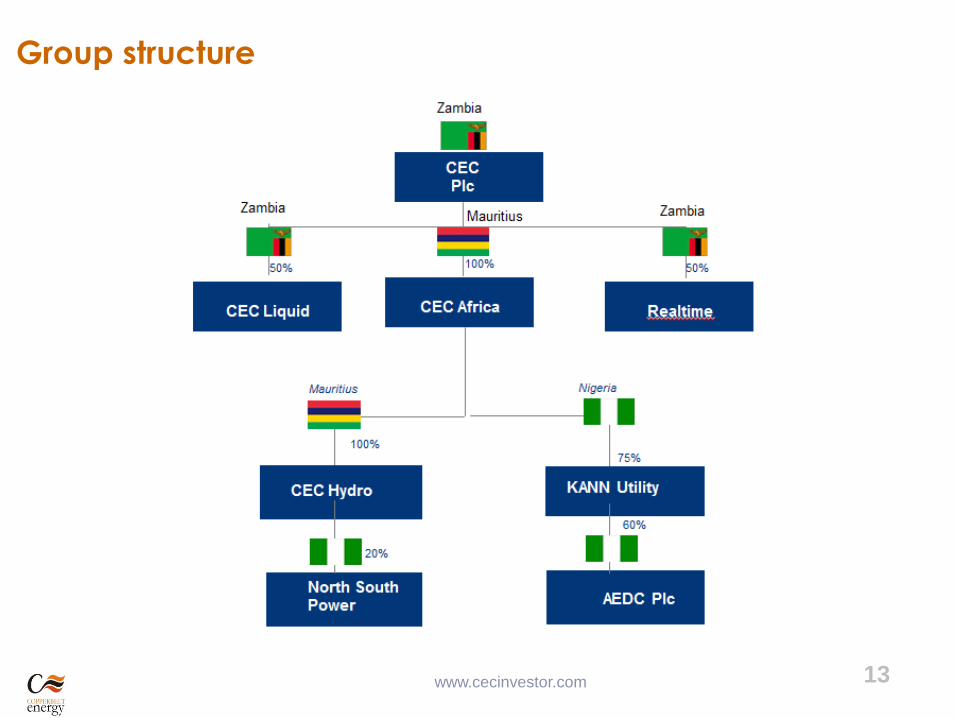
13Group structure
www.cecinvestor.com 13
CEC
Regulatory regime & events
www.cecinvestor.com 14
Regulatory events
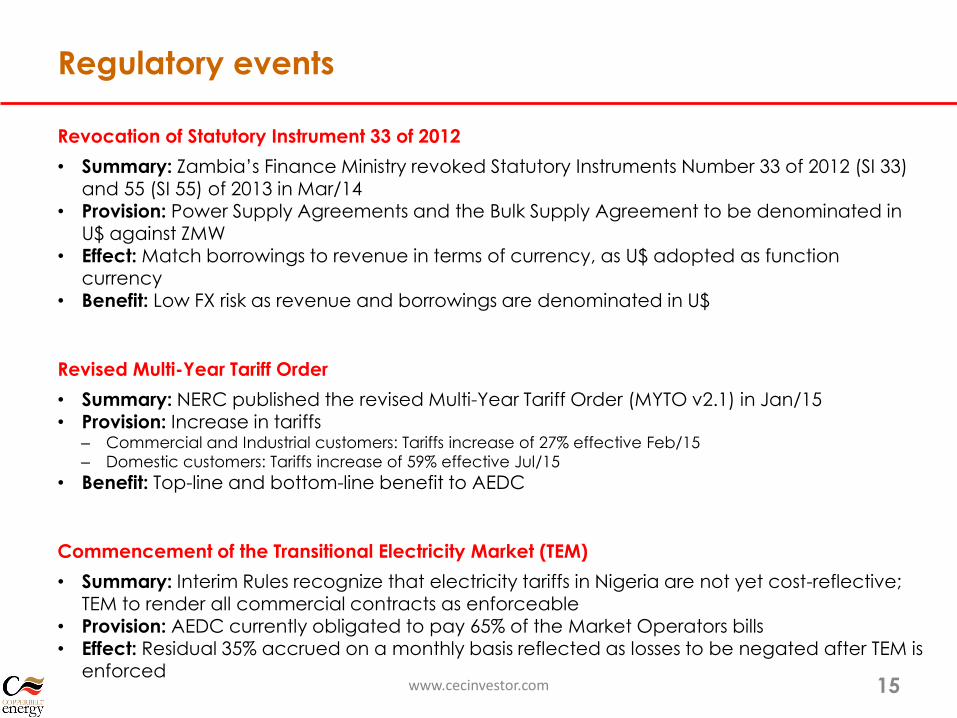
Revocation of Statutory Instrument 33 of 2012
• Summary: Zambia’s Finance Ministry revoked Statutory Instruments Number 33 of 2012 (SI 33)
and 55 (SI 55) of 2013 in Mar/14• Provision: Power Supply Agreements and the Bulk Supply Agreement to be denominated in
U$ against ZMW• Effect: Match borrowings to revenue in terms of currency, as U$ adopted as function
currency• Benefit: Low FX risk as revenue and borrowings are denominated in U$
Revised Multi-Year Tariff Order
• Summary: NERC published the revised Multi-Year Tariff Order (MYTO v2.1) in Jan/15• Provision: Increase in tariffs
– Commercial and Industrial customers: Tariffs increase of 27% effective Feb/15
– Domestic customers: Tariffs increase of 59% effective Jul/15
• Benefit: Top-line and bottom-line benefit to AEDC
Commencement of the Transitional Electricity Market (TEM)
• Summary: Interim Rules recognize that electricity tariffs in Nigeria are not yet cost-reflective; TEM to render all commercial contracts as enforceable
• Provision: AEDC currently obligated to pay 65% of the Market Operators bills• Effect: Residual 35% accrued on a monthly basis reflected as losses to be negated after TEM is
enforcedwww.cecinvestor.com 15
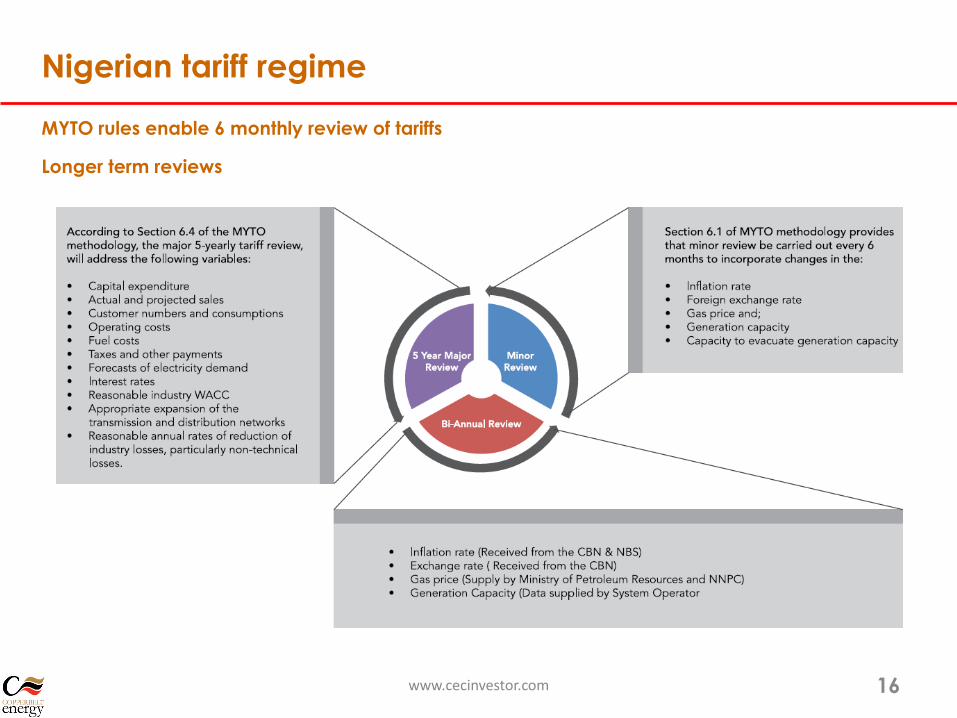
Nigerian tariff regime
MYTO rules enable 6 monthly review of tariffs
Longer term reviews
www.cecinvestor.com 16
CEC
Financial results
www.cecinvestor.com 17
0%
20%
40%
60%
80%
100%
120%
20
09
20
10
20
11
20
12
20
13
(15)
(10)
(5)
0
5
10
20
01
20
02
20
03
20
04
20
05
20
06
20
07
20
08
20
09
20
10
20
11
20
12
20
13
20
14
EPS Uc
(240)
(160)
(80)
0
80
160
20
01
20
02
20
03
20
04
20
05
20
06
20
07
20
08
20
09
20
10
20
11
20
12
20
13
20
14
Continuing ops earnings U$m
0
200
400
600
800
20
01
20
02
20
03
20
04
20
05
20
06
20
07
20
08
20
09
20
10
20
11
20
12
20
13
20
14
Revenue U$m
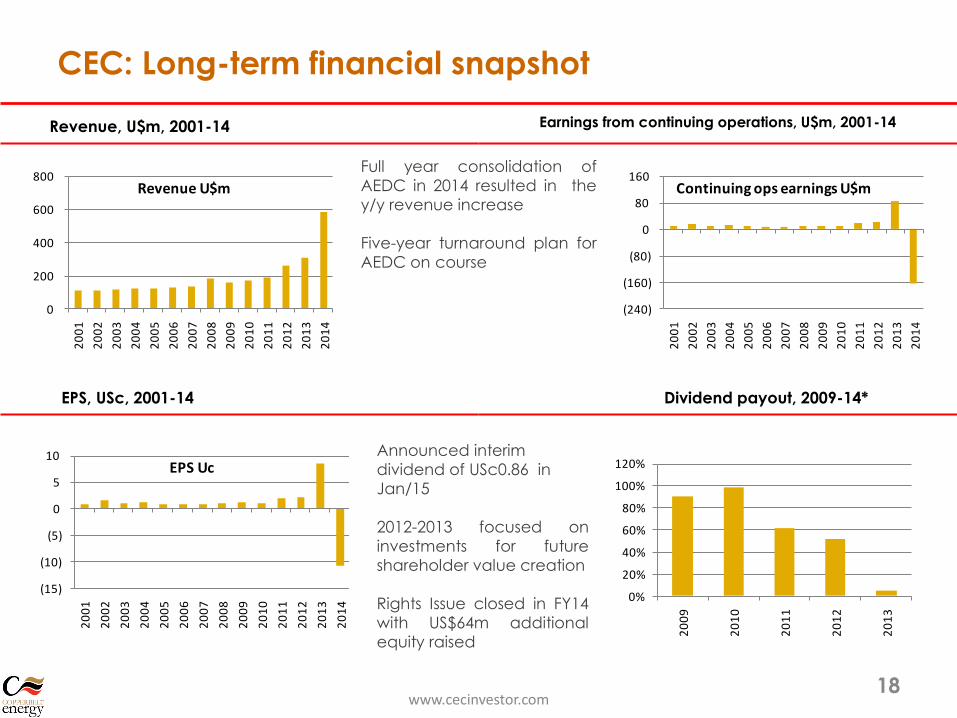
Earnings from continuing operations, U$m, 2001-14
Dividend payout, 2009-14*
Revenue, U$m, 2001-14
EPS, USc, 2001-14
CEC: Long-term financial snapshot
www.cecinvestor.com18
Full year consolidation of
AEDC in 2014 resulted in the
y/y revenue increase
Five-year turnaround plan for
AEDC on course
Announced interim
dividend of USc0.86 in
Jan/15
2012-2013 focused on
investments for future
shareholder value creation
Rights Issue closed in FY14
with US$64m additional
equity raised
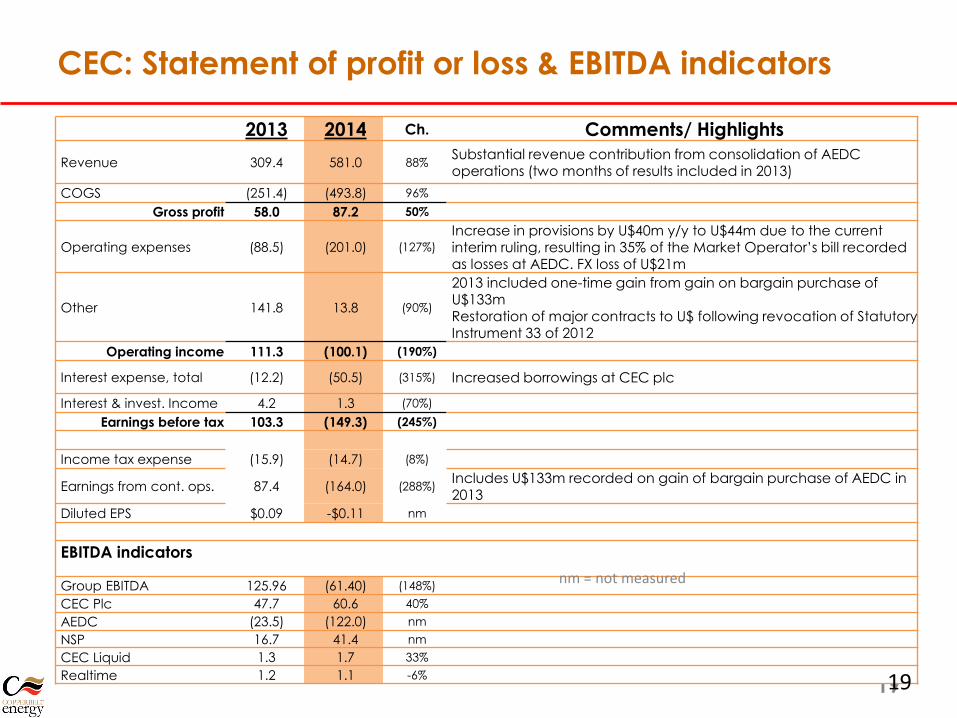
CEC: Statement of profit or loss & EBITDA indicators
19
2013 2014 Ch. Comments/ Highlights
Revenue 309.4 581.0 88%Substantial revenue contribution from consolidation of AEDC operations (two months of results included in 2013)
COGS (251.4) (493.8) 96%
Gross profit 58.0 87.2 50%
Operating expenses (88.5) (201.0) (127%)
Increase in provisions by U$40m y/y to U$44m due to the current interim ruling, resulting in 35% of the Market Operator’s bill recorded as losses at AEDC. FX loss of U$21m
Other 141.8 13.8 (90%)
2013 included one-time gain from gain on bargain purchase of U$133mRestoration of major contracts to U$ following revocation of Statutory Instrument 33 of 2012
Operating income 111.3 (100.1) (190%)
Interest expense, total (12.2) (50.5) (315%) Increased borrowings at CEC plc
Interest & invest. Income 4.2 1.3 (70%)
Earnings before tax 103.3 (149.3) (245%)
Income tax expense (15.9) (14.7) (8%)
Earnings from cont. ops. 87.4 (164.0) (288%)Includes U$133m recorded on gain of bargain purchase of AEDC in 2013
Diluted EPS $0.09 -$0.11 nm
EBITDA indicators
Group EBITDA 125.96 (61.40) (148%)
CEC Plc 47.7 60.6 40%
AEDC (23.5) (122.0) nm
NSP 16.7 41.4 nm
CEC Liquid 1.3 1.7 33%
Realtime 1.2 1.1 -6%
nm = not measured
19
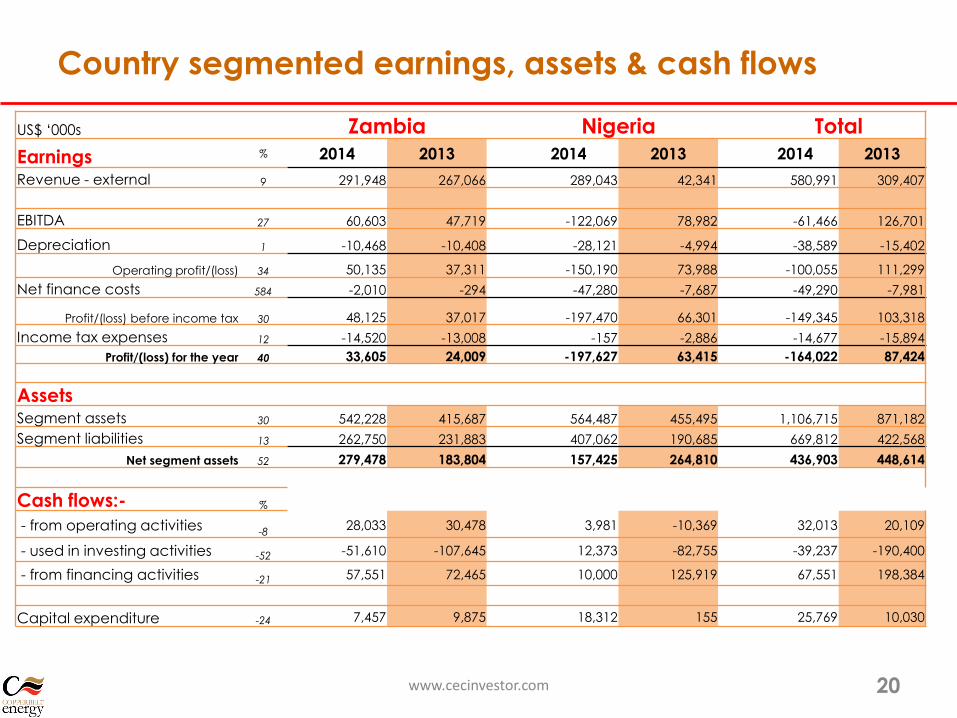
Country segmented earnings, assets & cash flows
20
US$ ‘000s Zambia Nigeria Total
Earnings % 2014 2013 2014 2013 2014 2013
Revenue - external 9 291,948 267,066 289,043 42,341 580,991 309,407
EBITDA 27 60,603 47,719 -122,069 78,982 -61,466 126,701
Depreciation 1 -10,468 -10,408 -28,121 -4,994 -38,589 -15,402
Operating profit/(loss) 34 50,135 37,311 -150,190 73,988 -100,055 111,299
Net finance costs 584 -2,010 -294 -47,280 -7,687 -49,290 -7,981
Profit/(loss) before income tax 30 48,125 37,017 -197,470 66,301 -149,345 103,318
Income tax expenses 12 -14,520 -13,008 -157 -2,886 -14,677 -15,894
Profit/(loss) for the year 40 33,605 24,009 -197,627 63,415 -164,022 87,424
AssetsSegment assets 30 542,228 415,687 564,487 455,495 1,106,715 871,182
Segment liabilities 13 262,750 231,883 407,062 190,685 669,812 422,568
Net segment assets 52 279,478 183,804 157,425 264,810 436,903 448,614
Cash flows:- %
- from operating activities -828,033 30,478 3,981 -10,369 32,013 20,109
- used in investing activities -52 -51,610 -107,645 12,373 -82,755 -39,237 -190,400
- from financing activities -21 57,551 72,465 10,000 125,919 67,551 198,384
Capital expenditure -24 7,457 9,875 18,312 155 25,769 10,030
www.cecinvestor.com
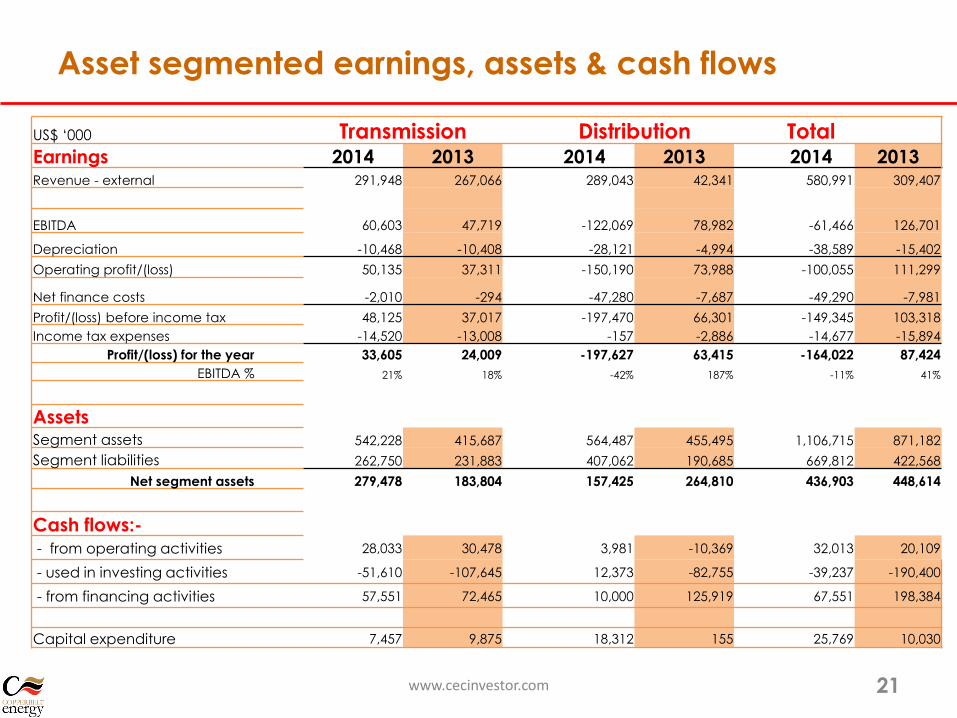
Asset segmented earnings, assets & cash flows
21
US$ ‘000 Transmission Distribution TotalEarnings 2014 2013 2014 2013 2014 2013Revenue - external 291,948 267,066 289,043 42,341 580,991 309,407
EBITDA 60,603 47,719 -122,069 78,982 -61,466 126,701
Depreciation -10,468 -10,408 -28,121 -4,994 -38,589 -15,402
Operating profit/(loss) 50,135 37,311 -150,190 73,988 -100,055 111,299
Net finance costs -2,010 -294 -47,280 -7,687 -49,290 -7,981
Profit/(loss) before income tax 48,125 37,017 -197,470 66,301 -149,345 103,318
Income tax expenses -14,520 -13,008 -157 -2,886 -14,677 -15,894
Profit/(loss) for the year 33,605 24,009 -197,627 63,415 -164,022 87,424
EBITDA % 21% 18% -42% 187% -11% 41%
AssetsSegment assets 542,228 415,687 564,487 455,495 1,106,715 871,182
Segment liabilities 262,750 231,883 407,062 190,685 669,812 422,568
Net segment assets 279,478 183,804 157,425 264,810 436,903 448,614
Cash flows:-- from operating activities 28,033 30,478 3,981 -10,369 32,013 20,109
- used in investing activities -51,610 -107,645 12,373 -82,755 -39,237 -190,400
- from financing activities 57,551 72,465 10,000 125,919 67,551 198,384
Capital expenditure 7,457 9,875 18,312 155 25,769 10,030
www.cecinvestor.com
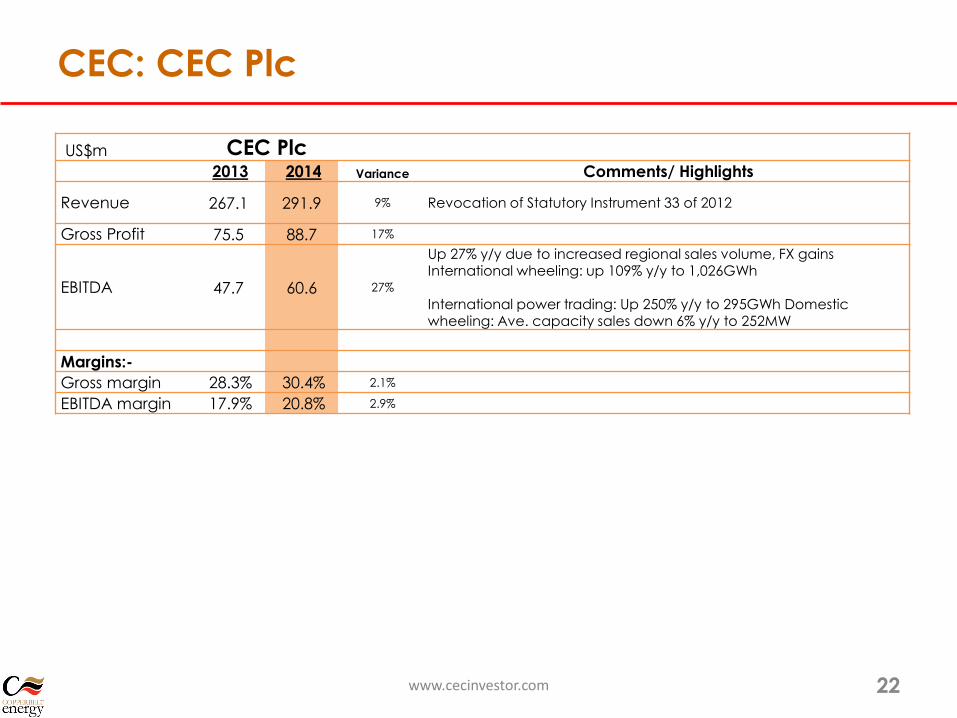
CEC: CEC Plc
US$m CEC Plc2013 2014 Variance Comments/ Highlights
Revenue 267.1 291.9 9% Revocation of Statutory Instrument 33 of 2012
Gross Profit 75.5 88.7 17%
EBITDA 47.7 60.6 27%
Up 27% y/y due to increased regional sales volume, FX gains International wheeling: up 109% y/y to 1,026GWh
International power trading: Up 250% y/y to 295GWh Domestic wheeling: Ave. capacity sales down 6% y/y to 252MW
Margins:-
Gross margin 28.3% 30.4% 2.1%
EBITDA margin 17.9% 20.8% 2.9%
www.cecinvestor.com 22
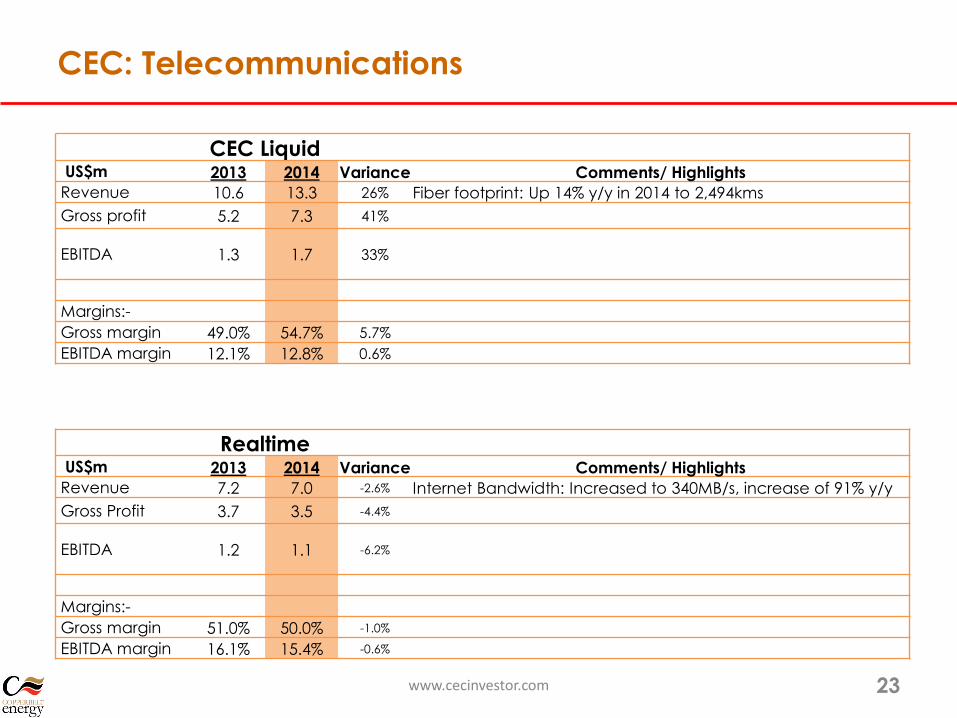
CEC: Telecommunications
CEC LiquidUS$m 2013 2014 Variance Comments/ Highlights
Revenue 10.6 13.3 26% Fiber footprint: Up 14% y/y in 2014 to 2,494kms
Gross profit 5.2 7.3 41%
EBITDA 1.3 1.7 33%
Margins:-
Gross margin 49.0% 54.7% 5.7%
EBITDA margin 12.1% 12.8% 0.6%
RealtimeUS$m 2013 2014 Variance Comments/ Highlights
Revenue 7.2 7.0 -2.6% Internet Bandwidth: Increased to 340MB/s, increase of 91% y/y
Gross Profit 3.7 3.5 -4.4%
EBITDA 1.2 1.1 -6.2%
Margins:-
Gross margin 51.0% 50.0% -1.0%
EBITDA margin 16.1% 15.4% -0.6%
www.cecinvestor.com 23
0.20x 0.16x
0.54x 0.57x0.72x 0.63x
1.93x
0.0x
0.5x
1.0x
1.5x
2.0x
2.5x
2011 2012 2013 2014
Debt/ Equity Debt/ EBITDA
15
40
10
26
14
(13)
10 6
(20)
0
20
40
60
2011 2012 2013 2014
Capex Free Cash Flow
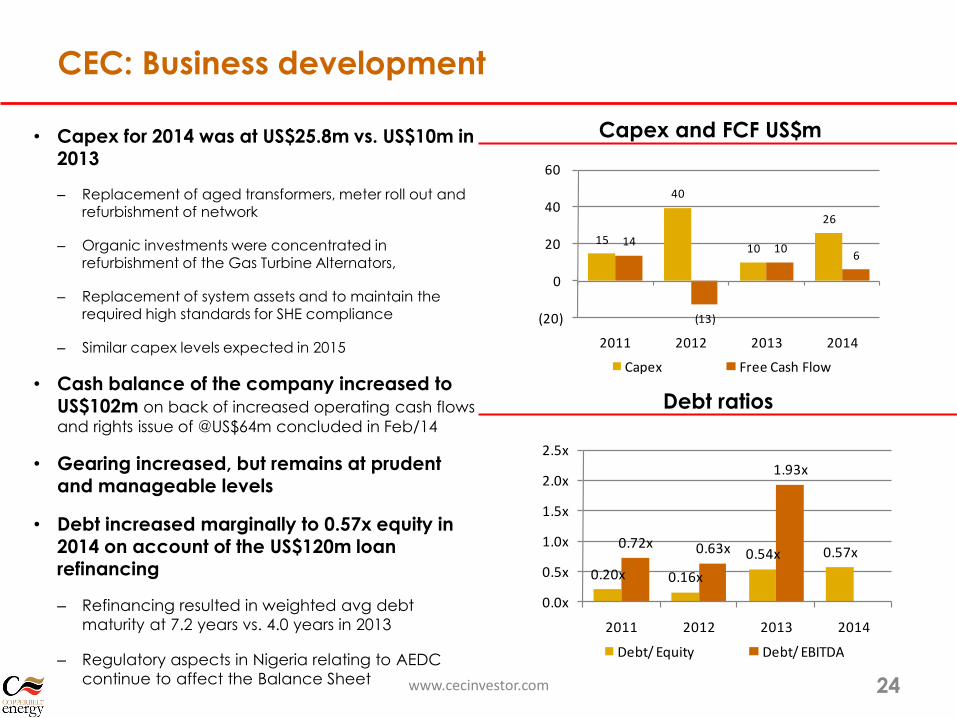
CEC: Business development
24
Capex and FCF US$m
Debt ratios
www.cecinvestor.com
• Capex for 2014 was at US$25.8m vs. US$10m in 2013
– Replacement of aged transformers, meter roll out and refurbishment of network
– Organic investments were concentrated in refurbishment of the Gas Turbine Alternators,
– Replacement of system assets and to maintain the required high standards for SHE compliance
– Similar capex levels expected in 2015
• Cash balance of the company increased to US$102m on back of increased operating cash flows
and rights issue of @US$64m concluded in Feb/14
• Gearing increased, but remains at prudent and manageable levels
• Debt increased marginally to 0.57x equity in 2014 on account of the US$120m loan refinancing
– Refinancing resulted in weighted avg debt
maturity at 7.2 years vs. 4.0 years in 2013
– Regulatory aspects in Nigeria relating to AEDC
continue to affect the Balance Sheet
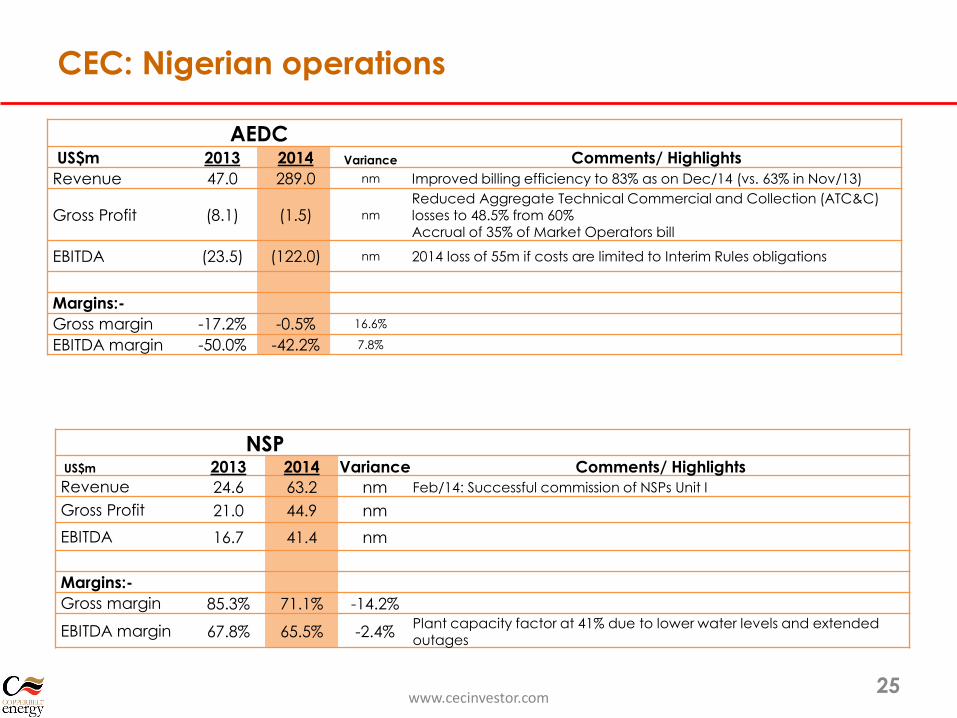
CEC: Nigerian operations
AEDCUS$m 2013 2014 Variance Comments/ Highlights
Revenue 47.0 289.0 nm Improved billing efficiency to 83% as on Dec/14 (vs. 63% in Nov/13)
Gross Profit (8.1) (1.5) nm
Reduced Aggregate Technical Commercial and Collection (ATC&C) losses to 48.5% from 60%Accrual of 35% of Market Operators bill
EBITDA (23.5) (122.0) nm 2014 loss of 55m if costs are limited to Interim Rules obligations
Margins:-
Gross margin -17.2% -0.5% 16.6%
EBITDA margin -50.0% -42.2% 7.8%
NSPUS$m 2013 2014 Variance Comments/ Highlights
Revenue 24.6 63.2 nm Feb/14: Successful commission of NSPs Unit I
Gross Profit 21.0 44.9 nm
EBITDA 16.7 41.4 nm
Margins:-
Gross margin 85.3% 71.1% -14.2%
EBITDA margin 67.8% 65.5% -2.4%Plant capacity factor at 41% due to lower water levels and extended outages
www.cecinvestor.com25
Focus on AEDC
www.cecinvestor.com 26
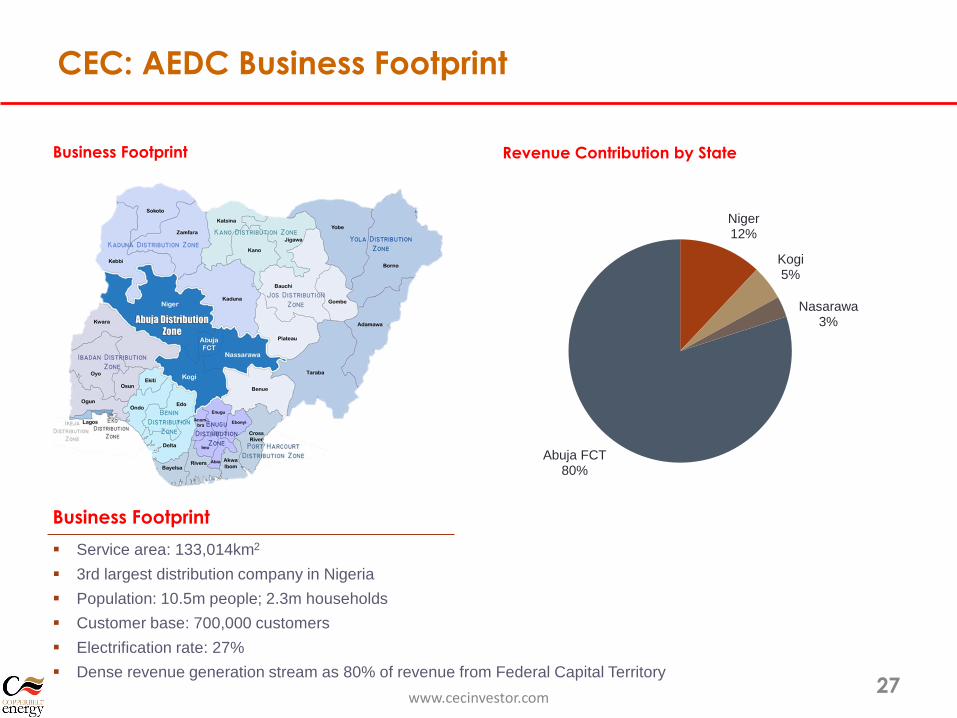
CEC: AEDC Business Footprint
www.cecinvestor.com27
Revenue Contribution by StateBusiness Footprint
Service area: 133,014km2
3rd largest distribution company in Nigeria
Population: 10.5m people; 2.3m households
Customer base: 700,000 customers
Electrification rate: 27%
Dense revenue generation stream as 80% of revenue from Federal Capital Territory
Business Footprint
Niger12%
Kogi5%
Nasarawa3%
Abuja FCT80%
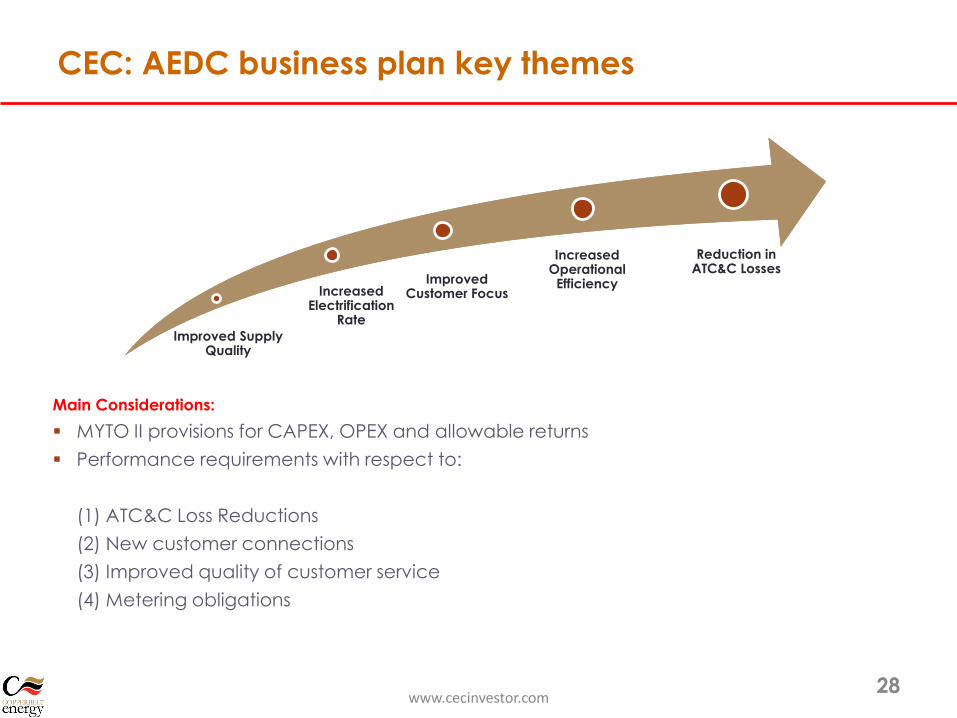
CEC: AEDC business plan key themes
www.cecinvestor.com28
Improved Supply Quality
Increased Electrification
Rate
Improved Customer Focus
Increased Operational
Efficiency
Reduction in ATC&C Losses
Main Considerations:
MYTO II provisions for CAPEX, OPEX and allowable returns
Performance requirements with respect to:
(1) ATC&C Loss Reductions
(2) New customer connections
(3) Improved quality of customer service
(4) Metering obligations
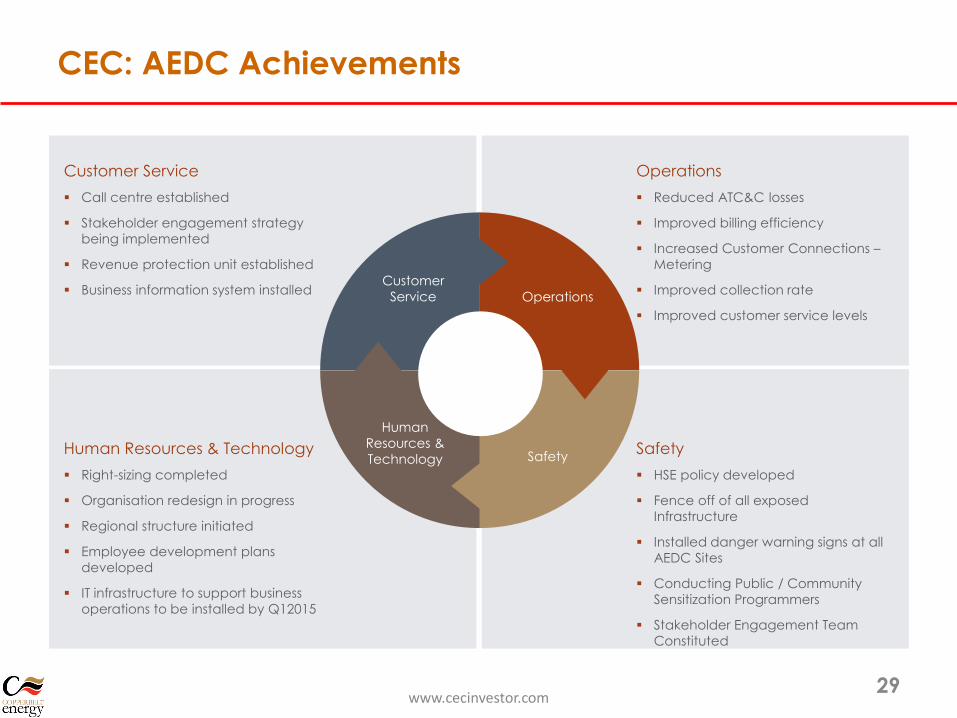
CEC: AEDC Achievements
www.cecinvestor.com29
Operations
Reduced ATC&C losses
Improved billing efficiency
Increased Customer Connections –
Metering
Improved collection rate
Improved customer service levels
Human
Resources &
Technology
Operations
Safety
Customer
Service
Safety
HSE policy developed
Fence off of all exposed
Infrastructure
Installed danger warning signs at all
AEDC Sites
Conducting Public / Community
Sensitization Programmers
Stakeholder Engagement Team
Constituted
Customer Service
Call centre established
Stakeholder engagement strategy
being implemented
Revenue protection unit established
Business information system installed
Human Resources & Technology
Right-sizing completed
Organisation redesign in progress
Regional structure initiated
Employee development plans
developed
IT infrastructure to support business
operations to be installed by Q12015
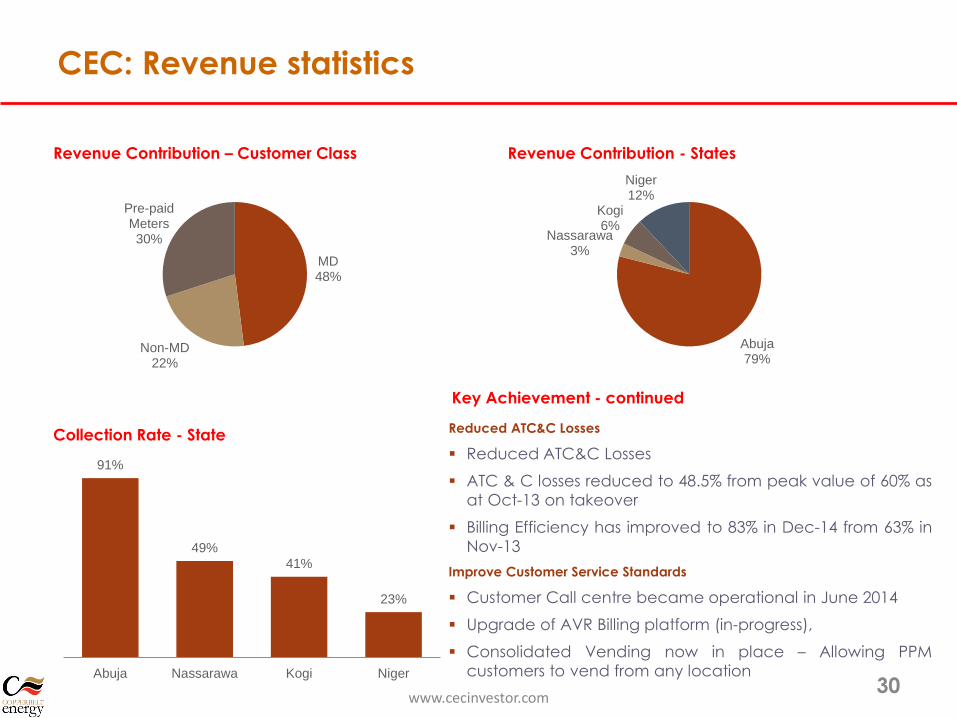
CEC: Revenue statistics
www.cecinvestor.com30
Revenue Contribution - StatesRevenue Contribution – Customer Class
Key Achievement - continued
Collection Rate - StateReduced ATC&C Losses
Reduced ATC&C Losses
ATC & C losses reduced to 48.5% from peak value of 60% as
at Oct-13 on takeover
Billing Efficiency has improved to 83% in Dec-14 from 63% in
Nov-13
Improve Customer Service Standards
Customer Call centre became operational in June 2014
Upgrade of AVR Billing platform (in-progress),
Consolidated Vending now in place – Allowing PPM
customers to vend from any location
MD48%
Non-MD22%
Pre-paid Meters30%
Abuja79%
Nassarawa3%
Kogi6%
Niger12%
91%
49%
41%
23%
Abuja Nassarawa Kogi Niger
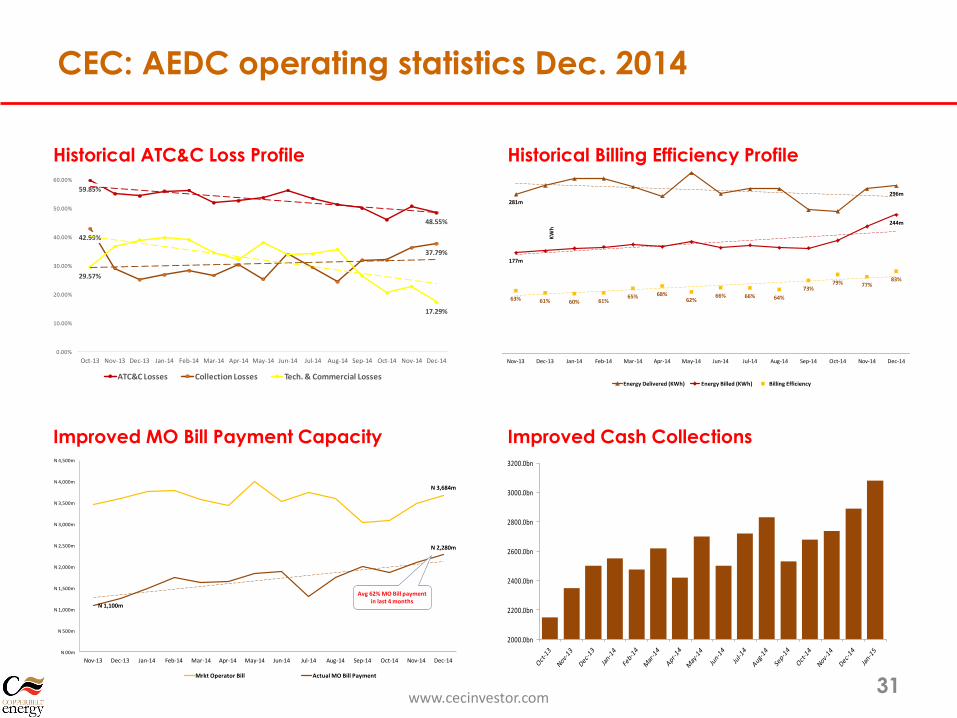
CEC: AEDC operating statistics Dec. 2014
www.cecinvestor.com31
281m
296m
177m
244m
63% 61% 60% 61%65% 68%
62%66% 66% 64%
73%79% 77%
83%
0.0%
20.0%
40.0%
60.0%
80.0%
100.0%
120.0%
140.0%
160.0%
180.0%
200.0%
00m
50m
100m
150m
200m
250m
300m
350m
Nov-13 Dec-13 Jan-14 Feb-14 Mar-14 Apr-14 May-14 Jun-14 Jul-14 Aug-14 Sep-14 Oct-14 Nov-14 Dec-14
KW
h
Energy Delivered (KWh) Energy Billed (KWh) Billing Efficiency
59.85%
48.55%
42.99%
37.79%
29.57%
17.29%
0.00%
10.00%
20.00%
30.00%
40.00%
50.00%
60.00%
70.00%
Oct-13 Nov-13 Dec-13 Jan-14 Feb-14 Mar-14 Apr-14 May-14 Jun-14 Jul-14 Aug-14 Sep-14 Oct-14 Nov-14 Dec-14
ATC&C Losses Collection Losses Tech. & Commercial Losses
N 3,684m
N 1,100m
N 2,280m
N 00m
N 500m
N 1,000m
N 1,500m
N 2,000m
N 2,500m
N 3,000m
N 3,500m
N 4,000m
N 4,500m
Nov-13 Dec-13 Jan-14 Feb-14 Mar-14 Apr-14 May-14 Jun-14 Jul-14 Aug-14 Sep-14 Oct-14 Nov-14 Dec-14
Mrkt Operator Bill Actual MO Bill Payment
Avg 62% MO Bill payment in last 4 months
2000.0bn
2200.0bn
2400.0bn
2600.0bn
2800.0bn
3000.0bn
3200.0bn
Historical Billing Efficiency ProfileHistorical ATC&C Loss Profile
Improved Cash CollectionsImproved MO Bill Payment Capacity
Pipeline
www.cecinvestor.com 32
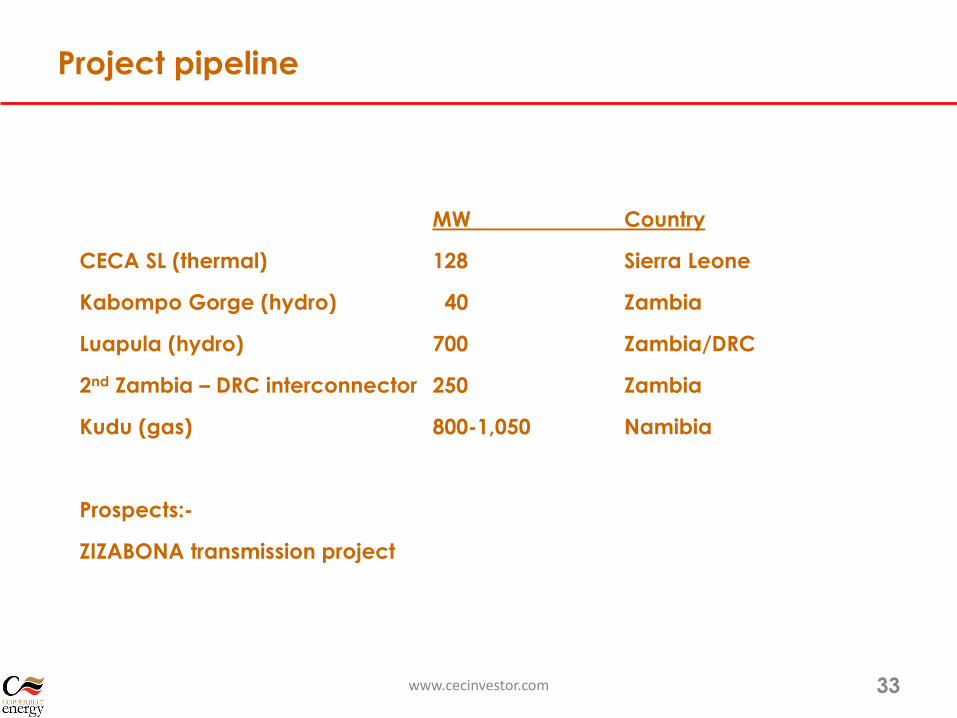
Project pipeline
www.cecinvestor.com 33
MW Country
CECA SL (thermal) 128 Sierra Leone
Kabompo Gorge (hydro) 40 Zambia
Luapula (hydro) 700 Zambia/DRC
2nd Zambia – DRC interconnector 250 Zambia
Kudu (gas) 800-1,050 Namibia
Prospects:-
ZIZABONA transmission project

Outlook
www.cecinvestor.com 34
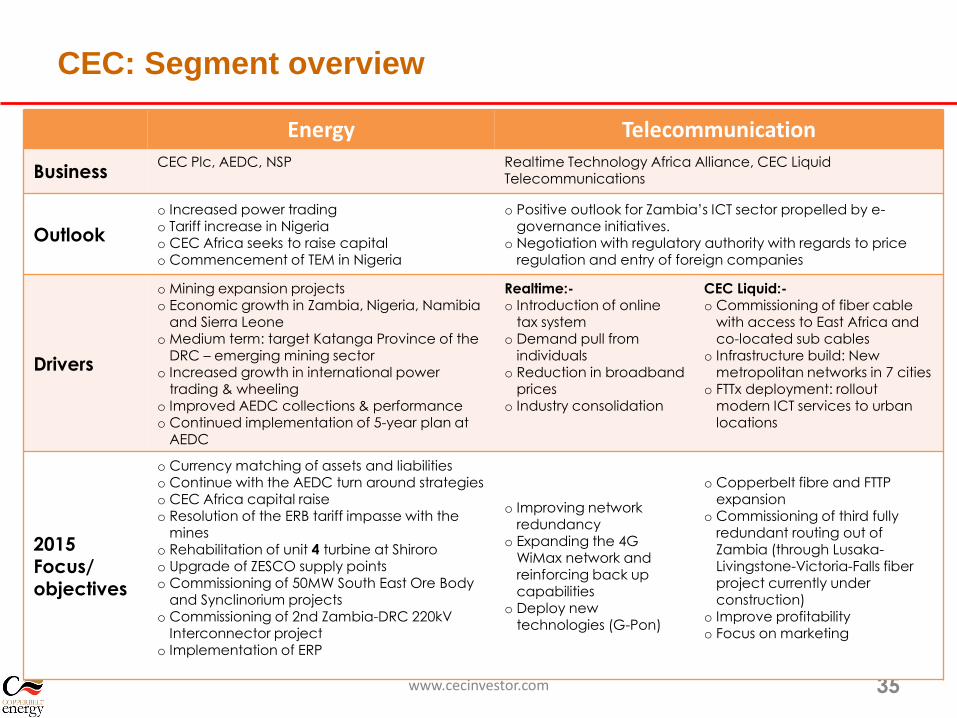
CEC: Segment overview
www.cecinvestor.com 35
Energy Telecommunication
BusinessCEC Plc, AEDC, NSP Realtime Technology Africa Alliance, CEC Liquid
Telecommunications
Outlook
o Increased power tradingo Tariff increase in Nigeriao CEC Africa seeks to raise capitalo Commencement of TEM in Nigeria
o Positive outlook for Zambia’s ICT sector propelled by e-governance initiatives.
o Negotiation with regulatory authority with regards to price regulation and entry of foreign companies
Drivers
o Mining expansion projectso Economic growth in Zambia, Nigeria, Namibia
and Sierra Leoneo Medium term: target Katanga Province of the
DRC – emerging mining sectoro Increased growth in international power
trading & wheelingo Improved AEDC collections & performanceo Continued implementation of 5-year plan at
AEDC
Realtime:-o Introduction of online
tax systemo Demand pull from
individualso Reduction in broadband
priceso Industry consolidation
CEC Liquid:-o Commissioning of fiber cable
with access to East Africa and co-located sub cables
o Infrastructure build: New metropolitan networks in 7 cities
o FTTx deployment: rollout modern ICT services to urban locations
2015 Focus/ objectives
o Currency matching of assets and liabilities o Continue with the AEDC turn around strategieso CEC Africa capital raiseo Resolution of the ERB tariff impasse with the
mineso Rehabilitation of unit 4 turbine at Shiroroo Upgrade of ZESCO supply pointso Commissioning of 50MW South East Ore Body
and Synclinorium projectso Commissioning of 2nd Zambia-DRC 220kV
Interconnector projecto Implementation of ERP
o Improving network redundancy
o Expanding the 4G WiMax network and reinforcing back up capabilities
o Deploy new technologies (G-Pon)
o Copperbelt fibre and FTTP expansion
o Commissioning of third fully redundant routing out of Zambia (through Lusaka-Livingstone-Victoria-Falls fiber project currently under construction)
o Improve profitabilityo Focus on marketing
Q&A
www.cecinvestor.com 36