Embed Size (px)
Citation preview

High Throughput CYP Inhibition Assays Using RapidFire® Mass Spectrometry and Conventional Drug Probe Substrates
David M. Stresser, Ph.D.Program ManagerBD GentestSM Contract Research Services
Presentation overview
• Why conduct cytochrome P450 inhibition testing?
• Strategies for high throughput screening
• Advantages of BD Gentest assays coupled with RapidFire MS from Biotrove– Price + Speed + Reliability

Cytochrome P450 Inhibition
• Major cause of drug drug interactions
• Want to avoid because:– Ethical considerations
– Competition (i.e. for “me too” drug)
– Product non-approval or withdrawal
• Drugs Removed from or Restricted in the U.S. Market Because of Drug Interactions
– Terfenadine (Seldane®) February 1998
– Mibefradil (Posicor®) June 1998
– Cisapride (Propulsid®) January 2000

Drug A
Drug A Metabolite of Drug A
Metabolism-based Drug-drug interaction - Mechanism
Metabolite of Drug A
Therapeutic levels
fixed rate of metabolism(e.g. CYP3A4)
Liver
Liver
Drug B
Liver
Result
Toxic accumulation of Drug A or B
Metabolite of Drug B
“waiting” Victim
Victim with perpetrator
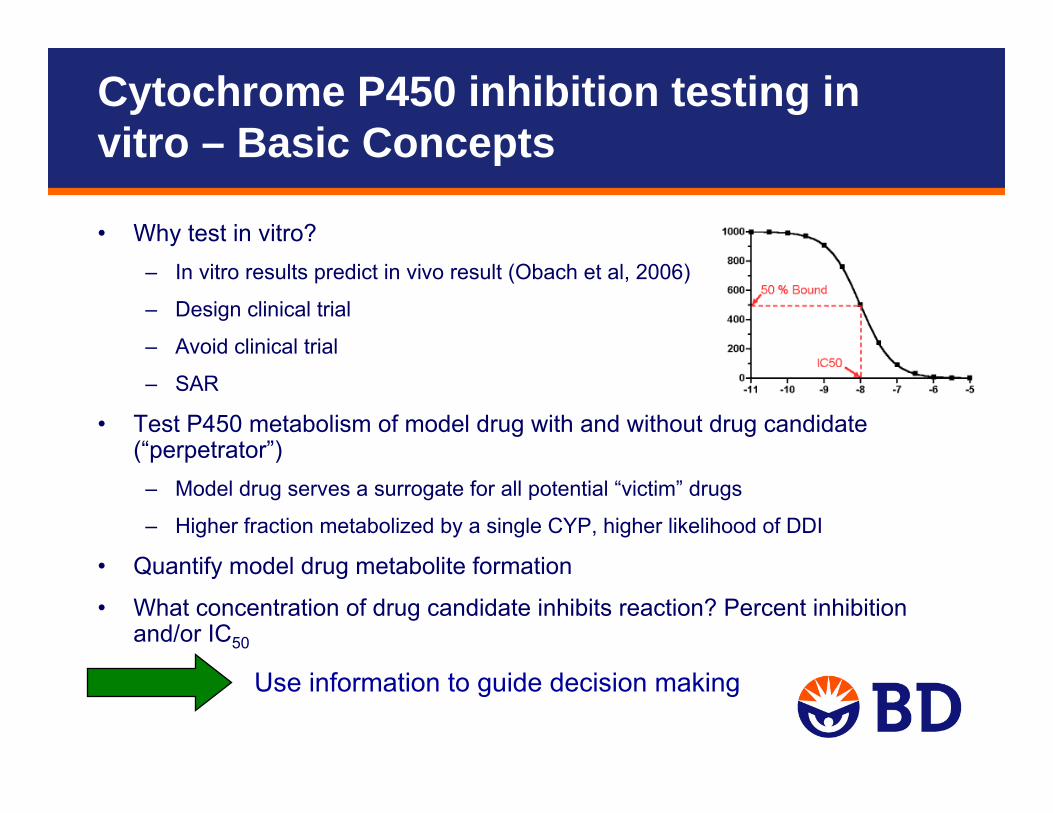
• Why test in vitro?– In vitro results predict in vivo result (Obach et al, 2006)
– Design clinical trial
– Avoid clinical trial
– SAR
• Test P450 metabolism of model drug with and without drug candidate (“perpetrator”)
– Model drug serves a surrogate for all potential “victim” drugs
– Higher fraction metabolized by a single CYP, higher likelihood of DDI
• Quantify model drug metabolite formation
• What concentration of drug candidate inhibits reaction? Percent inhibition and/or IC50
Cytochrome P450 inhibition testing in vitro – Basic Concepts
Use information to guide decision making

Characteristics of robust P450 inhibition assays
• Reaction must be single P450 isoform-specific– Use “probe” substrate with heterogeneous enzyme source (e.g. human liver microsomes or
enzyme cocktail)– Wider choice of substrate with cDNA-expressed enzyme
• Rapid metabolism of substrate– Get more metabolite, faster– Better sensitivity
• Short incubation time– Reduce inhibitor depletion (that can lead to artifacts)– Improves sensitivity in detecting time-dependent inhibitors
• Low protein concentration– ≤ 0.3 mg/mL– Reduce nonspecific binding to microsomes (that can lead to artifacts)
• Metabolite formation linear with:– Incubation time– Microsomal protein concentration
• Scalable across discovery and development

Strategies for high throughput CYP inhibition screening

Fluorometric HT P450 inhibition assays
• Fluorometric – Can monitor metabolite in real time– Multiple reads per plate for time-dependent inhibition analysis– Most do not require signal development period
• Decade of validation• Does require understanding of potential for interference (e.g.
autofluorescence of test articles)
O O
CH3
HO
N (+)
O O
CH3
O
N (+)
AMMCNo fluorescence
MetaboliteFluorescent
CYP2D6 Specific
Luminometry based methods
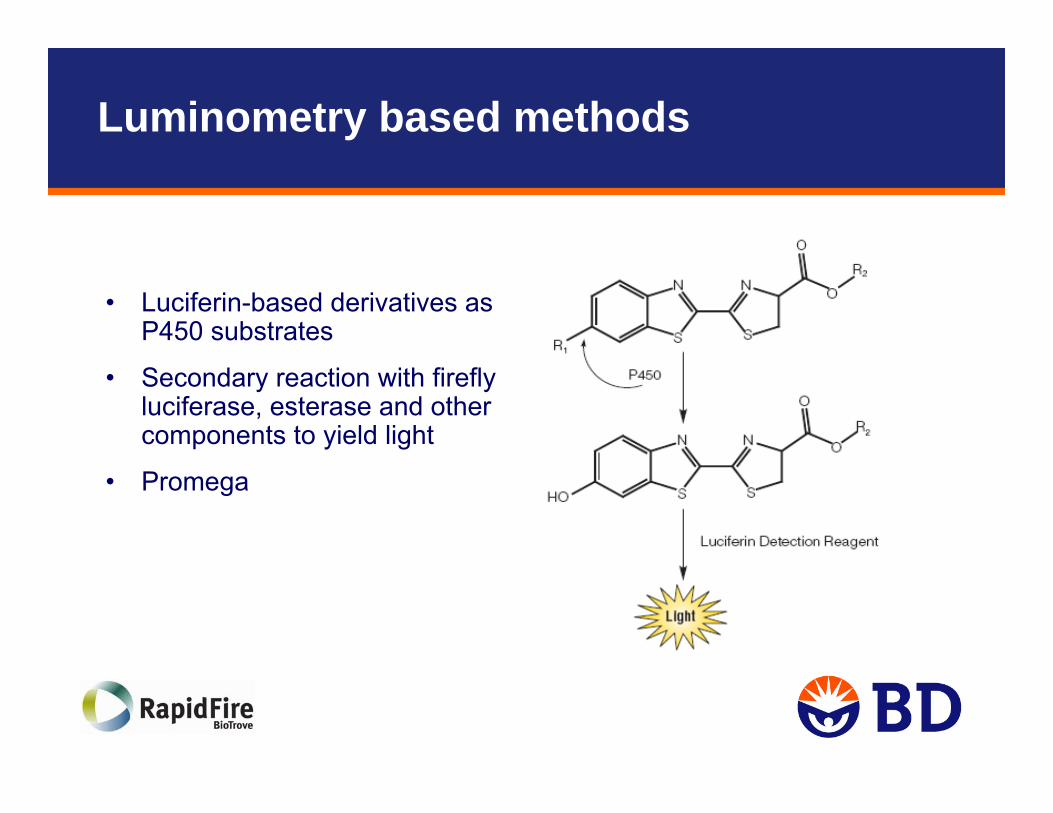
• Luciferin-based derivatives as P450 substrates
• Secondary reaction with firefly luciferase, esterase and other components to yield light
• Promega

Guidance for Industry – Sept, 2006
nifedipine oxidation
terfenadine C-hydroxylationtestosterone 6ß -hydroxylationtriazolam 4-hydroxylation
dextromethorphan N-demethylation
erythromycin N-demethylationmidazolam 1-hydroxylation
3A4/5*
aniline 4-hydroxylationlauric acid 11-hydroxylationp-nitrophenol 3-hydroxylationchlorzoxazone 6-hydroxylation
2E1
dextromethorphan O-demethylation
debrisoquine 4-hydroxylation( ± )-bufuralol 1’-hydroxylation2D6
fluoxetine O-dealkylationomeprazole 5-hydroxylationS-mephenytoin 4’-
hydroxylation2C19
diclofenac 4’-hydroxylationphenytoin-4-hydroxylationS-warfarin 7-hydroxylation
flurbiprofen 4’-hydroxylationtolbutamide methyl-hydroxylation
2C9
rosiglitazone para-hydroxylationamodiaquine N-deethylationTaxol 6α-hydroxylation2C8
S-mephenytoin-N-demethylationbupropion-hydroxylationpropofol hydroxylationefavirenz hydroxylase
2B6
nicotine C-oxidationcoumarin-7-hydroxylation
2A6
tacrine 1-hydroxylationcaffeine-3-N-demethylationtheophylline-N-demethylation7-ethoxyresorufin-O-deethylationphenacetin-O-deethylation
1A2
AcceptablePreferredSubstrateSubstrate
CYP
* Recommend use of 2 structurally unrelated CYP3A4/5 substrates for evaluation of in vitro CYP3A inhibition. If the drug inhibits at least one CYP3A substrate in vitro, then in vivo evaluation is warranted.
Radiometric - [14C]-aldehyde release
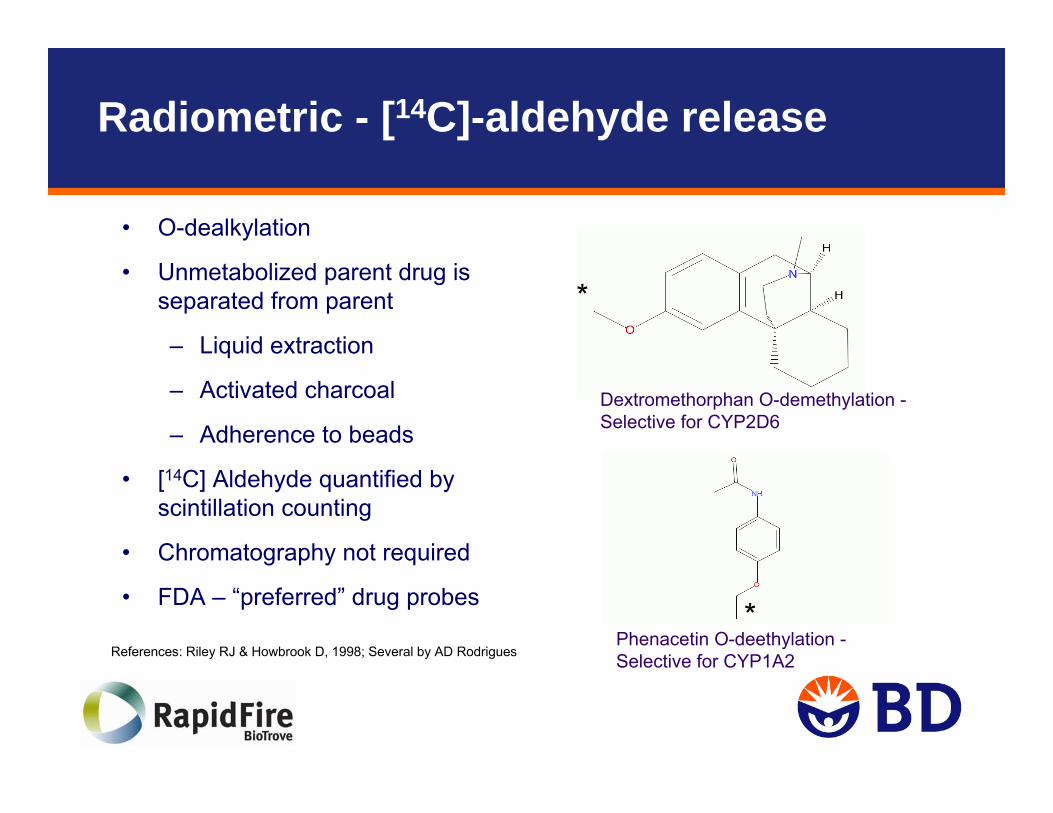
• O-dealkylation
• Unmetabolized parent drug is separated from parent
– Liquid extraction
– Activated charcoal
– Adherence to beads
• [14C] Aldehyde quantified by scintillation counting
• Chromatography not required
• FDA – “preferred” drug probes
*
*
Dextromethorphan O-demethylation -Selective for CYP2D6
Phenacetin O-deethylation -Selective for CYP1A2References: Riley RJ & Howbrook D, 1998; Several by AD Rodrigues

LC/MS/MS – Selectivity permits higher throughput
• Use standard “drug” probe substrates and chromatographic separation of metabolite
• Use LC/MS/MS to obtain Selectivity– Low/no interference from other analytes – LC run times 2-4 min– Label-free– Stable-isotope labeled internal standards for major CYP metabolites are available
and control for ion suppression
MRM: 151-110 for acetaminophen
MRM (IS): 155-110-for acetaminophen-[13C3
15N]
Desired metabolite

– Two Cassette strategies:1. Pool samples after individual incubations for analysis
– Consider effect of dilution on analytical sensitivity
– 3-4 analytes in a 2 min cycle?
2. Pool desired enzymes/substrates into single incubation assay – Multiple considerations (see next slide)
– In both cases, multiple analytes to be quantified in same injection
Higher Throughput using LC/MS - Selectivity permits multiple analytes in same run – cassette strategy

Considerations for N in 1 Incubation
• Incubation time– Must be same if N in 1
• With HLM, dictated by slowest turnover substrate (S-mephenytoin for CYP2C19)
– Can be different with N in 2 • Short for rapid turnover (e.g. amodiaquine, midazolam)
• Long for slow turnover probe substrates (e.g. S-meph, phenacetin)
• (For N in 2, can also modify protein concentration to keep incubation time same)
• Enzyme protein concentration – Must be same if N in 1
• With HLM, dictated by slowest turnover substrate (S-meph)
• Tailor-make HLM pool (“high” CYP2C19 pool)
• Tailor-make cDNA-expressed enzyme pool (Weaver et al, 2003; Di et al, 2007)
– Can be different for N in 2 (rapid and slow turnover probe substrates)

Ideal high throughput method…
• Same assay method in discovery and in development– Drug probes – conforms to FDA guidance
• No pooling– Maintains analytical sensitivity
– No need to validate the approach
• In a CRO:– meets expectations for price, turnaround time, reliability

High-throughput P450 Inhibition Services thru Partnership with BioTrove Inc

RapidFire mass spectrometry
• RapidFire from BioTrove (figure at right)
• Replaces HPLC with a rapid sample purification system
• Micro scale solid-phase extraction (μSPE)
• Isocratic run
• 5-8 sec LC/MS cycle times
d4-1’OH-midazolam internal standard (100 nM)
OH-midazolam product
Raw Data: 96-well plates on Agilent-641096-well plate analyzed in under 12 minutes
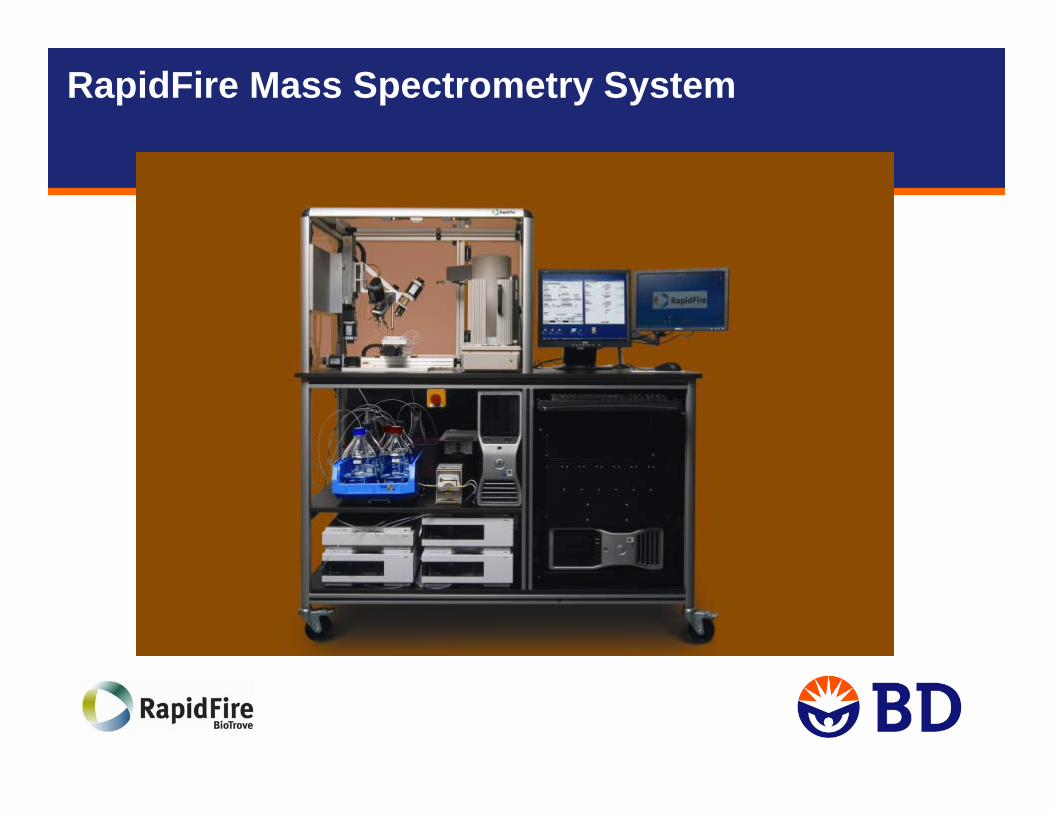
RapidFire Mass Spectrometry System

RapidFire Mass Spectrometry System
How we conduct our assays
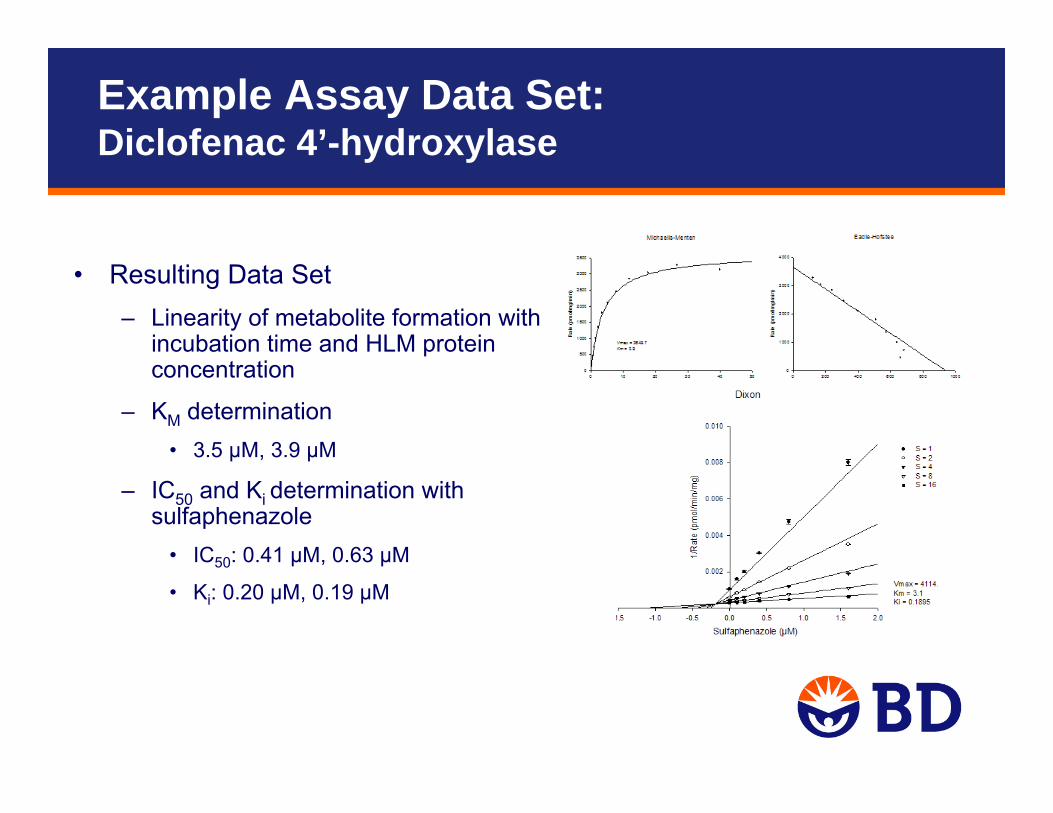
Example Assay Data Set: Diclofenac 4’-hydroxylase
• Resulting Data Set– Linearity of metabolite formation with
incubation time and HLM protein concentration
– KM determination• 3.5 µM, 3.9 µM
– IC50 and Ki determination with sulfaphenazole
• IC50: 0.41 µM, 0.63 µM
• Ki: 0.20 µM, 0.19 µM
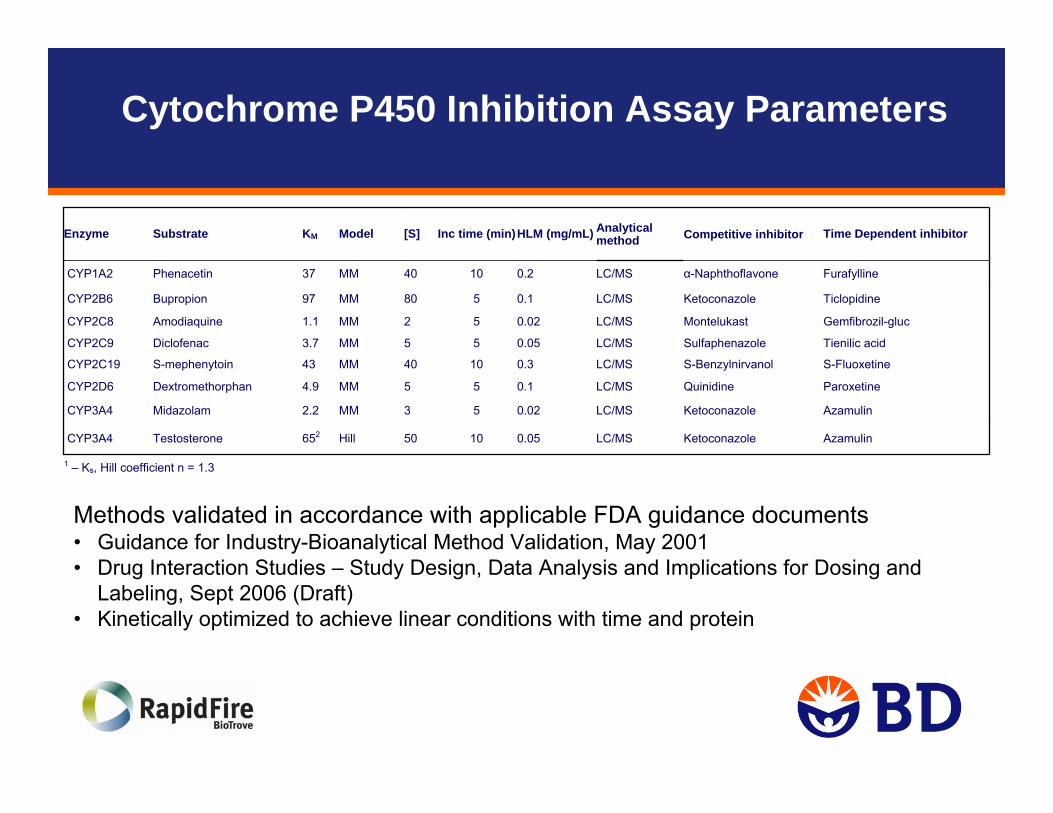
Cytochrome P450 Inhibition Assay Parameters
Tienilic acidSulfaphenazoleLC/MS0.0555MM3.7DiclofenacCYP2C9
TiclopidineKetoconazoleLC/MS0.1580MM97BupropionCYP2B6
Gemfibrozil-glucMontelukastLC/MS0.0252MM1.1AmodiaquineCYP2C8
LC/MS
LC/MS
LC/MS
LC/MS
LC/MS
Analytical method
AzamulinKetoconazole0.051050Hill652TestosteroneCYP3A4
Azamulin
Paroxetine
S-Fluoxetine
Furafylline
Time Dependent inhibitor
Ketoconazole
Quinidine
S-Benzylnirvanol
α-Naphthoflavone
Competitive inhibitor
0.02
0.1
0.3
0.2
HLM (mg/mL)
3
5
40
40
[S]
MM
MM
MM
MM
Model
2.2
4.9
43
37
KM
Midazolam
Dextromethorphan
S-mephenytoin
Phenacetin
Substrate
1 – Ks, Hill coefficient n = 1.3
CYP3A4
CYP2D6
CYP2C19
CYP1A2
Enzyme
5
10
5
10
Inc time (min)
Methods validated in accordance with applicable FDA guidance documents• Guidance for Industry-Bioanalytical Method Validation, May 2001• Drug Interaction Studies – Study Design, Data Analysis and Implications for Dosing and
Labeling, Sept 2006 (Draft)• Kinetically optimized to achieve linear conditions with time and protein

IC50 and Ki values obtained with conventional LC/MS
0.9Competitive2119KetoconazoleTestosteroneCYP3A4
1.8Mixed916KetoconazoleMidazolamCYP3A4
1.2Competitive5062QuinidineDextromethorphanCYP2D6
1.2Competitive340410(S)-Benzylnirvanol(S)-MephenytoinCYP2C19
2.7Competitive195520SulfaphenazoleDiclofenacCYP2C9
1.7Competitive1322MontelukastAmodiaquineCYP2C8
1.6Competitive14002250KetoconazoleBupropionCYP2B6
2.7Mixed397,8-BenzoflavonePhenacetinCYP1A2
ratio IC50/KiBest fit modelmean Ki
(nM)mean IC50
(nM)InhibitorSubstrateEnzyme
Values represent means of two independent determinations; GlobalValues represent means of two independent determinations; Global CV = 0.13CV = 0.13 Mean = 1.7Mean = 1.7
Extensive experimental detail available in the following publication:
Perloff et al (2009) Validation of cytochrome P450 time-dependent inhibition assays: a two-time point IC50 shift approach facilitates kinact assay design. Xenobiotica 39:99-112
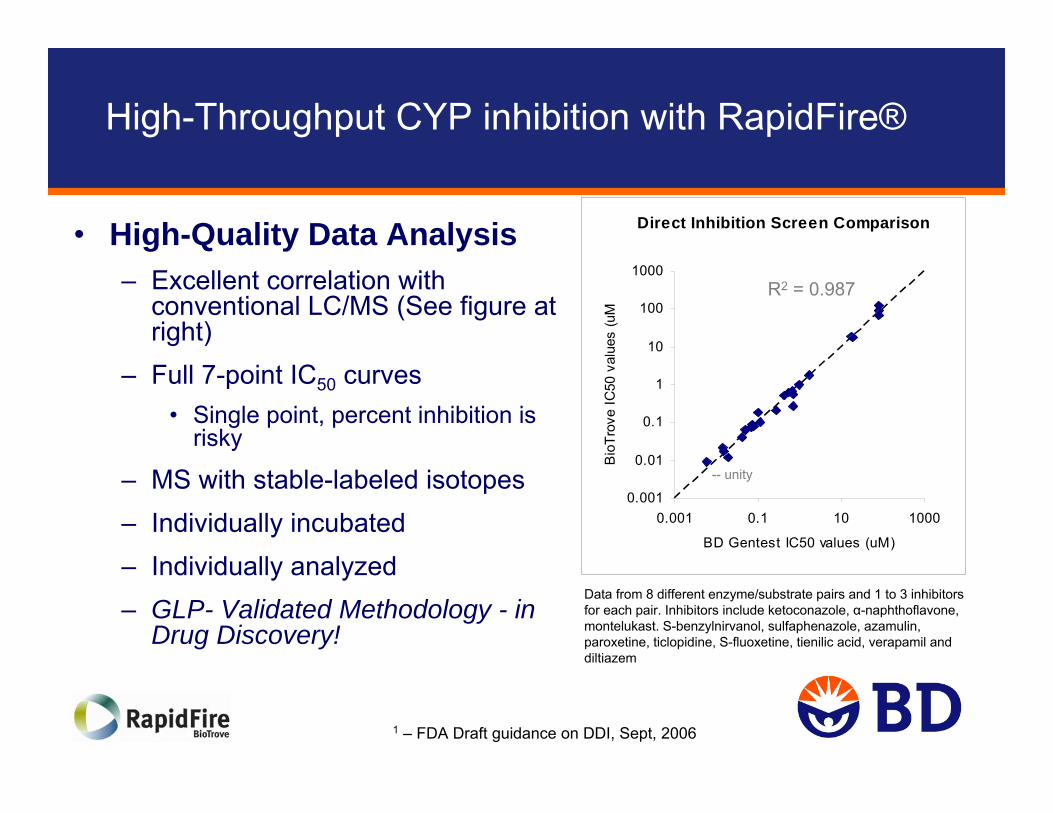
High-Throughput CYP inhibition with RapidFire®
• High-Quality Data Analysis– Excellent correlation with
conventional LC/MS (See figure at right)
– Full 7-point IC50 curves• Single point, percent inhibition is
risky
– MS with stable-labeled isotopes– Individually incubated – Individually analyzed– GLP- Validated Methodology - in
Drug Discovery!
Data from 8 different enzyme/substrate pairs and 1 to 3 inhibitors for each pair. Inhibitors include ketoconazole, α-naphthoflavone, montelukast. S-benzylnirvanol, sulfaphenazole, azamulin, paroxetine, ticlopidine, S-fluoxetine, tienilic acid, verapamil and diltiazem
1 – FDA Draft guidance on DDI, Sept, 2006
Direct Inhibition Screen Comparison
0.001
0.01
0.1
1
10
100
1000
0.001 0.1 10 1000
BD Gentest IC50 values (uM)
Bio
Trov
e IC
50 v
alue
s (u
M
R2 = 0.987
-- unity

Analysis of ritonavir by IC50 shift –midazolam as substrate for CYP3A4
0%
20%
40%
60%
80%
100%
0.0001 0.001 0.01 0.1 1
Inhibitor conc secondary inc. [µM]
% re
mai
ning
act
ivity w/NADPH
w/o NADPH
0%
20%
40%
60%
80%
100%
0.0001 0.001 0.01 0.1 1
Inhibitor conc secondary inc. [µM]
% re
mai
ning
act
ivity w/NADPH
w/o NADPH
• IC50 - RapidFire
– w/ NADPH = 11 nM
– w/o NADPH = 24 nM
• Shift = 2.17
• IC50 - Conventional
– w/ NADPH = 11 nM
– w/o NADPH = 22 nM
• Shift = 2.04
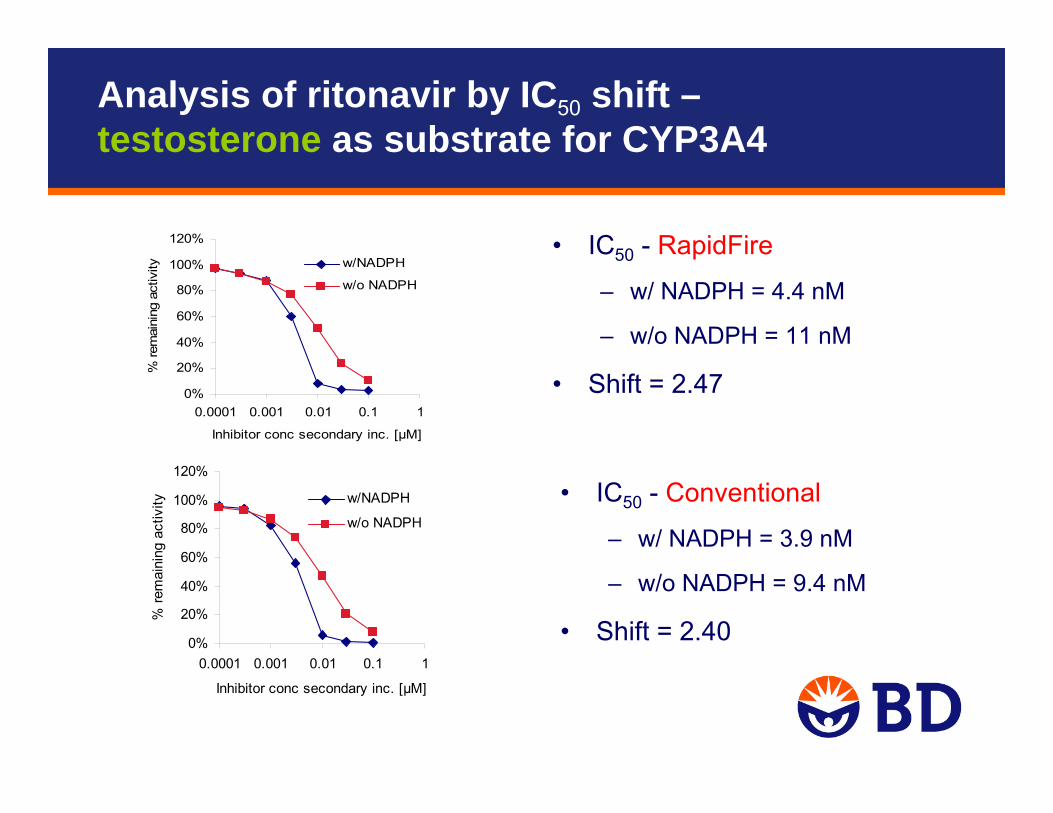
Analysis of ritonavir by IC50 shift –testosterone as substrate for CYP3A4
• IC50 - RapidFire
– w/ NADPH = 4.4 nM
– w/o NADPH = 11 nM
• Shift = 2.47
• IC50 - Conventional
– w/ NADPH = 3.9 nM
– w/o NADPH = 9.4 nM
• Shift = 2.40
0%
20%
40%
60%
80%
100%
120%
0.0001 0.001 0.01 0.1 1
Inhibitor conc secondary inc. [µM]
% re
mai
ning
act
ivity w/NADPH
w/o NADPH
0%
20%
40%
60%
80%
100%
120%
0.0001 0.001 0.01 0.1 1
Inhibitor conc secondary inc. [µM]
% re
mai
ning
act
ivity w/NADPH
w/o NADPH

The BD-Biotrove Advantage
• Complete sample preparation and data analysis– Customers provide compounds to BD, we conduct incubations,
Biotrove performs analysis - BD provides completed data package to customer
• Rapid Turnaround– Data available in 1 week
• Cost-effective– $250 per 7 point curve
• Time-dependent inhibition assays available
BD Biosciences
• Full spectrum of high throughput ADME Drug Discovery services– CYP inhibition by RapidFire– Metabolic stability in microsomes– Metabolic stability in hepatocytes– Plasma protein binding (Rapid Equilibrium Dialysis)– HT-reaction phenotyping with Supersomes– Caco-2 or MDR1-LLC-PK1 monolayers– Solubility

Questions?
Contact information:Contact information:David M. StresserDavid M. [email protected][email protected] ext 22205115 ext 2220