Embed Size (px)
Citation preview
High Temperature Breakdown Strength and Voltage Endurance Characterization of Nanofilled Polyamideimide
Linda S. Schadler, J. Keith Nelson, Chris Calebrese, Alisha Travelpiece
Rensselaer Polytechnic Institute 110 8th Street
Troy, NY 12180, USA
and Daniel L. Schweickart Air Force Research Laboratory
1950 Fifth Street; MS: AFRL/RQPE Wright Patterson AFB, OH 45433
ABSTRACT
For high temperature wire enamel application, the dielectric properties of nanoscale silica and alumina filled polyamideimide were characterized as a function of filler loading, and temperature. It was found that although the dc breakdown strength improved for both composite systems, only the alumina also exhibited an increase in ac breakdown strength. In addition, the voltage endurance at elevated temperature in both a needle/plate and twisted wire geometry was improved over a narrow range of filler loading (5-7.5 wt%). At room temperature, pulsed electroacoustic analysis (PEA) data does not indicate any difference in space charge buildup in the composite for fields up to 25 kV/mm over a period of 2 h. This is in contrast to other nanocomposite systems, which tend to show mitigation of space charge buildup with the addition of nanoparticles. Dielectric spectroscopy shows that the addition of nanoparticles increases the real permittivity above that expected for volumetric mixing rules. This enhancement is associated with high effective permittivity interfacial areas. No systematic changes in losses in the frequency range between 10-4 and 105 Hz were seen. The results suggest that carrier scattering is the primary mechanism leading to the improved breakdown strength.
Index Terms — Dielectric materials, dielectric breakdown, voltage endurance, polyamideimide.
1 INTRODUCTION
METAL oxide nanoparticle-filled polymers have been shown to have improved dielectric breakdown strength and voltage endurance compared to their unfilled counterparts when appropriate dispersion is achieved [1]. This response has been observed in several systems including nanosilica filled polyethylene [2], MgO filled LDPE [3], and clay filled polymers [4]. There is an active discussion in the literature about the mechanisms leading to the improved response [5] including changes in trap depth and density, free volume, space charge shielding of charge injection, and scattering of carriers from the large number of interfaces.
In a few cases, high temperature results have demonstrated that the breakdown strength in the nanofilled polymers is even higher compared to the unfilled polymer than at room temperature [6, 7]. While there has been some reporting of the breakdown strength of polymers that are stable at high temperature [8], most studies have been carried out at room temperature. Thus, a study focused on the dielectric properties
of a high temperature polymer, polyamideimide, for potential use in high temperature environments was pursued in this work. Among the high temperature polymers of interest, polyimides tend to absorb too much water [8], and others are not appropriate for wire coatings. Thus polyamideimide was the focus of this study due to it’s use in insulating applications [9]. Polyamideimide is polymerized from poly (amide amic acid) and typically has a deflection temperature of close to 300 oC and new formulations can reach higher temperatures [10]. The primary application of interest is magnet wire coatings for use in high temperature environments. The use of wire enamel in random-wound machines, solenoids and similar devices can benefit not only from higher temperature operation, improved voltage endurance and electric strength, but will also be enhanced by the increased erosion resistance common with nanodielectrics.
2 EXPERIMENTAL
Manuscript received on 27 March 2012, in final form 12 July 2012.
2.1 PREPARATION OF NANOFILLED POLYAMIDEIMIDE COMPOSITES
Tritherm B981-N-42 and Tritherm B981-N-35 from Elantas
PDG were used as the matrix material. The materials were supplied as solutions of polyamideimide resin in NMP (N-Methyl-2-pyrrolidone) solvent and contained 35 wt % nonvolatile material.
The two nanofillers were Aerosil 200 (amorphous silica from Degussa) and aluminum oxide (NanoTek from Alfa Aesar) with reported particle diameters of 12 and 40-50 nm respectively.
APTES�
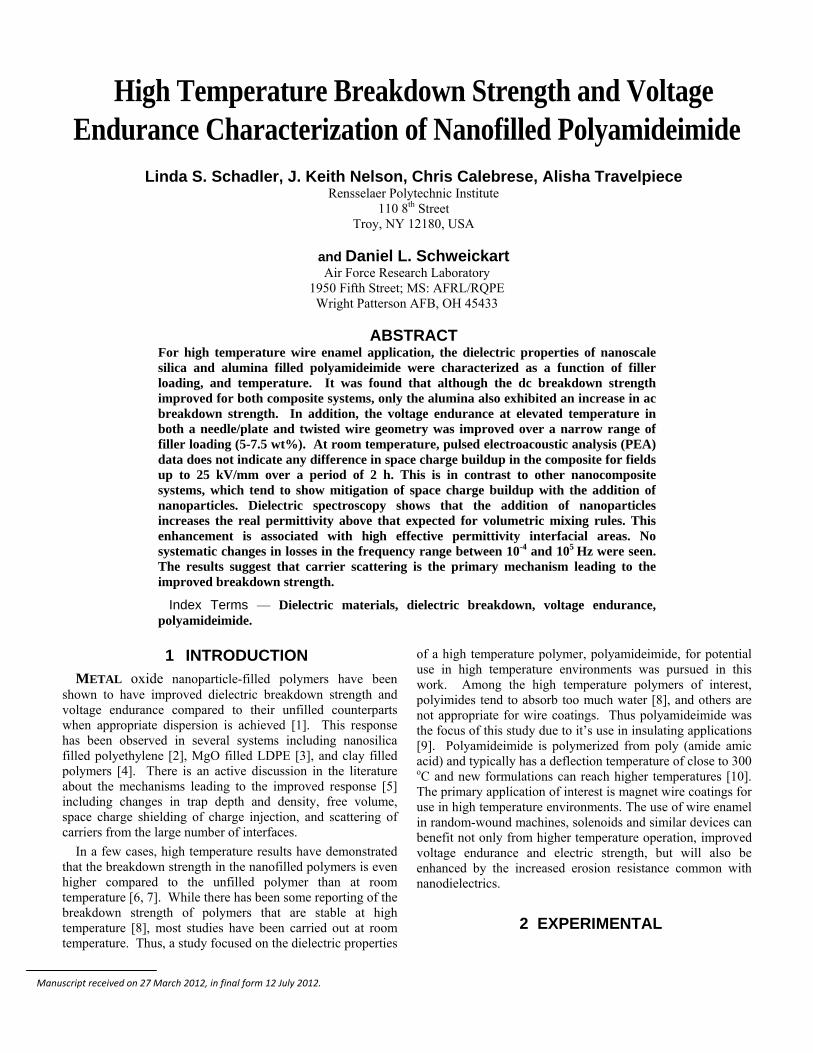
(a)� (b)� Figure 1.(a) Schematic showing Amino Propyltriethoxysilane (APTES); (b) proposed bonding between APTES and silica.
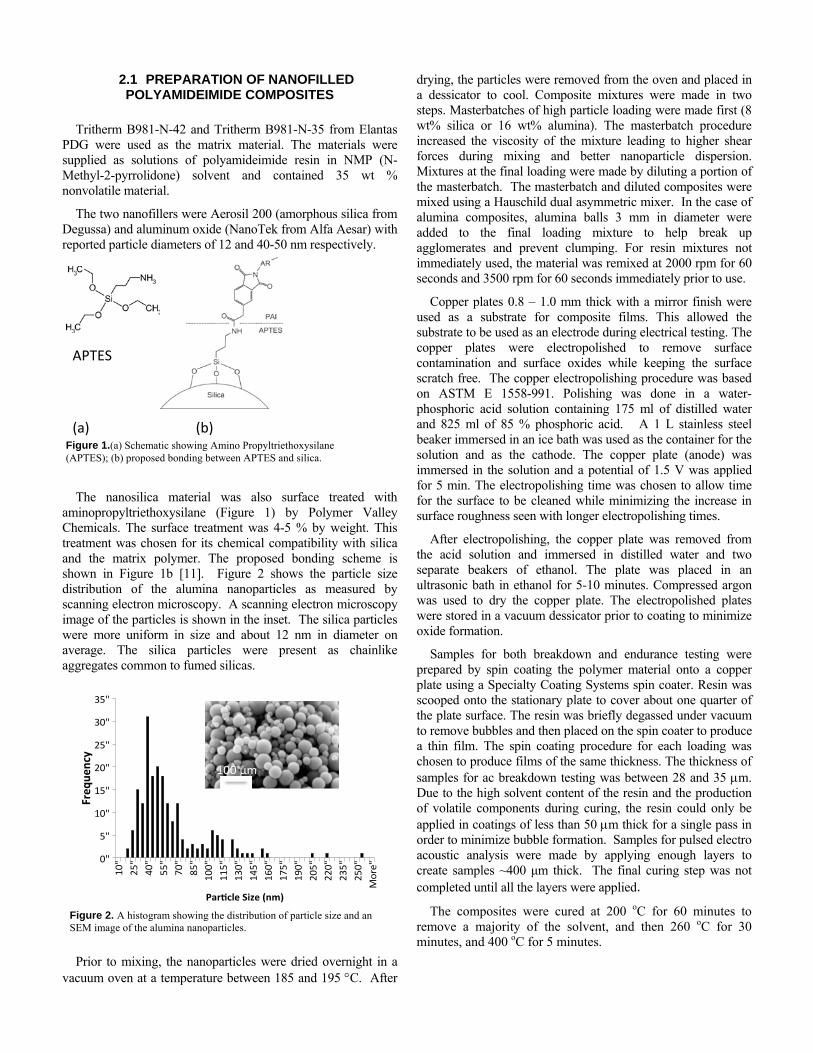
The nanosilica material was also surface treated with aminopropyltriethoxysilane (Figure 1) by Polymer Valley Chemicals. The surface treatment was 4-5 % by weight. This treatment was chosen for its chemical compatibility with silica and the matrix polymer. The proposed bonding scheme is shown in Figure 1b [11]. Figure 2 shows the particle size distribution of the alumina nanoparticles as measured by scanning electron microscopy. A scanning electron microscopy image of the particles is shown in the inset. The silica particles were more uniform in size and about 12 nm in diameter on average. The silica particles were present as chainlike aggregates common to fumed silicas.
Prior to mixing, the nanoparticles were dried overnight in a vacuum oven at a temperature between 185 and 195 C. After
drying, the particles were removed from the oven and placed in a dessicator to cool. Composite mixtures were made in two steps. Masterbatches of high particle loading were made first (8 wt% silica or 16 wt% alumina). The masterbatch procedure increased the viscosity of the mixture leading to higher shear forces during mixing and better nanoparticle dispersion. Mixtures at the final loading were made by diluting a portion of the masterbatch. The masterbatch and diluted composites were mixed using a Hauschild dual asymmetric mixer. In the case of alumina composites, alumina balls 3 mm in diameter were added to the final loading mixture to help break up agglomerates and prevent clumping. For resin mixtures not immediately used, the material was remixed at 2000 rpm for 60 seconds and 3500 rpm for 60 seconds immediately prior to use.
Copper plates 0.8 – 1.0 mm thick with a mirror finish were used as a substrate for composite films. This allowed the substrate to be used as an electrode during electrical testing. The copper plates were electropolished to remove surface contamination and surface oxides while keeping the surface scratch free. The copper electropolishing procedure was based on ASTM E 1558-991. Polishing was done in a water-phosphoric acid solution containing 175 ml of distilled water and 825 ml of 85 % phosphoric acid. A 1 L stainless steel beaker immersed in an ice bath was used as the container for the solution and as the cathode. The copper plate (anode) was immersed in the solution and a potential of 1.5 V was applied for 5 min. The electropolishing time was chosen to allow time for the surface to be cleaned while minimizing the increase in surface roughness seen with longer electropolishing times.
After electropolishing, the copper plate was removed from the acid solution and immersed in distilled water and two separate beakers of ethanol. The plate was placed in an ultrasonic bath in ethanol for 5-10 minutes. Compressed argon was used to dry the copper plate. The electropolished plates were stored in a vacuum dessicator prior to coating to minimize oxide formation.
Samples for both breakdown and endurance testing were prepared by spin coating the polymer material onto a copper plate using a Specialty Coating Systems spin coater. Resin was scooped onto the stationary plate to cover about one quarter of the plate surface. The resin was briefly degassed under vacuum to remove bubbles and then placed on the spin coater to produce a thin film. The spin coating procedure for each loading was chosen to produce films of the same thickness. The thickness of samples for ac breakdown testing was between 28 and 35 m. Due to the high solvent content of the resin and the production of volatile components during curing, the resin could only be applied in coatings of less than 50 m thick for a single pass in order to minimize bubble formation. Samples for pulsed electro acoustic analysis were made by applying enough layers to create samples ~400 μm thick. The final curing step was not completed until all the layers were applied.
100�μm�
0"
5"
10"
15"
20"
25"
30"
35"
10"
25"
40"
55"
70"
85"
100"
115"
130"
145"
160"
175"
190"
205"
220"
235"
250"
More"
The composites were cured at 200 oC for 60 minutes to remove a majority of the solvent, and then 260 oC for 30 minutes, and 400 oC for 5 minutes.
Figure 2. A histogram showing the distribution of particle size and an SEM image of the alumina nanoparticles.
2.2 CHARACTERIZATION
The dispersion of the composites was characterized using scanning electron microscopy (SEM) and transmission electron microscopy (TEM) images. Proper statistical methods are crucial in quantifying the mixing degree of the nanocomposite materials. For this paper, they were used to quantify the alumina dispersion. Quadrat based methods [12, 13], nearest-neighbor distance [12, 14], k-function and Monte Carlo methods [15] are the major approaches used. Higher order nearest-neighbor indices and k-function methods can provide multi-scale information which is comprehensive and good for simulation studies but too complex for quantification studies.
In this paper, quantification was performed using the quadrat method and the nearest neighbor index method (NNI)[16]. The quantification methods break down the degree of mixing of the particles into two independent aspects: Skewness is a measure of the distribution of the fillers in which the lower the number, the more evenly distributed the fillers. The nearest neighbor index (NNI) is a measure of how close the dispersion is to a random dispersion. A value of 1 is random dispersion, below 1 is agglomerated, and above 1 is ordered. [12]. The skewness and nearest neighbor index were then measured as a function of loading[17]. The technique used is described in detail in reference 12. The quadrat size used was 1 micron square, the size of the total area analyzed was 12 μm x 5 μm and the number of random areas sampled was 1000.
Two mm diameter electrode discs were applied to the surface of the polyamideimide film using carbon paint. The discs were allowed to dry in air and the samples were dried overnight at 150 C in vacuum prior to testing. Using this method, between 10 and 15 sites could be measured on each sample. The electrode discs, electrode substrate, and sample thickness were kept constant for all tests as the sample thickness and electrode area are known to affect the breakdown results [18]. At least 20 points were measured for each sample type.
AC and dc breakdown testing were performed in oil to prevent flashover during testing. Breakdown testing at room temperature and at 200 C was carried out in Dow Corning 561 silicone transformer fluid. Breakdown testing at 300 C was carried out in DuPont Krytox XHT-1000 PFPE (perfluoropolyether) oil held in a glass petri dish. For testing above room temperature, the temperature in the furnace was allowed to equilibrate prior to performing the test. An aluminum electrode with rounded edges was used to make contact with the electrode disc on the surface of the sample.
The breakdown testing method was based on ASTM D 3755-97. AC breakdown testing was performed at a ramp rate of 200 V/s (RMS) and dc breakdown testing was performed at a rate of 300 V/s. Each spot was tested three times in succession. The voltage from the first test was recorded as the breakdown voltage, and the subsequent two tests were used to ensure that the cause of breakdown was not flashover. If the subsequent breakdown voltages were closer than 600 V to the initial breakdown voltage then flashover was assumed to have taken place, and the data point discarded.
Endurance testing was carried out in air using a needle-plane electrode configuration. The needles were tungsten carbide needles purchased from Semprex. The radius of the needle tips was between 6 and 9 m. Needle tip radii were measured using optical microscopy. A similar configuration has been used by others, but with a specific gap between the needle and the sample [11]. In this case, the needle was placed on the sample using only the weight of the needle to apply pressure.
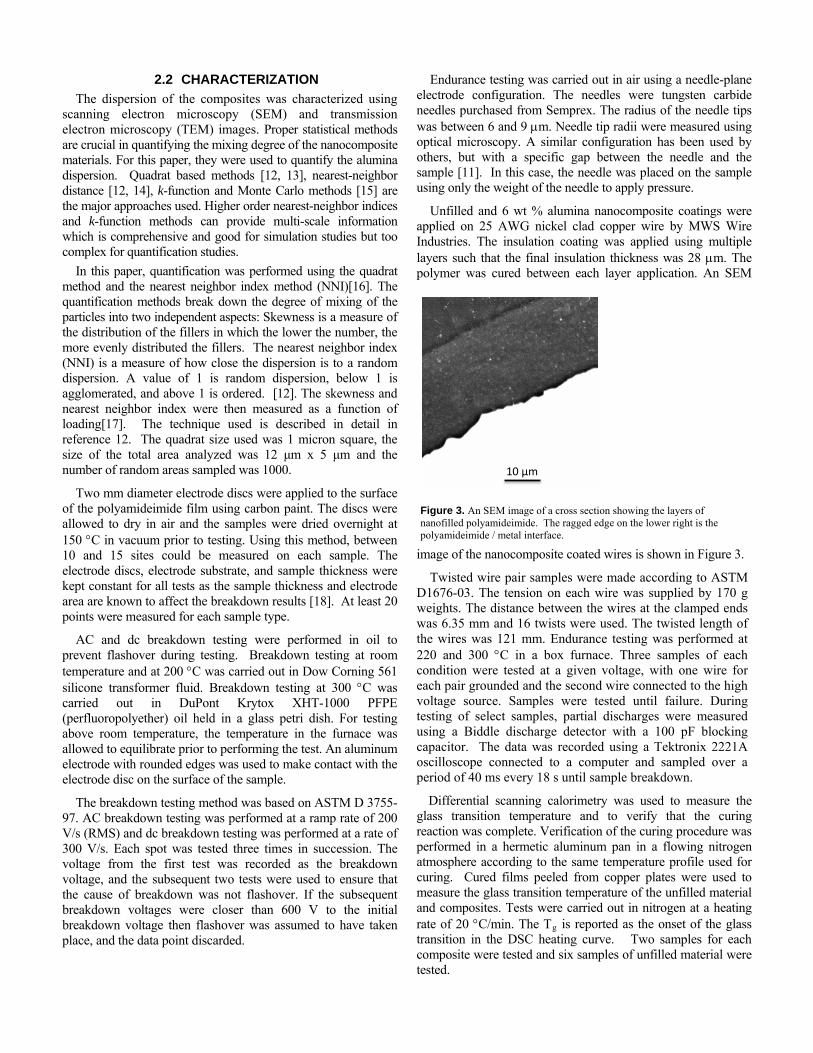
Unfilled and 6 wt % alumina nanocomposite coatings were applied on 25 AWG nickel clad copper wire by MWS Wire Industries. The insulation coating was applied using multiple layers such that the final insulation thickness was 28 m. The polymer was cured between each layer application. An SEM
image of the nanocomposite coated wires is shown in Figure 3.
10�μm�
Figure 3. An SEM image of a cross section showing the layers of nanofilled polyamideimide. The ragged edge on the lower right is the polyamideimide / metal interface.
Twisted wire pair samples were made according to ASTM D1676-03. The tension on each wire was supplied by 170 g weights. The distance between the wires at the clamped ends was 6.35 mm and 16 twists were used. The twisted length of the wires was 121 mm. Endurance testing was performed at 220 and 300 C in a box furnace. Three samples of each condition were tested at a given voltage, with one wire for each pair grounded and the second wire connected to the high voltage source. Samples were tested until failure. During testing of select samples, partial discharges were measured using a Biddle discharge detector with a 100 pF blocking capacitor. The data was recorded using a Tektronix 2221A oscilloscope connected to a computer and sampled over a period of 40 ms every 18 s until sample breakdown.
Differential scanning calorimetry was used to measure the glass transition temperature and to verify that the curing reaction was complete. Verification of the curing procedure was performed in a hermetic aluminum pan in a flowing nitrogen atmosphere according to the same temperature profile used for curing. Cured films peeled from copper plates were used to measure the glass transition temperature of the unfilled material and composites. Tests were carried out in nitrogen at a heating rate of 20 C/min. The Tg is reported as the onset of the glass transition in the DSC heating curve. Two samples for each composite were tested and six samples of unfilled material were tested.
Thermogravimetric analysis (TGA) was used to verify the loading of the nanocomposites. After curing, samples were heated in air at a ramp rate of 20 C/min to 1000 C. The change in mass was used to determine the composite loading. The TGA data was also used to determine the resistance to thermal degradation in air. The decomposition temperature was defined as the temperature at which 10 wt% of polymer matrix decomposed. Three samples of each material were tested.
3 RESULTS AND DISCUSSION
3.1 SAMPLE CHARACTERIZATION
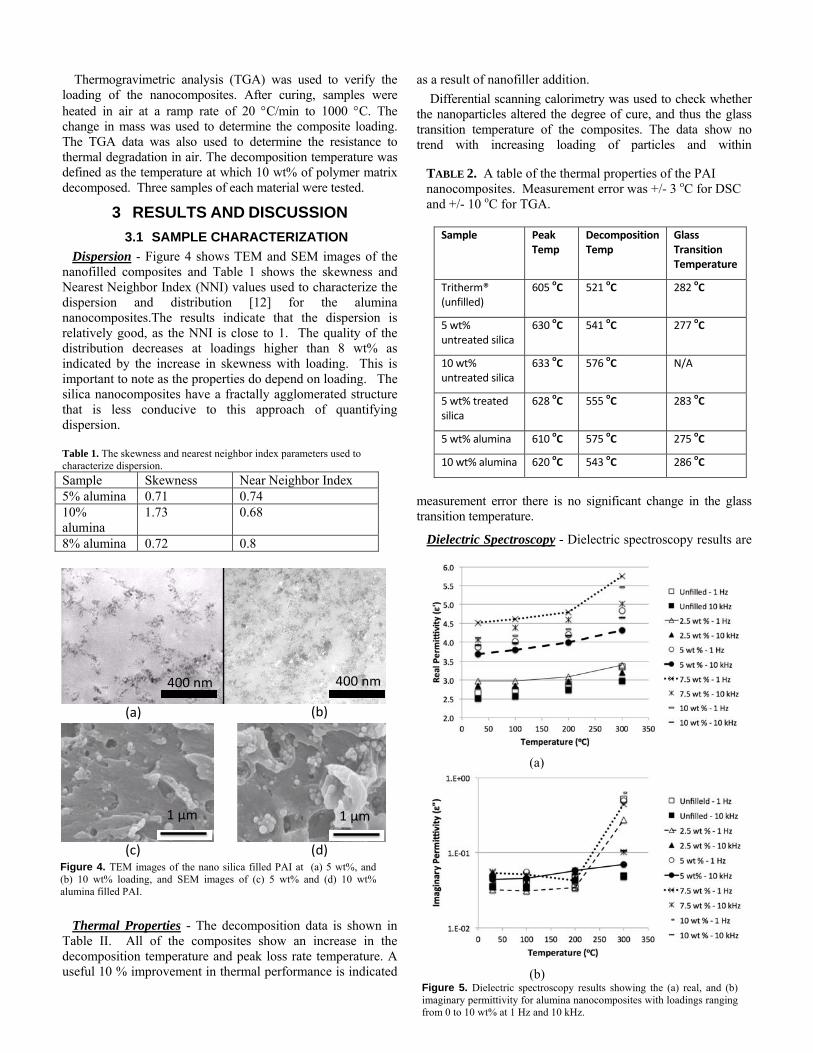
Dispersion - Figure 4 shows TEM and SEM images of the nanofilled composites and Table 1 shows the skewness and Nearest Neighbor Index (NNI) values used to characterize the dispersion and distribution [12] for the alumina nanocomposites.The results indicate that the dispersion is relatively good, as the NNI is close to 1. The quality of the distribution decreases at loadings higher than 8 wt% as indicated by the increase in skewness with loading. This is important to note as the properties do depend on loading. The silica nanocomposites have a fractally agglomerated structure that is less conducive to this approach of quantifying dispersion. Table 1. The skewness and nearest neighbor index parameters used to characterize dispersion.
Sample Skewness Near Neighbor Index 5% alumina 0.71 0.74 10% alumina
1.73 0.68
8% alumina 0.72 0.8
Thermal Properties - The decomposition data is shown in Table II. All of the composites show an increase in the decomposition temperature and peak loss rate temperature. A useful 10 % improvement in thermal performance is indicated
as a result of nanofiller addition.
Differential scanning calorimetry was used to check whether the nanoparticles altered the degree of cure, and thus the glass transition temperature of the composites. The data show no trend with increasing loading of particles and within
measurement error there is no significant change in the glass transition temperature.
TABLE 2. A table of the thermal properties of the PAI nanocomposites. Measurement error was +/- 3 oC for DSC and +/- 10 oC for TGA.
Sample Peak Temp
Decomposition Temp
Glass Transition Temperature
605 oC 521 oC 282 oC
Dielectric Spectroscopy - Dielectric spectroscopy results are
Tritherm® (unfilled)
630 oC 541 oC 277 oC 5 wt% untreated silica
633 oC 576 oC N/A 10 wt% untreated silica
628 oC 555 oC 283 oC 5 wt% treated silica
610 oC 575 oC 275 oC 5 wt% alumina
620 oC 543 oC 286 oC 10 wt% alumina
400�nm�400�nm�
1�μm�
(a)� (b)�
(c)� (d)�
1�μm�
(a)
(b) Figure 5. Dielectric spectroscopy results showing the (a) real, and (b) imaginary permittivity for alumina nanocomposites with loadings ranging from 0 to 10 wt% at 1 Hz and 10 kHz.
Figure 4. TEM images of the nano silica filled PAI at (a) 5 wt%, and (b) 10 wt% loading, and SEM images of (c) 5 wt% and (d) 10 wt% alumina filled PAI.
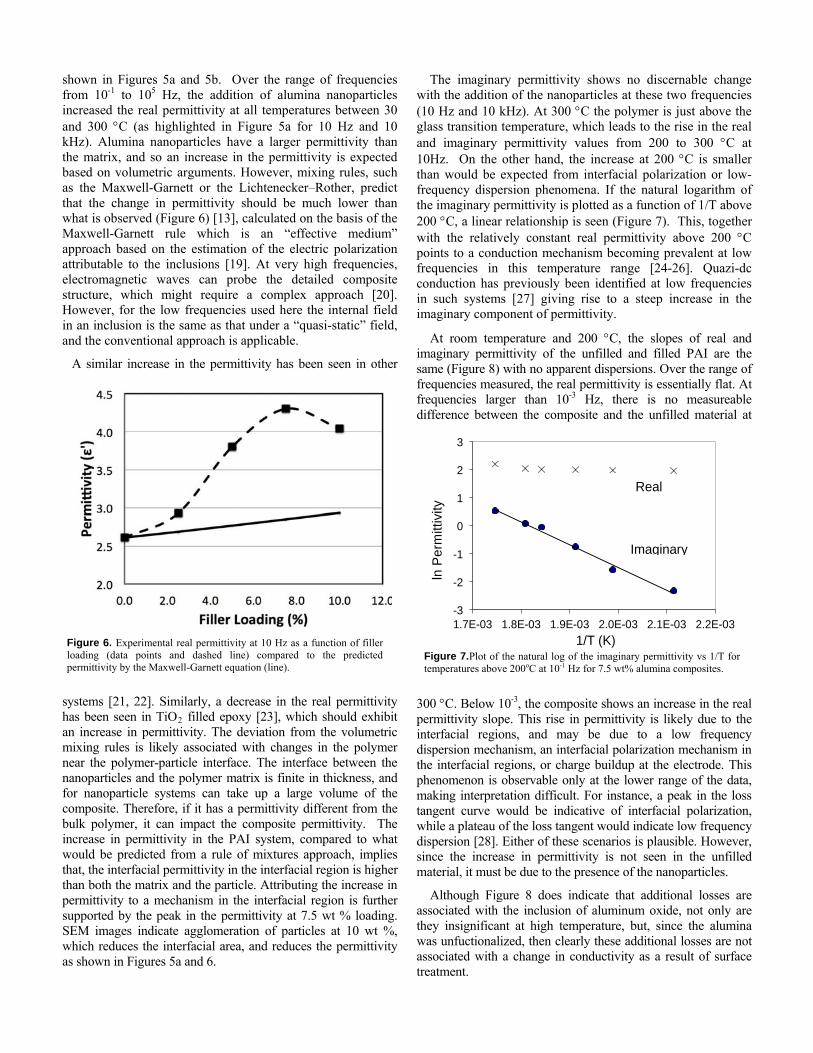
shown in Figures 5a and 5b. Over the range of frequencies from 10-1 to 105 Hz, the addition of alumina nanoparticles increased the real permittivity at all temperatures between 30 and 300 C (as highlighted in Figure 5a for 10 Hz and 10 kHz). Alumina nanoparticles have a larger permittivity than the matrix, and so an increase in the permittivity is expected based on volumetric arguments. However, mixing rules, such as the Maxwell-Garnett or the Lichtenecker–Rother, predict that the change in permittivity should be much lower than what is observed (Figure 6) [13], calculated on the basis of the Maxwell-Garnett rule which is an “effective medium” approach based on the estimation of the electric polarization attributable to the inclusions [19]. At very high frequencies, electromagnetic waves can probe the detailed composite structure, which might require a complex approach [20]. However, for the low frequencies used here the internal field in an inclusion is the same as that under a “quasi-static” field, and the conventional approach is applicable.
A similar increase in the permittivity has been seen in other
systems [21, 22]. Similarly, a decrease in the real permittivity has been seen in TiO2 filled epoxy [23], which should exhibit an increase in permittivity. The deviation from the volumetric mixing rules is likely associated with changes in the polymer near the polymer-particle interface. The interface between the nanoparticles and the polymer matrix is finite in thickness, and for nanoparticle systems can take up a large volume of the composite. Therefore, if it has a permittivity different from the bulk polymer, it can impact the composite permittivity. The increase in permittivity in the PAI system, compared to what would be predicted from a rule of mixtures approach, implies that, the interfacial permittivity in the interfacial region is higher than both the matrix and the particle. Attributing the increase in permittivity to a mechanism in the interfacial region is further supported by the peak in the permittivity at 7.5 wt % loading. SEM images indicate agglomeration of particles at 10 wt %, which reduces the interfacial area, and reduces the permittivity as shown in Figures 5a and 6.
The imaginary permittivity shows no discernable change with the addition of the nanoparticles at these two frequencies (10 Hz and 10 kHz). At 300 C the polymer is just above the glass transition temperature, which leads to the rise in the real and imaginary permittivity values from 200 to 300 C at 10Hz. On the other hand, the increase at 200 C is smaller than would be expected from interfacial polarization or low-frequency dispersion phenomena. If the natural logarithm of the imaginary permittivity is plotted as a function of 1/T above 200 C, a linear relationship is seen (Figure 7). This, together with the relatively constant real permittivity above 200 C points to a conduction mechanism becoming prevalent at low frequencies in this temperature range [24-26]. Quazi-dc conduction has previously been identified at low frequencies in such systems [27] giving rise to a steep increase in the imaginary component of permittivity.
At room temperature and 200 C, the slopes of real and imaginary permittivity of the unfilled and filled PAI are the same (Figure 8) with no apparent dispersions. Over the range of frequencies measured, the real permittivity is essentially flat. At frequencies larger than 10-3 Hz, there is no measureable difference between the composite and the unfilled material at
300 C. Below 10-3, the composite shows an increase in the real permittivity slope. This rise in permittivity is likely due to the interfacial regions, and may be due to a low frequency dispersion mechanism, an interfacial polarization mechanism in the interfacial regions, or charge buildup at the electrode. This phenomenon is observable only at the lower range of the data, making interpretation difficult. For instance, a peak in the loss tangent curve would be indicative of interfacial polarization, while a plateau of the loss tangent would indicate low frequency dispersion [28]. Either of these scenarios is plausible. However, since the increase in permittivity is not seen in the unfilled material, it must be due to the presence of the nanoparticles.
-3
-2
-1
0
1
2
3
1.7E-03 1.8E-03 1.9E-03 2.0E-03 2.1E-03 2.2E-03
ln P
erm
ittiv
ity
1/T (K)
Real
Imaginary
Figure 6. Experimental real permittivity at 10 Hz as a function of filler loading (data points and dashed line) compared to the predicted permittivity by the Maxwell-Garnett equation (line).
Figure 7.Plot of the natural log of the imaginary permittivity vs 1/T for temperatures above 200oC at 10-1 Hz for 7.5 wt% alumina composites.
Although Figure 8 does indicate that additional losses are associated with the inclusion of aluminum oxide, not only are they insignificant at high temperature, but, since the alumina was unfuctionalized, then clearly these additional losses are not associated with a change in conductivity as a result of surface treatment.
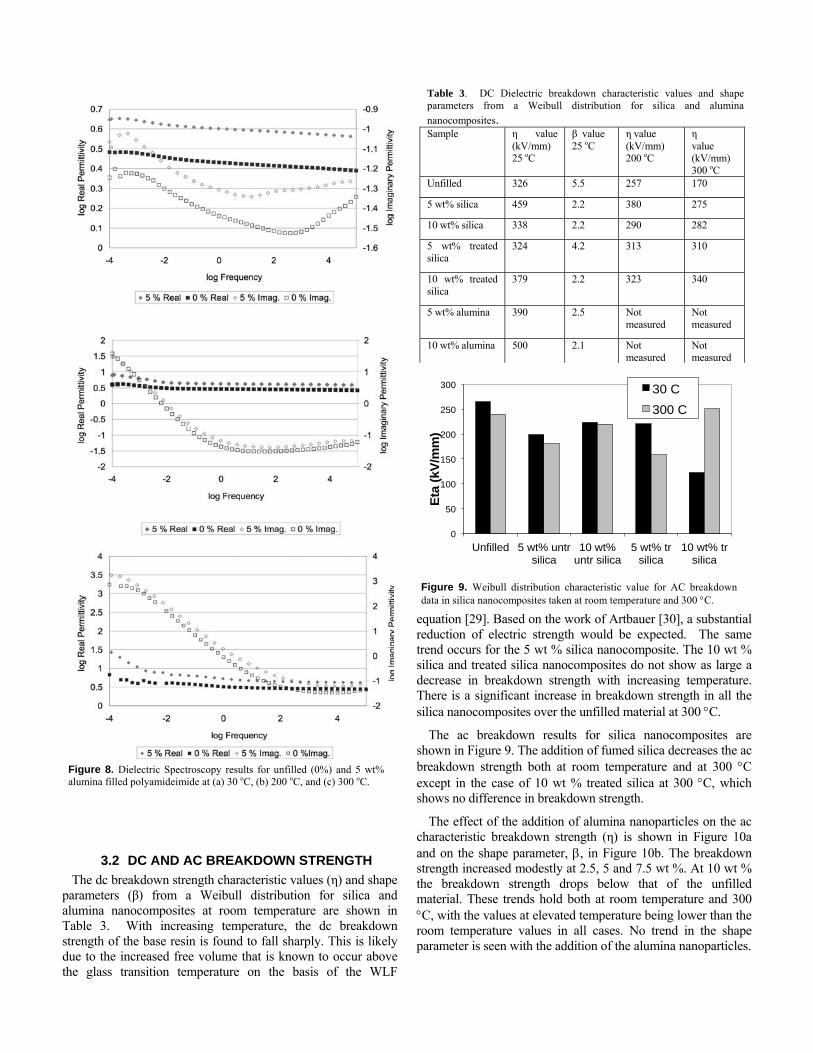
Table 3. DC Dielectric breakdown characteristic values and shape parameters from a Weibull distribution for silica and alumina
nanocomposites. Sample η value
(kV/mm) 25 oC
β value 25 oC
η value (kV/mm) 200 oC
η value (kV/mm) 300 oC
3.2 DC AND AC BREAKDOWN STRENGTH
The dc breakdown strength characteristic values (η) and shape parameters (β) from a Weibull distribution for silica and alumina nanocomposites at room temperature are shown in Table 3. With increasing temperature, the dc breakdown strength of the base resin is found to fall sharply. This is likely due to the increased free volume that is known to occur above the glass transition temperature on the basis of the WLF
equation [29]. Based on the work of Artbauer [30], a substantial reduction of electric strength would be expected. The same trend occurs for the 5 wt % silica nanocomposite. The 10 wt % silica and treated silica nanocomposites do not show as large a decrease in breakdown strength with increasing temperature. There is a significant increase in breakdown strength in all the silica nanocomposites over the unfilled material at 300 C.
The ac breakdown results for silica nanocomposites are shown in Figure 9. The addition of fumed silica decreases the ac breakdown strength both at room temperature and at 300 C except in the case of 10 wt % treated silica at 300 C, which shows no difference in breakdown strength.
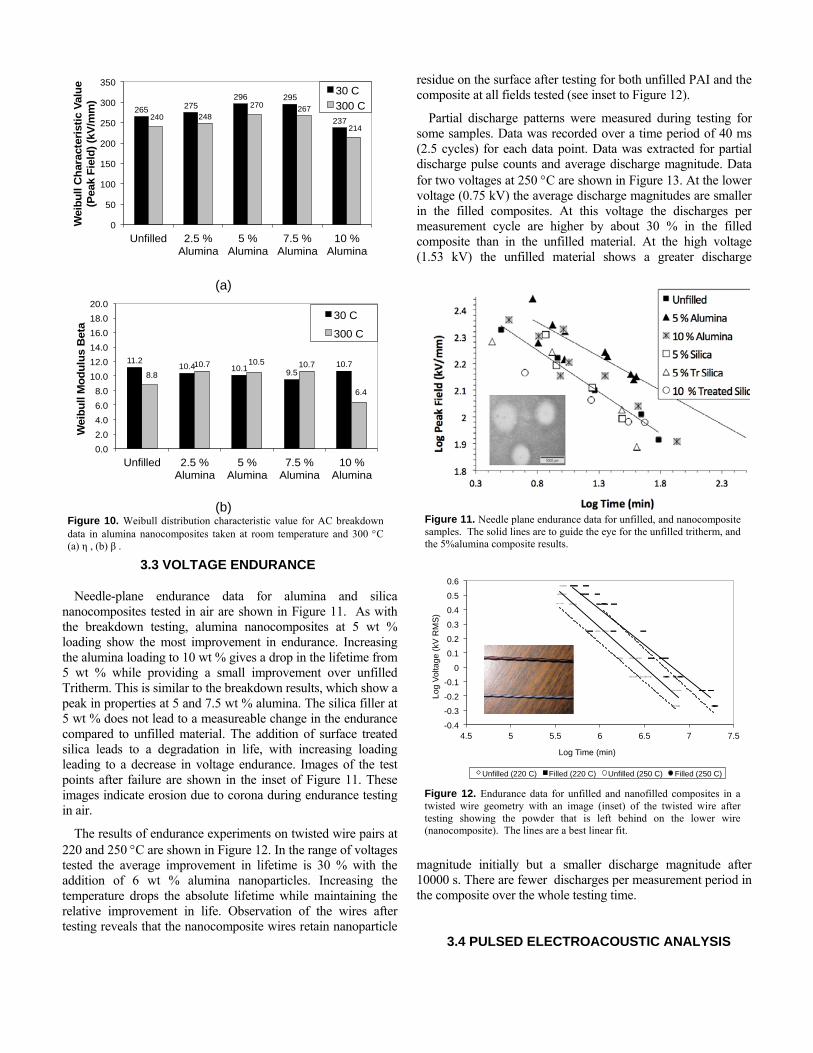
The effect of the addition of alumina nanoparticles on the ac characteristic breakdown strength (η) is shown in Figure 10a and on the shape parameter, , in Figure 10b. The breakdown strength increased modestly at 2.5, 5 and 7.5 wt %. At 10 wt % the breakdown strength drops below that of the unfilled material. These trends hold both at room temperature and 300 C, with the values at elevated temperature being lower than the room temperature values in all cases. No trend in the shape parameter is seen with the addition of the alumina nanoparticles.
Unfilled 326 5.5 257 170
5 wt% silica 459 2.2 380 275
10 wt% silica 338 2.2 290 282
5 wt% treated silica
324 4.2 313 310
10 wt% treated silica
379 2.2 323 340
5 wt% alumina 390 2.5 Not measured
Not measured
Figure 8. Dielectric Spectroscopy results for unfilled (0%) and 5 wt% alumina filled polyamideimide at (a) 30 oC, (b) 200 oC, and (c) 300 oC.
10 wt% alumina 500 2.1 Not measured
Not measured
0
50
100
150
200
250
300
Unfilled 5 wt% untr silica
10 wt% untr silica
5 wt% tr silica
10 wt% tr silica
Eta
(kV
/mm
)
30 C
300 C
Figure 9. Weibull distribution characteristic value for AC breakdown data in silica nanocomposites taken at room temperature and 300 C.
3.3 VOLTAGE ENDURANCE
Needle-plane endurance data for alumina and silica nanocomposites tested in air are shown in Figure 11. As with the breakdown testing, alumina nanocomposites at 5 wt % loading show the most improvement in endurance. Increasing the alumina loading to 10 wt % gives a drop in the lifetime from 5 wt % while providing a small improvement over unfilled Tritherm. This is similar to the breakdown results, which show a peak in properties at 5 and 7.5 wt % alumina. The silica filler at 5 wt % does not lead to a measureable change in the endurance compared to unfilled material. The addition of surface treated silica leads to a degradation in life, with increasing loading leading to a decrease in voltage endurance. Images of the test points after failure are shown in the inset of Figure 11. These images indicate erosion due to corona during endurance testing in air.
The results of endurance experiments on twisted wire pairs at 220 and 250 C are shown in Figure 12. In the range of voltages tested the average improvement in lifetime is 30 % with the addition of 6 wt % alumina nanoparticles. Increasing the temperature drops the absolute lifetime while maintaining the relative improvement in life. Observation of the wires after testing reveals that the nanocomposite wires retain nanoparticle
residue on the surface after testing for both unfilled PAI and the composite at all fields tested (see inset to Figure 12).
265 275 296 295
237 240 248
270 267
214
0
50
100
150
200
250
300
350
Unfilled 2.5 % Alumina
5 % Alumina
7.5 % Alumina
10 % Alumina
Wei
bu
ll C
har
act
eris
tic
Valu
e (P
eak
Fie
ld)
(kV
/mm
) 30 C
300 C
Partial discharge patterns were measured during testing for some samples. Data was recorded over a time period of 40 ms (2.5 cycles) for each data point. Data was extracted for partial discharge pulse counts and average discharge magnitude. Data for two voltages at 250 C are shown in Figure 13. At the lower voltage (0.75 kV) the average discharge magnitudes are smaller in the filled composites. At this voltage the discharges per measurement cycle are higher by about 30 % in the filled composite than in the unfilled material. At the high voltage (1.53 kV) the unfilled material shows a greater discharge
magnitude initially but a smaller discharge magnitude after 10000 s. There are fewer discharges per measurement period in the composite over the whole testing time.
(a)
11.2 10.4 10.1 9.5
10.7 8.8
10.7 10.5 10.7
6.4
0.0
2.0
4.0
6.0
8.0
10.0
12.0
14.0
16.0
18.0
20.0
Unfilled 2.5 % Alumina
5 % Alumina
7.5 % Alumina
10 % Alumina
Weib
ull
Mo
du
lus
Bet
a
30 C
300 C
(b) Figure 10. Weibull distribution characteristic value for AC breakdown data in alumina nanocomposites taken at room temperature and 300 C (a) η , (b) β .
Figure 11. Needle plane endurance data for unfilled, and nanocomposite samples. The solid lines are to guide the eye for the unfilled tritherm, and the 5%alumina composite results.
-0.4
-0.3
-0.2
-0.1
0
0.1
0.2
0.3
0.4
0.5
0.6
4.5 5 5.5 6 6.5 7 7.
Log
Vol
tag
e (
kV R
MS
)
Log Time (min)
5
Unfilled (220 C) Filled (220 C) Unfilled (250 C) Filled (250 C)
Figure 12. Endurance data for unfilled and nanofilled composites in a twisted wire geometry with an image (inset) of the twisted wire after testing showing the powder that is left behind on the lower wire (nanocomposite). The lines are a best linear fit.
3.4 PULSED ELECTROACOUSTIC ANALYSIS
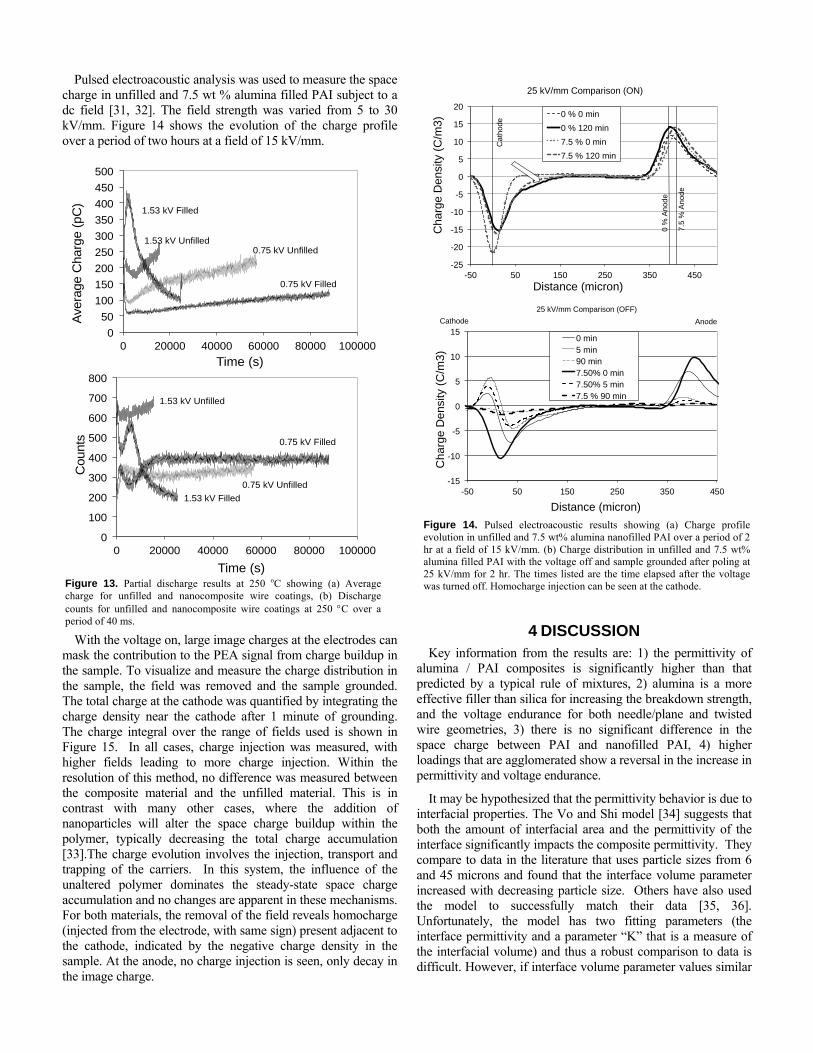
Pulsed electroacoustic analysis was used to measure the space charge in unfilled and 7.5 wt % alumina filled PAI subject to a dc field [31, 32]. The field strength was varied from 5 to 30 kV/mm. Figure 14 shows the evolution of the charge profile over a period of two hours at a field of 15 kV/mm.
-25
-20
-15
-10
-5
0
5
10
15
20
-50 50 150 250 350 450
Cha
rge
Den
sity
(C
/m3)
Distance (micron)
25 kV/mm Comparison (ON)
0 % 0 min
0 % 120 min
7.5 % 0 min
7.5 % 120 min
7.5
% A
nod
e
0 %
An
ode
Ca
thod
e
-15
-10
-5
0
5
10
15
-50 50 150 250 350 450
Cha
rge
Den
sity
(C
/m3)
Distance (micron)
25 kV/mm Comparison (OFF)
0 min 5 min 90 min 7.50% 0 min 7.50% 5 min 7.5 % 90 min
Cathode Anode
Figure 14. Pulsed electroacoustic results showing (a) Charge profile evolution in unfilled and 7.5 wt% alumina nanofilled PAI over a period of 2 hr at a field of 15 kV/mm. (b) Charge distribution in unfilled and 7.5 wt% alumina filled PAI with the voltage off and sample grounded after poling at 25 kV/mm for 2 hr. The times listed are the time elapsed after the voltage was turned off. Homocharge injection can be seen at the cathode.
0
50
100
150
200
250
300
350
400
450
500
0 20000 40000 60000 80000 100000
Ave
rage
Cha
rge
(pC
)
Time (s)
0.75 kV Unfilled
0.75 kV Filled
1.53 kV Unfilled
1.53 kV Filled
0
100
200
300
400
500
600
700
800
0 20000 40000 60000 80000 100000
Cou
nts
Time (s)
0.75 kV Unfilled
0.75 kV Filled
1.53 kV Unfilled
1.53 kV Filled
Figure 13. Partial discharge results at 250 oC showing (a) Average charge for unfilled and nanocomposite wire coatings, (b) Discharge counts for unfilled and nanocomposite wire coatings at 250 C over a period of 40 ms.
With the voltage on, large image charges at the electrodes can mask the contribution to the PEA signal from charge buildup in the sample. To visualize and measure the charge distribution in the sample, the field was removed and the sample grounded. The total charge at the cathode was quantified by integrating the charge density near the cathode after 1 minute of grounding. The charge integral over the range of fields used is shown in Figure 15. In all cases, charge injection was measured, with higher fields leading to more charge injection. Within the resolution of this method, no difference was measured between the composite material and the unfilled material. This is in contrast with many other cases, where the addition of nanoparticles will alter the space charge buildup within the polymer, typically decreasing the total charge accumulation [33].The charge evolution involves the injection, transport and trapping of the carriers. In this system, the influence of the unaltered polymer dominates the steady-state space charge accumulation and no changes are apparent in these mechanisms. For both materials, the removal of the field reveals homocharge (injected from the electrode, with same sign) present adjacent to the cathode, indicated by the negative charge density in the sample. At the anode, no charge injection is seen, only decay in the image charge.
4 DISCUSSION Key information from the results are: 1) the permittivity of
alumina / PAI composites is significantly higher than that predicted by a typical rule of mixtures, 2) alumina is a more effective filler than silica for increasing the breakdown strength, and the voltage endurance for both needle/plane and twisted wire geometries, 3) there is no significant difference in the space charge between PAI and nanofilled PAI, 4) higher loadings that are agglomerated show a reversal in the increase in permittivity and voltage endurance.
It may be hypothesized that the permittivity behavior is due to interfacial properties. The Vo and Shi model [34] suggests that both the amount of interfacial area and the permittivity of the interface significantly impacts the composite permittivity. They compare to data in the literature that uses particle sizes from 6 and 45 microns and found that the interface volume parameter increased with decreasing particle size. Others have also used the model to successfully match their data [35, 36]. Unfortunately, the model has two fitting parameters (the interface permittivity and a parameter “K” that is a measure of the interfacial volume) and thus a robust comparison to data is difficult. However, if interface volume parameter values similar
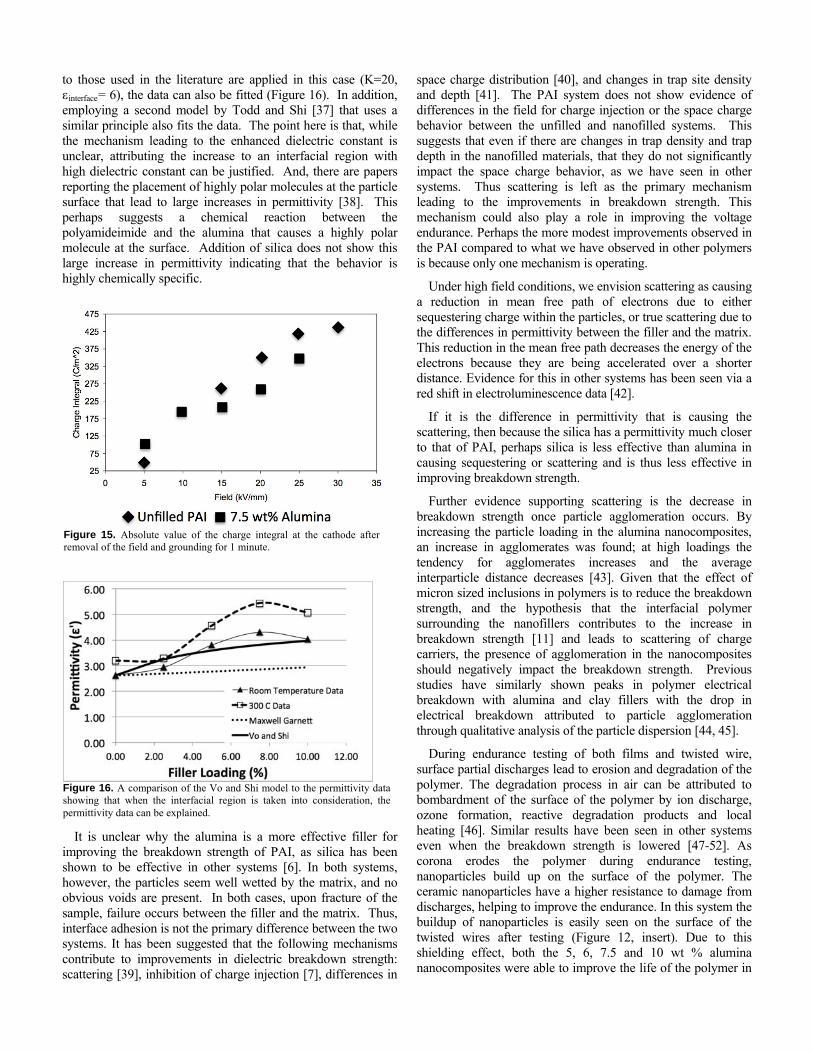
to those used in the literature are applied in this case (K=20, εinterface= 6), the data can also be fitted (Figure 16). In addition, employing a second model by Todd and Shi [37] that uses a similar principle also fits the data. The point here is that, while the mechanism leading to the enhanced dielectric constant is unclear, attributing the increase to an interfacial region with high dielectric constant can be justified. And, there are papers reporting the placement of highly polar molecules at the particle surface that lead to large increases in permittivity [38]. This perhaps suggests a chemical reaction between the polyamideimide and the alumina that causes a highly polar molecule at the surface. Addition of silica does not show this large increase in permittivity indicating that the behavior is highly chemically specific.
Figure 16. A comparison of the Vo and Shi model to the permittivity data showing that when the interfacial region is taken into consideration, the permittivity data can be explained.
It is unclear why the alumina is a more effective filler for improving the breakdown strength of PAI, as silica has been shown to be effective in other systems [6]. In both systems, however, the particles seem well wetted by the matrix, and no obvious voids are present. In both cases, upon fracture of the sample, failure occurs between the filler and the matrix. Thus, interface adhesion is not the primary difference between the two systems. It has been suggested that the following mechanisms contribute to improvements in dielectric breakdown strength: scattering [39], inhibition of charge injection [7], differences in
space charge distribution [40], and changes in trap site density and depth [41]. The PAI system does not show evidence of differences in the field for charge injection or the space charge behavior between the unfilled and nanofilled systems. This suggests that even if there are changes in trap density and trap depth in the nanofilled materials, that they do not significantly impact the space charge behavior, as we have seen in other systems. Thus scattering is left as the primary mechanism leading to the improvements in breakdown strength. This mechanism could also play a role in improving the voltage endurance. Perhaps the more modest improvements observed in the PAI compared to what we have observed in other polymers is because only one mechanism is operating.
Under high field conditions, we envision scattering as causing a reduction in mean free path of electrons due to either sequestering charge within the particles, or true scattering due to the differences in permittivity between the filler and the matrix. This reduction in the mean free path decreases the energy of the electrons because they are being accelerated over a shorter distance. Evidence for this in other systems has been seen via a red shift in electroluminescence data [42].
If it is the difference in permittivity that is causing the scattering, then because the silica has a permittivity much closer to that of PAI, perhaps silica is less effective than alumina in causing sequestering or scattering and is thus less effective in improving breakdown strength.
Further evidence supporting scattering is the decrease in breakdown strength once particle agglomeration occurs. By increasing the particle loading in the alumina nanocomposites, an increase in agglomerates was found; at high loadings the tendency for agglomerates increases and the average interparticle distance decreases [43]. Given that the effect of micron sized inclusions in polymers is to reduce the breakdown strength, and the hypothesis that the interfacial polymer surrounding the nanofillers contributes to the increase in breakdown strength [11] and leads to scattering of charge carriers, the presence of agglomeration in the nanocomposites should negatively impact the breakdown strength. Previous studies have similarly shown peaks in polymer electrical breakdown with alumina and clay fillers with the drop in electrical breakdown attributed to particle agglomeration through qualitative analysis of the particle dispersion [44, 45].
Figure 15. Absolute value of the charge integral at the cathode after removal of the field and grounding for 1 minute.
During endurance testing of both films and twisted wire, surface partial discharges lead to erosion and degradation of the polymer. The degradation process in air can be attributed to bombardment of the surface of the polymer by ion discharge, ozone formation, reactive degradation products and local heating [46]. Similar results have been seen in other systems even when the breakdown strength is lowered [47-52]. As corona erodes the polymer during endurance testing, nanoparticles build up on the surface of the polymer. The ceramic nanoparticles have a higher resistance to damage from discharges, helping to improve the endurance. In this system the buildup of nanoparticles is easily seen on the surface of the twisted wires after testing (Figure 12, insert). Due to this shielding effect, both the 5, 6, 7.5 and 10 wt % alumina nanocomposites were able to improve the life of the polymer in
the needle tests, even though the 10 wt % nanocomposite shows a drop in breakdown strength.
Measurement of the partial discharge activity during the twisted wire tests shows that, at higher voltages (1.53 kV), the number of discharges is lower in the composite, but the discharge magnitudes are greater in the composite than in the unfilled polymer early in the test, and drop below the unfilled material after approximately 1000 s. This suggests that in addition to improving the resistance to discharge, over time the build up of a ceramic layer, reduces the magnitude of the discharge. This could be due to the insulating properties of the alumina layer. In addition, nanocomposites subject to plasma or partial discharges have been shown to have a reduced roughness compared to unfilled materials [53].
At lower voltages (here 0.75 kV), the discharge magnitude is smaller in the nanocomposites than in the unfilled material throughout, but the number of counts are similar. This suggests that a somewhat different mechanism is operating. The increase in magnitude in the unfilled materials over time is again likely due to roughening, and the similar number of counts suggests that, at this field, the filler is not as effective at shielding the composite from discharge. It is notable, however, that the number of discharges is increasing in the unfilled material, while it is stable in the composite. And, again, it is likely that the build up of a ceramic layer is reducing the damage induced by each discharge.
In contrast to the alumina nanoparticles, the silica nanoparticles did not effectively shield the composite from surface discharges. In addition to the difference in composition, the silica and alumina nanocomposites show a much different morphology. Though individual silica nanoparticles are spherical, the fumed silica forms fractal agglomerates, which may allow for an increased pathway for discharges to move
through unfilled resin in the silica composites. Compared to the silica nanoparticles, the alumina nanoparticles are more individually dispersed, leading to unfilled regions between particles. This increase in distance between particle occurs because the particle size of the alumina is 50 – 200nm, and thus at similar loadings, the particles are farther apart. This importance of particle size and dispersion is supported by other work on silica nanoparticles in the range of 120-500 nm (compared to the 12 nm silica particles in this study). It shows that filled polyimides exhibit an improvement in partial discharge resistance compared to the unfilled polymer [44, 45].
5 SUMMARY In summary, this study found that the addition of nanoscale
alumina nanoparticles to PAI resulted in an improvement in breakdown strength and endurance strength in loadings ranging from 5–7.5 wt%, together with a modest improvement in thermal performance. The mechanism leading to the improvement in properties is likely the result of electron scattering and corona resistance of the ceramic alumina nanoparticles. In addition, the permittivity of the alumina / PAI composites was higher than that predicted by models that do not include an interfacial region. The data is reproduced in the models when the presence of an interfacial region with a permittivity between that of the polymer and the nanofiller is used.
ACKNOWLEDGMENT This work is supported through UES, Inc., under contract to
the Air Force Research Laboratory, Propulsion Directorate, by contract number FA8650-04-D-2404/DO-04.
REFERENCES [1] S. Li, G. Yin, G. Chen, J. Li, S. Bai, L. Zhong, Y. Zhang, and Q. Lei,
"Short-term breakdown and long-term failure in nanodielectrics: A review", IEEE Trans. Dielectr. Electr. Insul.,Vol. 17, pp. 1523-1535, 2010.
[2] R. C. Smith, C. Liang, M. Landry, J. K. Nelson, and L. S. Schadler, "The mechanisms leading to the useful electrical properties of polymer nanodielectrics",IEEE Trans. Dielectr. Electr. Insul.,Vol. 15, pp. 187-196, 2008.
[3] T. Okazaki, S. Okuzumi, S. Imazawa, Y. Murakami, M. Nagao, Y. Sekiguchi, C. C. Reddy, and Y. Murata, "Electric characteristics of MgO/LDPE nanocomposite up to breakdown under DC ramp voltage" ,IEEE Conf. Electr. Insul. Dielectr. Phenomena (CEIDP),Piscataway, NJ, USA, pp. 654-7, 2009.
[4] S. S. Brandstetter, L. F. Drummy, J. C. Horwath, D. L. Schweickart, and R. A. Vaia, "Breakdown voltage of thermoplastics with clay nanometer-sized fillers",IEEE Int'l. Power Modulators and High Voltage Conf.(PMHVC),Las Vegas, NV, USA, pp. 287-290, 2008.
[5] R. C. Smith, J. K. Nelson, and L. S. Schadler, “Electrical behavior of particle filled polymer nanocomposites”,in Physical Properties of Polymer Nanocomposites,, S. C. Tjong and Y.-W. Mai, Eds., ed Cambridge, UK: Woodhead Publishing, 2010.
[6] M. Roy, J. K. Nelson, R. K. MacCrone, and L. S. Schadler, "Candidate Mechanisms Controlling the Electrical Characteristics of Silica/XLPE Nanodielectrics", J. Materials Science,Vol. 42, pp. 3789-3799, in press, 2007.
[7] J. Yoshida, T. Maezawa, H. Miyake, Y. Tanaka, T. Takada, Y. Sekiguchi, Y. Murata, and C. C. Reddy, "Space charge accumulation
and breakdown in LDPE and LDPE/MgO nano-composite under high dc stress at various temperatures," IEEE Conf. Electr. Insul. Dielectr. Phenomena (CEIDP),Piscataway, NJ, USA, pp. 150-3, 2009.
[8] N. Bestaoui-Spurr, C. A. Edmondson, M. C. Wintersgill, J. J. Fontanella, and T. Adams, "Effect of nanoparticles on the dielectric properties of polyimide", Smart Materials and Structures,Vol. 20, 2011.
[9] M. Winkeler and R. W. Goetter, "Impact of the use of nanomaterials in liquid electrical insulation for inverter duty applications",IEEE Int'l. Sympos. Electr. Insul.(ISEI), article number 5549782, San Diego, CA, USA, 2010.
[10] S. Diaham, M. L. Locatelli, T. Lebey, and S. Dinculescu, "Dielectric and thermal properties of polyamide-imide (PAI) films",IEEE Conf. Electr. Insul. Dielectr. Phenomena (CEIDP), Virginia Beach, VA, USA, pp. 482-485, 2009.
[11] I. Kitani, K. K., and K. A., "DC voltage breakdown in silicone oil/polymer-film composite",IEEE 3rd Int'l. Conf. Properties and Applications of Dielectric Materials, pp. 1181-1184, 1991.
[12] N. A. C. Cressie, Statistics for Spatial Data: John Wiley, 1991. [13] D. Kim, J. S.Lee, C. M. F. Barry, and J. Mead, "Microscopic
measurement of the degree of mixing for nanoparticles in polymer nanocomposites by TEM Images", Microsc. Res. Techniq.,Vol. 70, pp. 539-546, 2007.
[14] J. Leggoe, "Nth-nearest neighbor statistics for analysis of particle distribution data derived from micrographs", Scripta Materialia,Vol. 53, pp. 1263-1268, 2005.
[15] D. L. Burris, B. Boesl, G. R. Bourne, and W. G. Sawyer, "Polymeric nanocomposites for tribological applications", Macromolecular Materials and Eng.,Vol. 292, pp. 387-402, 2007.
[16] J. W. Leggoe, J.B. Riggs, "Nth-nearest neighbor statistics for three dimensional equilibrium arrays of monodisperse spheres", Materials Science and Engineering A, Vol. 426, pp. 289-297, 2006
[17] L. Hui, R. C. Smith, X. Wang, J. K. Nelson, and L. S. Schadler, "Quantification of particulate mixing in nanocomposites",IEEE Conf. Electr. Insul. Dielectr, Phenomena (CEIDP), Quebec City, QC, Canada, pp. 317-320, 2008.
[18] S. U. Haq and G. G. Raju, "DC breakdown characteristics of high temperature polymer films",Trans. Dielectr. Electr. Insul, Vol. 13, pp. 917-926, 2006.
[19] J. C. Maxwell Garnett, "Colours in metal glasses and metal films", Proc. Roy. Soc.,Vol. CCIII, pp. 385-420, 1904.
[20] A. Sihvola, "Mixing rules with complex dielectric Coefficients", Subsurface Sensing Technologies and Applications,Vol. 1, pp. 393-415, 2000.
[21] P. Murugaraj, D. Mainwaring, and N. Mora-Huertas, "Dielectric enhancement in polymer-nanoparticle composites through interphase polarizability", J. Appl. Phys.,Vol. 98, p. 054304, 2005.
[22] S. Xie, B. Zhu, X. Wei, Z. Xu, and Y. Xu, "olyimide/BaTiO3 composites with controllable dielectric properties", Compos. Part A-Appl. S.,Sol. 36, pp. 1152-1157, 2003.
[23] J. C. Fothergill, J. K. Nelson, and M. Fu, "Dielectric properties of epoxy nanocomposites containing TiO2, Al2O3 and ZnO fillers",IEEE Conf. Electr. Insul. Dielectr, Phenomena (CEIDP), Boulder, CO, USA, pp. 406-409, 2004.
[24] S. Muruganand, S. K. Narayandass, D. Mangalaraj, and T. M. Vijayan, "Dielectric and conduction properties of pure polyimide films", Polym. Int'l.,Vol. 50, pp. 1089-1094, 2001.
[25] A. K. Jonscher, "Dielectric relaxation in solids.", J. Phys. D Appl. Phys.,Vol. 32, pp. R57-R70, 1999.
[26] A. K. Jonscher, Dielectric Relaxation in Solids, Chelsea Dielectrics Press, 1983.
[27] J. C. Fothergill, K. B. A. See, M. N. Ajour, and L. A. Dissado, "Sub-Hertz Dielectric Spectroscopy",Int'l. Symp. Elect. Insul.Mat. (ISEIM), 2005, pp. 821-824, 2005.
[28] J. K. Nelson and J. C. Fothergill, "Internal behavior of nanocomposites", Nanotechnology,Vol. 15, pp. 586-595, 2004.
[29] M. H. Sabuni and J. K. Nelson, "The effects of plasticizer on the electric strength of polystyrene", J. Mats. Sci.,Vol. 14, pp. 2791-2796, 1979.
[30] J. Artbauer, "Elektrische Festigkeit von Polymeren," Kolloid Zeitschrift,Vol. 202, pp. 15-25, 1965.
[31] Y. Li, M. Yasuda, and T. Takada, "Pulsed electroacoustic method for measurement of charge accumulation in solid dielectrics", Trans. Dielectr. Electr. Insul.,Vol. 1, pp. 188-195, 1994.
[32] J. C. Fothergill and L. A. Dissado, "Space Charge in Solid Dielectrics", presented at the Dielectrics Society, UK, 1998.
[33] J. Taima, K. Inaoka, T. Maezawa, Y. Tanaka, T. Takada, and Y. Murata, "Observation of space charge formation in LDPE/MgO nano-composite under DC stress at high temperature",IEEEConf. Electr. Insul. Dielectr. Phenomena (CEIDP), pp. 302-305, 2006.
[34] H. T. Vo and F. G. Shi, "Towards model-based engineering of optoelectronic packaging materials: Dielectric constant modeling", Microelectronics J.,Vol. 33, pp. 409-415, 2002.
[35] C. V. Chanmal and J. P. Jog, "Study of dielectric behavior in PVDF/clay nanocomposites", E-Polymers, article number 112, January 6, 2009.
[36] P. Murugaraj, D. Mainwaring, and N. Mora-Huertas, "Dielectric enhancement in polymer-nanoparticle composites through interphase polarizability", J. Appl. Phys.,Vol. 98, p. 054304, 2005.
[37] M. G. Todd and F. G. Shi, "Complex permittivity of composite systems: A comprehensive interphase approach", IEEE Trans. Dielectr. Electr. Insul.,Vol. 12, pp. 601-611, 2005.
[38] J. I. Hong, P. Winberg, L. S. Schadler, and R. W. Siegel, "Dielectric properties of zinc oxide/low density polyethylene nanocomposites", Materials Letters,Vol. 59, pp. 473-476, 2005.
[39] M. Roy, J. K. Nelson, R. K. MacCrone, L. S. Schadler, C. W. Reed, R. Keefe, and W. Zenger, "Polymer nanocomposite dielectrics - The role of the interface",IEEE Trans. Dielectr. Electr. Insul.,Vol. 12, pp. 629-642, 2005.
[40] Y. Murakami, T. Okazaki, M. Nagao, Y. Sekiguchi, C. C. Reddy, and Y. Murata, "Space charge formation in low-density polyethylene up to breakdown influenced by addition of MgO nano-filler under
DC ramp voltage",IEEE Conf. Electr. Insul. Dielectr. Phenomena (CEIDP),Piscataway, NJ, USA, pp. 685-8, 2009.
[41] R. C. Smith, L. Hui, J. K. Nelson, and L. S. Schadler, "Interfacial charge behavior in nanodielectrics",IEEEConf. Electr. Insul. Dielectr. Phenomena (CEIDP),Virginia Beach, VA, USA, pp. 650-653, 2009.
[42] J. K. Nelson and Y. Hu, "Candidate mechanisms responsible for property changes in dielectric nanocomposites",IEEE 8th Int'l. Conf. Properties and Applications of Dielectric Materials, Bali, Indonesia, pp. 150-153, 2007.
[43] W. Liu, B. Zhu, J. Zhang, and Y. Xu, "Preparation and dielectric properties of polyimide/silica nanocomposite films prepared from sol-gel and blending process", Polym. Advan. Technol.,Vol. 18, pp. 522-528, 2007.
[44] R. Magaraphan, W. Lilayuthalert, A. Sirivat, and J. W. Schwank, "Preparation, structure, properties and thermal behavior of rigid-rod polyimide/montmorillonite nanocomposites", Compos. Sci. Technol.,Vol. 61, pp. 1253-1264, 2001.
[45] H. Li, L. G., B. Liu, W. Chen, and S. Chen, "Dielectric properties of polyimide/Al2O3 hybrids synthesized by in-situ polymerization", Materials Letters,Vol. 61, pp. 1507-1511, 2007.
[46] C. Mayoux, "Degradation of insulation materials under electrical stress",IEEE Trans. Dielectr. Electr. Insul.,Vol. 7, pp. 590-601, 2000.
[47] Z. Peihong, Z. Weiguo, L. Yan, F. Yong, and L. Qingquan, "Study on corona-resistance of polyimide-nano inorganic composites",IEEE 7th Int'l. Conf. Properties and Applications of Dielectric Materials, pp. 1138-1141, 2003.
[48] Z. Mingyan, Z. Jinghe, W. Kun, and F. Yong, "Preparation and characterization of the nano-doped polyimide film",IEEE Int'l. Conf. Solid Dielectr., pp. 840-843, 2004.
[49] I. Iizuka, K. Uchida, and T. Tanaka, "Different voltage endurance characteristics of epoxy/silica nanocomposites prepared by two kinds of dispersion methods",IEEE Conf.Electr. Insul. Dielectr. Phenomena (CEIDP), pp. 236-239, 2007.
[50] T. Tanaka, "Dielectric nanocomposites with insulating properties",IEEE Trans. Dielectr. Electr. Insul.,Vol. 12, pp. 914-928, 2005.
[51] M. Kozako, N. Fuse, Y. Ohki, T. Okamato, and T. Tanaka, "Surface degradation of polyamide nanocomposites caused by partial discharges using IEC (b) electrodes",IEEE Trans. Dielectr. Electr. Insul.,Vol. 11, pp. 833-839, 2004.
[52] P. Preetha, S. Alapati, S. Singha, B. Venkatesulu, and M. J. Thomas, "Electrical discharge resistant characteristics of epoxy nanocomposites",IEEE Conf. Electrical Insulation and Dielectric Phenomena (CEIDP), pp. 718-721, 2008.
[53] J. K. Nelson, Dielectric Polymer Nanocomposites, Springer, 2010.
Linda S. Schadler received the B.S. degree from Cornell University and the Ph.D. degree from the University of Pennsylvania in Materials Science and Engineering. She is currently the Associate Dean of Academic Affairs in the School of Engineering and a Professor of Materials Science and Engineering at Rensselaer Polytechnic Institute. Before coming to Rensselaer in 1996, she was on the faculty at Drexel University and
spent 2 years at IBM's T.J. Watson Research Center. She is a Fellow of ASM International and a current Boart of Trustees Member, and a former member of the National Materials Advisory Board.
Keith Nelson (F’90) was born in Oldham, UK and received the B.Sc.(Eng.) and Ph.D. degrees from the University of London, UK. He is currently Professor Emeritus at the Rensselaer Polytechnic Institute (previously Philip Sporn Chair of Electric Power Engineering). Prior to his appointment at Rensselaer, he was manager of Electric Field Technology Programs at the General Electric R & D Center in Schenectady,
NY. He has held numerous IEEE appointments including that of the Presidency of the Dielectrics & Electrical Insulation Society, 1995-6, and
illennium Medal. is currently an IEEE Director. He is a chartered electrical engineer, a Fellow of the IET and the recipient of the IEEE M
Alisha Travelpiece (Non member) received the B.S. degree in chemical engineering from the University of Pittsburgh and the M.S. degree in materials engineering from Rensselaer Polytechnic Institute. She is currently a Materials Engineer for GE Energy in Greenville, SC.
Chris. Calebrese received the B.S. and Ph.D. degrees from Rensselaer Polytechnic Institute in Materials Engineering. He is currently a Materials Engineer workingin the Dielectrics and Electrophysics lab at GE Global Research in Niskayuna, NY. Daniel L. Schweickart(M’71-SM’86-F’12) received the B.E.E. degree from the University of Dayton, the M.S.E.E. degree from the Ohio State University, and the Ph.D. degree in electrical engineering from the University of Texas at Arlington. In 1974 and 1975, he was a Research Engineer in the High Voltage Laboratory of the Ohio Brass Company’s Research Center. In 1976, he was an Electrical Engineer at the U.S. Dept. of Energy’s Mound Laboratory. From 1977 to 1980, he was a member of a consulting and
facilities design engineering firm, Bosch and LaTour, LLC. Since 1980, he has been an Electrical Engineer for the Energy/Power/Thermal Division of the Aerospace Systems Directorate of the Air Force Research Laboratory. As a senior staff engineer, his research interests include development of advanced insulation systems for airborne applications, detection and mitigation of insulation breakdown events in aircraft power systems, corona and partial discharge phenomena and insulation testing, and high voltage engineering. Dr. Schweickart is a registered Professional Engineer in the state of Ohio.