Embed Size (px)
DESCRIPTION
Nathanson, Lori, Sean Corcoran (IESP), and Christine Baker-SmithThe New York City Department of Education’s recent efforts to improve high schools have in large part depended on a policy of choice, which enables families to select a school that they believe will best meet their child’s needs. This report examines the high school choices and placements of New York City’s lowest-achieving students, and assesses how these schools compare to those of their high-achieving peers.
Citation preview

High School Choice in New York City: A Report on the School Choices and Placements of Low-Achieving Students
REPORT
Lori Nathanson The Research Alliance for New York City Schools, NYU
Sean Corcoran
Institute for Education and Social Policy, NYU
Christine Baker-Smith The Research Alliance for New York City Schools, NYU
April 2013
Lori Nathanson The Research Alliance for New York City Schools
New York University
Sean P. Corcoran Institute for Education and Social Policy
New York University
Christine Baker-Smith The Research Alliance for New York City Schools
New York University
April 2013
© 2013 Research Alliance for New York City Schools. All rights reserved. You may make copies of and distribute this work for non-commercial educational and scholarly purposes. For any other uses, including the making of derivative works, permission must be obtained from the Research Alliance for New York City Schools, unless fair use exceptions to copyright law apply.
Cover image by Emily Canal for Schoolbook.
High School Choice in New York City A Report on the School Choices and Placements of Low-Achieving Students

ii HIGH SCHOOL CHOICE IN NEW YORK CITY
ACKNOWLEDGMENTS The authors would like to thank the New York Community Trust for their generous support of this work, and the New York City Department of Education for supplying necessary data. Hee Jin Chung and Grace Pai provided invaluable research assistance throughout the project, and Gretchen Grajo contributed additional GIS expertise and administrative support. We would especially like to thank Jonathan Winters for helping us develop new GIS capabilities for this project, and Jim Kemple and the staff of the Research Alliance for New York City Schools for helpful guidance about the report’s content and structure. Chelsea Farley’s editorial expertise and Shifra Goldenberg’s production assistance worked together to create a polished and accessible report. The report also greatly benefited from a stimulating public discussion with Rob Sanft, Joseph Viteritti, Clara Hemphill, and David Steiner at the CUNY Institute for Education Policy at Roosevelt House on November 29, 2012. Any remaining errors are solely the responsibility of the authors.

iii
CONTENTS
Acknowledgments .............................................................................................................. ii Executive Summary........................................................................................................... iv 1. Introduction ...................................................................................................................... 1 2. Who Are New York City’s Lowest-Achieving Students, and Where Do They Live? ...... 10 3. Which High Schools Do Low-Achieving Students Rank First?....................................... 17 4. How Do First-Choice Schools Compare With Matched Schools? .................................. 32 5. Did Students’ Choices and Placements Change Over Time? ........................................ 37 6. Summary and Conclusions ........................................................................................... 40 Endnotes .......................................................................................................................... 44 References ....................................................................................................................... 46
iv HIGH SCHOOL CHOICE IN NEW YORK CITY
EXECUTIVE SUMMARY Each year in New York City, close to 80,000 middle school students participate in the ritual of choosing and applying to the City’s public high schools. Armed with the 600-page Directory of NYC Public High Schools and help from parents, teachers, guidance counselors, and community groups, these students rank up to 12 high school programs they would like to attend, choosing from nearly 700 programs at more than 400 schools citywide.
School choice policies aim to improve achievement by enabling families to choose a school that they believe will best serve their child’s needs. In New York City, choice and the development of a diverse portfolio of options have played central roles in the Department of Education’s high school reform efforts. These reforms have targeted both the supply and demand sides of the choice system. On the supply side, the DOE closed underperforming schools and opened hundreds of new school options. On the demand side, the DOE centralized the school assignment process and provided students and their families with extensive information about their choices.
The potential for choice to bring about large-scale improvement and narrow achievement gaps between low- and high-performing students depends on the choices students and their families make and on their actual school placements, which balance student preferences and school admissions criteria. Our report, High School Choice in New York City, takes a close look at the choices and placements of
Key Findings
• Low-achieving students were matched to schools that were lower performing, on average, than those of all other students.
• These differences in placements were: - Driven by differences in students’ initial choices—low-achieving students’ first-choice
schools were less selective, lower-performing, and more disadvantaged; - Not a consequence of low-achieving students being less likely to receive their first
choice—overall, lower-achieving and higher-achieving students were matched to their top choices at the same rate.
• Both low- and higher-achieving students appear to prefer schools that are close to home. Thus, differences in students’ choices likely reflect, at least in part, the fact that lower-achieving students are highly concentrated in poor neighborhoods, where options may be more limited.

v
New York City’s most educationally vulnerable students: those scoring among the bottom 20 percent on the state’s math and English tests. Focusing on data from 2007 to 2011, the report examines the characteristics of these low-achieving students and how their schools choices and placements compared to those of higher-achieving peers. This summary highlights the report’s key findings and their implications for school choice policies and future research.
Though many low-achieving middle school students go on to succeed in high school, the overwhelming majority do not. For example, only 42 percent of low-achieving students (using our 7th grade test score threshold to define “low-achieving”) graduated on time between 2009 and 2011, as compared with 76 percent of all other students. A majority of these low-achieving students were male and black or Hispanic; they were also more likely to be English Language Learners or receiving special education services (or both) than their higher-achieving peers. Importantly, these students were concentrated in some of the City’s poorest communities, with one in four living in just 10 zip codes located in Brooklyn and the Bronx.
Low-Achieving Students’ First-Choice Schools and Placements
Our analysis of students’ choices and placements revealed several noteworthy patterns:
• Low-achieving students were matched to high schools that, on average, performed worse—with lower attendance and graduation rates and lower Progress Report scores—than the schools attended by their higher-achieving peers. Further, low-achieving students were matched to high schools with higher concentrations of low-achieving and low-income students.
Figure ES-1 on page vi displays Progress Report scores and graduation rates for the lowest-achieving students’ first-choice and matched schools, alongside comparable statistics for all other students. Focusing on matched schools, it shows that graduation rates were lower, on average, in high schools attended by low-achieving students (63 percent vs. 72 percent percent for their higher-achieving peers). Along the same lines, low-achieving students’ matched schools fared worse on the City’s Progress Report than those to which their higher-achieving peers were matched (56 vs. 61 points, out of a possible total of 100).

vi HIGH SCHOOL CHOICE IN NEW YORK CITY
• Differences in placements reflect differences in students’ choices and the options available to them in their local communities. Like their higher-achieving peers, low-achieving students tended to choose schools close to home. However, on average, the schools they ranked first were less selective, lower-performing, and more disadvantaged than the top choices of their higher-achieving peers.
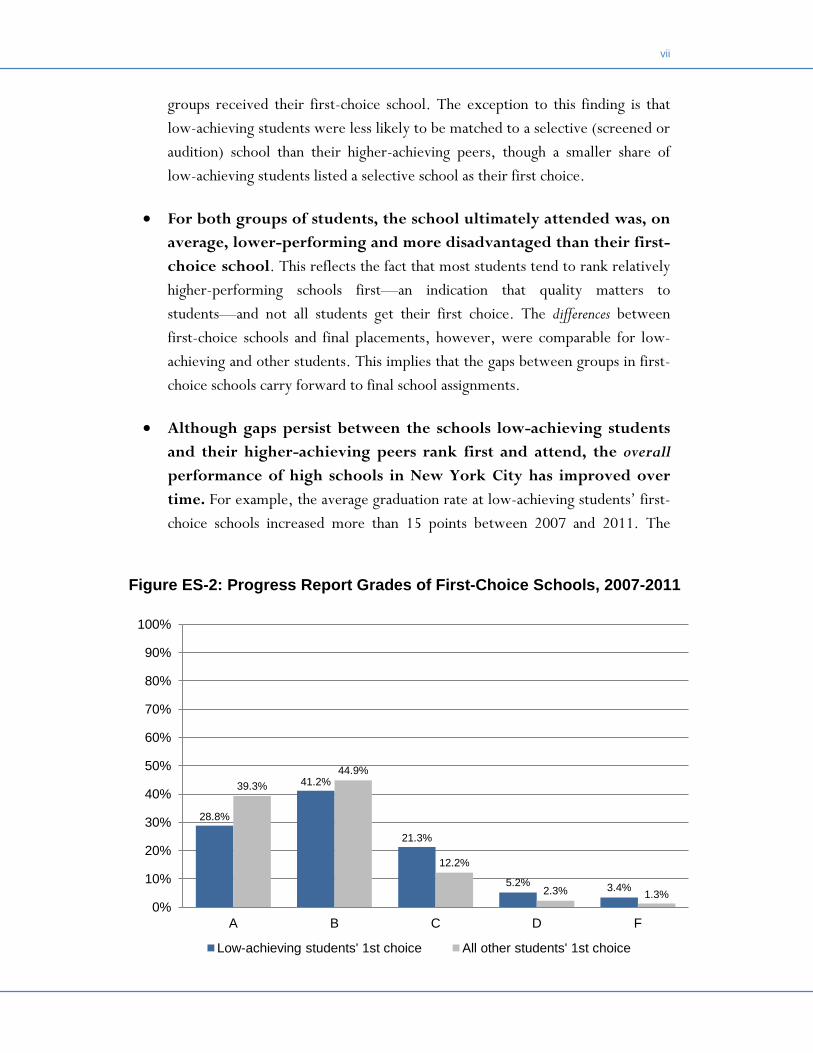
Figure ES-1 illustrates how differences in the characteristics of matched schools were present in students’ initial choices. For example, the average graduation rate was lower in the first-choice school of low-achieving students (68 percent) than that in the first-choice school of their higher-achieving peers (78 percent). Similarly, Figure ES-2 on page vii shows that the lowest-achieving students were less likely than their higher-achieving peers to select a school that had received an “A” on the Progress Report (29 percent vs. 39 percent) and were more likely to select one that earned a “C,” “D”, or “F” (30 percent vs. 16 percent).
• Overall, lower-achieving and higher-achieving students are matched to their top choices at the same rate. About 53 percent of both
Figure ES-1: Average Academic Performance of First-Choice and Matched Schools, for Low-Achieving and All Other Students, 2007-2011
60.1 pts 56.4 pts
64.5 pts 60.8 pts
68.0% 62.5%
77.5% 71.8%
0
10
20
30
40
50
60
70
80
90
100
1st choice Matched 1st choice Matched 1st choice Matched 1st choice Matched
Low-achieving All other Low-achieving All other
Progress Report Graduation Rate
vii
groups received their first-choice school. The exception to this finding is that low-achieving students were less likely to be matched to a selective (screened or audition) school than their higher-achieving peers, though a smaller share of low-achieving students listed a selective school as their first choice.
• For both groups of students, the school ultimately attended was, on average, lower-performing and more disadvantaged than their first-choice school. This reflects the fact that most students tend to rank relatively higher-performing schools first—an indication that quality matters to students—and not all students get their first choice. The differences between first-choice schools and final placements, however, were comparable for low-achieving and other students. This implies that the gaps between groups in first-choice schools carry forward to final school assignments.
• Although gaps persist between the schools low-achieving students and their higher-achieving peers rank first and attend, the overall performance of high schools in New York City has improved over time. For example, the average graduation rate at low-achieving students’ first-choice schools increased more than 15 points between 2007 and 2011. The
Figure ES-2: Progress Report Grades of First-Choice Schools, 2007-2011
28.8%
41.2%
21.3%
5.2% 3.4%
39.3% 44.9%
12.2%
2.3% 1.3% 0%
10%
20%
30%
40%
50%
60%
70%
80%
90%
100%
A B C D F
Low-achieving students' 1st choice All other students' 1st choice
viii HIGH SCHOOL CHOICE IN NEW YORK CITY
same was true for schools ranked first by their higher-achieving peers. Thus, while differences remain in the performance of schools attended by these two groups, low-achieving students are choosing and attending schools with better outcomes than in years past.
What Are the Implications of These Findings?
This study was not an evaluation of high school choice in New York City, and cannot tell us to what extent the choice system itself is responsible for low-achieving students attending better schools over time. At this point, we also have little say about why students chose the schools they did. Choice allows families to identify schools they believe are best for them, by whatever criteria they set. Academic performance is a factor, but location, curricular fit, safety, and familiarity all play a role as well. We make no claims here whether students are making the “right” choices or not.
Rather, we view this study as an important first step toward understanding the choices and school assignments of the City’s lowest-achieving students. Our results document systematic, and sometimes large, differences in the performance and composition of schools attended by the lowest-achieving and all other students. Given that, overall, both groups of students were equally likely to be assigned to their top choices, these differences are largely the result of differences in their initial choices. Such findings raise at least two important questions for policymakers, educators and researchers to consider regarding the choice process and, specifically, the choices of low-achieving students:
1. Can school choice policies address the concentration of low-achieving students in disadvantaged communities? School choice policies provide an avenue for students to enroll in schools citywide, but in practice, students are constrained by familiarity with a school and their willingness to travel. All students appear to prefer higher-performing schools and schools that are close to home (selecting first-choice schools that are about a half hour away on average). However, low-achieving students tend to live in disadvantaged communities, where need is concentrated and the supply of high-performing schools is low. The good news is that the supply of schools across the City appears to be improving. Yet, we need to learn more about the distribution of higher-performing schools, particularly the extent to which they

ix
are available in the communities where many of NYC’s low-achieving students live. Likewise, additional research is needed about strategies to help low-achieving students get access to higher-performing schools outside of their communities.
It is worth noting that many high schools give admissions priority to students residing in the same borough or geographic school district. Such priorities make sense, as they ensure students have access to schools in their own neighborhood if they wish to attend them. At the same time, because of the concentration of low-achieving students in certain neighborhoods, this clustering may put them at a disadvantage when applying to schools citywide. These students may, for example, find it more difficult to be admitted to oversubscribed, high-quality schools with geographic priorities outside of their neighborhood or borough. This remains an unstudied issue worthy of attention.
2. To what extent does NYC’s system of selective and non-selective high schools isolate lower-achieving students? Our analysis finds that low-achieving students are less likely to rank selective high schools as their top choice, and those who do (nearly a third) are less likely to be admitted. Choice offers students the opportunity to attend a school that best meets their needs, and very rigorous programs may not be a good match for lower-achieving students, who may be unprepared for such coursework. At the same time, the system has the potential to persistently stratify low- and high-achieving students into different schools—stratification that is driven by both geographic and performance-based admission criteria. Greater attention should be paid to the geographic distribution of selective and non-selective schools, as well as the way admissions methods shape choices and the allocation of students across schools. Expanding access to academically mixed educational option schools may be one viable strategy for reducing the isolation of lower-achieving students in certain schools.
New York City’s lowest-achieving students are, on average, attending higher-quality high schools than in years past, and graduating from NYC high schools in higher numbers. Whether or not these gains are attributable to the City’s policy of universal high school choice, however, is an open—and difficult—question. The Department of Education has made great strides in streamlining the choice process, providing students and their families with more information about their options,
x HIGH SCHOOL CHOICE IN NEW YORK CITY
and making school assignments fairer and more transparent. At the same time, there are limitations to what choice alone can accomplish. As evident from this study, students face constraints that shape the set of schools they can and do consider. Any improvements seen here may be driven at least as much by changes in supply—new schools that the district has brought to the neighborhoods that need them most—as by changes in demand.
Given the over-representation of low-achieving students in the poorest sections of the City, it is critical that the district continue efforts to bring targeted improvement to these communities. Helping low-achieving students and their families become fully informed about their options should remain a high priority as well. It is also important that sufficient resources be made available to help students with their choices, including an adequate number of knowledgeable guidance counselors with the time to devote to students needing the most support. Finally, the district should take steps to ensure that low-achieving students are not being concentrated in schools that give them little exposure to higher-achieving students. Promoting more high-quality educational option programs may be one way to accomplish this.
1
CHAPTER 1: INTRODUCTION Each year in New York City, close to 80,000 middle school students participate in the ritual of choosing and applying to the City’s public high schools. Armed with the 600-page Directory of NYC Public High Schools and help from parents, teachers, guidance counselors, and community groups, these students rank up to 12 high school programs they would like to attend, choosing from nearly 700 programs at more than 400 schools citywide.
School choice policies aim to improve student outcomes by enabling families to choose, from a portfolio of options, a school that they believe will best meet their child’s needs. In New York City, choice and the development of a diverse portfolio of options have played central roles in the Department of Education’s high school reform efforts. These reforms have targeted both the supply and demand sides of the choice system. On the supply side, the DOE has closed underperforming schools and opened hundreds of new school options. On the demand side, the DOE centralized the school assignment process and provided students and their families with extensive information about their choices. While acknowledging the importance of and interaction between these two sides of NYC’s high school choice reform, this report focuses on the demand side, specifically students’ choices and placements.
The potential for choice to bring about large-scale improvement and narrow gaps between low- and high-performing students depends on the choices students and their families make and on their actual school placements, which balance student preferences and school admissions criteria. In this report, we take a close look at the choices and placements of New York City’s most educationally vulnerable students: those scoring among the bottom 20 percent on math and English state tests. Focusing on data from 2007 to 2011, we first examine who these low-achieving students are (for example, how do their demographics compare to other students in the City, what educational challenges do they face, and where do they live?). We then review their most preferred schools and the schools to which they were ultimately assigned, and assess how these schools compare to those of their higher-achieving peers. While we are particularly interested in academic performance—as measured by schools’ graduation rates and Progress Report results, for instance—we examine contextual factors as well, including schools’ attendance rates, location, racial/ethnic diversity, poverty rates, and the proficiency of incoming students. We

2 HIGH SCHOOL CHOICE IN NEW YORK CITY
believe the findings presented in this report provide useful guidance for policymakers overseeing school choice, and highlight important factors to consider for students, families and schools as they navigate school choice decisions.
Why Is School Choice Important?
Policies promoting school choice—magnet schools, charter schools, and vouchers, to name a few—are firmly embedded in modern efforts to improve public education. The case for these policies is often made on grounds of both efficiency and equity. In terms of efficiency, a system in which families “vote with their feet” and choose the school that serves them best is thought to reward schools that deliver a quality education. Schools that fail to perform will lose students and be pressured to improve or face potential closure. With respect to equity, school choice is based on the notion that all families have a right to identify the best available school for their children; the policy attempts to level the playing field, and ensure that no student is forced to attend a neighborhood school that is failing to provide a high-quality education.
Evidence on the efficacy of choice, however, is mixed. On the one hand, some studies have found that the ability to choose a school can have large impacts on academic outcomes, particularly when the “chosen” school is of higher quality than the alternative.1 On the other hand, other studies have found large-scale systems of choice have no or uneven effects, with some groups benefiting and others not.2 Furthermore, some choice programs have been found to exacerbate segregation across schools by race/ethnicity, socioeconomic status, and academic ability.3
The success of any choice policy depends on demand- and supply-side factors. On the demand side, the system depends on the choices students and their families make when given the opportunity. School choice relies on families’ ability to make an informed decision, one that is attentive to school quality as well as the “fit” of a given school to a student’s particular needs and interests. Yet students’ choices are shaped and constrained by their familiarity with and proximity to specific schools, concerns about safety, and the influence of friends and family. Parents vary in their knowledge of different schools, and some may lack the information, time, and resources required for a successful search (which, ideally, would involve visits to the schools being considered). In some households, the decision may be left entirely to the child.

3
On the supply side, the system depends on the availability of high-quality options. In theory, market forces will promote the expansion of high-performing schools, encourage new schools to open, and force under-performing schools to close. In practice, a central authority (the school district) manages the portfolio of school options available to students and their families. In New York City, the Department of Education has devoted considerable attention to supply, closing underperforming schools and opening hundreds of new school options. 4 This effort has been particularly focused on neighborhoods that need new options the most—those where fewer high-quality high schools existed.
Careful, ongoing attention to the schools low-achieving students choose to attend is essential, for several reasons. First, because of the sheer number and diversity of options, choosing a school in New York City requires a higher level of sophistication than is required in most school districts. Many families navigate the system successfully, but parents of low-achieving students are at greater risk for lacking the resources needed to make a fully informed choice. Second, NYC graduation rates have improved, but remain low by U.S. standards. And, more importantly, large gaps remain across schools. Choosing a high school is thus a consequential decision, especially for students at risk of dropping out. Third, despite its advantages, a universal choice system with hundreds of options raises the possibility that students will further segregate by socioeconomic status and academic ability. In New York City, high school options include a number of academically selective (that is, screened or audition) schools, which has implications for sorting students by ability.
Our report provides a first look at the high school choices of New York City’s lowest-achieving students, and how these choices compare to those of their higher-achieving peers. Importantly, our analysis is not a formal evaluation of high school choice in New York City, and cannot tell us whether low-achieving students are faring better or worse in the choice process than in years past. Additionally, while we have rich information about students’ actual school rankings, we are unable to say why students chose the schools that they did. Choice allows families to identify schools they believe are best for them, by whatever criteria they set. Academic performance is a factor, but many other criteria come into play as well, including proximity to home, safety, curricular focus, and fit to the students’ interests and needs.5 We make no claims about whether students are making the “right” choices for them or not; future reports from the Research Alliance and Institute for

4 HIGH SCHOOL CHOICE IN NEW YORK CITY
Education and Social Policy will provide a more rigorous analysis of students’ preferences, including how students and their families are making these decisions.
An Overview of High School Choice in New York City
New York City relies on a complex algorithm to pair students with high schools that takes into account students’ preferences, available space, and the schools’ own rankings and priorities. (Alvin Roth, who designed the system with his colleagues, was recently awarded the Nobel Prize in Economics for his work developing assignment mechanisms like this one). In 8th grade, middle school students submit
Figure 1: The High School (HS) Choice Process in New York City
Note: Based on the 2012-2013 high school admissions process. Exact timeline may vary from year to year.

5
applications listing up to 12 high school programs they would like to attend, ranked in order of preference. Assignments are made by the central enrollment office, using the matching algorithm.
For most students, the process of ranking schools begins much earlier, when they learn about their high school options through fairs, information sessions, assemblies, and the published Directory.6 (Figure 1 on page 4 shows a typical timeline). In the fall of 8th grade, schools that screen based on academic or artistic work conduct interviews and auditions, and students wishing to apply to one of the prestigious exam-based specialized high schools take the Specialized High School Admissions Test (SHSAT). By December, all rising 9th graders are required to submit their choices.7 Most are assigned by March or April in the “main round” of matching, although a number of students remain unmatched. Unassigned students must re-apply in a secondary “supplemental round” for remaining seats. Most, though not all, receive a match by the conclusion of the supplemental round.
Applicants choose from a large portfolio of high schools, including small themed schools, large comprehensive schools, career academies, and performing arts schools. 8 Each high school has an admissions method and a set of admissions priorities that determine how students are admitted. Excluding the specialized high schools, there are six admissions methods, including three that are academically non-selective (limited unscreened, unscreened, and zoned), two that are selective (screened and audition), and one that is partially selective with a purposefully balanced test score distribution (educational option). These admissions methods are summarized in the texbox on page 7. Beyond the admissions method, school priorities give preference to students based on geography or demonstrated interest. For example, a school may give priority admission to residents of the same borough or regional school district, and/or to students who have visited the school or attended a school information session.
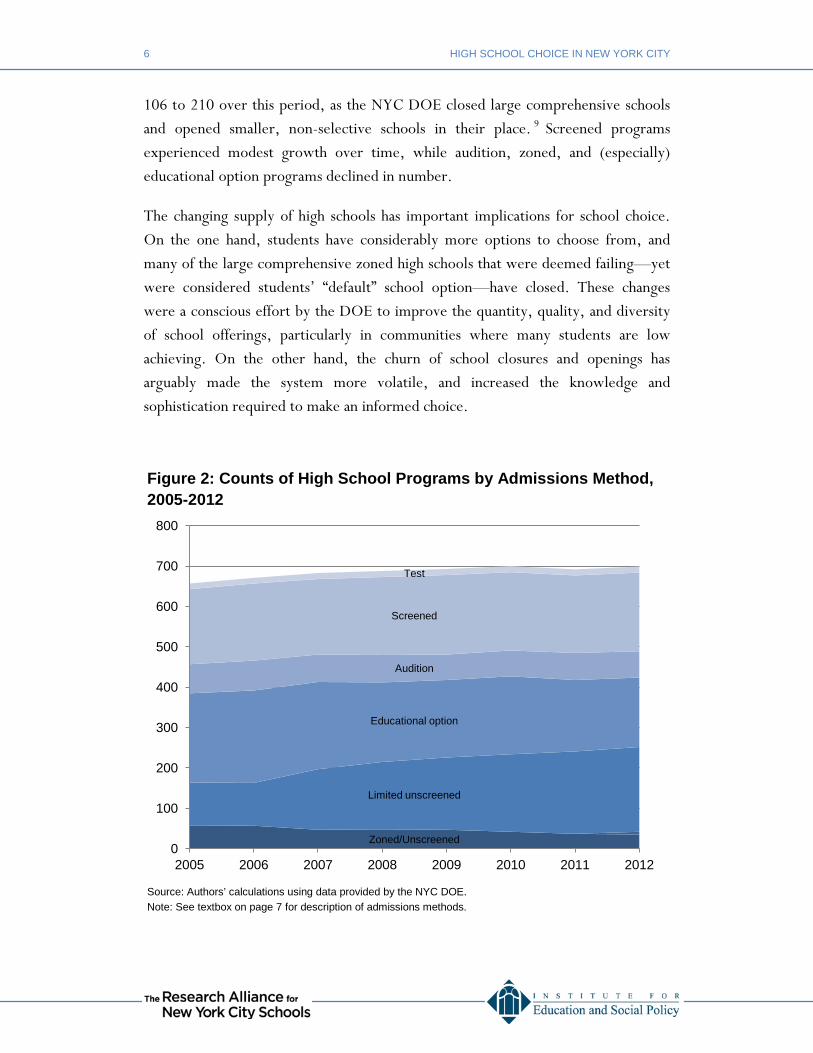
Figure 2 on the next page shows how the supply of available school programs has grown over time, both in total and by admissions method. In 2012, there were 699 unique programs housed in 407 schools citywide, including the nine specialized schools (eight that require the SHSAT, and the LaGuardia Arts School, which requires an audition or portfolio). The number of options has grown substantially since 2005, when students selected from 657 programs in 325 schools. By far, the greatest growth has been in limited unscreened schools, which nearly doubled from
6 HIGH SCHOOL CHOICE IN NEW YORK CITY
106 to 210 over this period, as the NYC DOE closed large comprehensive schools and opened smaller, non-selective schools in their place. 9 Screened programs experienced modest growth over time, while audition, zoned, and (especially) educational option programs declined in number.
The changing supply of high schools has important implications for school choice. On the one hand, students have considerably more options to choose from, and many of the large comprehensive zoned high schools that were deemed failing—yet were considered students’ “default” school option—have closed. These changes were a conscious effort by the DOE to improve the quantity, quality, and diversity of school offerings, particularly in communities where many students are low achieving. On the other hand, the churn of school closures and openings has arguably made the system more volatile, and increased the knowledge and sophistication required to make an informed choice.
Figure 2: Counts of High School Programs by Admissions Method, 2005-2012
Source: Authors’ calculations using data provided by the NYC DOE. Note: See textbox on page 7 for description of admissions methods.
Zoned/Unscreened
Limited unscreened
Educational option
Audition
Screened
Test
0
100
200
300
400
500
600
700
800
2005 2006 2007 2008 2009 2010 2011 2012

7
Despite the system’s complexity and scale, most students receive one of their top choices. In 2011, just over half (52 percent) of all students received their first choice, and three quarters of students were matched to one of their top three choices (see Figure 3 on the next page).10 The rates of students matched to their top choices have steadily improved since the new system was implemented in 2004-2005. Still, more than 10 percent of students received none of their top 12 choices during the main round. These students participated in the supplemental round and received one of their 12 supplemental school choices, or in some cases, were assigned to a school other than one that they listed.11
Receiving one’s first choice is desirable, but not an unequivocally positive outcome. For example, consider a hypothetical student, Alex, who designates a chronically underperforming and under-enrolled school as his first choice. He will almost certainly be assigned there, given low demand for the school, and will count among those receiving their first choice. Barbara, on the other hand, ranks competitive,
High School Admission Methods in New York City
High schools in New York City admit students through one of the following methods:
Selective Methods • Test: Admission based solely on applicants’ score on the Specialized High School
Admissions Test (SHSAT). • Screened: Rank applicants based on their final report card grades from 8th grade,
reading and math standardized test scores, attendance, or other criteria. • Audition: Require applicants to demonstrate proficiency in a specific performing
arts/visual arts area. May also review attendance and grades.
Non-Selective Methods • Limited Unscreened: Prioritize applicants who demonstrate interest in the school by
attending a school information session or open house event, or by visiting the school’s exhibit at a High School Fair.
• Unscreened: Randomly select among applicants. • Zoned: Prioritize applicants who live in the geographic zoned area of the high school.
Residency is the sole admission criterion.
Partially Selective • Educational Option: Meant to serve a wide range of academic performers. Based on
standardized test reading scores from the prior school year, applicants are admitted based on the following target distribution: 16 percent high reading level; 68 percent middle reading level; 16 percent low reading level.
Source: Directory of NYC Public High Schools, Retrieved 4/8/13 from http://schools.nyc.gov/NR/rdonlyres/565AF741-7D6A-4D0B-B8AB-11AB469F33DD/0/201213FOB.pdf

8 HIGH SCHOOL CHOICE IN NEW YORK CITY
high-quality high schools among her top choices, and is matched to her third choice. Barbara’s school placement may be better than Alex’s from an academic standpoint. Yet Barbara is not counted among those receiving their first choice. While the DOE aims to maximize the number matched to their most desired school—an important goal—a full understanding of the choice policy’s effects requires attention to the quality and suitability of schools students choose in practice.
Finally, it is important to note that a number of students arrive late to the district or otherwise do not participate in the high school admissions process during their 8th grade year. Latecomers visit a borough enrollment office in order to be assigned a school with available seats. (In addition, a limited number of 10th grade seats are reserved for late arrivals and transfers). Many of the City’s low-achieving students are likely to be found among this group. Because late-arriving students fail to submit choices and are typically missing prior academic information, however, we are forced to exclude them from this analysis.
Figure 3: Matched High School, All Participating 8th Graders, 2011
Source: Authors’ calculations using data provided by the NYC DOE based on 74,098 students who were matched in 2011.
1st Choice 52%
2nd Choice 14%
3rd
Choice 8%
4th - 12th Choice 15%
Supplemental or other
11%

9
The Structure of This Report
The following chapter provides a profile of the City’s low-achieving students, including how we defined this group of students and a review of their demographic characteristics and the neighborhoods where they reside. Chapter 3 examines the high schools that low-achieving students ranked first, and how these compare to the first choices of other students. In Chapter 4, we describe how the matched schools for these two groups differed from their first choices, while Chapter 5 considers the extent to which students’ choices and matched schools changed over time. The final chapter discusses the implications of our findings and highlights important questions for policymakers, educators, and researchers to consider as they work to improve the choice process for all students.
Data Sources
This report draws on high school admissions data held by the Research Alliance through an ongoing data sharing agreement with the NYC Department of Education. This data included:
• The high school rankings submitted by five cohorts of students—those entering 9th grade between 2007 and 2011;
• The school to which each of these students was ultimately matched; • Demographic records, academic history, and 9th grade enrollment status for each student; and • Information about the schools (both students’ top choices and the matched schools), including
Progress Report results, graduation rates, physical location, and student demographics.*
Nearly 80,000 8th graders participated in the high school choice process each year during our study period. Most were enrolled in a public school, but a substantial number applied from a private middle school. Some applicants began the process but opted out at some stage. This might happen, for example, when a student did not receive an offer from a selective school and then decided to attend a private school instead. Others moved out of the district and did not complete the process. Excluding opt-outs, about 74,000 students were ultimately matched to a school, and 67,000 enrolled as 9th graders each year. In this report, we focus only on the population of students that (1) attended a public middle school; (2) completed the choice process; and (3) enrolled in a NYC public high school in 9th grade. Because we defined low-achieving students using state test scores, we also required that included students have state test scores reported in 7th grade. Thus our analytic sample included 317,010 students out of 422,491 who participated in the high school choice process during the study period. We excluded 105,481 students. Of these, 71,546 did not have a 7th grade test score and 33,935 were excluded for other reasons. Many of the students without test scores applied from private schools, or were new to NYC schools. Our analytic sample (317,010) included 90 percent of all students with 7th grade test scores (350,945).
* Graduation rates were not available for some schools that were open for enrollment during this period (ranging from 47 to 109 schools, depending on the year). Because these schools opened after 2007, they did not yet have graduating classes for which these calculations could be made.

10 HIGH SCHOOL CHOICE IN NEW YORK CITY
CHAPTER 2: WHO ARE NYC’S LOWEST-ACHIEVING
STUDENTS, AND WHERE DO THEY LIVE? To understand how low-achieving students are faring in New York City’s high school choice system, the first step was to determine a good way of defining this group of students. We then set out to compare them to other students in the City, on a range of characteristics, including demographics (race, gender, poverty rates, etc.), special education status and English language proficiency. Finally, we looked closely at the neighborhoods where students reside, which—as we discuss below—may be especially important in the context of school choice.
How Were “Low-Achieving” Students Defined?
Our primary interest was in a group of the “lowest-achieving” rising 9th graders. While there were many ways this could be defined, we based our definition on students’ 7th grade performance on the New York State English Language Arts (ELA) and mathematics tests. (These are the last state tests taken before the choice process begins, and the tests that many screened schools use to rank applicants.) Students who scored sufficiently low on both tests were classified as “low-achieving” for this study.12
A common benchmark for low achievement is a test score in the Level 1 or Level 2 category on the New York State assessments—failing to meet or partially meeting state standards. However, scores on these assessments rose sharply during our study period, and as a result, fewer and fewer students were deemed “low achieving” by this benchmark (see Appendix A). This trend and the perception that the tests became easier over time led the state to re-calibrate the proficiency categories in 2011.13
To keep the study population stable over time, we defined low-achieving students using percentiles rather than proficiency categories. Specifically, we defined “Level 1” students as those below the 20th percentile on a given test (ELA or math), and “Level 2” students as those at or above the 20th percentile, but below the 50th percentile.14 This approach ensures that we used the same criteria to define our focus population each year and kept the composition of this population relatively constant over time.
11
Using these percentile thresholds, we defined low-achieving students as students who scored below the 20th percentile in either ELA or math, and no higher than the 50th percentile in the other subject. While our exact criteria for inclusion in the “low-achieving” group is necessarily arbitrary, there is little question that students in this category have significantly worse high school outcomes than others. For example, we computed the four-year high school graduation rate for the 2005, 2006, and 2007 cohorts who would have graduated in 2009, 2010, and 2011, respectively. We found that only 42 percent of students classified as “low-achieving” based on their 7th grade test scores graduated on time, as compared with 76 percent of all other students. Close to 22 percent had formally dropped out of school by this point, versus 8 percent of their higher-achieving peers. By the 10th grade, the low-achieving population had, on average, passed fewer than one (0.56) of the required state Regents exams, while those not in this group had passed close to three (2.78).
What Are the Characteristics of Low-Achieving Students?
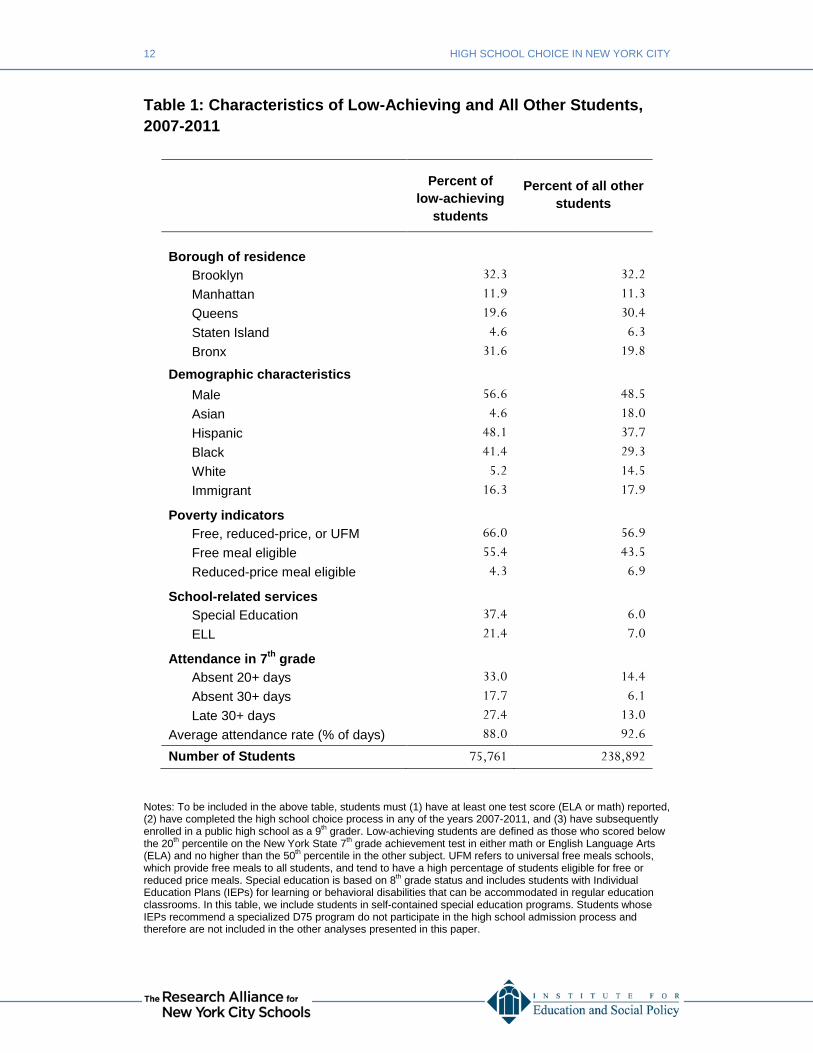
Combining all cohorts (2007–2011), 24 percent of students in public middle schools participating in high school choice met our definition of low-achieving, based on their 7th grade test scores (see Data Sources textbox on page 9). About half of these (11 percent of all students) scored below the 20th percentile in both ELA and math. Table 1 on the next page offers a look at some characteristics of this population, alongside descriptive statistics for students who were not classified as “low-achieving” (who we often refer to in this report as “all other” students).15
As is clear from Table 1, the low-achieving population differed in a number of important ways from other students. For example, low-achieving students were poorer, with 55 percent eligible for free meals, versus 44 percent of all other students. Low-achieving students were more likely to be black (41 percent vs. 29 percent) and Hispanic (48 percent vs. 38 percent) than other students, and were less likely to be white (5 percent vs. 15 percent) or Asian (5 percent vs. 18 percent). One third of the low-achieving group had been absent 20 or more days in 7th grade (vs. 14 percent of all other students), and nearly a third (27 percent) had been late to school for 30 or more days. Boys were significantly over-represented in the low-achieving group (at 57 percent) compared to their higher-achieving peers (48 percent).
12 HIGH SCHOOL CHOICE IN NEW YORK CITY
Table 1: Characteristics of Low-Achieving and All Other Students, 2007-2011
Notes: To be included in the above table, students must (1) have at least one test score (ELA or math) reported, (2) have completed the high school choice process in any of the years 2007-2011, and (3) have subsequently enrolled in a public high school as a 9th grader. Low-achieving students are defined as those who scored below the 20th percentile on the New York State 7th grade achievement test in either math or English Language Arts (ELA) and no higher than the 50th percentile in the other subject. UFM refers to universal free meals schools, which provide free meals to all students, and tend to have a high percentage of students eligible for free or reduced price meals. Special education is based on 8th grade status and includes students with Individual Education Plans (IEPs) for learning or behavioral disabilities that can be accommodated in regular education classrooms. In this table, we include students in self-contained special education programs. Students whose IEPs recommend a specialized D75 program do not participate in the high school admission process and therefore are not included in the other analyses presented in this paper.
Percent of low-achieving
students
Percent of all other students
Borough of residence Brooklyn 32.3 32.2
Manhattan 11.9 11.3
Queens 19.6 30.4
Staten Island 4.6 6.3
Bronx 31.6 19.8
Demographic characteristics
Male 56.6 48.5
Asian 4.6 18.0
Hispanic 48.1 37.7
Black 41.4 29.3
White 5.2 14.5
Immigrant 16.3 17.9
Poverty indicators Free, reduced-price, or UFM 66.0 56.9
Free meal eligible 55.4 43.5
Reduced-price meal eligible 4.3 6.9
School-related services Special Education 37.4 6.0
ELL 21.4 7.0
Attendance in 7th grade Absent 20+ days 33.0 14.4
Absent 30+ days 17.7 6.1
Late 30+ days 27.4 13.0
Average attendance rate (% of days) 88.0 92.6
Number of Students 75,761 238,892
13
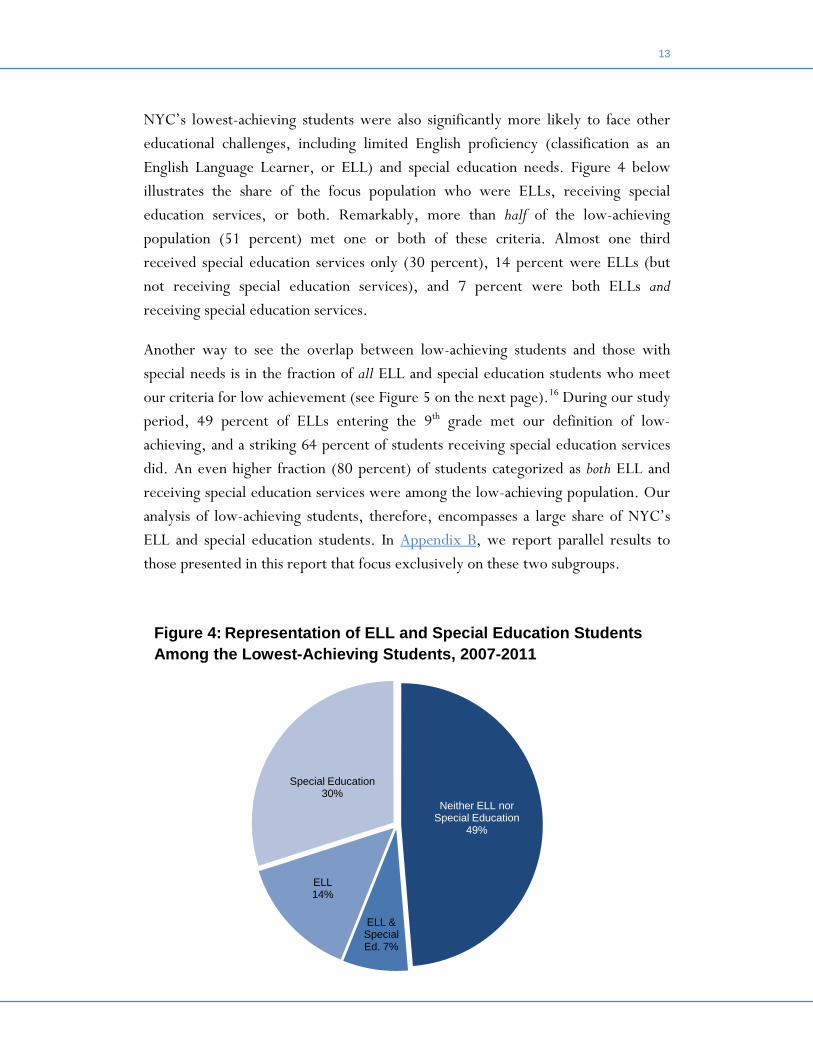
NYC’s lowest-achieving students were also significantly more likely to face other educational challenges, including limited English proficiency (classification as an English Language Learner, or ELL) and special education needs. Figure 4 below illustrates the share of the focus population who were ELLs, receiving special education services, or both. Remarkably, more than half of the low-achieving population (51 percent) met one or both of these criteria. Almost one third received special education services only (30 percent), 14 percent were ELLs (but not receiving special education services), and 7 percent were both ELLs and receiving special education services.
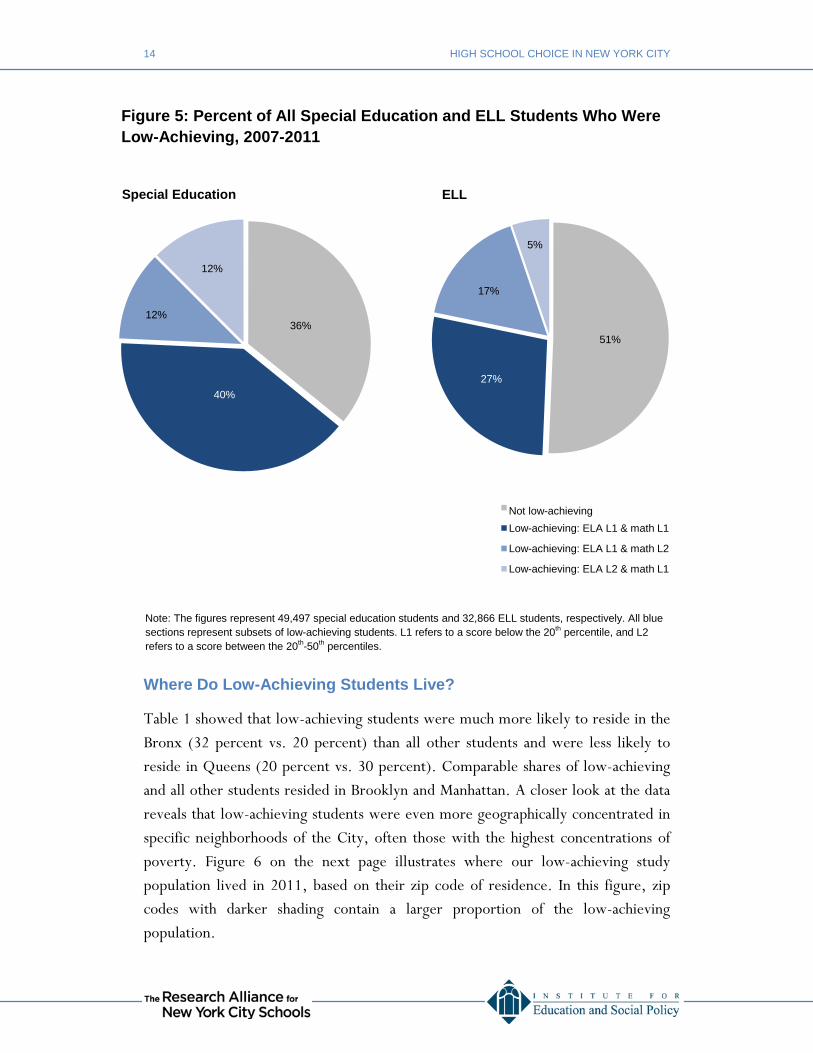
Another way to see the overlap between low-achieving students and those with special needs is in the fraction of all ELL and special education students who meet our criteria for low achievement (see Figure 5 on the next page).16 During our study period, 49 percent of ELLs entering the 9th grade met our definition of low-achieving, and a striking 64 percent of students receiving special education services did. An even higher fraction (80 percent) of students categorized as both ELL and receiving special education services were among the low-achieving population. Our analysis of low-achieving students, therefore, encompasses a large share of NYC’s ELL and special education students. In Appendix B, we report parallel results to those presented in this report that focus exclusively on these two subgroups.
ELL Figure 4: Representation of ELL and Special Education Students Among the Lowest-Achieving Students, 2007-2011
Neither ELL nor Special Education
49%
ELL & Special Ed. 7%
ELL 14%
Special Education 30%
14 HIGH SCHOOL CHOICE IN NEW YORK CITY
Where Do Low-Achieving Students Live?
Table 1 showed that low-achieving students were much more likely to reside in the Bronx (32 percent vs. 20 percent) than all other students and were less likely to reside in Queens (20 percent vs. 30 percent). Comparable shares of low-achieving and all other students resided in Brooklyn and Manhattan. A closer look at the data reveals that low-achieving students were even more geographically concentrated in specific neighborhoods of the City, often those with the highest concentrations of poverty. Figure 6 on the next page illustrates where our low-achieving study population lived in 2011, based on their zip code of residence. In this figure, zip codes with darker shading contain a larger proportion of the low-achieving population.
Figure 5: Percent of All Special Education and ELL Students Who Were Low-Achieving, 2007-2011
Note: The figures represent 49,497 special education students and 32,866 ELL students, respectively. All blue sections represent subsets of low-achieving students. L1 refers to a score below the 20th percentile, and L2 refers to a score between the 20th-50th percentiles.
36%
40%
12%
12%
Special Education
Not low achieving
Low-achieving: ELA L1 & math L1
Low-achieving: ELA L1 & math L2
Low-achieving: ELA L2 & math L1
51%
5%
17%
27%
ELL
27%
Not low-achieving

15
In 2011, a significant share of the low-achieving study population lived in the Central and South Bronx; East and Central Harlem and Washington Heights in Manhattan; parts of Central Brooklyn, including Brownsville, East New York, Cypress Hills, and Flatbush; and north and southeast sections of Queens, such as North Corona, Rochdale, and Far Rockaway. (Appendix B provides maps for other years, which show comparable patterns). Remarkably, nearly one in four of the low-achieving students in our study resided in one of only ten zip codes in the City, including seven in the Bronx and three in Brooklyn.17
Figure 6: Geographic Distribution of Low-Achieving Students by Residential Zip Code, 2011
Note: There were 15,177 low-achieving students in our study population in 2011. Low-achieving students are defined as those scoring below the 20th percentile in one subject (ELA or math) and no higher than the 50th percentile in the other subject. See Appendix B for graphs for additional cohorts.
16 HIGH SCHOOL CHOICE IN NEW YORK CITY
The geographic concentration of low-achieving students is relevant to school choice for several reasons. First, all else equal, students tend to prefer schools closer to home.18 Students are more familiar with these schools, their friends and neighbors may attend there, and their location is convenient. This preference implies that students’ choices may disproportionately reflect proximate schools. Second, one of the underlying principles of choice is that it offers an opportunity to break the link between the neighborhoods where students live and the schools they attend. By examining where low-achieving students live and where they choose to go to school, we can learn the extent to which students apply to and ultimately enroll in schools outside of their neighborhoods. In Chapter 3, we revisit the map presented in Figure 6 to see where low-achieving students’ first-choice schools were located (see Figure 13 on page 27).
Summary of Low-Achieving Student Profile
NYC’s low-achieving students were poorer, more likely to be black or Hispanic, and more likely to be male, compared with other students. As a group, they faced significant educational challenges. One third of low-achieving students had been absent 20 or more days in 7th grade and nearly as many had been late to school for 30 or more days. They were much more apt to have limited English proficiency and special education needs than were other students. Finally, they were highly concentrated in certain neighborhoods, which, as we see in the next chapter, may play a role in the high schools they select.
17
CHAPTER 3: WHICH HIGH SCHOOLS DO LOW-ACHIEVING STUDENTS RANK FIRST?
The primary goal of this report is to profile the high school choices of NYC’s lowest-achieving students. We begin this chapter by outlining why students’ first choices matter. We then characterize low-achieving students’ “typical,” or average, first-choice school in four broad areas: (1) admissions method, (2) academic performance, (3) peer composition and school context, and (4) location/distance from home. For comparison, analogous measures are provided for schools ranked first by students not categorized as low-achieving (“all other students”).
Why Look at First Choices?
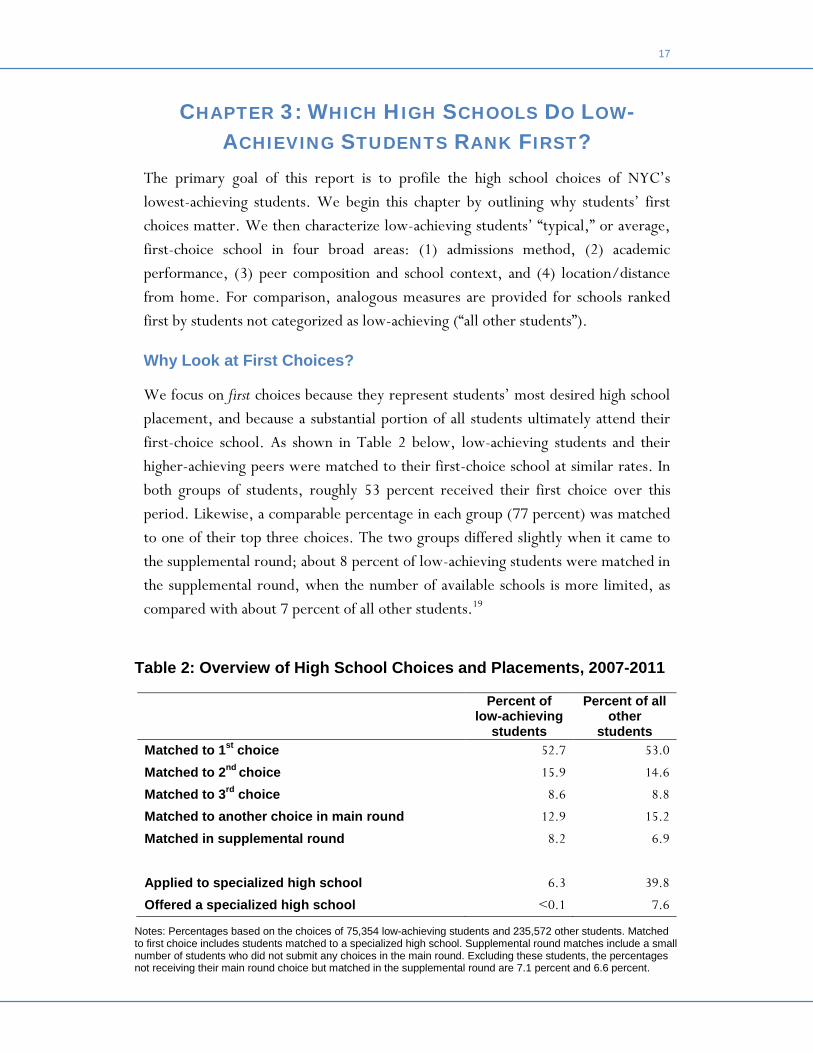
We focus on first choices because they represent students’ most desired high school placement, and because a substantial portion of all students ultimately attend their first-choice school. As shown in Table 2 below, low-achieving students and their higher-achieving peers were matched to their first-choice school at similar rates. In both groups of students, roughly 53 percent received their first choice over this period. Likewise, a comparable percentage in each group (77 percent) was matched to one of their top three choices. The two groups differed slightly when it came to the supplemental round; about 8 percent of low-achieving students were matched in the supplemental round, when the number of available schools is more limited, as compared with about 7 percent of all other students.19
Table 2: Overview of High School Choices and Placements, 2007-2011
Percent of low-achieving
students
Percent of all other
students Matched to 1st choice 52.7 53.0
Matched to 2nd choice 15.9 14.6
Matched to 3rd choice 8.6 8.8
Matched to another choice in main round 12.9 15.2
Matched in supplemental round 8.2 6.9
Applied to specialized high school 6.3 39.8
Offered a specialized high school <0.1 7.6
Notes: Percentages based on the choices of 75,354 low-achieving students and 235,572 other students. Matched to first choice includes students matched to a specialized high school. Supplemental round matches include a small number of students who did not submit any choices in the main round. Excluding these students, the percentages not receiving their main round choice but matched in the supplemental round are 7.1 percent and 6.6 percent.

18 HIGH SCHOOL CHOICE IN NEW YORK CITY
While low-achieving students were admitted to their first-choice school at similar rates as other students, the schools they ranked first tended to differ in a number of important ways. Below we examine the admissions methods of first-choice schools (for both groups of students), which tells us about the criteria the schools use to admit students, but not necessarily their academic performance. To get at academic performance, we look at several indicators, including the schools’ Progress Report scores, graduation rates, and attendance rates. In addition, we present information about peer composition and school context, as these factors also shape students’ educational experiences. Finally, we describe the school location and distance from home, to understand the geographic distribution of first-choice schools in general and in relation to where students live. Each of these characteristics helps us to understand how low-achieving students’ first-choice schools may differ from those of their higher-achieving peers.
Admissions Method
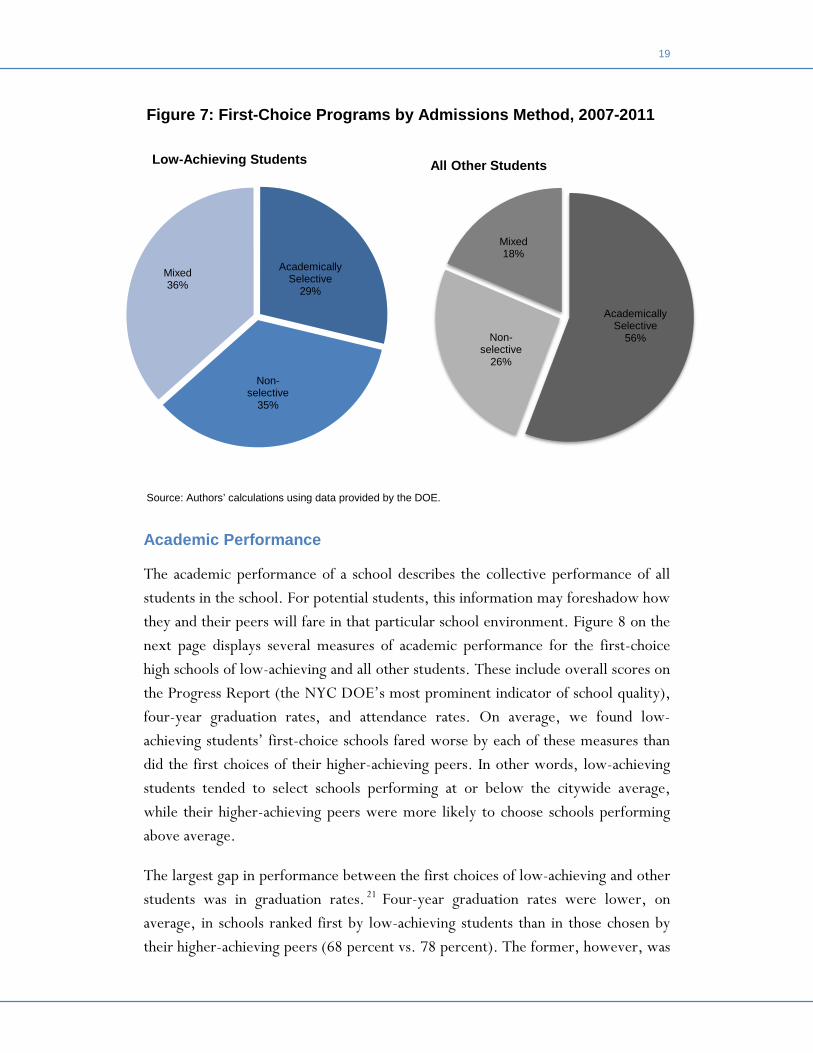
During our study period, the average applicant ranked between 6 and 7 schools in the main round—that is, fewer than the possible 12. Low-achieving students tended to rank slightly more, between 7 and 8 schools.20 More interesting, however, are differences in the selectivity of low-achieving and other students’ first-choice schools, as shown in Figure 7 on the next page. For this figure, we grouped the six admissions methods into three categories that represent their selectivity: selective (audition and screened), non-selective (limited unscreened, unscreened, and zoned), and mixed (educational option). Among low-achieving students, academically mixed educational option programs were the most popular, representing 36 percent of all first choices, followed by non-selective programs (35 percent) and selective programs (29 percent). More than half of other students listed a selective program as their first choice (56 percent); one quarter (26 percent) listed a non-selective program first; and less than one fifth (18 percent) ranked an educational option program first. It is not surprising that low-achieving students were less likely to apply to an academically selective school. Selective schools frequently use 7th grade math and ELA test scores as admissions criteria—the same test scores we used to define the low-achieving students for this study—and therefore, low-achieving students would be less likely to be competitive for these schools. However, we note that the criteria vary within the group of academically selective schools, and low-achieving students may still be admitted to some schools within this type.
19
Academic Performance
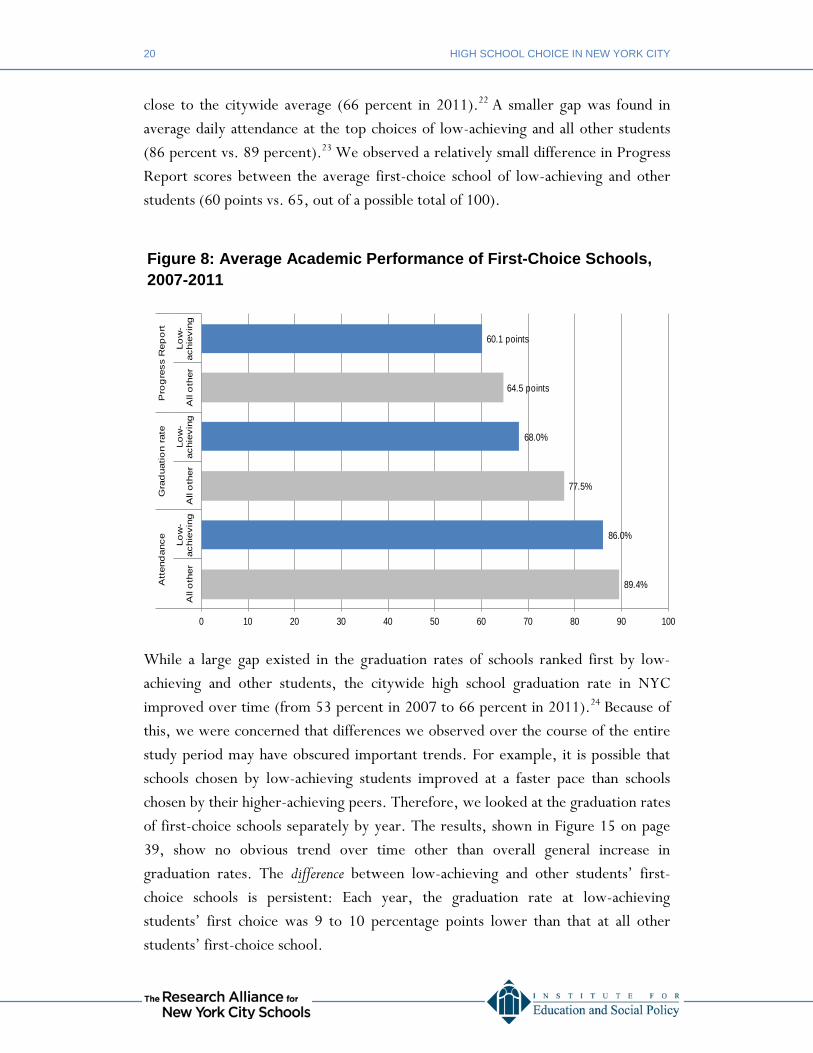
The academic performance of a school describes the collective performance of all students in the school. For potential students, this information may foreshadow how they and their peers will fare in that particular school environment. Figure 8 on the next page displays several measures of academic performance for the first-choice high schools of low-achieving and all other students. These include overall scores on the Progress Report (the NYC DOE’s most prominent indicator of school quality), four-year graduation rates, and attendance rates. On average, we found low-achieving students’ first-choice schools fared worse by each of these measures than did the first choices of their higher-achieving peers. In other words, low-achieving students tended to select schools performing at or below the citywide average, while their higher-achieving peers were more likely to choose schools performing above average.
The largest gap in performance between the first choices of low-achieving and other students was in graduation rates. 21 Four-year graduation rates were lower, on average, in schools ranked first by low-achieving students than in those chosen by their higher-achieving peers (68 percent vs. 78 percent). The former, however, was
Figure 7: First-Choice Programs by Admissions Method, 2007-2011
Source: Authors’ calculations using data provided by the DOE.
Academically Selective
29%
Non-selective
35%
Mixed 36%
Low-Achieving Students
Academically Selective
56% Non-selective
26%
Mixed 18%
All Other Students
20 HIGH SCHOOL CHOICE IN NEW YORK CITY
close to the citywide average (66 percent in 2011).22 A smaller gap was found in average daily attendance at the top choices of low-achieving and all other students (86 percent vs. 89 percent).23 We observed a relatively small difference in Progress Report scores between the average first-choice school of low-achieving and other students (60 points vs. 65, out of a possible total of 100).
While a large gap existed in the graduation rates of schools ranked first by low-achieving and other students, the citywide high school graduation rate in NYC improved over time (from 53 percent in 2007 to 66 percent in 2011).24 Because of this, we were concerned that differences we observed over the course of the entire study period may have obscured important trends. For example, it is possible that schools chosen by low-achieving students improved at a faster pace than schools chosen by their higher-achieving peers. Therefore, we looked at the graduation rates of first-choice schools separately by year. The results, shown in Figure 15 on page 39, show no obvious trend over time other than overall general increase in graduation rates. The difference between low-achieving and other students’ first-choice schools is persistent: Each year, the graduation rate at low-achieving students’ first choice was 9 to 10 percentage points lower than that at all other students’ first-choice school.
Figure 8: Average Academic Performance of First-Choice Schools, 2007-2011
89.4%
86.0%
77.5%
68.0%
64.5 points
60.1 points
0 10 20 30 40 50 60 70 80 90 100
All
oth
erLo
w-
achi
evin
gA
ll o
ther
Low
-ac
hiev
ing
All
oth
erLo
w-
achi
evin
g
Att
end
ance
Gra
dua
tion
rate
Pro
gre
ss R
epo
rt

21
Figure 8 showed a modest difference in the average Progress Report scores of low-achieving and all other students’ first-choice schools. However, in this case, looking at the average masks significant differences in the likelihood of ranking first schools with high or low letter grades. As seen in Figure 9 below, low-achieving students were much less likely to rank an “A” school as their first choice than their higher-achieving peers. During this period, 29 percent of the low-achieving population ranked an “A” school first, as compared to 39 percent of all other students. They were more likely to rank a “C” or “D” school first than other students, with 27 percent of low-achieving students listing a “C” or “D” school first (vs. 15 percent of all other students).
The above differences in academic performance between low-achieving and other students’ first-choice schools may simply reflect their differential propensity to rank selective schools first, as was shown in Figure 7. This is certainly an important part of the story: For both low-achieving and other students, first-choice schools that were academically selective (i.e., used a screened or audition admissions method) tended to have better graduation and attendance rates than first-choice schools that were non- or partially-selective. First-choice limited unscreened and educational option schools tended to fare comparably worse by these measures. (Progress Report results, on the other hand, tended to be better in first-choice limited
Figure 9: Progress Report Grades of First-Choice Schools, 2007-2011
28.8%
41.2%
21.3%
5.2% 3.4%
39.3% 44.9%
12.2%
2.3% 1.3% 0%
10%
20%
30%
40%
50%
60%
70%
80%
90%
100%
A B C D F
Low-achieving students' 1st choice All other students' 1st choice
22 HIGH SCHOOL CHOICE IN NEW YORK CITY
unscreened schools). Thus, a tendency for higher-achieving students to rank more selective schools first can produce the results shown in Figure 8 and 9.
Preferences for selective schools are not the whole explanation, however. In a separate analysis shown in Appendix B (Figures B-2 to B-9), we compared the performance of low-achieving and all other students’ first-choice schools with the same admissions method. These figures show that among first choices with the same admissions method, low-achieving students tended to choose schools with lower four-year graduation rates, Progress Report results, and attendance rates. Put another way, among students who ranked screened schools first (or educational option, or limited unscreened), low-achieving students tended to choose schools that fared worse on each academic performance measure.
Peer Composition and School Context
The composition of first-choice schools is important for at least two reasons. First, the student composition of incoming 9th graders determines the peer group that a rising 9th grader is choosing and will experience if matched to their first choice. Second, racially or economically isolated schools, and schools with high proportions of students with special needs, are likely to face resource, staffing, and other challenges that schools with lower concentrations of need may not.25
Figures 10-12 describe the student population of schools ranked first by low-achieving and all other students, including the average proficiency of incoming 9th graders in ELA and mathematics, the concentration of low-income students and students with unique educational needs (English Language Learners and special education), and the racial and ethnic composition of the school. We also examine the average size of the school that low-achieving and other students ranked first.
It is important to point out that many of the differences observed here reflect the spatial distribution of low-achieving students across the City, and the characteristics of proximate schools. If students live in racially, linguistically, or economically isolated neighborhoods and tend to choose schools close to home, they will be more likely to experience schools with these characteristics. On the other hand, high school choice in New York City avails students of the opportunity to choose schools outside their neighborhood if they so desire. Our results reflect the characteristics of schools that low-achieving and other students choose in practice.

23
To begin, Figure 10 below shows how the average proficiency of incoming 9th graders compared at the first-choice schools of low-achieving and all other students in the year in which students applied to high school. This measure, which was not available until 2008, is used by the NYC DOE to assign schools to peer groups on the high school Progress Report, and ranges from 1 to 4.5. Rather than just reporting the average of students’ first choices, in this figure we show the entire distribution of proficiency rates at first-choice schools. That is, Figure 10 shows the proportion of low-achieving and other students’ first choices with a given average proficiency level in ELA and math.
Proficiency levels at the first choices of low-achieving students were, on average, lower than those at the first-choice schools of other students. (Keep in mind that these proficiency levels characterize the schools chosen, and are not just a reflection of the students themselves. The choosing students are not included in the proficiency measure.) We found that low-achieving students’ first-choice schools
Figure 10: Average 8th Grade Proficiency in ELA and Math of Incoming 9th Graders at First-Choice High Schools, 2008-2011
Note: Average proficiency levels are based on 8th grade ELA and mathematics scores for incoming freshmen, and range from 1 to 4.5. This measure was not available for the 2007 cohort. These proficiency averages reflect the year in which students applied to high schools, and thus do not reflect the students in the sample. In other words, they capture the school as it looked to the student when he or she applied.
24 HIGH SCHOOL CHOICE IN NEW YORK CITY
had an average incoming proficiency level of 2.795, as compared with 3.060 for all other students, a relatively large difference of 0.27. Figure 10 makes clear why these averages differ: Low-achieving students were less likely to rank first schools with high average levels of incoming student achievement, and were more likely to choose schools with lower levels of prior achievement.
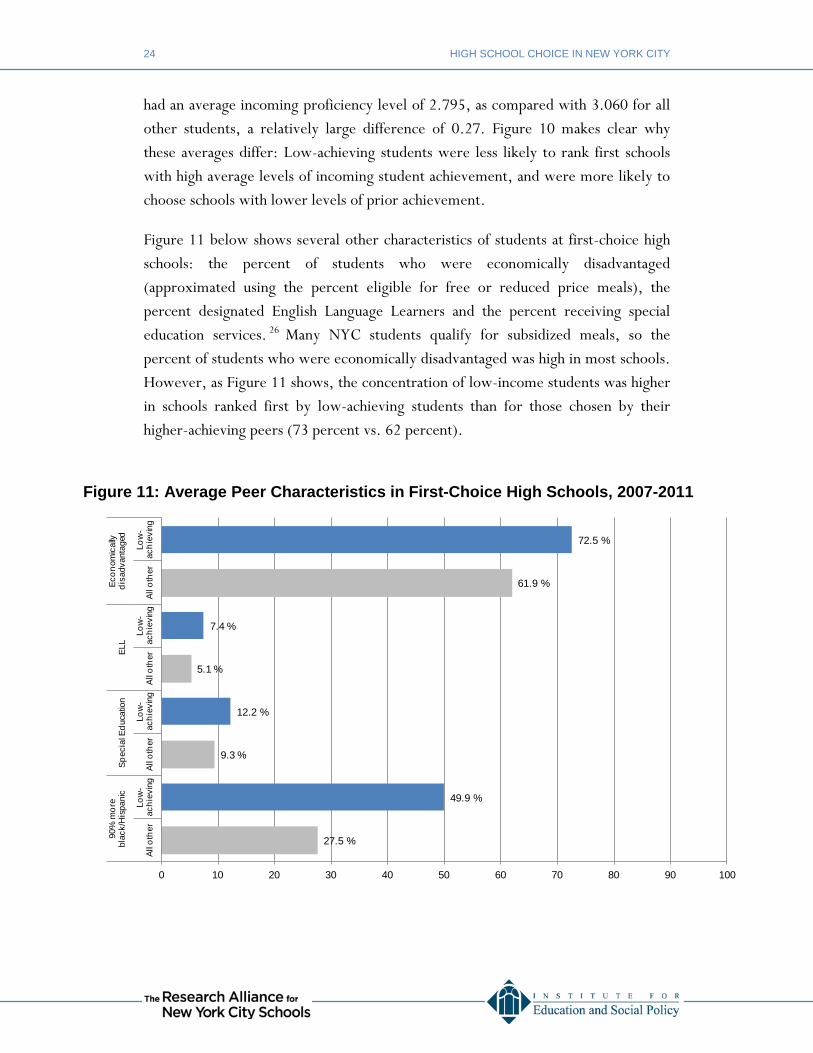
Figure 11 below shows several other characteristics of students at first-choice high schools: the percent of students who were economically disadvantaged (approximated using the percent eligible for free or reduced price meals), the percent designated English Language Learners and the percent receiving special education services. 26 Many NYC students qualify for subsidized meals, so the percent of students who were economically disadvantaged was high in most schools. However, as Figure 11 shows, the concentration of low-income students was higher in schools ranked first by low-achieving students than for those chosen by their higher-achieving peers (73 percent vs. 62 percent).
Figure 11: Average Peer Characteristics in First-Choice High Schools, 2007-2011
27.5 %
49.9 %
9.3 %
12.2 %
5.1 %
7.4 %
61.9 %
72.5 %
0 10 20 30 40 50 60 70 80 90 100
All o
ther
Low
-ac
hiev
ing
All o
ther
Low
-ac
hiev
ing
All o
ther
Low
-ac
hiev
ing
All o
ther
Low
-ac
hiev
ing
90%
mor
e bl
ack/
His
pani
cSp
ecia
l Edu
catio
nEL
LEc
onom
ical
ly
disa
dvan
tage
d

25
The percentage of students designated as ELL was also somewhat higher, on average, in the first-choice school of low-achieving students (7 percent) than in the first-choice school of all other students (5 percent). The former was relatively close to the median for all schools citywide in 2011 (8 percent). The share of students receiving special education services was roughly 3 points higher at the average school ranked first by low-achieving students (12 percent) than at the average first choice of their higher-achieving peers (9 percent). Again, the former was relatively close to the citywide average during this period (12 percent).
Next, Figure 12 below shows the average racial/ethnic composition of first-choice schools using four categories: black, Hispanic, Asian, and white. There is, of course, considerable heterogeneity within each of these categories with respect to socioeconomic background, nativity and country of origin, as well as academic achievement. We merely use these categories to describe the extent of racial and ethnic diversity in schools preferred by low-achieving and other students.
New York City high schools in general have high shares of black and Hispanic students relative to Asian and white students, as is clear from Figure 12. The first-choice school of low-achieving students, however, had a higher average concentration of black and Hispanic students, and fewer white and Asian students, than those ranked first by their higher-achieving peers. For low-achieving students, the average first-choice school was 35 percent black, 44 percent Hispanic, 10 percent Asian, and 10 percent white. For all other students, the average was 28
Figure 12: Racial/Ethnic Composition of First-Choice High Schools, 2007-2011
Black34.6
Black27.9
Hispanic43.6
Hispanic33.9
Asian10.3
Asian17.7
White10.2
White19.1
Other1.3
Other0.7
0% 10% 20% 30% 40% 50% 60% 70% 80% 90% 100%
Low
-ach
ievi
ngA
ll ot
her

26 HIGH SCHOOL CHOICE IN NEW YORK CITY
percent black, 34 percent Hispanic, 18 percent Asian, and 19 percent white. (These are averages across schools; the average first-choice school was not necessarily this internally diverse).
School averages for the percent black, Hispanic, Asian, and white fail to capture cases of significant racial/ethnic isolation, so we looked closer at schools with especially high shares of any one racial or ethnic group. In New York City, there are fortunately few instances of severe racial/ethnic isolation in high schools, which we defined as 90 percent or more of enrollment from one group. (In 2011, only 5 percent, or 23 of 449 high schools, met this condition). We did find low-achieving students were more likely to rank a severely racially isolated school first than other students, but the percent doing so in both groups was very small (3.6 percent and 2.2 percent, respectively).
On the other hand, schools in which 90 percent or more of enrollment is black or Hispanic are much more common. (In 2011, 61 percent, or 274 of 449 high schools, met this condition). There were stark differences between low-achieving and all other students in the propensity to rank first a school with 90 percent or more black and Hispanic students, as seen in Figure 11. Across all years of the study, 50 percent of low-achieving students ranked a school with this profile first, as compared with 28 percent of all other students.
Finally, we examined the percent of low-achieving and other students ranking a small high school as their top choice (defined as fewer than 500 students). School size has been a focal point of school reform efforts in New York City, as large high schools have closed and been replaced by smaller themed schools. To the extent that small schools help promote better outcomes—and there is evidence that some do—the choice of a small school may be beneficial.27
We found that low-achieving students were more likely to choose a small school as their first choice, with nearly one third (31 percent) doing so, versus 24 percent of all other students. The propensity to choose a small school steadily increased over the study period, for both groups. However the growth was more rapid for low-achieving students (from 23 percent in 2005 to 39 percent in 2011). It is difficult to discern the extent to which these results reflect increasing demand for small schools or rising supply (and loss of large schools). As the City closed large comprehensive high schools, it replaced them with small schools in the same locations. Many of the

27
large schools phased out during the study period were in neighborhoods that have a high proportion of low-achieving students.
Location and Distance from Home
Often, characteristics of students’ first-choice schools reflect their geographic preferences and constraints. It may be that low-achieving students tend to choose schools with greater concentrations of other low-achieving and disadvantaged students because they reside near schools with these characteristics. As we saw in Figure 6, the lowest-achieving students are heavily concentrated in the most disadvantaged boroughs and neighborhoods. Perhaps not surprisingly, their choices are often proximate to and reflective of these neighborhoods.
Figure 13: Geographic Distribution of the First-Choice Schools of Low-Achieving Students by Zip Code, 2011

28 HIGH SCHOOL CHOICE IN NEW YORK CITY
In Figure 13 on the previous page, we revisit the map first seen in Figure 6—this time to show the location of schools ranked first by low-achieving students. There are some similarities with Figure 6, and some notable differences. First, this group’s first-choice schools appear more geographically dispersed than the students’ homes. This is due in part to students taking the opportunity to attend schools in other neighborhoods, but also to the historic location of schools themselves. Second, neighborhoods with disproportionate shares of the low-achieving population, such as the North, Central, and South Bronx, receive a disproportionate share of first-choice school rankings from this group. Third, schools in neighborhoods proximate to those populated by many low-achieving students—Long Island City, Prospect Lefferts Gardens, and Jamaica Hills, for example—also receive more first-choice rankings. Finally, some neighborhoods, such as Clinton and Brooklyn Heights, appear to house “destination” schools that are not necessarily proximate to large numbers of low-achieving students but receive a large share of first choices.28
We used information on commuting time to delve more deeply into the association between students’ residential and first-choice school location. In theory, students may apply to any school citywide, and New York City’s public transportation system makes it feasible to access a large number of schools. In practice, however, these trips can be lengthy, and parents may not support their child making long trips to school on the bus or subway. (The NYC DOE also prohibits students from choosing schools more than one hour and 45 minutes from home, one way, although it is unclear how binding this rule is.) Nearby schools are also more familiar to families, and parents may view schools close to home as safer, or better for enforcing their child’s attendance.
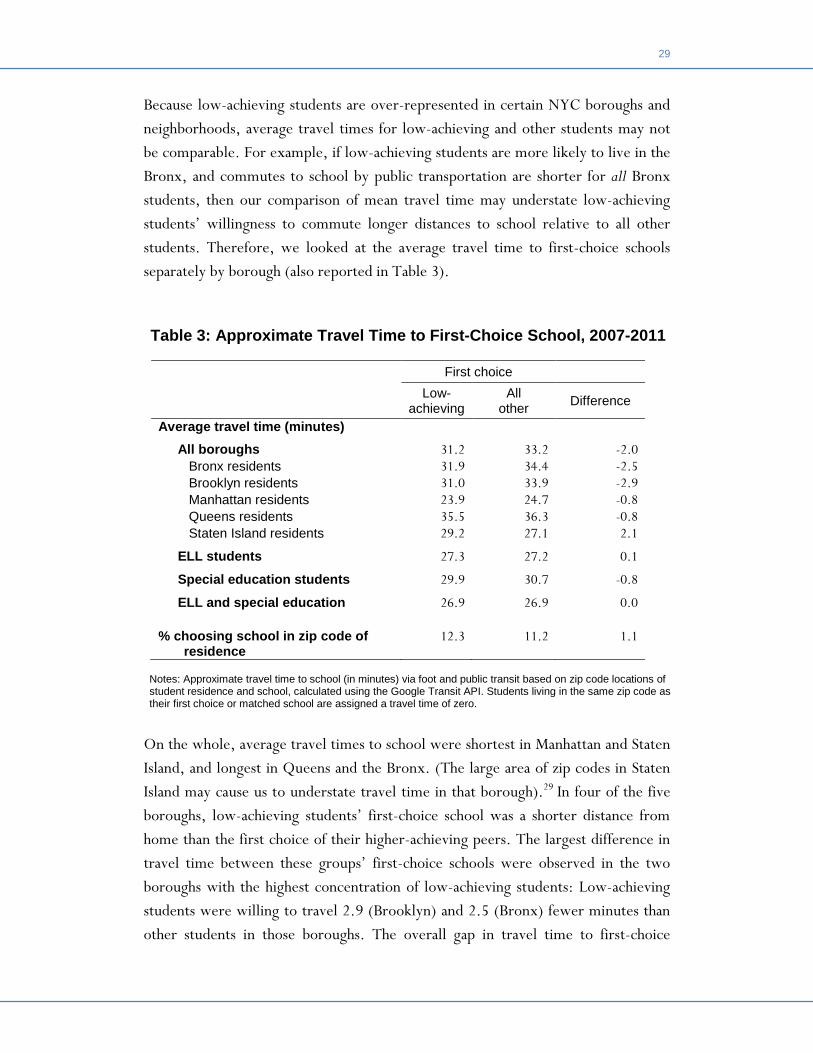
Table 3 on the next page shows average travel times to first-choice schools for low-achieving and all other students (and for several subgroups). We find low-achieving students’ first-choice schools were closer to home, on average, than the first choices of their higher-achieving peers. The difference in travel time was practically small—about two minutes each way—but consistent across years and subgroups. During the study period, low-achieving students expressed a willingness to travel an average of 31.2 minutes one way to their first-choice school (by foot and public transit). In contrast, all other students were willing to travel 33.2 minutes to their first-choice school.
29
Because low-achieving students are over-represented in certain NYC boroughs and neighborhoods, average travel times for low-achieving and other students may not be comparable. For example, if low-achieving students are more likely to live in the Bronx, and commutes to school by public transportation are shorter for all Bronx students, then our comparison of mean travel time may understate low-achieving students’ willingness to commute longer distances to school relative to all other students. Therefore, we looked at the average travel time to first-choice schools separately by borough (also reported in Table 3).
On the whole, average travel times to school were shortest in Manhattan and Staten Island, and longest in Queens and the Bronx. (The large area of zip codes in Staten Island may cause us to understate travel time in that borough).29 In four of the five boroughs, low-achieving students’ first-choice school was a shorter distance from home than the first choice of their higher-achieving peers. The largest difference in travel time between these groups’ first-choice schools were observed in the two boroughs with the highest concentration of low-achieving students: Low-achieving students were willing to travel 2.9 (Brooklyn) and 2.5 (Bronx) fewer minutes than other students in those boroughs. The overall gap in travel time to first-choice
Table 3: Approximate Travel Time to First-Choice School, 2007-2011
First choice Low-
achieving All
other Difference
Average travel time (minutes)
All boroughs 31.2 33.2 -2.0 Bronx residents 31.9 34.4 -2.5 Brooklyn residents 31.0 33.9 -2.9 Manhattan residents 23.9 24.7 -0.8 Queens residents 35.5 36.3 -0.8 Staten Island residents 29.2 27.1 2.1
ELL students 27.3 27.2 0.1
Special education students 29.9 30.7 -0.8
ELL and special education 26.9 26.9 0.0 % choosing school in zip code of
residence 12.3 11.2 1.1
Notes: Approximate travel time to school (in minutes) via foot and public transit based on zip code locations of student residence and school, calculated using the Google Transit API. Students living in the same zip code as their first choice or matched school are assigned a travel time of zero.
30 HIGH SCHOOL CHOICE IN NEW YORK CITY
school, therefore, does not appear to be driven by differences in borough of residence. When looking specifically at students with other risk factors, including ELLs and students receiving special education, we find that average travel time to the first-choice school is lower still (ranging from 27 to 30 minutes one-way). However, the difference in travel time between low-achieving and all other students for these subgroups is smaller. For example, both low-achieving ELLs and all other ELLs were willing to commute an average of 27 minutes to their first-choice school.
The comparisons in Table 3 have a number of limitations, the most important being our approximation of locations (see textbox below for information). We calculated travel time between the center point of a student’s residential zip code and the center point of their school’s zip code. Thus, students choosing a school in their same zip code were assigned a travel time of zero, which clearly understates their travel time. (Table 3 shows the percentage of each group choosing a school in the same zip code.) Our ongoing work with exact addresses will provide additional insights that this analysis cannot. Finally, our comparisons in Table 3 are based on averages, which are affected by subsets of students choosing schools a particularly long (or short) distance away. A more complete analysis will require a look at the entire distribution of travel times for these groups.
Despite these limitations, our analysis shows that, on average, low-achieving students choose schools that are a shorter trip from home, compared with those chosen by other students. While the difference in travel time is small, the findings are meaningful because they suggest that it may be unrealistic to expect low-achieving students to travel further than their high-achieving peers to attend a high-quality school.
How We Calculated Travel Times
We used information on the geographic coordinates of students’ zip code of residence and the zip code of their schools to calculate approximate travel times to these schools. More specifically, we used the center of the residential and school zip codes as start and end points. Thus, students choosing a school in the same zip code as their residence were assigned a travel time of zero. Travel time was found using the Google Transit application programming interface (API), which uses geographic information systems (GIS) data on New York City streets and current MTA bus and subway schedules to calculate commuting times. Trip durations include walking, waiting time (for example, transfers), and riding time on the bus and/or subway. For this report, we use only approximate travel times based on student and school zip codes, but in ongoing work we are using exact residential and school addresses to calculate more precise measures.
31
Summary of First-Choice Schools
Taken together, our look at the first-choice schools of low-achieving students found several notable patterns. First, low-achieving students were less likely to choose a school with a selective admissions method. Second, although low-achieving students’ first-choice schools performed close to the citywide average, these schools tended to be lower performing (in terms of Progress Report grades, graduation rates, and attendance rates) than their higher-achieving peers’ first choices. Third, low-achieving students’ first choices tended to have higher concentrations of other low-achieving students, poverty, English Language Learners, and students receiving special education services. These schools also tended to be less racially and ethnically diverse. Finally, average commuting times to first-choice schools suggest that some of the differences observed in first-choice schools are tied to geographic preferences and constraints, as low-achieving students appear to be no more willing to travel long distances to school than their higher-achieving peers.

32 HIGH SCHOOL CHOICE IN NEW YORK CITY
CHAPTER 4: HOW DO FIRST-CHOICE SCHOOLS
COMPARE WITH MATCHED SCHOOLS? In the last section, we profiled the first-choice high schools of New York City’s lowest-achieving students, contrasting these schools with the top choices of their higher-achieving peers. Of course, not all students receive their first choice. As noted in Table 2, about 53 percent of students in both groups were matched to their first choice during this period. Another 23 to 25 percent received their second or third choice, and the remainder were either matched to a lesser choice or matched in the supplemental round.
As described in our summary of the choice process in Chapter 1, a student’s final match depends on a number of factors, including the selectivity of their choices, schools’ geographic priorities and eligibility requirements, student demand, and capacity. Even the number of schools a student lists (between 1 and 12) can affect their outcome, as this can influence the likelihood they will be matched in the main—versus supplemental—round of school choice.30
In this chapter, we first consider whether students were more or less likely to be matched with their first-choice high school based on that school’s admissions method. We then look closely at how the schools that students were matched with compared to the schools they selected as their first choice—for low-achieving and all other students.
Match Rates by Admissions Method
As shown in Chapter 3, low-achieving students and their higher-achieving peers were matched to their first-choice school at similar rates. However, when we looked at first choice matches by admissions method, we found notable differences between low-achieving and other students (see Figure 14 on the next page). Perhaps not surprisingly, low-achieving students who ranked a selective school as their first choice—as almost a third of low-achieving students did—were much less likely to be matched to that choice than their higher-achieving peers. Of low-achieving students who ranked a selective program (that is, screened or audition) as their top choice, 21 to 23 percent were successfully matched there. This is roughly half the match rate of other students who ranked a selective program first (41 to 45 percent). This gap may be explained by the fact that many selective schools use state

33
test results as criteria for admission. Match rates were similar for low-achieving and all other students who ranked a non-selective program first, and low-achieving students who ranked an educational option program were more likely to receive their first choice than other students. Educational option programs reserve a fraction of seats (16 percent) for the lowest-performing students, and thus it is possible that seats in these programs were less competitive for our study population than for the larger pool of “all other” students.
Characteristics of First-Choice Versus Matched Schools
For each school characteristic examined in the previous chapter, we compared students’ average first-choice school with the school to which they were ultimately matched. The results are summarized in Table 4 on the next page. By most measures, the average matched school is lower-performing and more economically and academically disadvantaged than the average first-choice school. This reflects
Figure 14: Percent Matched to First Choice by Admissions Method, 2007-2011
22.7 20.7
62.1
69.1
80.9
71.1
45.2 40.8
56.4
68.8 66.9 71.5
0
10
20
30
40
50
60
70
80
90
Screened Audition Educational option
Limited unscreened
Unscreened Zoned
Perc
ent r
ecei
ving
firs
t cho
ice
Admissions method of first-choice school
Low-achieving All other
Source: Authors’ calculations using data provided by the NYC DOE.

34 HIGH SCHOOL CHOICE IN NEW YORK CITY
the fact that most students tend to rank “better”—and often more selective—schools as their top choice, and not all get their first choice. To the extent that first-choice schools are more likely to be over-subscribed or more selective, applicants have a smaller chance of being matched there (or to be ranked by the school at all in the case of selective schools).
Table 4 shows that the gaps between first choice and matched schools were largely similar for low-achieving and all other students. Put another way, both low-achieving students and their higher-achieving peers were, on average, assigned to a school that was lower-performing and more disadvantaged than the one they ranked first. And the difference between first choice and matched school was roughly the same for both groups. The implication is that the schools low-achieving and other students attend differ in ways that are reflected in their initial expressed preferences—rather than having more or less “success” in the match process.
Table 4: Comparison of First-Choice and Matched Schools, 2007-2011
Low-achieving All other City Average First choice Matched First choice Matched
Academic performance
Progress Report score (out of 100 points) 60.1 56.4 64.5 60.8 62.5
Four-year graduation rate 68.0 62.5 77.5 71.8 67.9 Average daily attendance 86.0 83.9 89.4 87.3 85.8
Peer composition and context
Average 8th grade proficiency (based on 4 levels) 2.80 2.69 3.06 2.94 2.76
Economically disadvantaged 72.5 74.6 61.9 66.3 66.5 ELL 7.4 8.5 5.1 6.5 7.5 Special education 12.2 13.4 9.3 10.5 12.0 Black 34.6 38.1 27.9 31.2 39.6 Hispanic 43.6 44.1 33.9 36.2 42.8 Asian 10.3 8.8 17.7 16.7 8.2 White 10.2 7.8 19.1 14.6 7.9 At least 90% Black and
Hispanic 49.9 57.1 27.5 35.5 61.0 Small school (<500) 31.0 34.7 24.0 25.9 61.0 Large school (>2000) 33.2 34.8 33.9 43.6 10.1
Notes: All numbers are percentages unless otherwise noted. “Economically disadvantaged” includes students eligible for free or reduced-price meals, and those attending universal free meals schools.

35
Importantly, many of the differences we observe in this report appear to be driven more by the high aspirations of higher-achieving students than by a preference for unusually low-performing schools on the part of low-achieving students. The last column of Table 4 reports the average of these characteristics across all schools citywide during this period. Often, the typical first-choice school of low-achieving students performed no worse (and no better) than the average high school citywide. For example, the average first choice high school of low-achieving students had a four-year graduation rate of 68 percent, nearly 10 percentage points below that of
How Do Students’ Top Three Choices Differ From Their First Choice?
Throughout this report we have focused on students’ first-choice schools. We emphasized first-choice schools in part because many students—just over half—were ultimately matched there. These schools also represent students’ most desired placement and thus deserve special attention.*
Students may, however, designate a particularly selective and/or popular school as a “long shot” first choice and rank more “realistic” options as their second and third choice schools. This is certainly consistent with the patterns observed in Table 4, which compared first-choice schools with matched schools. If this pattern holds true, then our focus on first choices may lead us to exaggerate differences in the schools preferred by low-achieving and all other students.
We repeated all analyses presented in Chapters 4 and 5, but in place of students’ first choice, we examined the average characteristics of their top three choices. In many cases, we found the gap in characteristics of top choice schools narrowed between low-achieving and all other students. For example, while the gap in graduation rates between first-choice schools of low-achieving and all other students was 9.5 points, the gap narrowed to almost zero (0.4 points) when comparing averages of the top three choices. Similarly, the gap in Progress Report scores narrowed from 4.4 points to 1.7, and the gap in incoming class proficiency narrowed from 0.27 to 0.02 points. Other differences were relatively unchanged. For example, the differences in racial composition and the percent economically disadvantaged, English Language Learners (ELL), and receiving special education services were approximately the same.
The comparability of top three schools is notable and instructive, and suggests that many of the findings in this report are driven by differences in first-choice schools. But given the high proportion of students who do receive their first choice, and the unequal likelihood of admission into selective schools, these differences are practically important.
* The matching algorithm in NYC is designed to promote a truthful ranking of schools, and precludes the need for strategic behavior on the part of students (e.g., when a student prefers school A to school B, but ranks B first on the belief that if they do not rank it first, they will lose the opportunity to be admitted there if not admitted to A. This would be true if the system awarded seats in priority order of students’ rankings). See Abdulkadiroglu, Pathak, and Roth (2005).
36 HIGH SCHOOL CHOICE IN NEW YORK CITY
the first choice of their higher-achieving peers. But this graduation rate of 68 percent was also equal to the City average across schools. However, because matched schools were lower performing than first-choice schools, on average, lower-achieving students’ matched schools tended to be below NYC averages on all three of the measures we looked at.
Summary of First-Choice Versus Matched Schools
Overall, low-performing students were matched to their first choice at similar rates as their higher-achieving peers. However, these match rates differed by admissions method. Specifically, low-achieving students were less likely than their higher-achieving peers to be accepted to their first-choice school when it was a selective program (for example, screened or audition), but more likely to be accepted to their first choice when it was a mixed (that is, education option) school.
For all students, matched schools were, on average, lower performing than their first-choice school. The gap between first choice and matched schools, however, was about the same size for low-achieving and other students, and appeared to be driven primarily by higher-achieving students making more ambitious first choices. The schools low-achieving students ranked first were comparable on many dimensions to the average school citywide, but because students tended to be matched to schools that performed worse than their first choice, the schools low-achieving students actually attended were below NYC averages.

37
CHAPTER 5: DID STUDENTS’ CHOICES AND
PLACEMENTS CHANGE OVER TIME? In our analysis of the school choices and placements of low-achieving and all other students, we combined data over five years of high school assignment (2007 to 2011). We were also interested, however, in how these choices and placements may have changed over time, and how any gaps observed between low-achieving and other students’ schools may have evolved.
Both groups were more likely to be matched to their first choice or top three choices in 2011 than in 2007. The likelihood of a successful match improved more for low-achieving than for other students, with the percent receiving their first choice rising from 45 to 55 percent (as compared with an increase from 46 to 53 percent for all other students). Both groups became less likely over time to choose an educational option program as their first choice and became more likely to rank a limited unscreened or screened school first. (Preferences for limited unscreened schools increased more for low-achieving students than for all other students, while preferences for screened schools increased more for all other students.) In addition, the propensity to choose a small school (with fewer than 500 students) rose sharply over time for low-achieving students, more so than for their higher-achieving peers. As noted earlier, these patterns reflect both demand and supply-side factors, with school closures and an increased availability of small limited unscreened schools playing an important role in first choices.
With respect to academics, the overall performance of high schools in New York City improved over time. As shown in Figure 15 on page 39, graduation rates improved in schools ranked first and in schools actually attended, by both low-achieving and all other students. Thus, by this measure, low-achieving students appear to be attending higher-quality schools in 2011 than in years past. At the same time, the difference in graduation rates at first-choice schools remained unchanged, indicating there was little convergence in the graduation rates of schools ranked first by low-achieving and other students. A similar trend is observed for Progress Report scores. Between 2007 and 2011, the average Progress Report score rose for both groups’ first-choice school, reflecting an increase in scores citywide. The propensity to rank an “A” school first rose for both groups, but in this case we found a larger increase among higher-achieving students. For these students, the
38 HIGH SCHOOL CHOICE IN NEW YORK CITY
percentage ranking an “A” school first rose 27 points, versus 19 points for low-achieving students. Positive trends in attendance and the proficiency of incoming students were also similar for the groups’ first choice and matched schools, although attendance rates at low-achieving students’ schools improved a bit more.
With respect to travel time, we saw no obvious trends in the distance traveled to first choice or matched schools. The difference in travel time to the preferred and matched schools of low-achieving and all other students increased modestly, but the gaps remained small (1.7 to 2.0 minutes for the first choice, and 1.0 to 1.4 minutes for the matched school).
Taken together, these findings show the academic profile of first-choice and matched schools improving over time, for both low-achieving and all other students. This is reflected in rising graduation rates, Progress Report scores, attendance rates, and average proficiency among incoming students. This is good news not only for low-achieving students, but for students citywide. Despite these broad improvements, however, differences persisted between the schools low-achieving students chose and attended and those of all other students.

39
Figure 15: Four-Year Graduation Rates at First Choice and Matched Schools, by Year, 2007-2011 Low-achieving students
All other students
58.6% 65.6%
69.8% 72.4% 73.6%
52.7%
60.4% 64.0%
67.3% 67.5%
0%
10%
20%
30%
40%
50%
60%
70%
80%
90%
100%
2007 2008 2009 2010 2011
1st Choice Matched
69.3% 74.8%
78.6% 81.7% 83.4%
63.1% 69.6%
73.3% 76.3% 77.1%
0%
10%
20%
30%
40%
50%
60%
70%
80%
90%
100%
2007 2008 2009 2010 2011
1st Choice Matched
40 HIGH SCHOOL CHOICE IN NEW YORK CITY
CHAPTER 6: SUMMARY AND DISCUSSION School choice aims to improve public education by enabling families to choose, from a portfolio of options, a school that best serves their child. In contrast with residence-based school assignment, in a system of universal choice a child’s education need not depend on the quality of his or her neighborhood school. In theory, choice provides an opportunity for all students to seek out and attend a high-quality school that fits their specific interests and needs. Over the long run, the hope is that choice will promote systemic improvement, as high-quality schools flourish and expand, and those that fail to perform or attract student find ways to improve, or are forced to close.
In New York City, the Department of Education has made choice a central part of its high school reform effort. These reforms have included improvements on both the demand and the supply side of the system. On the demand side, the district’s choice program allows students to apply to almost any high school citywide, with few limitations. Students have an extensive array of school options, and NYC’s high school directory and Progress Report provide rich information about the quality of these choices. On the supply side, the district has closed many large under-performing schools and brought new school options to many of the neighborhoods that needed them most.
In practice, the potential for choice to increase student performance and narrow achievement gaps depends on the selections that students and their families actually make and the supply of available schools. This report provided an initial look at the choices and placements of New York City’s lowest-achieving students. We found systematic, and sometimes large, differences in the academic and demographic profiles of schools attended by low-achieving and all other students. Differences in initial choices seem to drive these gaps, not placement rates, as low-achieving students are no less likely to receive one of their top choices than other students. Rather, low-achieving students tended to choose schools that were less selective, lower-performing, and more disadvantaged than their higher-achieving peers. These gaps also reflect students’ tendency to choose schools close to home. Low-achieving students are heavily concentrated in the most disadvantaged neighborhoods of the City, and their choices are shaped by this reality.

41
This report is not an evaluation of the high school choice process in New York City, and it cannot tell us whether low-achieving students are faring better or worse in high school choice than they did in years past. At this point, we also have little to say about why students chose the schools they did, or whether the schools they chose were the “right” ones for them, or not. These topics will be explored in future Research Alliance and Institute for Education and Social Policy studies.
The findings from the current study raise at least two critical questions for policymakers, educators and researchers to consider regarding the choice process and, specifically, the choices of low-achieving students:
1. Can school choice policies address the concentration of low-achieving students in disadvantaged communities? School choice policies provide an avenue for students to enroll in schools citywide, but in practice, students are constrained by familiarity with a school and their willingness to travel. All students appear to prefer higher-performing schools and schools that are close to home (students traveled an average of a half hour to high school in our study). However, low-achieving students tend to live in disadvantaged communities, where need is concentrated and the supply of high-performing schools is low. The good news is that the supply of schools across the City appears to be improving—for example, average graduation rates in first-choice schools increased by 15 percentage points from 2007 to 2011. Yet, we need to learn more about the distribution of higher-performing schools, particularly the extent to which they are available in the communities where many of NYC’s low-achieving students live. Likewise, additional research is needed about strategies to help low-achieving students get access to higher-performing schools outside of their communities.
It is worth noting that many high schools give admissions priority to students residing in the same borough or geographic school district. Such priorities make sense, as they ensure students have access to schools in their own neighborhood if they wish to attend them. At the same time, because of the concentration of low-achieving students in certain neighborhoods, this clustering may put them at a disadvantage when applying to schools citywide. These students may, for example, find it more difficult to be admitted to oversubscribed, high-quality schools with geographic priorities outside of their neighborhood or borough. This remains an unstudied issue worthy of attention.

42 HIGH SCHOOL CHOICE IN NEW YORK CITY
2. To what extent does NYC’s system of selective and non-selective high schools isolate lower-achieving students? Our analysis finds that low-achieving students are less likely to rank selective high schools as their top choice, and those who do (nearly a third) are less likely to be admitted. Choice offers students the opportunity to attend a school that best meets their needs, and very rigorous programs may not be the best match for lower-achieving students, who may be unprepared for such coursework. At the same time, the system has the potential to persistently stratify low- and high-achieving students into different schools—stratification that is driven by both geographic and performance-based admission criteria. Greater attention should be paid to the geographic distribution of selective and non-selective schools, as well as the way admissions methods shape choices and the allocation of students across schools. Expanding access to academically mixed educational option schools may also help to reduce the isolation of lower-achieving students in certain schools.
New York City’s lowest-achieving students are, on average, attending higher-quality high schools than in years past, and graduating in higher numbers. Whether or not these gains are attributable to NYC’s policy of universal high school choice, however, is an open—and difficult—question. The Department of Education has made great strides in streamlining the choice process, providing students and their families with more information about their options, and making school assignments fairer and more transparent. At the same time, there are limitations to what choice alone can accomplish. As evident in this report, students face constraints that shape the set of schools they can and do consider. Any improvements seen here may be driven at least as much by changes in supply—new schools that the district has brought to the neighborhoods that need them most—as by changes in demand.
Given the over-representation of low-achieving students in the poorest sections of the City, it is critical that the district maintain its efforts to bring targeted improvement to these communities, rather than rely too heavily on universal choice as an “escape hatch.” Helping low-achieving students and their families become fully informed about their options should remain a high priority. While we are unable to assess the extent to which information gaps contributed to differences in school choices, it is plausible that low-achieving students lacked awareness of their full menu of options, had fewer resources supporting their decision, or underestimated their likelihood of admission at certain schools. The DOE should ensure sufficient resources are available to help students with their choices. This includes an adequate
43
number of knowledgeable guidance counselors with the time to devote to students needing the most support. Middle schools serving low-achieving youth may require additional staff to help make case loads manageable.
Finally, the decline over time in the number of academically mixed, educational option high schools is notable. Our results suggest considerable segregation of students by academic ability into selective and non-selective programs. The district should take steps to ensure low-achieving students are not persistently concentrated in environments with little exposure to higher-achieving students. Promoting more high-quality educational option programs may be one way to accomplish this.
44 HIGH SCHOOL CHOICE IN NEW YORK CITY
Notes 1 See, for example, Abdulkadiroglu et al. (2009), Deming et al. (2009), and Hoxby and Murarka (2009).
2 See, for example, Bifulco and Ladd (2006), Cullen, Jacob, and Levitt (2005, 2006), Deming et al. (2009), Lai (2007), and Lauen (2009).
3 See, for example, Bifulco and Ladd (2007), Bifulco, Ladd, and Ross (2009), and Elacqua, Schneider, and Buckley (2006).
4 Kemple (2013). 5 Hastings, Kane, and Staiger (2009). 6 Among other things, the directory includes information about the school’s location, eligibility requirements, ELL and special education services, graduation rate, course offerings, and theme.
7The application process is required: No student is permitted to attend a “default” school and avoid an active choice, and few are guaranteed admission to their first-choice school. One exception to this rule is students with severe disabilities, who are typically exempt from the choice process. Additionally, in a small number of combined middle-high schools, students have the option of remaining in their current school and opting out of the choice process.
8 Charter high schools remained relatively rare during this period, although a number have opened in the past few years.
9See Hemphill and Nauer (2009); Quint et al. (2010); Schwartz, Stiefel, and Wiswall (2012); Stiefel, et al. (2012).
10 The population of students used to construct this figure includes all 8th graders who participated in the choice process and were matched to a school. Those who opted out at some stage were excluded. Students offered and who accepted a seat in a specialized high school are counted among the first choices, as are those who declined an offer to a specialized high school and were matched to their first choice non-specialized high school.
11 A small fraction of those matched in the supplemental round did not participate in the main round. Excluding this group, 10.1 percent of students who participated in the main round did not receive a match, submitted choices in the supplemental round, and received a match in the supplemental round.
12 Low achievement is defined relative to entire population of 8th graders, not only those who completed the choice process and enrolled in a public high school.
13 To some degree, this growth reflects inflation, test score gains occurring for reasons other than real learning, such as increasing familiarity with the test. For an excellent discussion, see Koretz (2008).
14 These cut points roughly correspond to the actual performance categories observed in 2006. In that year, Level 3 (i.e., proficiency) was obtained at roughly the 50th percentile in ELA and the 59th percentile in mathematics. Level 2 was obtained at approximately the 17th percentile in ELA and 27th percentile in math.
15 “All other students” included students who participated in choice and did not “opt out.” Students who attended NYC public schools in 9th grade during the study period but were admitted through other methods were not included in our analyses.
16 N = 314,653 which includes all students with 7th grade test scores and excludes students with severe disabilities who do not participate in the choice process.
17 These zip codes include, in the Bronx: Morrisania (10456) and High Bridge (10452), Morris Heights (10453) Mt. Hope/Claremont (10457), Bronx Park and Fordham (10467 and 10468). In Brooklyn: East New York and New Lots (11208 and 11207), Brownsville (11212), and Flatbush (11226).
18 For some evidence of this, see Hastings, Kane, and Staiger (2009) and Corcoran and Levin (2011).
19 The percentage of students matched in the supplemental round is lower in Table 2 than
45
in Figure 2 for several reasons. First, supplemental round matches were more frequent in 2011 (Figure 2) than for the combined 2007-2011 period (Table 2). Second, Figure 2 includes all students participating in high school choice while Table 2 includes only our baseline study population.
20 We observed that the average number of schools ranked declined over time, which probably reflects greater familiarity with the system.
21 For this analysis, we used graduation rates as reported on the high school Progress Report. It is important to note that graduation rates were not available for some of schools that were open for enrollment during this period (47 to 109 schools, depending on the year). Because these schools opened after 2007, they did not yet have graduating classes for which these calculations could be made.
22 This is an average of school-level graduation rates, not the City’s four-year graduation rate for all students.
23 We include attendance rates because they reflect the peer environment students experience at a school and the school’s ability to promote student engagement. Consistent attendance is critical to the learning environment—even for students with regular attendance, as schools with high absenteeism may be disruptive or slower to progress through the curriculum. As a reflection of its importance, the NYC DOE includes attendance rates as a component of the Progress Report.
24 New York City Department of Education (2011). “New York City Graduation Rates Class of 2011 (2007 Cohort).” http://schools.nyc.gov/NR/rdonlyres/6853B2BF-E509-44DD-84E0-CA70B819109B/0/2011GradDeck_Presentation061112.pdf
25 For some evidence on this, see Boyd et al. (2011) and Hanushek, Kain, and Rivkin (2004).
26 The percent of students eligible for free or reduced price meals is the most common measure of economic disadvantage in schools. This measure can be problematic in high school, where fewer students are likely to submit the eligibility forms required for the subsidy. It is usually the best available indicator of economic status, however, and is used for many official purposes. It is also a number publicly known to students and their families when choosing schools. Our measure includes students with documented eligibility as well as students in “universal free meals” schools, which are predominately poor and do not require the same level of individual documentation. Our assumption is that students enrolled in these schools would be eligible for free or reduced price meals, although this does not have to be the case.
27 Bloom et al. (2010). 28 For example, the Manhattan zip code 10019 (Chelsea and Clinton) in 2011 included the Food and Finance High School, the High School for Environmental Studies, and the Business of Sports School, which were popular first-choice schools among low-achieving students.
29 Students choosing a school in their same zip code are assigned a travel time of zero. Zip codes in Staten Island are geographically larger than in the rest of the City, and thus Staten Island students are more likely to choose a school in the same zip code. This will cause us to underestimate travel time in that borough. In ongoing work, we are using exact residence and school addresses to compute more accurate travel durations.
30 Corcoran and Levin (2011) found an association between the number of schools ranked and the likelihood of being matched in the main round, which suggests that listing more schools reduces one’s chance of being forced into the supplemental round.
46 HIGH SCHOOL CHOICE IN NEW YORK CITY
References
Abdulkadiroglu, A., Angrist, J., Cohodes, S. R., Dynarski, S., Fullteron, J., Kane, T. J., & Pathak, P. (2009). Informing the Debate: Comparing Boston's Charter, Pilot, and Traditional Schools. Boston: The Boston Foundation. Retrieved 3/2/12 from http://www.tbf.org/uploadedFiles/tbforg/Utility_Navigation/Multimedia_Library/Reports/InformingTheDebate_Final.pdf
Abdulkadiroglu, A., Pathak, P. A., & Roth, A. E. (2005). “The New York City High School Match.” American Economic Review, 95(2), 364-367.
Betts, J. R., & Loveless, T. (2005). Getting Choice Right: Ensuring Equity and Efficiency In Education Policy. Washington, D.C.: Brookings Institution Press.
Bifulco, R., & Ladd, H. F. (2006). “The Impacts of Charter Schools on Student Achievement: Evidence From North Carolina.” Education Finance and Policy, 1(1), 50-90.
Bifulco, R., & Ladd, H. F. (2007). “School Choice, Racial Segregation, and Test-Score Gaps: Evidence From North Carolina's Charter School Program.” Journal of Policy Analysis and Management, 26(1), 31-56.
Bifulco, R., Ladd, H. F., & Ross, S. L. (2009). “The Effects of Public School Choice on Those Left Behind: Evidence From Durham, North Carolina.” Peabody Journal of Education, 84(2), 130-149.
Bloom, H. S., Thompson, S. L., & Unterman, R. (2010). Transforming The High School Experience: How New York City's New Small Schools Are Boosting Student Achievement and Graduation Rates. New York: MDRC. Retrieved 5/24/11 from http://www.mdrc.org/publications/560/full.pdf
Boyd, D., Lankford, H., Loeb, S., Ronfeldt, M., & Wyckoff, J. (2011). “The Role of Teacher Quality in Retention and Hiring: Using Applications To Transfer To Uncover Preferences of Teachers and
Schools.” Journal of Policy Analysis and Management, 30(1), 88–110.
Corcoran, S. P., & Levin, H. M. (2011). “School Choice And Competition In The New York City Schools.” In J. A. O'Day, C. S. Bitter & L. M. Gomez (Eds.), Education Reform in New York City: Ambitious Change in the Nation's Most Complex School System (199-224). Cambridge, MA: Harvard Education Press.
Cullen, J. B., Jacob, B. A., & Levitt, S. (2005). “The Impact of School Choice on Student Outcomes: An Analysis of the Chicago Public Schools.” Journal of Public Economics, 89(5-6), 729-760.
Cullen, J. B., Jacob, B. A., & Levitt, S. (2006). “The Effect of School Choice on Participants: Evidence From Randomized Lotteries.” Econometrica, 74(5), 1191-1230.
Deming, D., Hastings, J., Kane, T., & Staiger, D. (2009). “School Choice and College Attendance: Evidence From Randomized Lotteries.” Unpublished manuscript. Retrieved 3/2/12 from http://aida.econ.yale.edu/~jh529/papers/DHKS_CollegeGoing_DraftSept09.pdf
Elacqua, G., Schneider, M., & Buckley, J. (2006). “School Choice in Chile: Is it Class or the Classroom?” Journal of Policy Analysis and Management, 25(3), 577-601.
Glazerman, S. M. (1998). “School Quality and Social Stratification: The Determinants And Consequences of Parental School Choice.” Paper presented at the Annual Meeting of the American Educational Research Association, April 13-17, 1998, San Diego, CA.
Hanushek, E. A., Kain, J. F., & Rivkin, S. G. (2004). “Why Public Schools Lose Teachers.” Journal of Human Resources, 39(2), 326–354.
47
Hastings, J. S., Kane, T. J., & Staiger, D. O. (2009). “Heterogeneous Preferences and the Efficacy of Public School Choice.” Unpublished manuscript. Retrieved 3/2/12 from http://www.econ.yale.edu/~jh529/papers/HKS_Combined_200806.pdf
Hemphill, C., & Nauer, K. (2009). The New Marketplace: How Small-School Reforms and School Choice Have Reshaped New York City's High Schools. New York: The Center for New York City Affairs at The New School. Retrieved 3/2/12 from http://www.newschool.edu/milano/nycaffairs/publications_schools_thenewmarketplace.aspx
Hoxby, C. M., & Murarka, S. (2009). “Charter Schools In New York City: Who Enrolls and How They Affect Their Students' Achievement.” Working Paper 14852. Cambridge, MA: National Bureau of Economic Research.
Kemple, J. (2013) The Conditions of New York City High Schools: Recent Trends and Looking Toward the Future. New York, NY: The Research Alliance for New York City Schools. http://media.ranycs.org/2013/004
Koretz, D. M. (2008). Measuring Up: What Educational Testing Really Tells Us. Cambridge, MA: Harvard University Press.
Lai, F. (2007). “The Effect of Winning a First-Choice School Entry Lottery on Student Performance: Using a Natural Experiment From the Middle School Reforms in Beijing.” New York: National Center for the Study of Privatization in Education at Teachers College, Columbia University. Retrieved 3/2/12 from: http://www.ncspe.org/publications_files/OP139.pdf
Lauen, D. L. (2009). “To Choose or Not To Choose: High School Choice and Graduation in Chicago.” Educational Evaluation and Policy Analysis, 31(3), 179-199.
New York City Department of Education (2011). “New York City Graduation Rates Class of 2011 (2007
Cohort).” http://schools.nyc.gov/NR/rdonlyres/6853B2BF-E509-44DD-84E0-CA70B819109B/0/2011GradDeck_Presentation061112.pdf
Quint, J. C., Smith, J. K., Unterman, R., & Moedano, A. E. (2010). New York City's Changing High School Landscape: High Schools And Their Characteristics 2002-2008. New York: MDRC. Retrieved 3/2/12 from http://www.mdrc.org/publications/543/full.pdf
Schneider, M., Teske, P., & Marschall, M. (2000). Choosing Schools: Consumer Choice And The Quality Of American Schools. Princeton, N.J.: Princeton University Press.
Sattin-Bajaj, A. (2011) “High School Admissions: Choice, but No Equity.” Retrieved 4/5/13 from http://www.schoolbook.org/2011/09/30/high-school-admissions-choice-but-no-equity
Schwartz, A.E., Stiefel, L., & Wiswall, M. (2012). “Do Small Schools Improve Performance In Large, Urban Districts? Causal Evidence From New York City.” Working Paper 01-12. New York: Institute for Education and Social Policy. Retrieved 3/2/12 from http://steinhardt.nyu.edu/scmsAdmin/media/users/spa2/Working_Paper__01-12.pdf
Stiefel, L., Wiswall, M., Schwartz, A.E., & Debraggio, E. (2012). “Does Small High School Reform Lift Urban Districts? Evidence From New York City.” Working Paper 04-12. New York: Institute for Education and Social Policy. Retrieved 6/20/12 from
http://steinhardt.nyu.edu/scmsAdmin/media/users/spa2/Schwartz_et_al_Vanderbilt_2012.pdf

The Research Alliance for
New York City Schools conducts
rigorous studies on topics that
matter to the city’s public schools.
We strive to advance equity and
excellence in education by
providing non-partisan evidence
about policies and practices that
promote students’ development
and academic success.
285 Mercer Street, 3rd Floor | New York, New York 10003-9502 212 992 7697 | 212 995 4910 fax [email protected] | www.steinhardt.nyu.edu/research_alliance
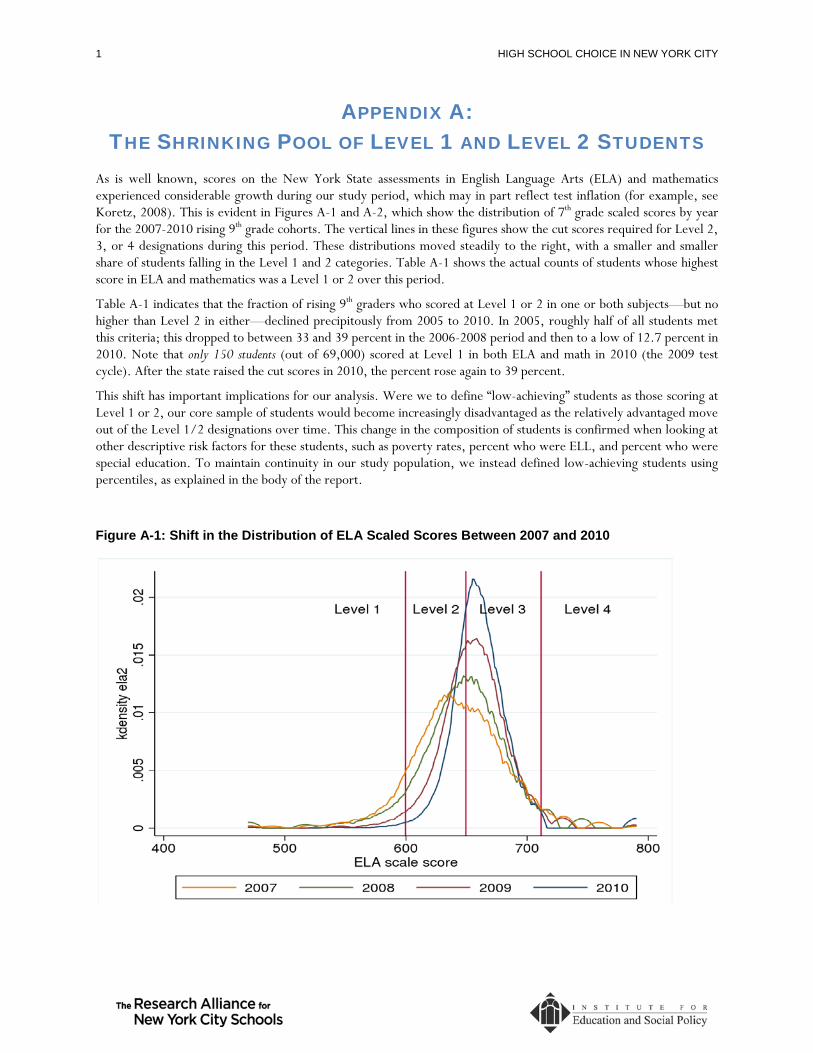
1 HIGH SCHOOL CHOICE IN NEW YORK CITY
APPENDIX A: THE SHRINKING POOL OF LEVEL 1 AND LEVEL 2 STUDENTS
As is well known, scores on the New York State assessments in English Language Arts (ELA) and mathematics experienced considerable growth during our study period, which may in part reflect test inflation (for example, see Koretz, 2008). This is evident in Figures A-1 and A-2, which show the distribution of 7th grade scaled scores by year for the 2007-2010 rising 9th grade cohorts. The vertical lines in these figures show the cut scores required for Level 2, 3, or 4 designations during this period. These distributions moved steadily to the right, with a smaller and smaller share of students falling in the Level 1 and 2 categories. Table A-1 shows the actual counts of students whose highest score in ELA and mathematics was a Level 1 or 2 over this period.
Table A-1 indicates that the fraction of rising 9th graders who scored at Level 1 or 2 in one or both subjects—but no higher than Level 2 in either—declined precipitously from 2005 to 2010. In 2005, roughly half of all students met this criteria; this dropped to between 33 and 39 percent in the 2006-2008 period and then to a low of 12.7 percent in 2010. Note that only 150 students (out of 69,000) scored at Level 1 in both ELA and math in 2010 (the 2009 test cycle). After the state raised the cut scores in 2010, the percent rose again to 39 percent.
This shift has important implications for our analysis. Were we to define “low-achieving” students as those scoring at Level 1 or 2, our core sample of students would become increasingly disadvantaged as the relatively advantaged move out of the Level 1/2 designations over time. This change in the composition of students is confirmed when looking at other descriptive risk factors for these students, such as poverty rates, percent who were ELL, and percent who were special education. To maintain continuity in our study population, we instead defined low-achieving students using percentiles, as explained in the body of the report.
Figure A-1: Shift in the Distribution of ELA Scaled Scores Between 2007 and 2010

2
Figure A-2: Shift in the Distribution of Math Scaled Scores Between 2007 and 2010
Table A-1: Counts of Students in Level 1 / Level 2 Combinations
ELA L1 and
math L1
ELA L1 and
math L2
ELA L2 and
math L1
ELA L2 and
math L2
Total students with L1 or L2
on one or both tests
Total 7th
grade cohort
Percent of 7th grade cohort with L1 or L2
score 2005 14,034 4,787 7,891 11,788 38,500 76,579 50
2006 8,259 2,736 7,580 11,282 29,857 76,581 39
2007 4,201 2,041 6,050 16,388 28,680 73,159 39
2008 2,737 2,070 2,780 16,182 23,769 71,502 33
2009 793 564 1,891 11,157 14,405 69,407 21
2010 142 209 866 6,600 7,817 66,948 12
2011 5,136 4,518 2,333 15,574 27,561 69,929 39
Total 35,302 16,925 29,391 88,971 170,589 504,105 34
Notes: Figures are based on 7th grade scaled scores. For example, the scores for students in the 2006 8th grade cohort are from the 7th grade test administration in Spring 2005. The total 7th grade cohort includes all students with at least one test score (math or ELA) reported. As described in Chapter 1, the analytic sample used in this report represents a subset of the full cohort.

3 HIGH SCHOOL CHOICE IN NEW YORK CITY
APPENDIX B: SUPPLEMENTAL TABLES AND FIGURES
Figure B-1: Geographic Distribution of Low-Achieving Students by Residential Zip Code: 2005, 2008, and 2011
Notes: Values represent the percent of low-achieving students as a proportion of all 9th grade students who resided in a given zip code. The low-achieving population included all students who scored below the 20th percentile in either ELA or math (or both), and no higher than the 50th percentile on either test.

4
We compared the performance of low-achieving and all other students’ first-choice schools with the same admissions method. Figures B-2 to B-9 show that among first choices with the same admissions method, low-achieving students tended to choose schools with lower four-year graduation rates, Progress Report results, and attendance rates. Put another way, among students who ranked screened schools first (or educational option, or limited unscreened), low-achieving students tended to choose schools that fared worse on each academic performance measure. Beccause there are so few zoned schools, we do not include them in the following set of figures.
Figure B-2: Average Academic Performance of First-Choice Screened Schools, 2007-2011
Note: From 2007-2011, a total of 16,858 low-achieving and 106,137 “other” students selected a screened program as their first choice.
92.2 %
88.7 %
85.2 %
74.6 %
67.7 points
62.6 points
0 10 20 30 40 50 60 70 80 90 100
All
othe
r lo
w-
achi
evin
g A
ll ot
her
low
- ac
hiev
ing
All
othe
r lo
w-
achi
evin
g
Atte
ndan
ce
Gra
duat
ion
rate
P
rogr
ess
repo
rt
Figure B-3: Average Academic Performance of First-Choice Audition Schools, 2007-2011
Note: From 2007-2011, a total of 4,931 low-achieving and 18,462 “other” students selected an audition program as their first choice.
90.5 %
89.3 %
82.5 %
78.6 %
67.4 points
66.5 points
0 10 20 30 40 50 60 70 80 90 100
All
othe
r lo
w-
achi
evin
g A
ll ot
her
low
- ac
hiev
ing
All
othe
r lo
w-
achi
evin
g
Atte
ndan
ce
Gra
duat
ion
rate
P
rogr
ess
repo
rt

5 HIGH SCHOOL CHOICE IN NEW YORK CITY
Figure B-4: Average Academic Performance of First-Choice Education Option Schools, 2007-2011
Note: From 2007-2011, a total of 27,720 low-achieving and 59,476 “other” students selected an education option program as their first choice.
85.6 %
83.8 %
67.9 %
63.6 %
57.0 points
54.8 points
0 10 20 30 40 50 60 70 80 90 100
All
othe
r lo
w-
achi
evin
g A
ll ot
her
low
- ac
hiev
ing
All
othe
r lo
w-
achi
evin
g
Atte
ndan
ce
Gra
duat
ion
rate
P
rogr
ess
repo
rt
Figure B-5: Average Academic Performance of First-Choice Limited Unscreened Schools, 2007-2011
Note: From 2007-2011, a total of 18,524 low-achieving and 39,912 “other” students selected a limited unscreened program as their first choice.
87.7 %
86.4 %
71.4 %
68.1 %
71.2 points
69.2 points
0 10 20 30 40 50 60 70 80 90 100
All
othe
r lo
w-
achi
evin
g A
ll ot
her
low
- ac
hiev
ing
All
othe
r lo
w-
achi
evin
g
Atte
ndan
ce
Gra
duat
ion
rate
P
rogr
ess
repo
rt

6
Figure B-6: Progress Report Grades of First-Choice Screened Schools, 2007-2011
Note: From 2007-2011, a total of 16,858 low-achieving and 106,137 “other” students selected a screened program as their first choice.
33.5%
40.1%
21.6%
3.4% 1.4%
47.4% 42.1%
9.3%
0.8% 0.3% 0%
10%
20%
30%
40%
50%
60%
70%
80%
90%
100%
A B C D F
Low-achieving All other
Figure B-7: Progress Report Grades of First-Choice Audition Schools, 2007-2011
Note: From 2007-2011, a total of 4,931 low-achieving and 18,462 “other” students selected an audition program as their first choice.
39.3%
50.1%
9.3%
0.9% 0.5%
42.5%
52.4%
4.6% 0.3% 0.2%
0%
10%
20%
30%
40%
50%
60%
70%
80%
90%
100%
A B C D F
Low-achieving All other
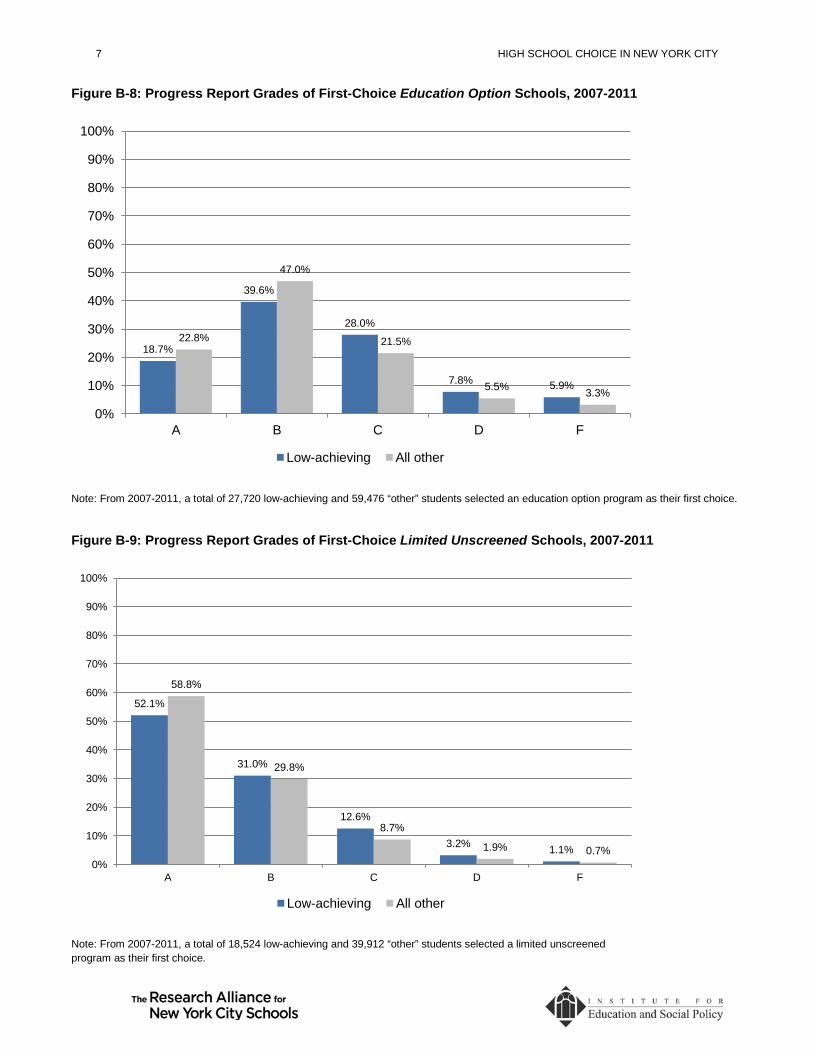
7 HIGH SCHOOL CHOICE IN NEW YORK CITY
Figure B-8: Progress Report Grades of First-Choice Education Option Schools, 2007-2011
Note: From 2007-2011, a total of 27,720 low-achieving and 59,476 “other” students selected an education option program as their first choice.
18.7%
39.6%
28.0%
7.8% 5.9%
22.8%
47.0%
21.5%
5.5% 3.3%
0%
10%
20%
30%
40%
50%
60%
70%
80%
90%
100%
A B C D F
Low-achieving All other
Figure B-9: Progress Report Grades of First-Choice Limited Unscreened Schools, 2007-2011
Note: From 2007-2011, a total of 18,524 low-achieving and 39,912 “other” students selected a limited unscreened program as their first choice.
52.1%
31.0%
12.6%
3.2% 1.1%
58.8%
29.8%
8.7%
1.9% 0.7% 0%
10%
20%
30%
40%
50%
60%
70%
80%
90%
100%
A B C D F
Low-achieving All other

8
Table B-1: Characteristics of First-Choice and Matched Schools for Low-Achieving ELL and Special Education Students
Low-Achieving ELL Low-Achieving Special Ed
First Choice Matched First Choice Matched
Academic performance
Progress Report score (out of 100 points)
61.9 58.4 59.4 56.3
Four-year graduation rate 68.4 63.4 66.8 62.4 Average daily attendance 86.6 84.6 85.6 84.0
Peer composition and context
Average 8th grade proficiency (based on 4 levels)
2.8 2.7 2.8 2.7
Economically disadvantaged 75.1 76.2 71.9 73.1 ELL 12.5 12.9 6.7 6.7 Special education 11.5 12.7 12.9 13.6 Black 25.8 28.5 34.6 37.1 Hispanic 51.8 52.3 43.2 42.8 Asian 11.7 10.4 10.1 9.5 White 9.7 7.9 10.8 9.3 Small school (<500) 31.8 34.1 29.2 32.8 Large school (>2000) 33.2 36.7 33.9 38.5
Note: All numbers are percentages unless otherwise noted. Economically disadvantaged includes students eligible for free or reduced price meals, and those attending universal free meals schools.
Appendix References
Koretz, D. M. (2008). Measuring Up: What Educational
Testing Really Tells Us. Cambridge, MA: Harvard University Press.