Embed Size (px)
Citation preview
HIGH RESOLUTION STACKING OF SEISMIC DATA
Marcos Ricardo Covre, Tiago Barros and Renato da Rocha Lopes
School of Electrical and Computer Engineering, University of CampinasDSPCom Laboratory, Department of Communications
13083-852 - Campinas-SP, Brazil
ABSTRACTThe stacking procedure is a key part of the seismic processing.Historically, this part of the processing is done using seismicacquisition data (traces) with common features such as thecommon midpoint between source and receiver. These tracesare combined to construct an ideal trace where the source andreceiver are virtually placed at the same place. The traditionalstacking only performs a simple sum of the traces. This workproposes a different way to perform the stacking, which usesthe singular value decomposition of a data matrix to create aneigenimage where the noise and interferences are attenuated.The proposed technique is called Eigenstacking. Results ofthe stacking and eigenstacking are compared using syntheticand real data.
Index Terms— SVD, stacking, high resolution, seismic
1. INTRODUCTION
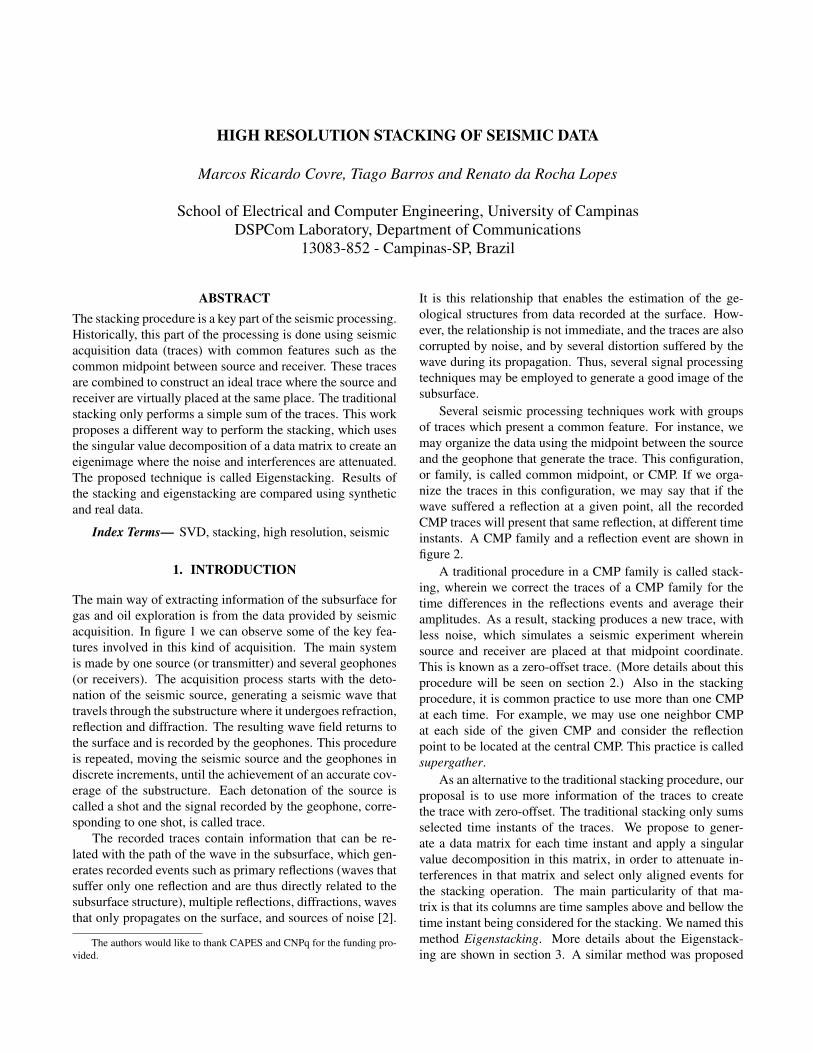
The main way of extracting information of the subsurface forgas and oil exploration is from the data provided by seismicacquisition. In figure 1 we can observe some of the key fea-tures involved in this kind of acquisition. The main systemis made by one source (or transmitter) and several geophones(or receivers). The acquisition process starts with the deto-nation of the seismic source, generating a seismic wave thattravels through the substructure where it undergoes refraction,reflection and diffraction. The resulting wave field returns tothe surface and is recorded by the geophones. This procedureis repeated, moving the seismic source and the geophones indiscrete increments, until the achievement of an accurate cov-erage of the substructure. Each detonation of the source iscalled a shot and the signal recorded by the geophone, corre-sponding to one shot, is called trace.
The recorded traces contain information that can be re-lated with the path of the wave in the subsurface, which gen-erates recorded events such as primary reflections (waves thatsuffer only one reflection and are thus directly related to thesubsurface structure), multiple reflections, diffractions, wavesthat only propagates on the surface, and sources of noise [2].
The authors would like to thank CAPES and CNPq for the funding pro-vided.
It is this relationship that enables the estimation of the ge-ological structures from data recorded at the surface. How-ever, the relationship is not immediate, and the traces are alsocorrupted by noise, and by several distortion suffered by thewave during its propagation. Thus, several signal processingtechniques may be employed to generate a good image of thesubsurface.
Several seismic processing techniques work with groupsof traces which present a common feature. For instance, wemay organize the data using the midpoint between the sourceand the geophone that generate the trace. This configuration,or family, is called common midpoint, or CMP. If we orga-nize the traces in this configuration, we may say that if thewave suffered a reflection at a given point, all the recordedCMP traces will present that same reflection, at different timeinstants. A CMP family and a reflection event are shown infigure 2.
A traditional procedure in a CMP family is called stack-ing, wherein we correct the traces of a CMP family for thetime differences in the reflections events and average theiramplitudes. As a result, stacking produces a new trace, withless noise, which simulates a seismic experiment whereinsource and receiver are placed at that midpoint coordinate.This is known as a zero-offset trace. (More details about thisprocedure will be seen on section 2.) Also in the stackingprocedure, it is common practice to use more than one CMPat each time. For example, we may use one neighbor CMPat each side of the given CMP and consider the reflectionpoint to be located at the central CMP. This practice is calledsupergather.
As an alternative to the traditional stacking procedure, ourproposal is to use more information of the traces to createthe trace with zero-offset. The traditional stacking only sumsselected time instants of the traces. We propose to gener-ate a data matrix for each time instant and apply a singularvalue decomposition in this matrix, in order to attenuate in-terferences in that matrix and select only aligned events forthe stacking operation. The main particularity of that ma-trix is that its columns are time samples above and bellow thetime instant being considered for the stacking. We named thismethod Eigenstacking. More details about the Eigenstack-ing are shown in section 3. A similar method was proposed
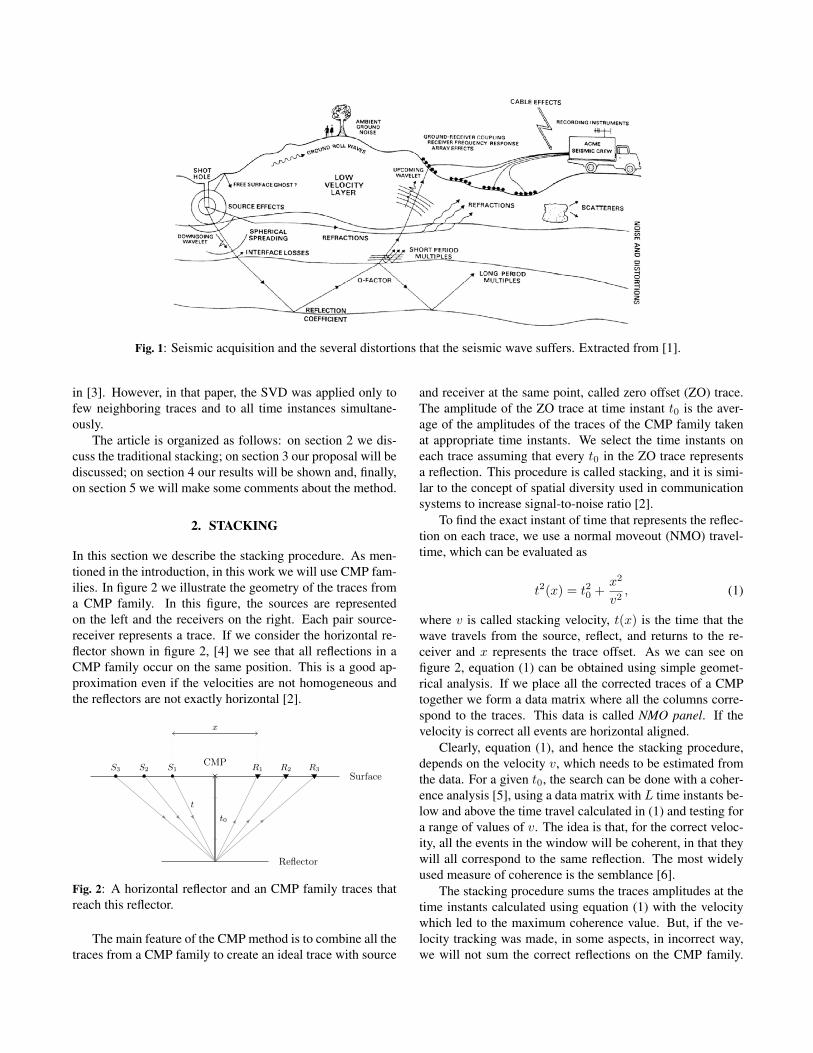
Fig. 1: Seismic acquisition and the several distortions that the seismic wave suffers. Extracted from [1].
in [3]. However, in that paper, the SVD was applied only tofew neighboring traces and to all time instances simultane-ously.
The article is organized as follows: on section 2 we dis-cuss the traditional stacking; on section 3 our proposal will bediscussed; on section 4 our results will be shown and, finally,on section 5 we will make some comments about the method.
2. STACKING
In this section we describe the stacking procedure. As men-tioned in the introduction, in this work we will use CMP fam-ilies. In figure 2 we illustrate the geometry of the traces froma CMP family. In this figure, the sources are representedon the left and the receivers on the right. Each pair source-receiver represents a trace. If we consider the horizontal re-flector shown in figure 2, [4] we see that all reflections in aCMP family occur on the same position. This is a good ap-proximation even if the velocities are not homogeneous andthe reflectors are not exactly horizontal [2].
×CMP
t0
t
x
R1 R2 R3S1S2S3
Reflector
Surface
Fig. 2: A horizontal reflector and an CMP family traces thatreach this reflector.
The main feature of the CMP method is to combine all thetraces from a CMP family to create an ideal trace with source
and receiver at the same point, called zero offset (ZO) trace.The amplitude of the ZO trace at time instant t0 is the aver-age of the amplitudes of the traces of the CMP family takenat appropriate time instants. We select the time instants oneach trace assuming that every t0 in the ZO trace representsa reflection. This procedure is called stacking, and it is simi-lar to the concept of spatial diversity used in communicationsystems to increase signal-to-noise ratio [2].
To find the exact instant of time that represents the reflec-tion on each trace, we use a normal moveout (NMO) travel-time, which can be evaluated as
t2(x) = t20 +x2
v2, (1)
where v is called stacking velocity, t(x) is the time that thewave travels from the source, reflect, and returns to the re-ceiver and x represents the trace offset. As we can see onfigure 2, equation (1) can be obtained using simple geomet-rical analysis. If we place all the corrected traces of a CMPtogether we form a data matrix where all the columns corre-spond to the traces. This data is called NMO panel. If thevelocity is correct all events are horizontal aligned.
Clearly, equation (1), and hence the stacking procedure,depends on the velocity v, which needs to be estimated fromthe data. For a given t0, the search can be done with a coher-ence analysis [5], using a data matrix with L time instants be-low and above the time travel calculated in (1) and testing fora range of values of v. The idea is that, for the correct veloc-ity, all the events in the window will be coherent, in that theywill all correspond to the same reflection. The most widelyused measure of coherence is the semblance [6].
The stacking procedure sums the traces amplitudes at thetime instants calculated using equation (1) with the velocitywhich led to the maximum coherence value. But, if the ve-locity tracking was made, in some aspects, in incorrect way,we will not sum the correct reflections on the CMP family.
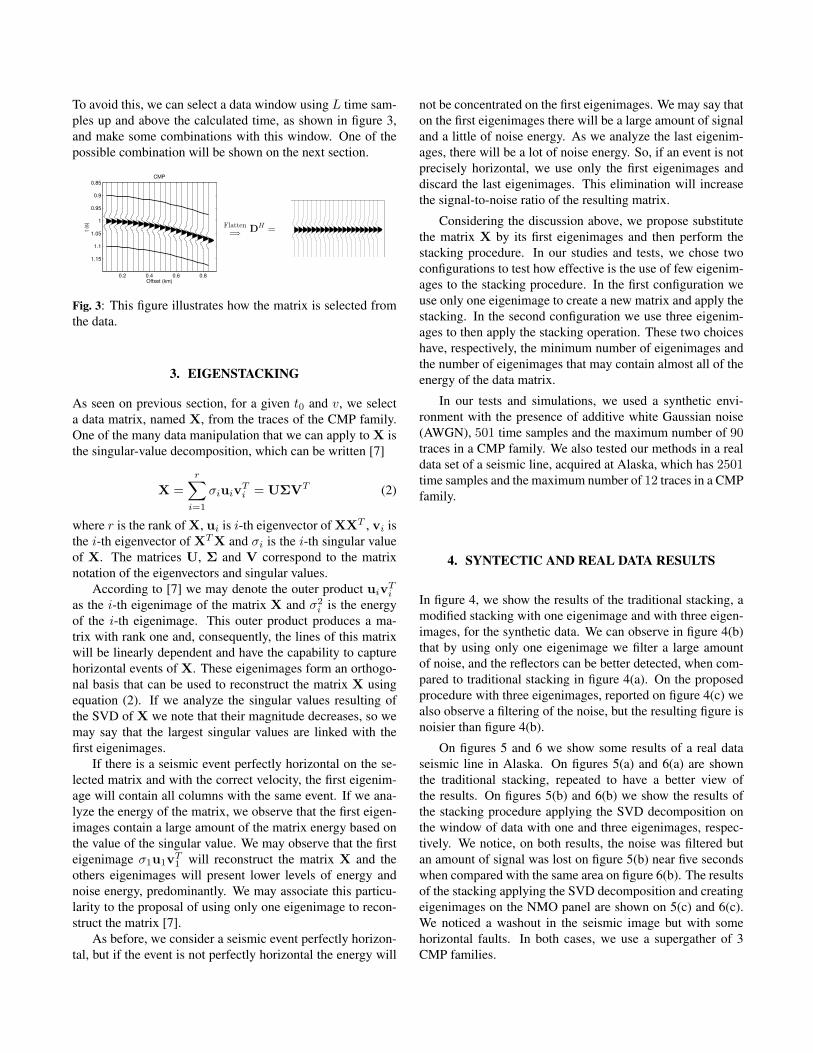
To avoid this, we can select a data window using L time sam-ples up and above the calculated time, as shown in figure 3,and make some combinations with this window. One of thepossible combination will be shown on the next section.
0.2 0.4 0.6 0.8
0.85
0.9
0.95
1
1.05
1.1
1.15
Offset (km)
t (s
)
CMP
Flatten=⇒ DH =
Fig. 3: This figure illustrates how the matrix is selected fromthe data.
3. EIGENSTACKING
As seen on previous section, for a given t0 and v, we selecta data matrix, named X, from the traces of the CMP family.One of the many data manipulation that we can apply to X isthe singular-value decomposition, which can be written [7]
X =
r∑i=1
σiuivTi = UΣVT (2)
where r is the rank of X, ui is i-th eigenvector of XXT , vi isthe i-th eigenvector of XTX and σi is the i-th singular valueof X. The matrices U, Σ and V correspond to the matrixnotation of the eigenvectors and singular values.
According to [7] we may denote the outer product uivTi
as the i-th eigenimage of the matrix X and σ2i is the energy
of the i-th eigenimage. This outer product produces a ma-trix with rank one and, consequently, the lines of this matrixwill be linearly dependent and have the capability to capturehorizontal events of X. These eigenimages form an orthogo-nal basis that can be used to reconstruct the matrix X usingequation (2). If we analyze the singular values resulting ofthe SVD of X we note that their magnitude decreases, so wemay say that the largest singular values are linked with thefirst eigenimages.
If there is a seismic event perfectly horizontal on the se-lected matrix and with the correct velocity, the first eigenim-age will contain all columns with the same event. If we ana-lyze the energy of the matrix, we observe that the first eigen-images contain a large amount of the matrix energy based onthe value of the singular value. We may observe that the firsteigenimage σ1u1v
T1 will reconstruct the matrix X and the
others eigenimages will present lower levels of energy andnoise energy, predominantly. We may associate this particu-larity to the proposal of using only one eigenimage to recon-struct the matrix [7].
As before, we consider a seismic event perfectly horizon-tal, but if the event is not perfectly horizontal the energy will
not be concentrated on the first eigenimages. We may say thaton the first eigenimages there will be a large amount of signaland a little of noise energy. As we analyze the last eigenim-ages, there will be a lot of noise energy. So, if an event is notprecisely horizontal, we use only the first eigenimages anddiscard the last eigenimages. This elimination will increasethe signal-to-noise ratio of the resulting matrix.
Considering the discussion above, we propose substitutethe matrix X by its first eigenimages and then perform thestacking procedure. In our studies and tests, we chose twoconfigurations to test how effective is the use of few eigenim-ages to the stacking procedure. In the first configuration weuse only one eigenimage to create a new matrix and apply thestacking. In the second configuration we use three eigenim-ages to then apply the stacking operation. These two choiceshave, respectively, the minimum number of eigenimages andthe number of eigenimages that may contain almost all of theenergy of the data matrix.
In our tests and simulations, we used a synthetic envi-ronment with the presence of additive white Gaussian noise(AWGN), 501 time samples and the maximum number of 90traces in a CMP family. We also tested our methods in a realdata set of a seismic line, acquired at Alaska, which has 2501time samples and the maximum number of 12 traces in a CMPfamily.
4. SYNTECTIC AND REAL DATA RESULTS
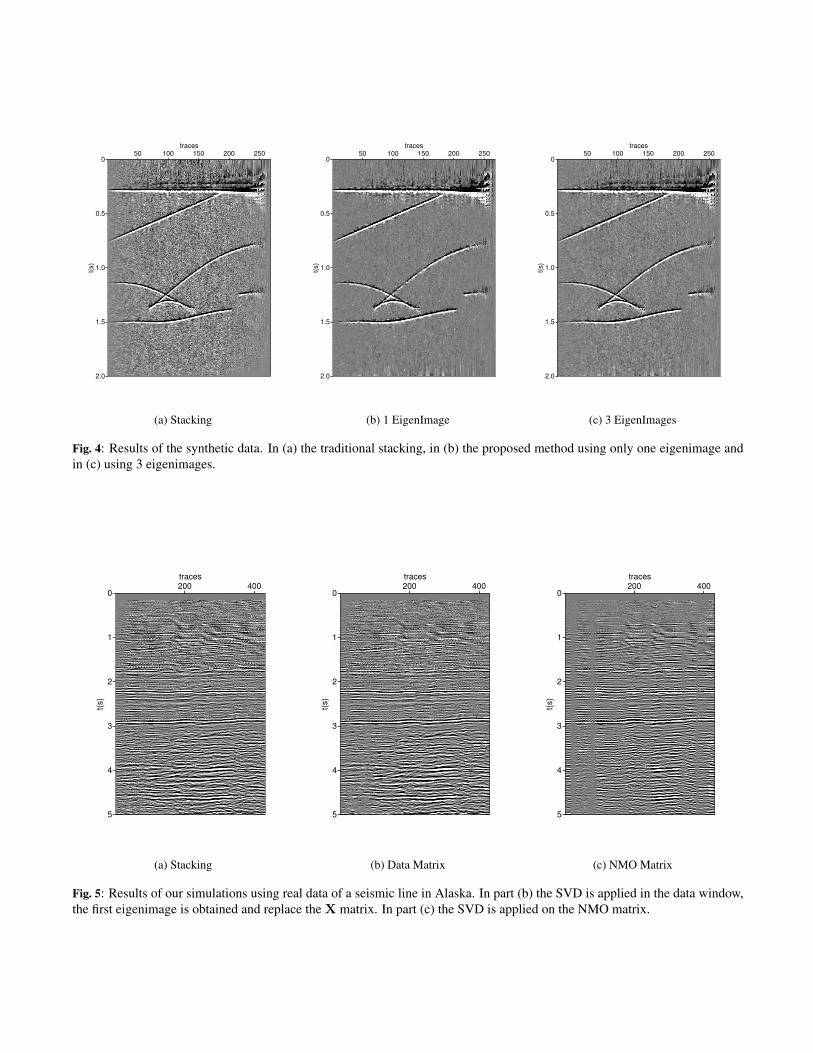
In figure 4, we show the results of the traditional stacking, amodified stacking with one eigenimage and with three eigen-images, for the synthetic data. We can observe in figure 4(b)that by using only one eigenimage we filter a large amountof noise, and the reflectors can be better detected, when com-pared to traditional stacking in figure 4(a). On the proposedprocedure with three eigenimages, reported on figure 4(c) wealso observe a filtering of the noise, but the resulting figure isnoisier than figure 4(b).
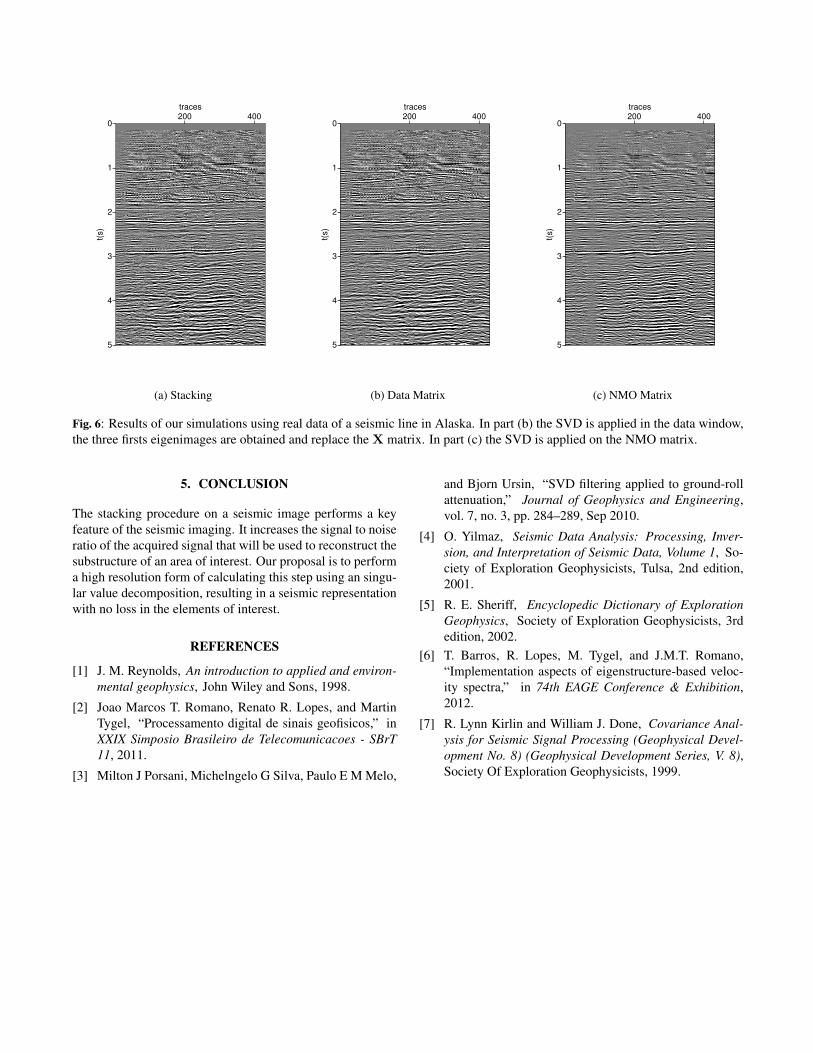
On figures 5 and 6 we show some results of a real dataseismic line in Alaska. On figures 5(a) and 6(a) are shownthe traditional stacking, repeated to have a better view ofthe results. On figures 5(b) and 6(b) we show the results ofthe stacking procedure applying the SVD decomposition onthe window of data with one and three eigenimages, respec-tively. We notice, on both results, the noise was filtered butan amount of signal was lost on figure 5(b) near five secondswhen compared with the same area on figure 6(b). The resultsof the stacking applying the SVD decomposition and creatingeigenimages on the NMO panel are shown on 5(c) and 6(c).We noticed a washout in the seismic image but with somehorizontal faults. In both cases, we use a supergather of 3CMP families.
0
0.5
1.0
1.5
2.0
t(s)
50 100 150 200 250traces
(a) Stacking
0
0.5
1.0
1.5
2.0
t(s)
50 100 150 200 250traces
(b) 1 EigenImage
0
0.5
1.0
1.5
2.0
t(s)
50 100 150 200 250traces
(c) 3 EigenImages
Fig. 4: Results of the synthetic data. In (a) the traditional stacking, in (b) the proposed method using only one eigenimage andin (c) using 3 eigenimages.
0
1
2
3
4
5
t(s)
200 400traces
(a) Stacking
0
1
2
3
4
5
t(s)
200 400traces
(b) Data Matrix
0
1
2
3
4
5
t(s)
200 400traces
(c) NMO Matrix
Fig. 5: Results of our simulations using real data of a seismic line in Alaska. In part (b) the SVD is applied in the data window,the first eigenimage is obtained and replace the X matrix. In part (c) the SVD is applied on the NMO matrix.
0
1
2
3
4
5
t(s)
200 400traces
(a) Stacking
0
1
2
3
4
5
t(s)
200 400traces
(b) Data Matrix
0
1
2
3
4
5
t(s)
200 400traces
(c) NMO Matrix
Fig. 6: Results of our simulations using real data of a seismic line in Alaska. In part (b) the SVD is applied in the data window,the three firsts eigenimages are obtained and replace the X matrix. In part (c) the SVD is applied on the NMO matrix.
5. CONCLUSION
The stacking procedure on a seismic image performs a keyfeature of the seismic imaging. It increases the signal to noiseratio of the acquired signal that will be used to reconstruct thesubstructure of an area of interest. Our proposal is to performa high resolution form of calculating this step using an singu-lar value decomposition, resulting in a seismic representationwith no loss in the elements of interest.
REFERENCES
[1] J. M. Reynolds, An introduction to applied and environ-mental geophysics, John Wiley and Sons, 1998.
[2] Joao Marcos T. Romano, Renato R. Lopes, and MartinTygel, “Processamento digital de sinais geofisicos,” inXXIX Simposio Brasileiro de Telecomunicacoes - SBrT11, 2011.
[3] Milton J Porsani, Michelngelo G Silva, Paulo E M Melo,
and Bjorn Ursin, “SVD filtering applied to ground-rollattenuation,” Journal of Geophysics and Engineering,vol. 7, no. 3, pp. 284–289, Sep 2010.
[4] O. Yilmaz, Seismic Data Analysis: Processing, Inver-sion, and Interpretation of Seismic Data, Volume 1, So-ciety of Exploration Geophysicists, Tulsa, 2nd edition,2001.
[5] R. E. Sheriff, Encyclopedic Dictionary of ExplorationGeophysics, Society of Exploration Geophysicists, 3rdedition, 2002.
[6] T. Barros, R. Lopes, M. Tygel, and J.M.T. Romano,“Implementation aspects of eigenstructure-based veloc-ity spectra,” in 74th EAGE Conference & Exhibition,2012.
[7] R. Lynn Kirlin and William J. Done, Covariance Anal-ysis for Seismic Signal Processing (Geophysical Devel-opment No. 8) (Geophysical Development Series, V. 8),Society Of Exploration Geophysicists, 1999.