Embed Size (px)
Citation preview
PERIODICAL TENDENCIES IN VRANCEA SEISMIC ACTIVITY DETECTED BY THE HI-CUM STACKING METHOD
NICOLETA CADICHEANU1, MICHEL VAN RUYMBEKE2, DOREL ZUGRĂVESCU1, MICHEL EVERAERTS2, ROSAMUND HOWARD2
1"Sabba S. Ştefănescu" Institute of Geodynamics of the Romanian Academy, 19-21, J.-L. Calderon St., Bucharest 37, 020032, Romania
2Royal Observatory of Belgium, Avenue Circulaire, 3, B-1180 Bruxelles, Belgium Fax: +32-2373-0286, E-mail: labvruy@ oma.be
Les tendances périodiques dans l’activité sismique de Vrancea, mises en évidence avec la méthode Hi-Cum. De nombreux auteurs ont investigué l’éventualité du déclenchement des tremblements de terre, d’une action d’origine solaire ou lunaire. Ce déclenchement serait du aux modulations gravitationnelles induites par les marées terrestres. Dans cet article nous avons plus spécialement analysé les événements sismiques produits dans la région de Vrancea (Roumanie) entre le 1er décembre 1982 et le 30 novembre 2004. Disposant des valeurs des périodes de ces actions d’origine astronomique avec une très grande précision, nous avons utilisé une méthode de stacking adaptée aux modulations luni-solaire développées sous le nom de Hi-Cum. Son application, ayant à la base des données sismiques, nous a permis de confirmer la présence de périodicités liées aux marées terrestres ou à des événements ayant les mêmes périodes dans l’occurrence sismique. Dans certains cas nous avons pu constater des tendances significatives. Les effets périodiques pourraient être le résultat de la modulation de divers paramètres géophysiques caractéristiques pour chaque point de la Terre, en fonction des positions respectives du Soleil (inductions d’origine climatique, magnétique, électrique, etc.) et par les champs gravitationnelles du Soleil et de la Lune (les marées terrestres). Ces variations étant dépendantes du temps et de l’espace, nous avons tenté la mise en relation des résultats de cette analyse, avec les caractéristiques de la structure géologique de la région de Vrancea.
Key words: seismic activity, earth-tides, tectonic movements, Vrancea, Hi-Cum.
1. INTRODUCTION
Romania is, along with Italy and Turkey, one of the most active earthquake regions in Europe. The extremely peculiar seismotectonic and geodynamic process in the area of the Eastern Carpathian arch belt has been the subject of numerous investigations by seismologists. Enescu and Enescu (1998) used a histogram method to investigate the possibility that Earth tides could be triggering subcrustal earthquakes in this region.
Rev. Roum. GÉOPHYSIQUE, 50, p. 31–57, 2006, Bucureşti
Nicoleta Cadicheanu et al. 2
32
Processes such as Earth tides and climatic induction have very small amplitudes. It will therefore be difficult to detect their effects. Stavinschi and Souchay (2003) have used statistical analysis to detect correlations between earthquakes and earth-tides. The Royal Observatory of Belgium has developed Hi-Cum (the Histograms Cumulation method) that is a statistical method suitable for the detection of weak tendencies hidden in a random series of time occurrence events (Van Ruymbeke et al., 2001, 2003). In this paper Hi-Cum was used to look for a statistical tendency in the database of Vrancea earthquakes that occurred between 1982 and 2004. Since there are a large number of events available for analysis in ROMPLUS catalogue (Oncescu et al., 1999) and the periods from Earth tides are clearly defined, Hi-Cum is a suitable tool to extract information about any very small modulations in the distribution of the seismic parameters (occurrence, longitude, latitude, depth or magnitude) which may be present.
For our research, a physical time reference is required. Since, in addition to the gravitational and centrifugal forces (which create a static equilibrium of the Earth) the Sun and the Moon’s gravitational fields are the two major influences which exert a force on a given point on Earth, their periodicities are obvious candidates. We therefore selected the period between two passages of either the Sun or the Moon in the local Meridian plane (S1 of 24 h period and M1 of 24.833248 h period) as our main references. It should be noted that if any significant influences from the harmonics of these periods is detected, they could be as a result of tidal, climatic or gravitational effects.
However, because the lunar and solar effects are fully independent, any long period amplitude modulation corresponding to the beat of M1 and S1, which is related to the small difference between the respective S1 and M1 periods, could only be as a result of gravitational influences. If a signature of this beat could be found in our data then this could support our hypothesis that gravitational influences of earth-tides are possible earthquake triggers.
When applying Hi-Cum to our database of earthquake was discovered that the seismic activity was modulated by low frequency waves (Sa, Ssa, Md). In particular we studied the diurnal solar period S1 and its harmonic S2 as well as the diurnal lunar wave M1 and its harmonic M2. If any correlation is found, these time periods can be further investigated to determine more precisely their significance.
2. SELECTION OF SEISMIC DATA FOR FURTHER ANALYSIS
At present, the Romanian Earthquake catalogue ROMPLUS (Oncescu et al., 1999) is being collated. It contains information related to locations and other source parameters, as well as links to waveforms of strong earthquakes, for the period between the year 984 to present day.
3 Periodical tendencies in Vrancea seismic activity
33
If the entire databank were to be analysed, it is likely that, using data, that covers entire Romanian territory with a high number of faults of various geographical orientations, any effects which may be caused by earth-tides would be swamped by other factors. In order to analyse gravitational correlation to the occurrence of quakes, we confined our studies to seismic data from Vrancea, where the number of faults is limited yet there is sufficient data to perform a statistical analysis.
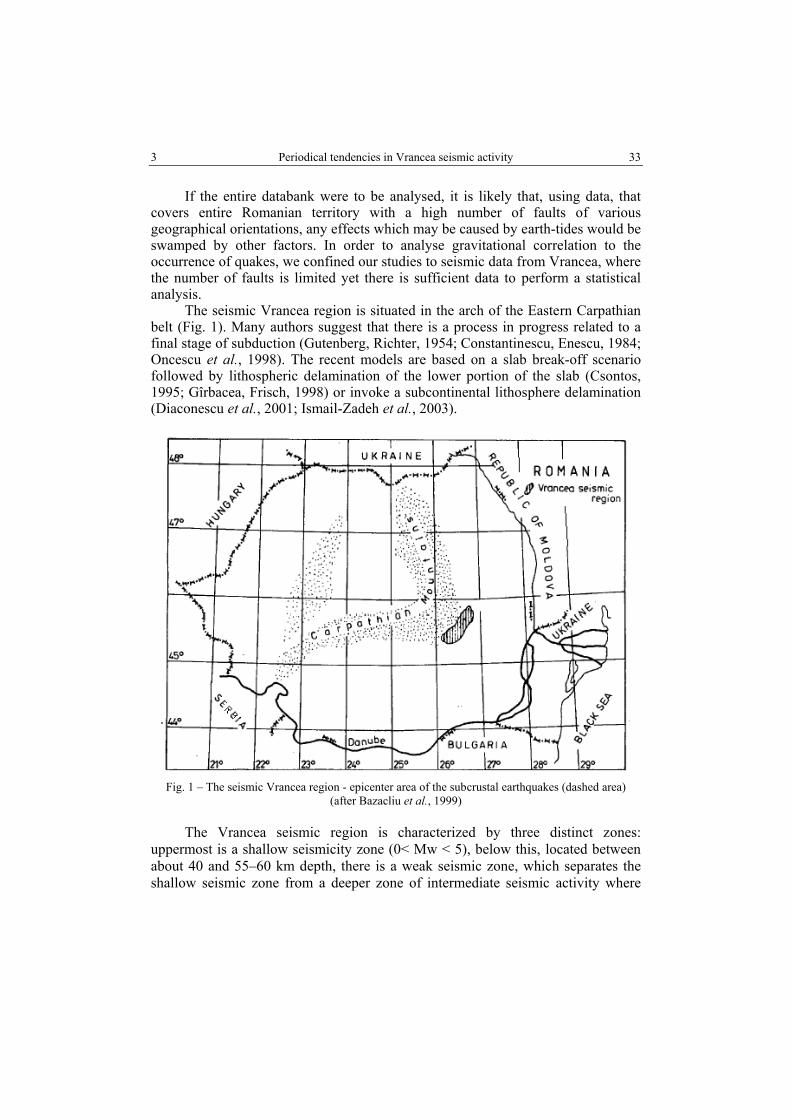
The seismic Vrancea region is situated in the arch of the Eastern Carpathian belt (Fig. 1). Many authors suggest that there is a process in progress related to a final stage of subduction (Gutenberg, Richter, 1954; Constantinescu, Enescu, 1984; Oncescu et al., 1998). The recent models are based on a slab break-off scenario followed by lithospheric delamination of the lower portion of the slab (Csontos, 1995; Gîrbacea, Frisch, 1998) or invoke a subcontinental lithosphere delamination (Diaconescu et al., 2001; Ismail-Zadeh et al., 2003).
Fig. 1 – The seismic Vrancea region - epicenter area of the subcrustal earthquakes (dashed area)
(after Bazacliu et al., 1999)
The Vrancea seismic region is characterized by three distinct zones: uppermost is a shallow seismicity zone (0< Mw < 5), below this, located between about 40 and 55–60 km depth, there is a weak seismic zone, which separates the shallow seismic zone from a deeper zone of intermediate seismic activity where
Nicoleta Cadicheanu et al. 4
34
larger earthquakes (5 < Mw ≤ 7.4) occur. The latter is a narrow vertical elongated region (40 × 80 km width, depth between 60–180 km).
The heterogeneity of geological conditions and the seismic activity in the deeper zone (depth > 100km) makes this an interesting candidate for our data analysis. This section of the data bank was analyzed to see if any significant relationship could be found between the solid earth-tides and seismic activity.
Before analysis some refinements were made to the data. All seismic activity with a value of less than 3.0 on the Mw scale (to avoid the inclusion of any data that might not be of seismic origin), the major events (Mw>5.6) and the seismic events with the depth of less than 100 km were excluded. Secondly the data was filtered to remove data associated with aftershocks applying the same technique as described in Trifu and Radulian (1991a,b).
Romania is not located on the reference meridian but the longitude correction of the time for every earthquake is very small and moreover the events take place into a very small area so this correction was not applied.
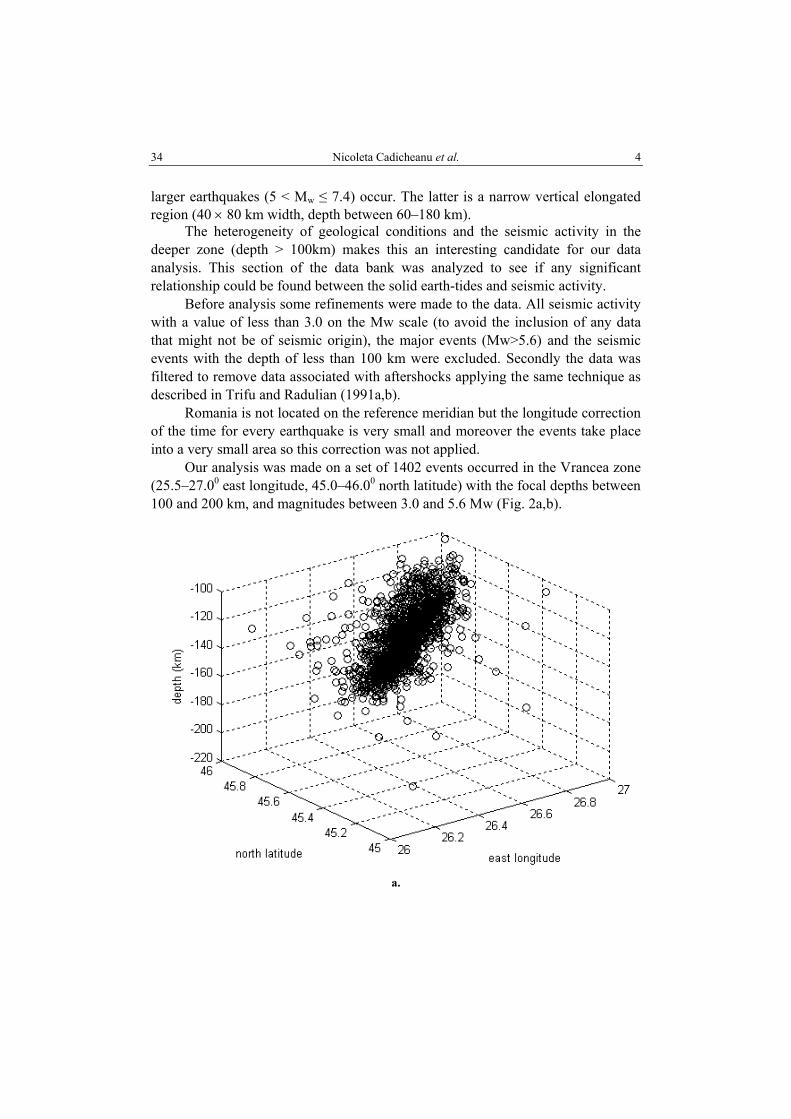
Our analysis was made on a set of 1402 events occurred in the Vrancea zone (25.5–27.00 east longitude, 45.0–46.00 north latitude) with the focal depths between 100 and 200 km, and magnitudes between 3.0 and 5.6 Mw (Fig. 2a,b).
a.
5 Periodical tendencies in Vrancea seismic activity
35
b.
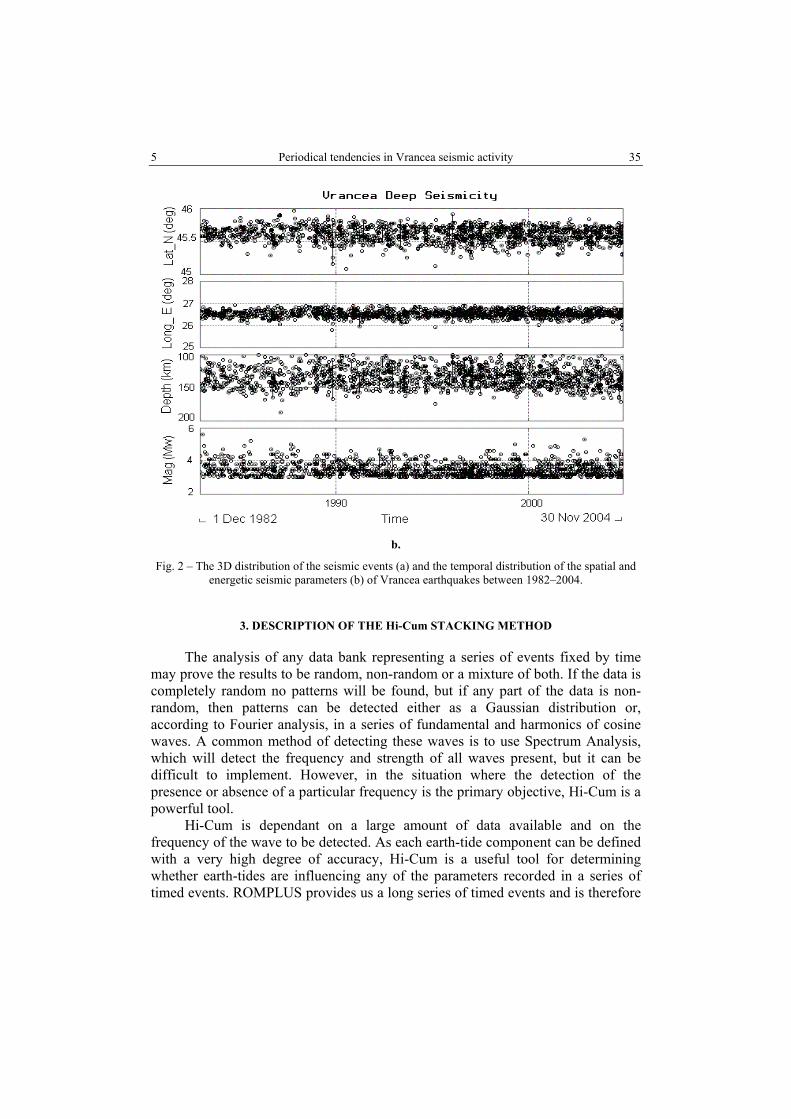
Fig. 2 – The 3D distribution of the seismic events (a) and the temporal distribution of the spatial and energetic seismic parameters (b) of Vrancea earthquakes between 1982–2004.
3. DESCRIPTION OF THE Hi-Cum STACKING METHOD
The analysis of any data bank representing a series of events fixed by time may prove the results to be random, non-random or a mixture of both. If the data is completely random no patterns will be found, but if any part of the data is non-random, then patterns can be detected either as a Gaussian distribution or, according to Fourier analysis, in a series of fundamental and harmonics of cosine waves. A common method of detecting these waves is to use Spectrum Analysis, which will detect the frequency and strength of all waves present, but it can be difficult to implement. However, in the situation where the detection of the presence or absence of a particular frequency is the primary objective, Hi-Cum is a powerful tool. Hi-Cum is dependant on a large amount of data available and on the frequency of the wave to be detected. As each earth-tide component can be defined with a very high degree of accuracy, Hi-Cum is a useful tool for determining whether earth-tides are influencing any of the parameters recorded in a series of timed events. ROMPLUS provides us a long series of timed events and is therefore
Nicoleta Cadicheanu et al. 6
36
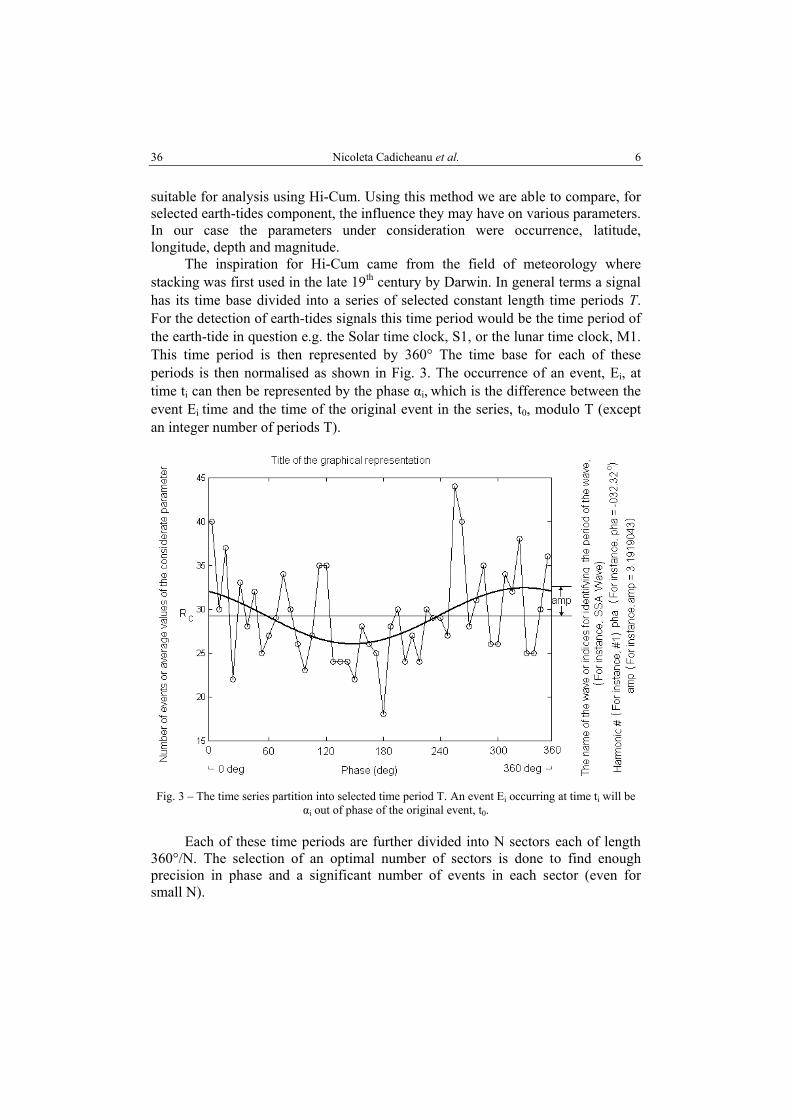
suitable for analysis using Hi-Cum. Using this method we are able to compare, for selected earth-tides component, the influence they may have on various parameters. In our case the parameters under consideration were occurrence, latitude, longitude, depth and magnitude. The inspiration for Hi-Cum came from the field of meteorology where stacking was first used in the late 19th century by Darwin. In general terms a signal has its time base divided into a series of selected constant length time periods T. For the detection of earth-tides signals this time period would be the time period of the earth-tide in question e.g. the Solar time clock, S1, or the lunar time clock, M1. This time period is then represented by 360° The time base for each of these periods is then normalised as shown in Fig. 3. The occurrence of an event, Ei, at time ti can then be represented by the phase αi, which is the difference between the event Ei time and the time of the original event in the series, t0, modulo T (except an integer number of periods T).
Fig. 3 – The time series partition into selected time period T. An event Ei occurring at time ti will be
αi out of phase of the original event, t0.
Each of these time periods are further divided into N sectors each of length 360°/N. The selection of an optimal number of sectors is done to find enough precision in phase and a significant number of events in each sector (even for small N).
7 Periodical tendencies in Vrancea seismic activity
37
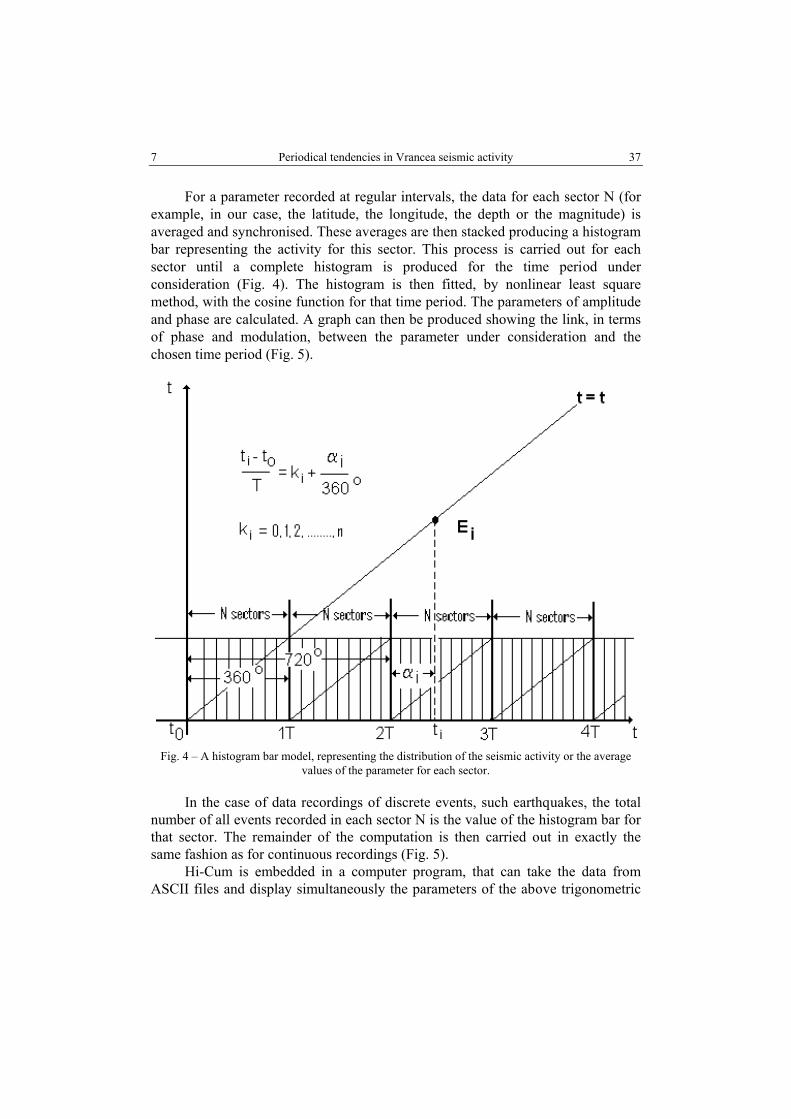
For a parameter recorded at regular intervals, the data for each sector N (for example, in our case, the latitude, the longitude, the depth or the magnitude) is averaged and synchronised. These averages are then stacked producing a histogram bar representing the activity for this sector. This process is carried out for each sector until a complete histogram is produced for the time period under consideration (Fig. 4). The histogram is then fitted, by nonlinear least square method, with the cosine function for that time period. The parameters of amplitude and phase are calculated. A graph can then be produced showing the link, in terms of phase and modulation, between the parameter under consideration and the chosen time period (Fig. 5).
Fig. 4 – A histogram bar model, representing the distribution of the seismic activity or the average
values of the parameter for each sector.
In the case of data recordings of discrete events, such earthquakes, the total number of all events recorded in each sector N is the value of the histogram bar for that sector. The remainder of the computation is then carried out in exactly the same fashion as for continuous recordings (Fig. 5). Hi-Cum is embedded in a computer program, that can take the data from ASCII files and display simultaneously the parameters of the above trigonometric
Nicoleta Cadicheanu et al. 8
38
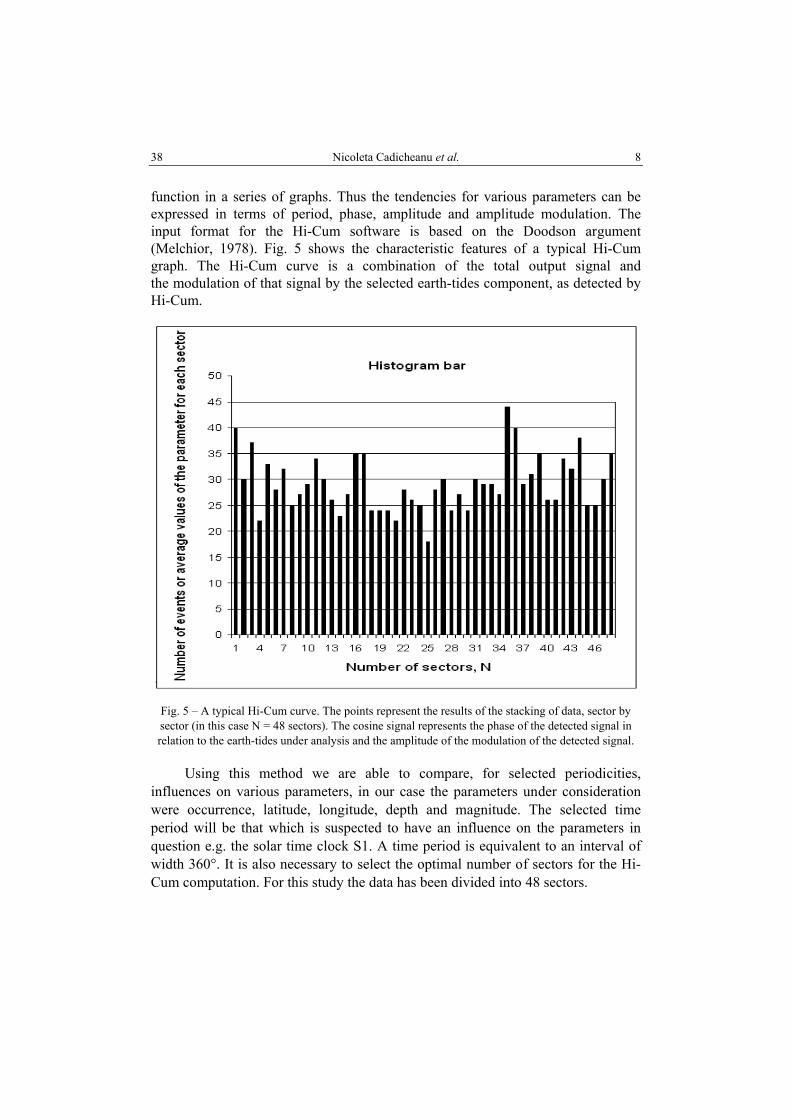
function in a series of graphs. Thus the tendencies for various parameters can be expressed in terms of period, phase, amplitude and amplitude modulation. The input format for the Hi-Cum software is based on the Doodson argument (Melchior, 1978). Fig. 5 shows the characteristic features of a typical Hi-Cum graph. The Hi-Cum curve is a combination of the total output signal and the modulation of that signal by the selected earth-tides component, as detected by Hi-Cum.
Fig. 5 – A typical Hi-Cum curve. The points represent the results of the stacking of data, sector by sector (in this case N = 48 sectors). The cosine signal represents the phase of the detected signal in relation to the earth-tides under analysis and the amplitude of the modulation of the detected signal.
Using this method we are able to compare, for selected periodicities, influences on various parameters, in our case the parameters under consideration were occurrence, latitude, longitude, depth and magnitude. The selected time period will be that which is suspected to have an influence on the parameters in question e.g. the solar time clock S1. A time period is equivalent to an interval of width 360°. It is also necessary to select the optimal number of sectors for the Hi-Cum computation. For this study the data has been divided into 48 sectors.
9 Periodical tendencies in Vrancea seismic activity
39
4. Hi-Cum APPLIED TO THE VRANCEA EARTHQUAKE DATA BASE
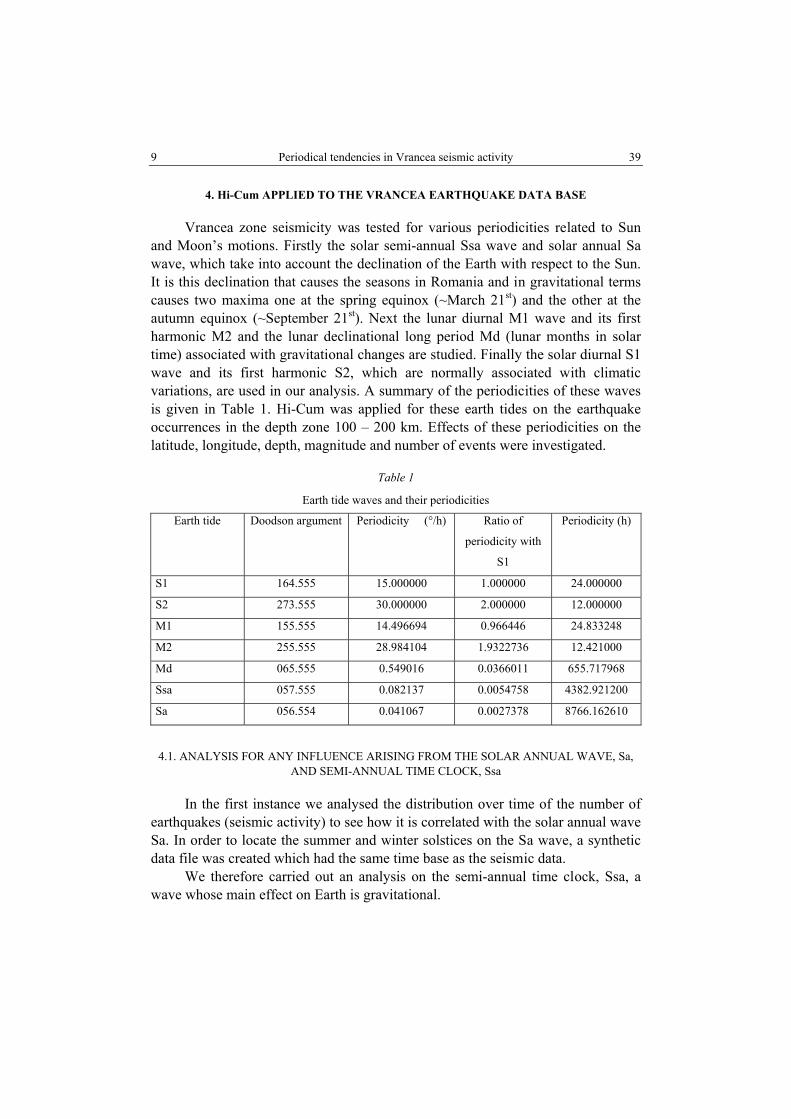
Vrancea zone seismicity was tested for various periodicities related to Sun and Moon’s motions. Firstly the solar semi-annual Ssa wave and solar annual Sa wave, which take into account the declination of the Earth with respect to the Sun. It is this declination that causes the seasons in Romania and in gravitational terms causes two maxima one at the spring equinox (~March 21st) and the other at the autumn equinox (~September 21st). Next the lunar diurnal M1 wave and its first harmonic M2 and the lunar declinational long period Md (lunar months in solar time) associated with gravitational changes are studied. Finally the solar diurnal S1 wave and its first harmonic S2, which are normally associated with climatic variations, are used in our analysis. A summary of the periodicities of these waves is given in Table 1. Hi-Cum was applied for these earth tides on the earthquake occurrences in the depth zone 100 – 200 km. Effects of these periodicities on the latitude, longitude, depth, magnitude and number of events were investigated.
Table 1
Earth tide waves and their periodicities
Earth tide Doodson argument Periodicity (°/h) Ratio of
periodicity with
S1
Periodicity (h)
S1 164.555 15.000000 1.000000 24.000000
S2 273.555 30.000000 2.000000 12.000000
M1 155.555 14.496694 0.966446 24.833248
M2 255.555 28.984104 1.9322736 12.421000
Md 065.555 0.549016 0.0366011 655.717968
Ssa 057.555 0.082137 0.0054758 4382.921200
Sa 056.554 0.041067 0.0027378 8766.162610
4.1. ANALYSIS FOR ANY INFLUENCE ARISING FROM THE SOLAR ANNUAL WAVE, Sa, AND SEMI-ANNUAL TIME CLOCK, Ssa
In the first instance we analysed the distribution over time of the number of earthquakes (seismic activity) to see how it is correlated with the solar annual wave Sa. In order to locate the summer and winter solstices on the Sa wave, a synthetic data file was created which had the same time base as the seismic data.
We therefore carried out an analysis on the semi-annual time clock, Ssa, a wave whose main effect on Earth is gravitational.
Nicoleta Cadicheanu et al. 10
40
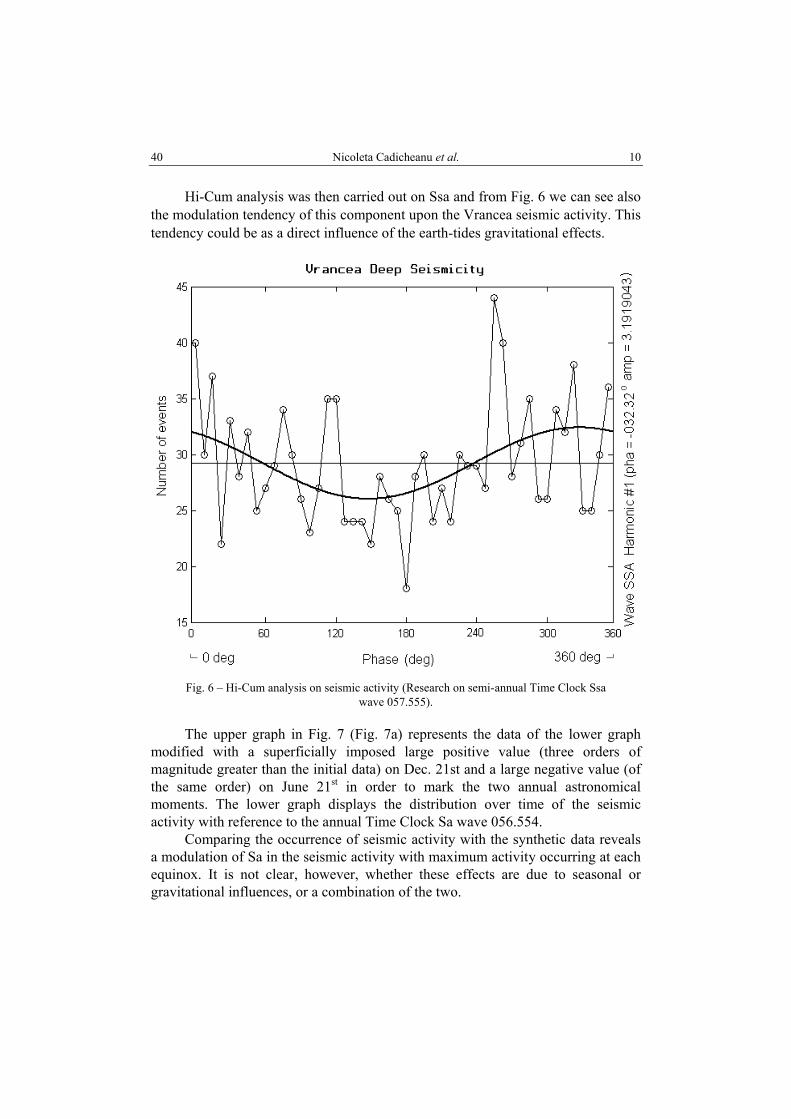
Hi-Cum analysis was then carried out on Ssa and from Fig. 6 we can see also the modulation tendency of this component upon the Vrancea seismic activity. This tendency could be as a direct influence of the earth-tides gravitational effects.
Fig. 6 – Hi-Cum analysis on seismic activity (Research on semi-annual Time Clock Ssa
wave 057.555).
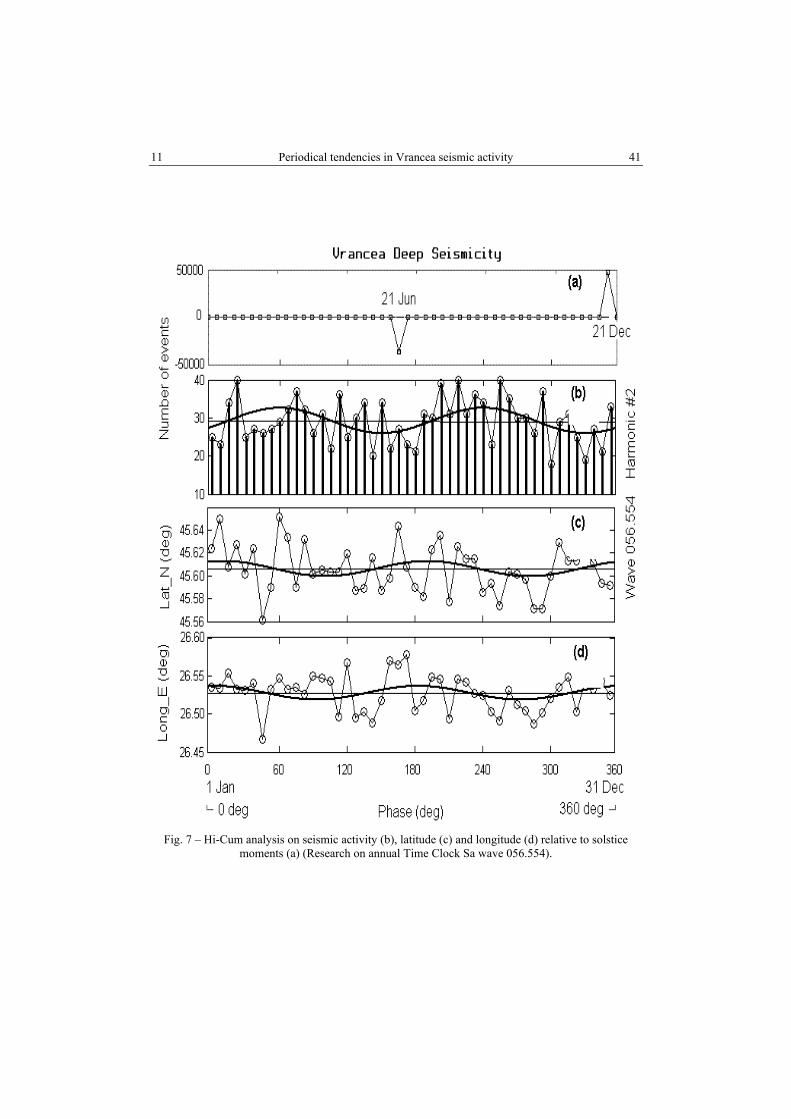
The upper graph in Fig. 7 (Fig. 7a) represents the data of the lower graph modified with a superficially imposed large positive value (three orders of magnitude greater than the initial data) on Dec. 21st and a large negative value (of the same order) on June 21st in order to mark the two annual astronomical moments. The lower graph displays the distribution over time of the seismic activity with reference to the annual Time Clock Sa wave 056.554.
Comparing the occurrence of seismic activity with the synthetic data reveals a modulation of Sa in the seismic activity with maximum activity occurring at each equinox. It is not clear, however, whether these effects are due to seasonal or gravitational influences, or a combination of the two.
11 Periodical tendencies in Vrancea seismic activity
41
Fig. 7 – Hi-Cum analysis on seismic activity (b), latitude (c) and longitude (d) relative to solstice
moments (a) (Research on annual Time Clock Sa wave 056.554).
Nicoleta Cadicheanu et al. 12
42
4.2. ANALYSIS FOR ANY INFLUENCE ARISING FROM Sa AND Ssa WITH RESPECT TO THE OCCURRENCE, LONGITUDE, LATITUDE AND DEPTH OF THE SEISMIC ACTIVITY
Detailed analysis of the seismic activity of the Vrancea zone indicates that the most active zone is at a depth of 100–200 km (Bazacliu, Radulian, 1999). It was then decided to further sort the data. For this part of our studies, data on the three spatial dimensions of the location of a quake, namely the longitude, latitude and depth, were used for Hi-Cum analysis along with the Hi-Cum analysis of the frequency of earthquake occurrence, irrespective of its location within the Vrancea region.
The Hi-Cum for Sa was then performed with the average value of latitude and longitude for each time sector and the results (Fig. 7c, d) compared with the previous graphs (Fig. 7b), to determine whether the location of the earthquakes could be linked to Sa. From Figure 6 we can see that there is a tendency for the site of the earthquake to vary with Sa, the solar annual wave.
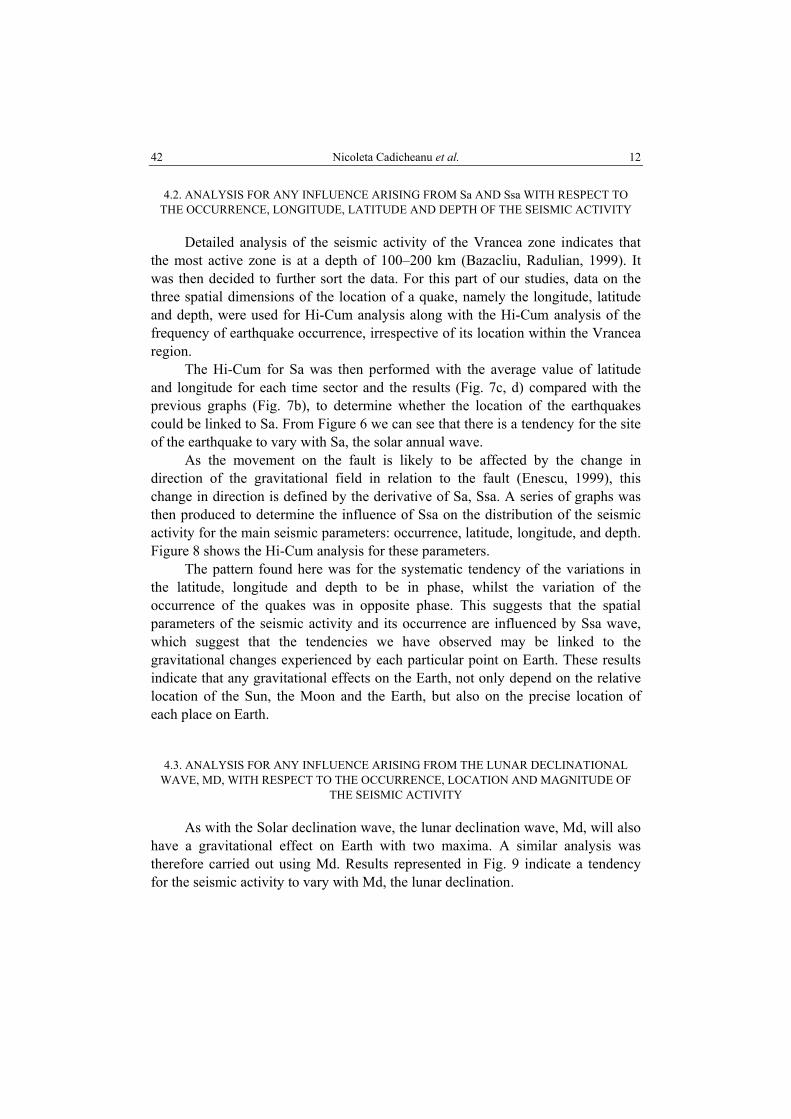
As the movement on the fault is likely to be affected by the change in direction of the gravitational field in relation to the fault (Enescu, 1999), this change in direction is defined by the derivative of Sa, Ssa. A series of graphs was then produced to determine the influence of Ssa on the distribution of the seismic activity for the main seismic parameters: occurrence, latitude, longitude, and depth. Figure 8 shows the Hi-Cum analysis for these parameters.
The pattern found here was for the systematic tendency of the variations in the latitude, longitude and depth to be in phase, whilst the variation of the occurrence of the quakes was in opposite phase. This suggests that the spatial parameters of the seismic activity and its occurrence are influenced by Ssa wave, which suggest that the tendencies we have observed may be linked to the gravitational changes experienced by each particular point on Earth. These results indicate that any gravitational effects on the Earth, not only depend on the relative location of the Sun, the Moon and the Earth, but also on the precise location of each place on Earth.
4.3. ANALYSIS FOR ANY INFLUENCE ARISING FROM THE LUNAR DECLINATIONAL WAVE, MD, WITH RESPECT TO THE OCCURRENCE, LOCATION AND MAGNITUDE OF
THE SEISMIC ACTIVITY
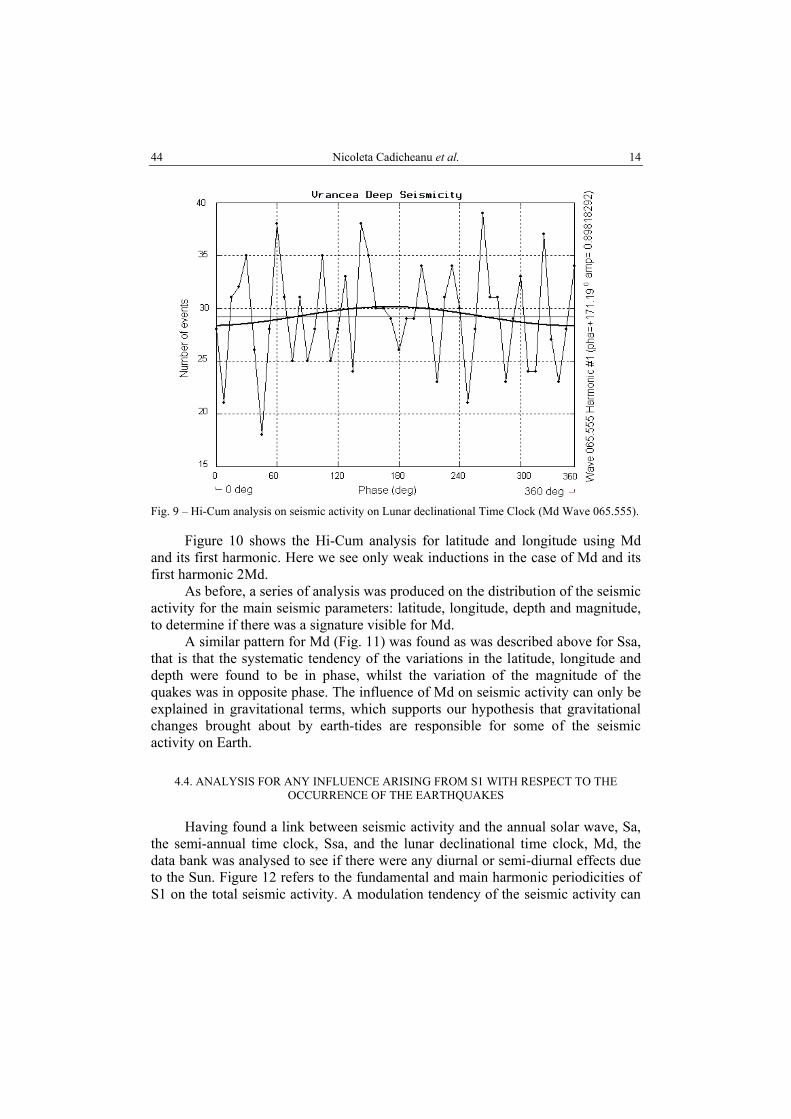
As with the Solar declination wave, the lunar declination wave, Md, will also have a gravitational effect on Earth with two maxima. A similar analysis was therefore carried out using Md. Results represented in Fig. 9 indicate a tendency for the seismic activity to vary with Md, the lunar declination.
13 Periodical tendencies in Vrancea seismic activity
43
Fig. 8 – Hi-Cum analysis on latitude, longitude, depth and activity (Research on semi-annual Time
Clock Ssa wave 057.555).
Nicoleta Cadicheanu et al. 14
44
Fig. 9 – Hi-Cum analysis on seismic activity on Lunar declinational Time Clock (Md Wave 065.555).
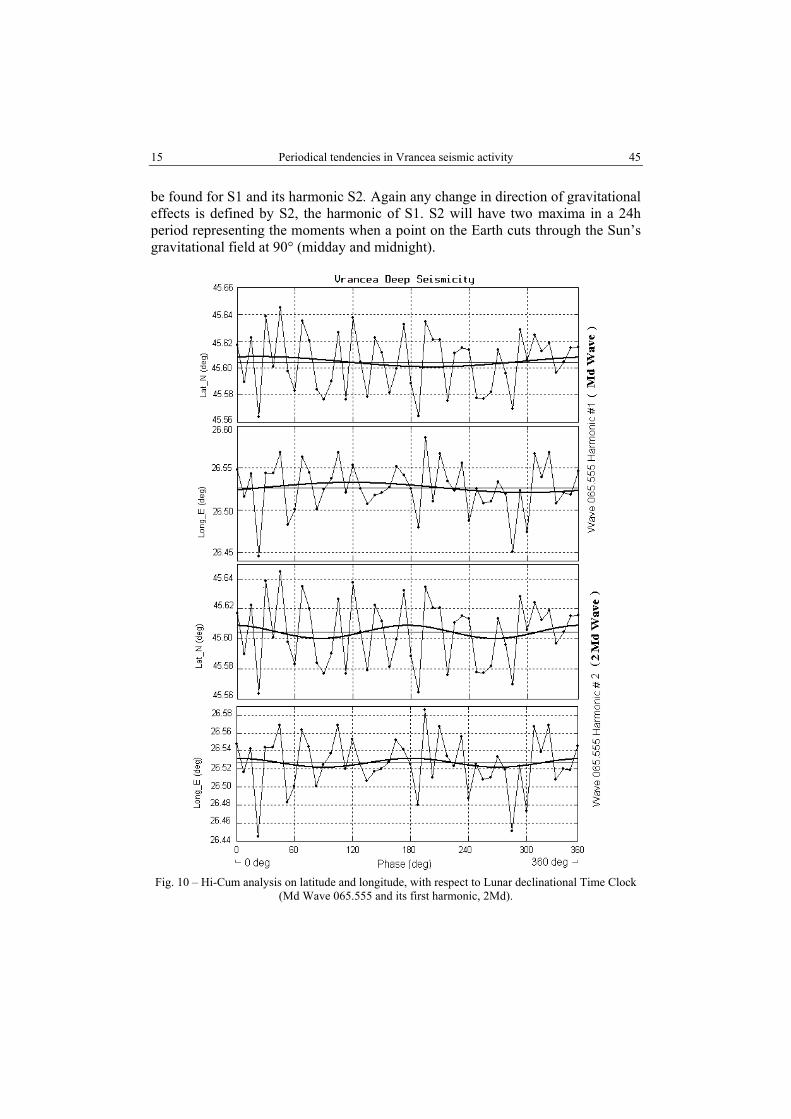
Figure 10 shows the Hi-Cum analysis for latitude and longitude using Md and its first harmonic. Here we see only weak inductions in the case of Md and its first harmonic 2Md.
As before, a series of analysis was produced on the distribution of the seismic activity for the main seismic parameters: latitude, longitude, depth and magnitude, to determine if there was a signature visible for Md.
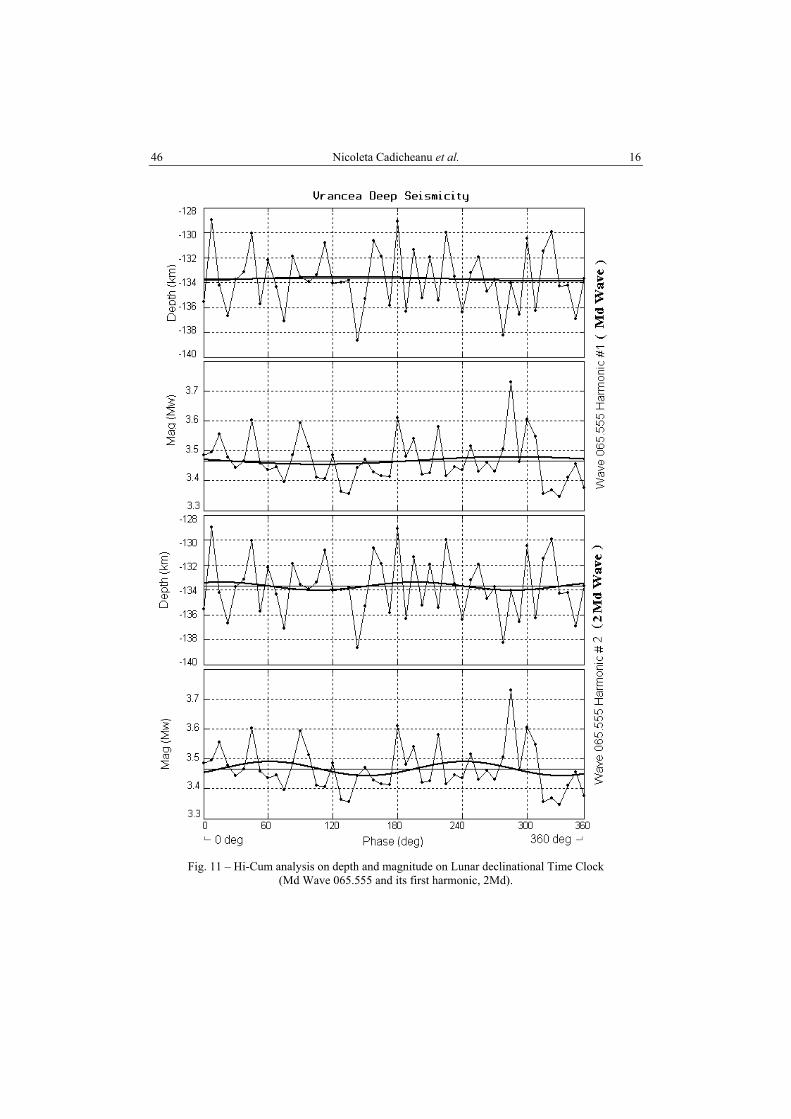
A similar pattern for Md (Fig. 11) was found as was described above for Ssa, that is that the systematic tendency of the variations in the latitude, longitude and depth were found to be in phase, whilst the variation of the magnitude of the quakes was in opposite phase. The influence of Md on seismic activity can only be explained in gravitational terms, which supports our hypothesis that gravitational changes brought about by earth-tides are responsible for some of the seismic activity on Earth.
4.4. ANALYSIS FOR ANY INFLUENCE ARISING FROM S1 WITH RESPECT TO THE OCCURRENCE OF THE EARTHQUAKES
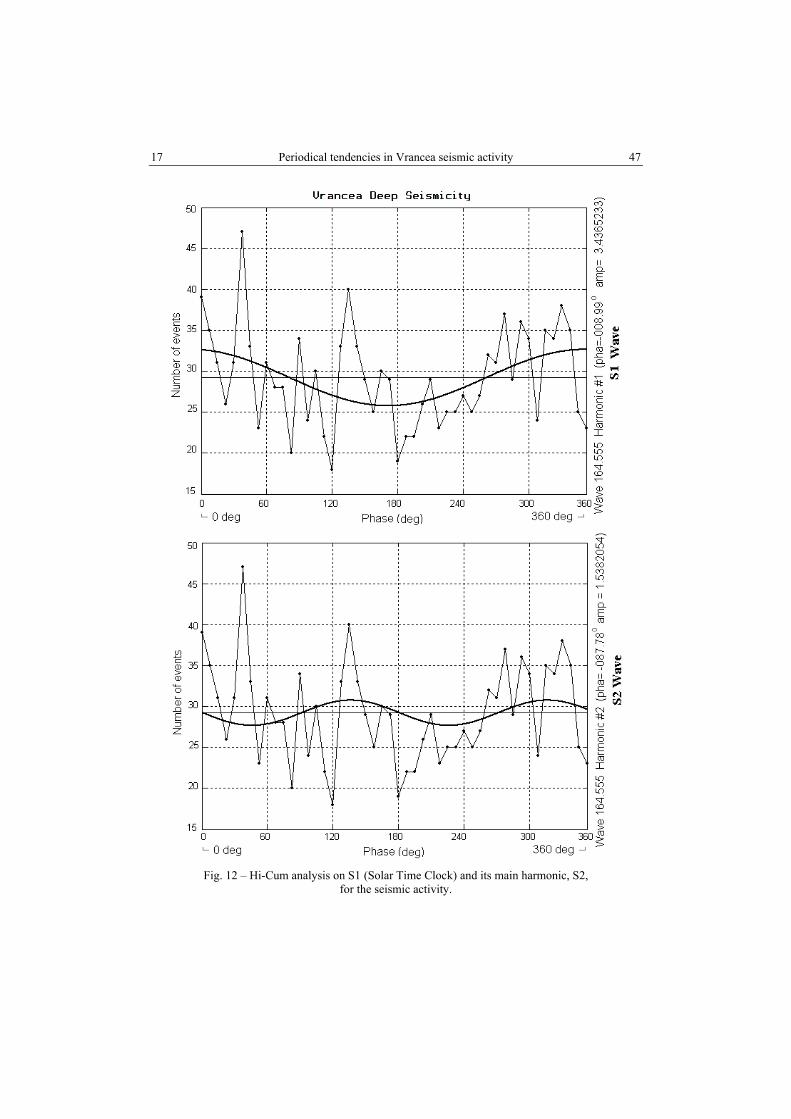
Having found a link between seismic activity and the annual solar wave, Sa, the semi-annual time clock, Ssa, and the lunar declinational time clock, Md, the data bank was analysed to see if there were any diurnal or semi-diurnal effects due to the Sun. Figure 12 refers to the fundamental and main harmonic periodicities of S1 on the total seismic activity. A modulation tendency of the seismic activity can
15 Periodical tendencies in Vrancea seismic activity
45
be found for S1 and its harmonic S2. Again any change in direction of gravitational effects is defined by S2, the harmonic of S1. S2 will have two maxima in a 24h period representing the moments when a point on the Earth cuts through the Sun’s gravitational field at 90° (midday and midnight).
Fig. 10 – Hi-Cum analysis on latitude and longitude, with respect to Lunar declinational Time Clock
(Md Wave 065.555 and its first harmonic, 2Md).
Nicoleta Cadicheanu et al. 16
46
Fig. 11 – Hi-Cum analysis on depth and magnitude on Lunar declinational Time Clock
(Md Wave 065.555 and its first harmonic, 2Md).
17 Periodical tendencies in Vrancea seismic activity
47
Fig. 12 – Hi-Cum analysis on S1 (Solar Time Clock) and its main harmonic, S2,
for the seismic activity.
Nicoleta Cadicheanu et al. 18
48
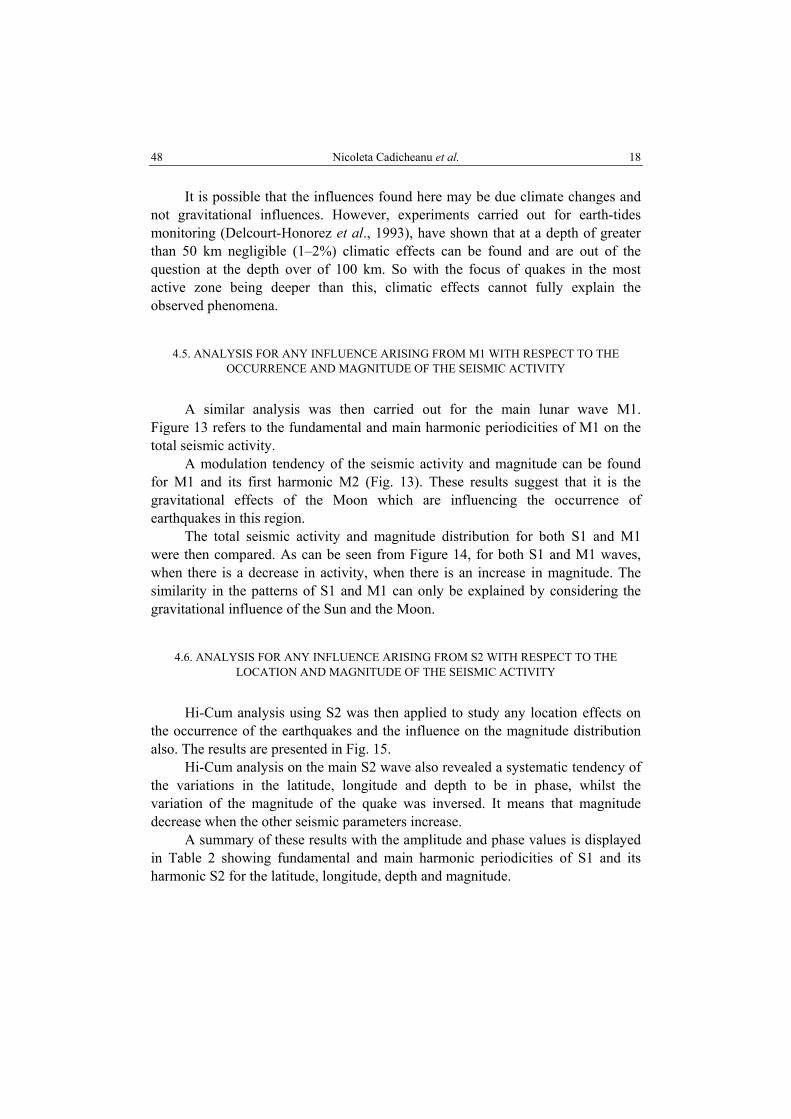
It is possible that the influences found here may be due climate changes and not gravitational influences. However, experiments carried out for earth-tides monitoring (Delcourt-Honorez et al., 1993), have shown that at a depth of greater than 50 km negligible (1–2%) climatic effects can be found and are out of the question at the depth over of 100 km. So with the focus of quakes in the most active zone being deeper than this, climatic effects cannot fully explain the observed phenomena.
4.5. ANALYSIS FOR ANY INFLUENCE ARISING FROM M1 WITH RESPECT TO THE OCCURRENCE AND MAGNITUDE OF THE SEISMIC ACTIVITY
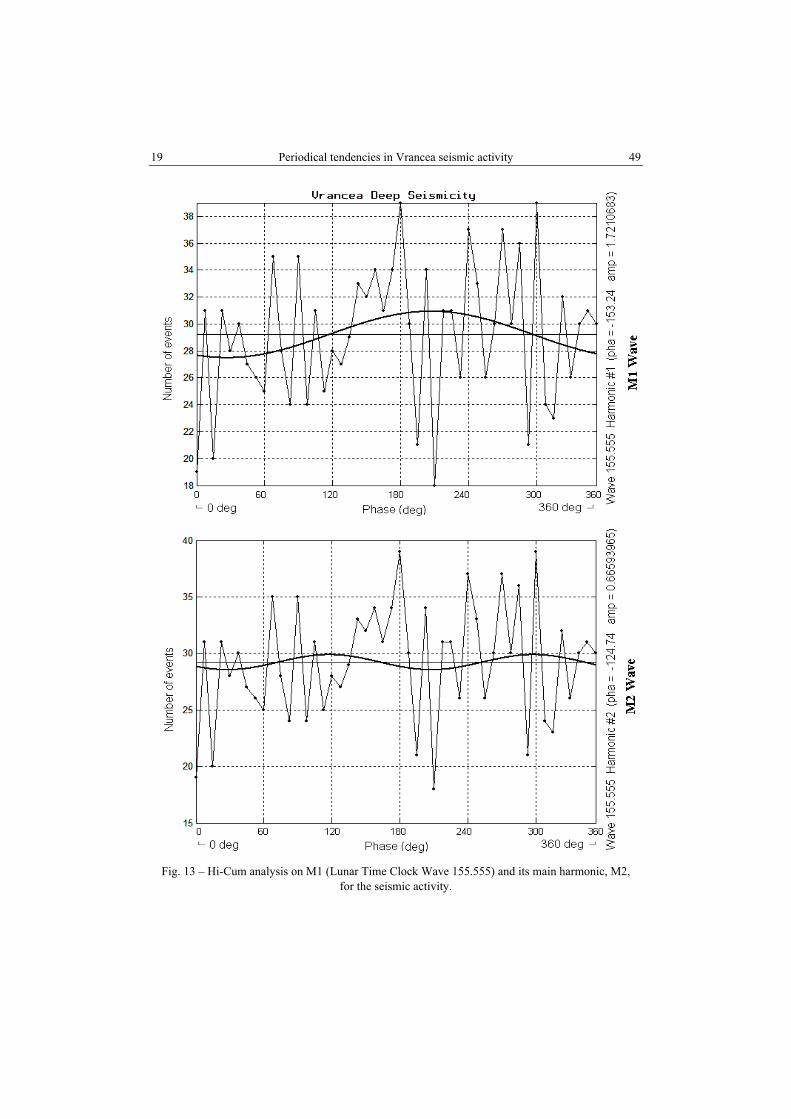
A similar analysis was then carried out for the main lunar wave M1. Figure 13 refers to the fundamental and main harmonic periodicities of M1 on the total seismic activity.
A modulation tendency of the seismic activity and magnitude can be found for M1 and its first harmonic M2 (Fig. 13). These results suggest that it is the gravitational effects of the Moon which are influencing the occurrence of earthquakes in this region.
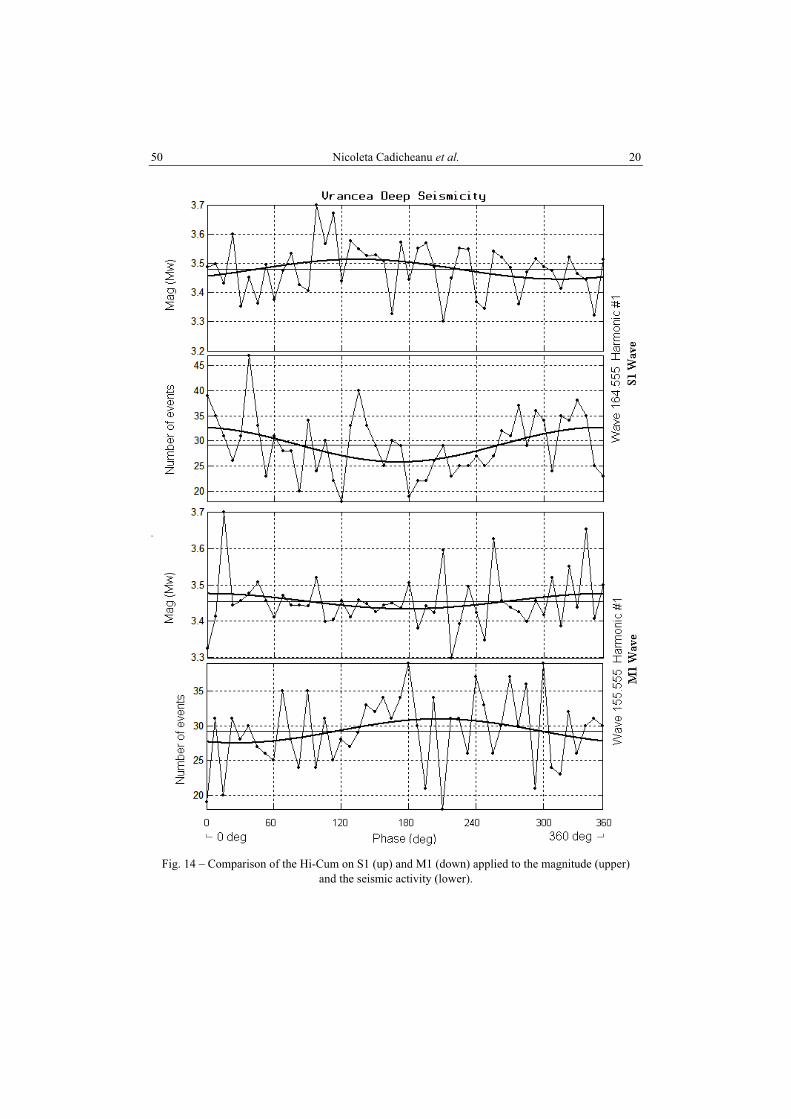
The total seismic activity and magnitude distribution for both S1 and M1 were then compared. As can be seen from Figure 14, for both S1 and M1 waves, when there is a decrease in activity, when there is an increase in magnitude. The similarity in the patterns of S1 and M1 can only be explained by considering the gravitational influence of the Sun and the Moon.
4.6. ANALYSIS FOR ANY INFLUENCE ARISING FROM S2 WITH RESPECT TO THE LOCATION AND MAGNITUDE OF THE SEISMIC ACTIVITY
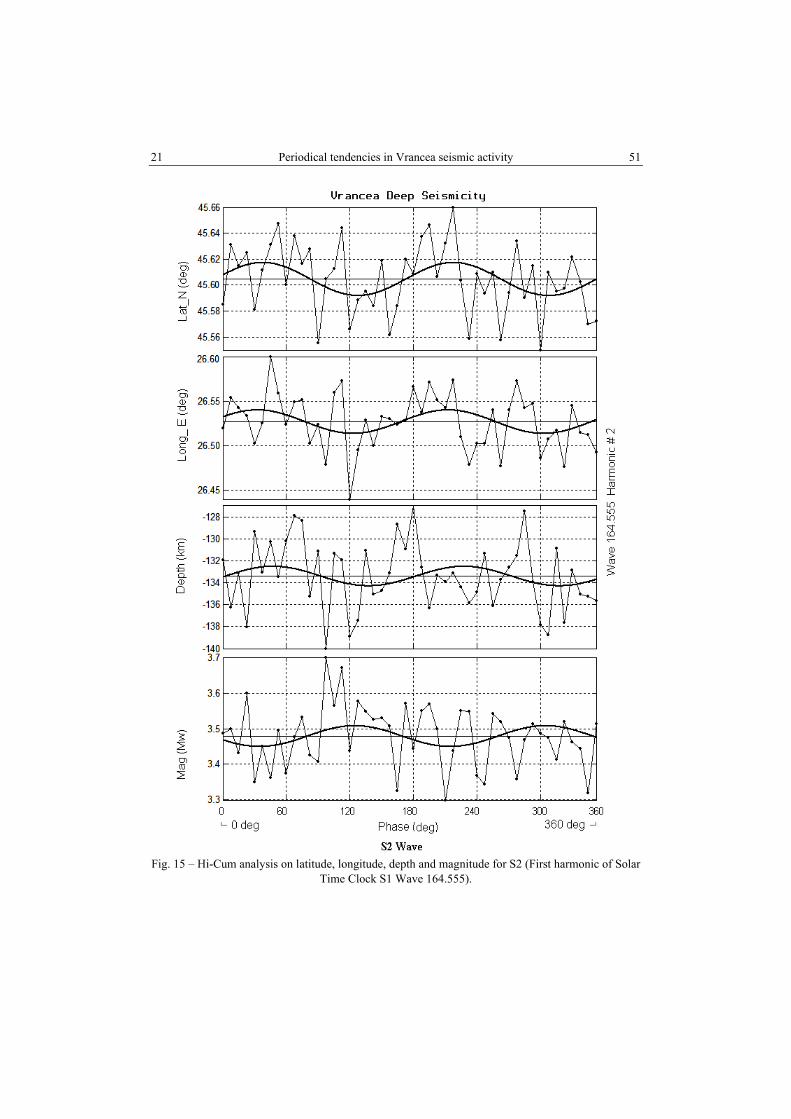
Hi-Cum analysis using S2 was then applied to study any location effects on the occurrence of the earthquakes and the influence on the magnitude distribution also. The results are presented in Fig. 15.
Hi-Cum analysis on the main S2 wave also revealed a systematic tendency of the variations in the latitude, longitude and depth to be in phase, whilst the variation of the magnitude of the quake was inversed. It means that magnitude decrease when the other seismic parameters increase.
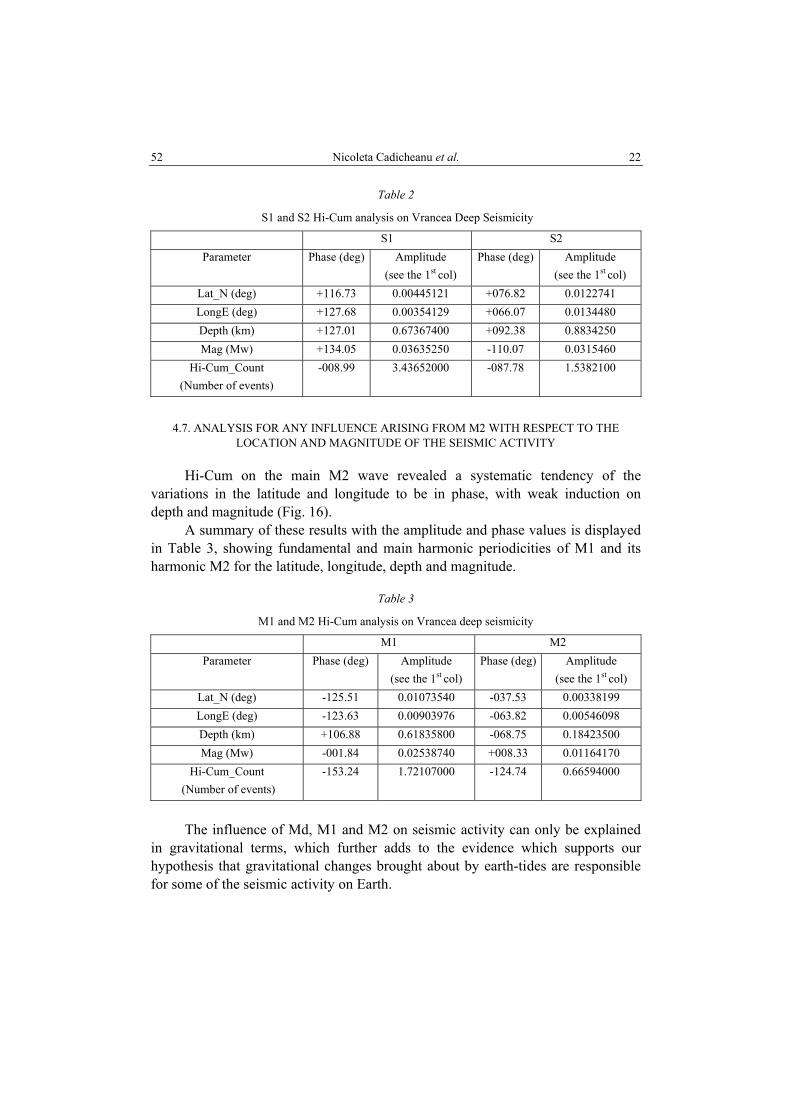
A summary of these results with the amplitude and phase values is displayed in Table 2 showing fundamental and main harmonic periodicities of S1 and its harmonic S2 for the latitude, longitude, depth and magnitude.
19 Periodical tendencies in Vrancea seismic activity
49
Fig. 13 – Hi-Cum analysis on M1 (Lunar Time Clock Wave 155.555) and its main harmonic, M2,
for the seismic activity.
Nicoleta Cadicheanu et al. 20
50
Fig. 14 – Comparison of the Hi-Cum on S1 (up) and M1 (down) applied to the magnitude (upper)
and the seismic activity (lower).
21 Periodical tendencies in Vrancea seismic activity
51
Fig. 15 – Hi-Cum analysis on latitude, longitude, depth and magnitude for S2 (First harmonic of Solar
Time Clock S1 Wave 164.555).
Nicoleta Cadicheanu et al. 22
52
Table 2
S1 and S2 Hi-Cum analysis on Vrancea Deep Seismicity
S1 S2 Parameter
Phase (deg) Amplitude
(see the 1st col) Phase (deg) Amplitude
(see the 1st col) Lat_N (deg) +116.73 0.00445121 +076.82 0.0122741 LongE (deg) +127.68 0.00354129 +066.07 0.0134480 Depth (km) +127.01 0.67367400 +092.38 0.8834250 Mag (Mw) +134.05 0.03635250 -110.07 0.0315460
Hi-Cum_Count (Number of events)
-008.99 3.43652000 -087.78 1.5382100
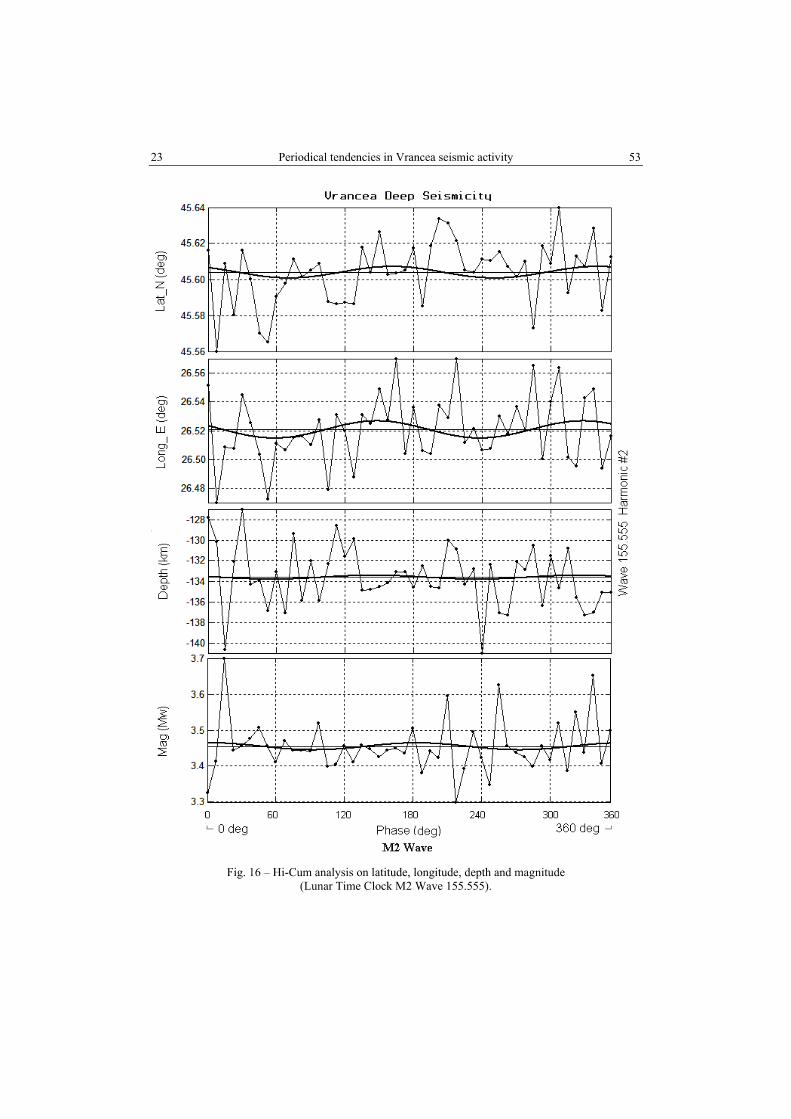
4.7. ANALYSIS FOR ANY INFLUENCE ARISING FROM M2 WITH RESPECT TO THE LOCATION AND MAGNITUDE OF THE SEISMIC ACTIVITY
Hi-Cum on the main M2 wave revealed a systematic tendency of the variations in the latitude and longitude to be in phase, with weak induction on depth and magnitude (Fig. 16).
A summary of these results with the amplitude and phase values is displayed in Table 3, showing fundamental and main harmonic periodicities of M1 and its harmonic M2 for the latitude, longitude, depth and magnitude.
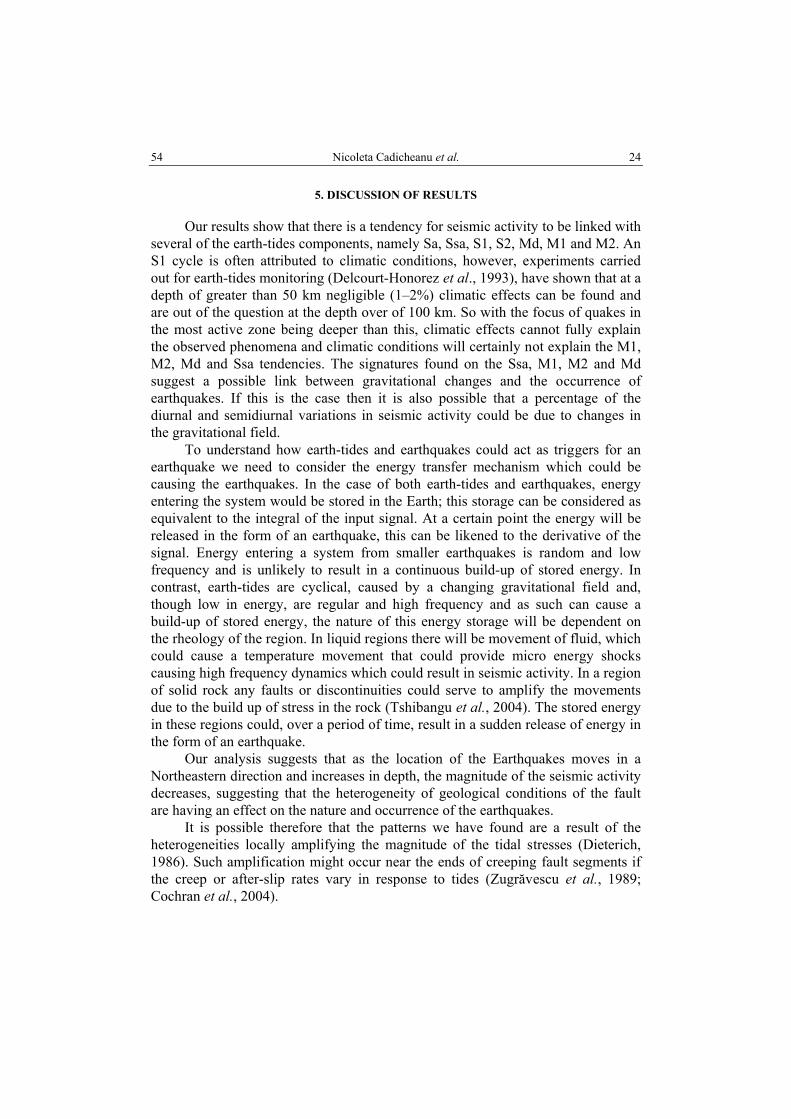
Table 3
M1 and M2 Hi-Cum analysis on Vrancea deep seismicity
M1 M2 Parameter
Phase (deg) Amplitude
(see the 1st col) Phase (deg) Amplitude
(see the 1st col) Lat_N (deg) -125.51 0.01073540 -037.53 0.00338199 LongE (deg) -123.63 0.00903976 -063.82 0.00546098 Depth (km) +106.88 0.61835800 -068.75 0.18423500 Mag (Mw) -001.84 0.02538740 +008.33 0.01164170
Hi-Cum_Count (Number of events)
-153.24 1.72107000 -124.74 0.66594000
The influence of Md, M1 and M2 on seismic activity can only be explained
in gravitational terms, which further adds to the evidence which supports our hypothesis that gravitational changes brought about by earth-tides are responsible for some of the seismic activity on Earth.
23 Periodical tendencies in Vrancea seismic activity
53
Fig. 16 – Hi-Cum analysis on latitude, longitude, depth and magnitude
(Lunar Time Clock M2 Wave 155.555).
Nicoleta Cadicheanu et al. 24
54
5. DISCUSSION OF RESULTS
Our results show that there is a tendency for seismic activity to be linked with several of the earth-tides components, namely Sa, Ssa, S1, S2, Md, M1 and M2. An S1 cycle is often attributed to climatic conditions, however, experiments carried out for earth-tides monitoring (Delcourt-Honorez et al., 1993), have shown that at a depth of greater than 50 km negligible (1–2%) climatic effects can be found and are out of the question at the depth over of 100 km. So with the focus of quakes in the most active zone being deeper than this, climatic effects cannot fully explain the observed phenomena and climatic conditions will certainly not explain the M1, M2, Md and Ssa tendencies. The signatures found on the Ssa, M1, M2 and Md suggest a possible link between gravitational changes and the occurrence of earthquakes. If this is the case then it is also possible that a percentage of the diurnal and semidiurnal variations in seismic activity could be due to changes in the gravitational field.
To understand how earth-tides and earthquakes could act as triggers for an earthquake we need to consider the energy transfer mechanism which could be causing the earthquakes. In the case of both earth-tides and earthquakes, energy entering the system would be stored in the Earth; this storage can be considered as equivalent to the integral of the input signal. At a certain point the energy will be released in the form of an earthquake, this can be likened to the derivative of the signal. Energy entering a system from smaller earthquakes is random and low frequency and is unlikely to result in a continuous build-up of stored energy. In contrast, earth-tides are cyclical, caused by a changing gravitational field and, though low in energy, are regular and high frequency and as such can cause a build-up of stored energy, the nature of this energy storage will be dependent on the rheology of the region. In liquid regions there will be movement of fluid, which could cause a temperature movement that could provide micro energy shocks causing high frequency dynamics which could result in seismic activity. In a region of solid rock any faults or discontinuities could serve to amplify the movements due to the build up of stress in the rock (Tshibangu et al., 2004). The stored energy in these regions could, over a period of time, result in a sudden release of energy in the form of an earthquake.
Our analysis suggests that as the location of the Earthquakes moves in a Northeastern direction and increases in depth, the magnitude of the seismic activity decreases, suggesting that the heterogeneity of geological conditions of the fault are having an effect on the nature and occurrence of the earthquakes.
It is possible therefore that the patterns we have found are a result of the heterogeneities locally amplifying the magnitude of the tidal stresses (Dieterich, 1986). Such amplification might occur near the ends of creeping fault segments if the creep or after-slip rates vary in response to tides (Zugrăvescu et al., 1989; Cochran et al., 2004).
25 Periodical tendencies in Vrancea seismic activity
55
6. CONCLUSION
An analysis of a databank of over 2000 earthquakes which occurred in Romania between 1982 and 2004 shows a tendency for the seismic activity to be linked to gravitational effects of the Sa, S1, M1 and theirs first harmonics as the Earth rotates through the Sun’s and Moon’s gravitational fields.
In this paper we did not try to explain the causes of the observed correlations between different components of the earth-tides and seismic activity or its parameters. We just pointed this aspect and suggest taking it into account in the physical modulation problem of a seismic zone.
The variety of the gradients which characterize such a zone (rigidity, heterogeneity, fluid circulations) could play a very important function under the modulation influences of the earth-tides.
In addition, the correlation of earthquakes with earth-tides can be explained if local heterogeneities are amplifying the magnitude of the tidal stresses.
The results indicate that more detailed work should be carried out with particular attention being paid to the geodynamical implications.
Acknowledgments. We would like to thank to the bilateral cooperation between Belgium and Romania within the framework of European Project CIPA-CT-93-186 for allowing us to optimise the conditions in which we could finalize our work. This project would not have been possible without their kind support.
REFERENCES
BAZACLIU, O., RADULIAN, M. (1999), Seismicity Variations in Depth and Time in the Vrancea (Romania) Subcrustal Region. Natural Hazards, 19, 165–177.
COCHRAN, E.S., VIDALE, J.E., TANAKA, SACHIKO (2004), Earth Tides can trigger shallow thrust fault earthquakes. Science, 306, 1164–1166.
CONSTANTINESCU, L., ENESCU, D. (1984), A tentative approach to possibly explaining the occurrence of the Vrancea earthquakes. Rev. Roum. Géol., Géophys., Géogr., (Géophysique), 28, 19–33.
CSONTOS, L. (1995), Tertiary tectonic evolution of the Intra-Carpathian area: a review. Acta Vulcanologica, 7, 1–13.
DE BECKER, M., DUCARME, B., MELCHIOR, P., POITEVIN, C., VAN RUYMBEKE, M. (1987), Correlation between earth tide anomalies and tectonic features through heat flow. International Meeting on Geothermic and Geothermal Energy. Guaruja-SP, Brasil. August 10–14, 1986. Rev. Brasileira de Geofisica, 5, 197–203.
DE FREITAS, S.R.C., VAN RUYMBEKE, M., DUCARME, B. (1991), Software to model the tidal triggering for volcanic and seismic activities. Proceedings of the Workshop Geodynamical Instrumentation Applied to Volcanic Areas, Walferdange, oct.1–3, 1990. Cahiers du Centre Européen de Géodynamique et de Séismologie, 4, 353–361.
DE FREITAS, S.R.C., VAN RUYMBEKE, M., DUCARME, B., ASSUMPCAO, M. (1991), Correlation between earth gravity tides and seismic activity at João Câmara, Brazil. Proc. Workshop on Geodynamical Instrumentation Applied to Volcanic Areas, Walferdange, Oct.1–3, 1990. Cahiers du Centre Européen de Géodynamique et de Séismologie, 4, 363–378.
Nicoleta Cadicheanu et al. 26
56
DELCOURT-HONOREZ, M., DUCARME, B., VAN RUYMBEKE, M. (1993), Earth Tides as Related to Groundwater and Barometric Pressure. Proc. XII-th Int. Symp. Earth Tides, Beijing, August, 4–7, 1993. Science Press Beijing, New York., 169–180.
DIACONESCU, C., KNAPP, J., KELLER, G., STEPHENSON, V., MOCANU, V., RĂILEANU, V., MAŢENCO, L., PROEDEHL, C., HAUSER, F., DINU, C., WENZEL, F., HARDER, S. (2001), Intermediate depth seismicity in the Vrancea Zone of Romania: a geodynamic paradox. EOS, Trans.-Am. Geophys. Union, 82 (2001) F912.
DIETERICH, J.H. (1986), Nucleation and triggering of earthquake slip: effect of periodic stresses. Tectonophysics, 144 (1–3), 127–139.
ENESCU, D., ENESCU, B.D. (1999), Possible Cause-effect Relationships between Vrancea (Romania) Earthquakes and some Geophysical Phenomena. Natural Hazards, 19, 233–245.
GÎRBACEA, R., FRISCH, W. (1998), Slab in the wrong place: lower lithospheric mantle delamination in the last stage of the Eastern Carpathians subduction retreat. Geology, 26, 611– 614.
GUTENBERG, B., RICHTER, C.F. (1954), Seismicity of the Earth, 2nd ed. Princeton Univ. Press, Princeton, N.J.
HAUSER, F., RĂILEANU, V., FIELITZ, W., BĂLĂ, A., PRODEHL, C., POLONIC, G., SCHULZE, A. (2001), VRANCEA 99 – the crustal structure beneath the Southeastern Carpathians and Moesian Platform from a seismic refraction profile in Romania. Tectonophysics, 340, 233–256.
ISMAIL-ZADEH, A., MÜLLER, B., WENZEL, F. (2003), Modelling of descending slab evolution beneath the SE-Carpathians: implications for seismicity. Seventh Workshop “Non-Linear Dynamics and Earthquake Prediction”, 29 September – 12 October 2003.
LANDES, M., FIELITZ, W., HAUSER, F., POPA, M., CALIXTO Group (2004), 3-D upper crustal tomographic structure across the Vrancea seismic zone, Romania. Tectonophysics, 382 (2004), 85–102.
MELCHIOR, P. (1978), The Tides of the Planet Earth, Pergamon Press, New York. NEMCOK, M., POSPISIL, L., LEXA, J., DONELICK, R.A. (1998), Tertiary subduction and slab
break-off model of the Carpathian–Pannonian region. Tectonophysics, 295, 307–340. ONCESCU, M.C., BONJER, K.-P., RIZESCU, M. (1998), Weak and strong ground motion of
intermediate depth earthquakes from the Vrancea region. In: Wenzel, F., Lungu, D., Novak, O. (Eds.), Vrancea Earthquakes: Tectonics, Hazard and Risk Mitigation. Kluwer Academic Publishing, Dordrecht, Netherlands, 27–42.
STAVINSCHI, M., SOUCHAY, J. (2003), Some correlations between Earthquakes and Earth Tides. Acta Geod. Geoph. Hung., 38(1), 77–92.
TRIFU, C.I., RADULIAN, M. (1991a), Frequency magnitude distribution of earthquakes in Vrancea: relevance for a discrete model. J. Geophys. Res., 96, 4301–4311.
TRIFU, C.I., RADULIAN, M. (1991b), A depth-magnitude catalogue of Vrancea intermediate depth microearthquakes (1974–1991). Rev. Roum. Geol., Geophys., Geogr., (Geophysique), 35, 31–45.
TSHIBANGU, J-P., VAN RUYMBEKE, M., VANDYCKE, S., QUINIF, Y., CAMELBEECK, T. (2004), Studying underground motions in the Ramioul’s cave. Proceedings of the Congress Eurengeo, Springer Verlag, Liège, 614–623.
VAN RUYMBEKE, M., BEAUDUCEL, F., SOMERHAUSEN, A. (2001), The Environmental Data Acquisition System (EDAS) developed at the Royal Observatory of Belgium. Journal of the Geodetic Society of Japan, 47 (1), 40–46.
VAN RUYMBEKE, M., DUCARME, B., DE BECKER, M. (1981), Parameterization of the tidal triggering of earthquakes. B.I.M., 86, 5521–5544.
VAN RUYMBEKE, M., DUCARME, B., DE BECKER, M. (1983), An attempt to model the tidal triggering of earthquakes. 9-th Intern. Symp. Earth Tides, New York, O.R.B. Comm. S.A., n° 63, Géophys., n° 141, 47–57, Schweizerbart Buchhandlung, 651–66.
27 Periodical tendencies in Vrancea seismic activity
57
VAN RUYMBEKE, M., DUCARME, B., DE BECKER, M. (1983), Confirmation of the tidal influence on the Alaska-aleutian earthquakes. XVIII Assembly Proc. Eur. Seism. Comm., august 23–27, 1982, Zentralinstitut für Physik der Erde, Potsdam, 2, 388.
VAN RUYMBEKE, M., HOWARD, R., PÜTZ, P., BEAUDUCEL, F., SOMERHAUSEN, A., BARRIOT, J-P. (2003), An introduction to the use of HI-CUM for signal analysis. BIM, 138, 10955–10966.
VAN RUYMBEKE, M., SOMERHAUSEN, A. (1991), Some reflections about tidal triggering in volcanic zones. Proceedings of the Workshop Geodynamical Instrumentation Applied to Volcanic Areas, Walferdange, Oct. 1–3, 1990. Cahiers du Centre Européen de Géodynamique et de Séismologie, 4, 387–390.
ZUGRĂVESCU, D., FĂTULESCU, I., ENESCU, D., DANCHIV, D., HARADJA, O. (1989), Peculiarities of the correlation between gravity tides and earthquakes, Rev. roum. géol., géophys., géogr., (Géophysique), tome 33, 3–11.
*** Romanian Earthquake Catalogue ROMPLUS, Catalogue under continuous update, first published as: Oncescu, M.C., Mârza, V.I, Rizescu, M., Popa, M. (1999), The Romanian Earthquake Catalogue between 984-1997, in Vrancea Earthquakes: Tectonics, Hazard and Risk Mitigation, F. Wenzel, D. Lungu (eds.) & O. Novak (co-ed), pp. 43–47, Kluwer Academic Publishers, Dordrecht, Netherlands.
Received: September 1, 2005
Accepted for publication: March 27, 2006


![4[1].4central Tendencies](https://img.pdfslide.us/doc/110x75/5559d40ed8b42a93208b4d0a/414central-tendencies.jpg)