Embed Size (px)
Citation preview
HIGH-RESOLUTION
CLIMATE PROJECTIONS FOR VIETNAM
REGIONAL SUMMARY | SOUTH CENTRAL
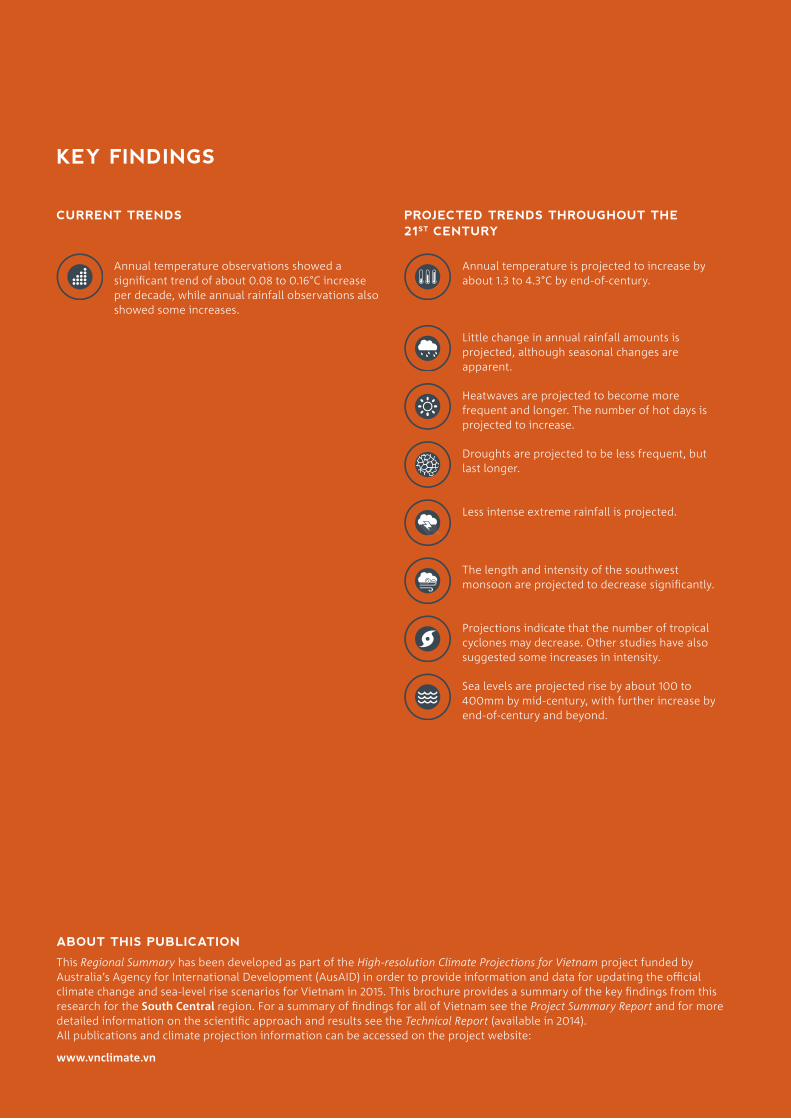
CURRENT TRENDS PROJECTED TRENDS THROUGHOUT THE 21ST CENTURY
Annual temperature observations showed a significant trend of about 0.08 to 0.16°C increase per decade, while annual rainfall observations also showed some increases.
Annual temperature is projected to increase by about 1.3 to 4.3°C by end-of-century.
Little change in annual rainfall amounts is projected, although seasonal changes are apparent.
Heatwaves are projected to become more frequent and longer. The number of hot days is projected to increase.
Droughts are projected to be less frequent, but last longer.
Less intense extreme rainfall is projected.
The length and intensity of the southwest monsoon are projected to decrease significantly.
Projections indicate that the number of tropical cyclones may decrease. Other studies have also suggested some increases in intensity.
Sea levels are projected rise by about 100 to 400mm by mid-century, with further increase by end-of-century and beyond.
KEY FINDINGS
ABOUT THIS PUBLICATION
This Regional Summary has been developed as part of the High-resolution Climate Projections for Vietnam project funded by Australia’s Agency for International Development (AusAID) in order to provide information and data for updating the official climate change and sea-level rise scenarios for Vietnam in 2015. This brochure provides a summary of the key findings from this research for the South Central region. For a summary of findings for all of Vietnam see the Project Summary Report and for more detailed information on the scientific approach and results see the Technical Report (available in 2014). All publications and climate projection information can be accessed on the project website:
www.vnclimate.vn
SO UTH CENTR AL 1
CLIMATE FEATURES1
• Annual average temperature: 25 to 27°C• Maximum temperature: 40 to 42°C• Minimum temperature: 8 to 13°C• Annual average rainfall: 1200 to 2000mm• Daily maximum rainfall: 300 to 500mm• Rainfall season: Aug to Dec
The station trend analyses (below) are based upon all available data within the last 50 years (1961–2010).
ANNUAL TEMPERATURE HAS INCREASED
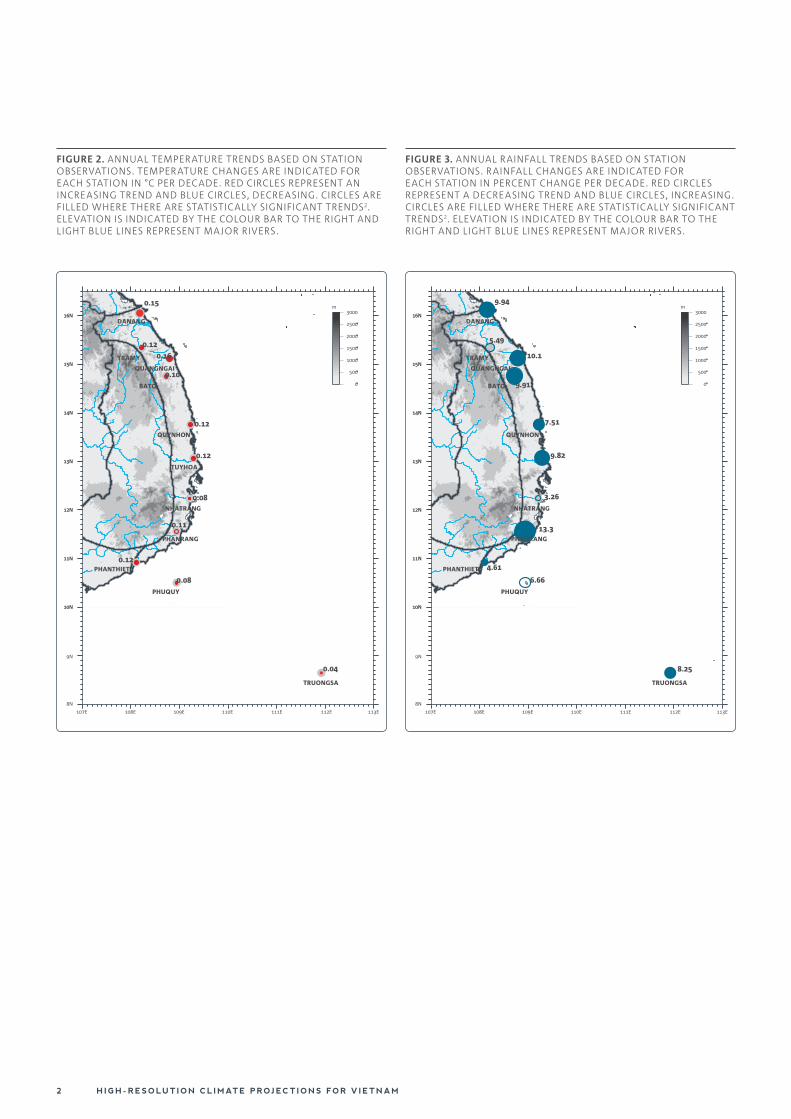
Temperature in this region has significantly2 increased by approximately 0.08 to 0.16°C per decade (Figure 2). Note that only the trend at the Phan Rang station is not significant.
MINIMUM TEMPERATURE HAS INCREASED MORE THAN MAXIMUM TEMPERATURE
While minimum daily temperature has increased significantly by up to approximately 0.36°C per decade, the change in maximum daily temperature is small and not significant for most parts of this region.
MORE HOT DAYS AND NO CHANGES IN COLD NIGHTS
The number of hot days3 has increased significantly by up to 4 days per decade at two stations. The number of cold nights4 at the northern stations remains unchanged.
ANNUAL RAINFALL HAS INCREASED
Station observations for annual rainfall have shown mostly increases for this region of up to approximately 13% at the Phan Rang station in the south (Figure 3). Note that trends at Nha Trang (south) and Tra My (north) stations are not significant.
EXTREME RAINFALL AMOUNTS HAVE INCREASED
Annual maxima of 1-day and 5-day rainfall amounts and the number of very wet days have increased throughout this region. But only the increase in the number of very wet days, of up to 3 days per decade, is significant for all stations.
1 Nguyễn Đức Ngữ, Nguyễn Trọng Hiệu (2004). Khí hậu và tài nguyên khí hậu, NXB Nông nghiệp. Hà Nội.2 Statistical significance has been calculated using the Mann-Kendall test.
3 Hot days with temperatures above 35°C.
4 Cold nights with temperatures below 15°C.
CURRENT CLIMATE
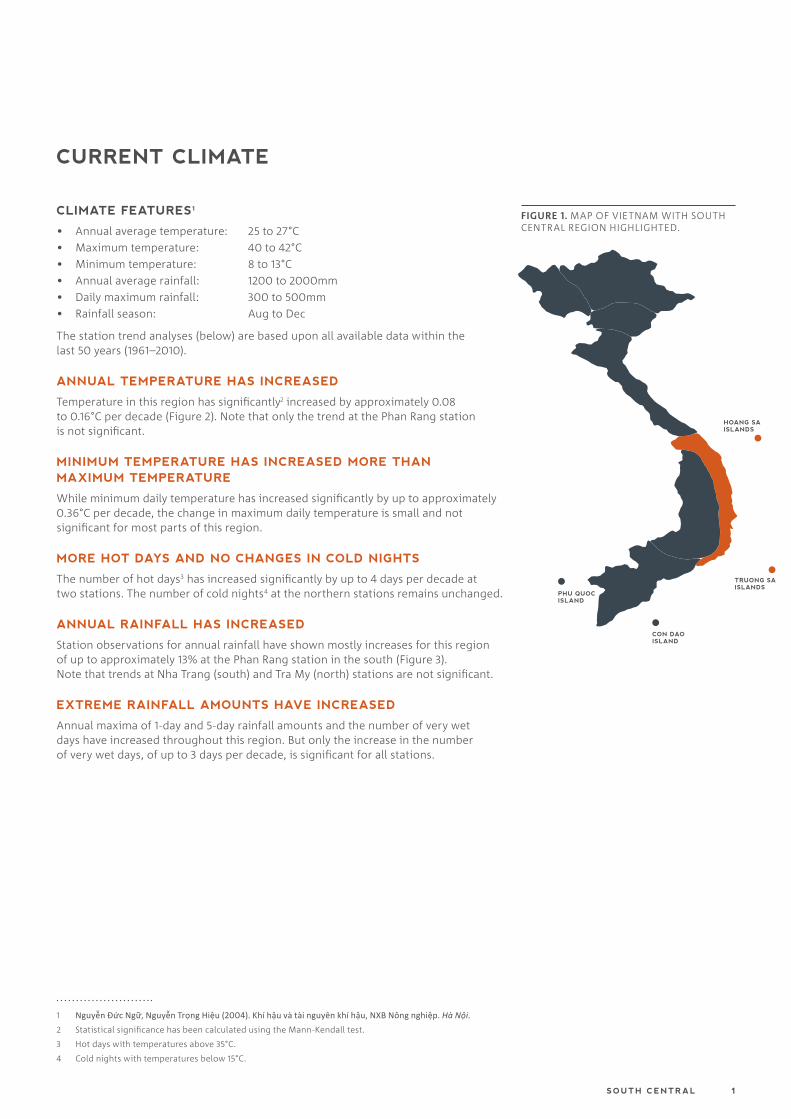
FIGURE 1. MAP OF VIETNAM WITH SOUTH CENTRAL REGION HIGHLIGHTED.
HOANG SA ISLANDS
CON DAO ISLAND
PHU QUOC ISLAND
TRUONG SA ISLANDS
H I G H - R ESO LUT I O N CL I MATE PROJ ECT I O N S FO R V I ETNAM2
FIGURE 2. ANNUAL TEMPERATURE TRENDS BASED ON STATION OBSERVATIONS. TEMPERATURE CHANGES ARE INDICATED FOR EACH STATION IN °C PER DECADE. RED CIRCLES REPRESENT AN INCREASING TREND AND BLUE CIRCLES, DECREASING. CIRCLES ARE FILLED WHERE THERE ARE STATISTICALLY SIGNIFICANT TRENDS2. ELEVATION IS INDICATED BY THE COLOUR BAR TO THE RIGHT AND LIGHT BLUE LINES REPRESENT MAJOR RIVERS.
FIGURE 3. ANNUAL RAINFALL TRENDS BASED ON STATION OBSERVATIONS. RAINFALL CHANGES ARE INDICATED FOR EACH STATION IN PERCENT CHANGE PER DECADE. RED CIRCLES REPRESENT A DECREASING TREND AND BLUE CIRCLES, INCREASING. CIRCLES ARE FILLED WHERE THERE ARE STATISTICALLY SIGNIFICANT TRENDS2. ELEVATION IS INDICATED BY THE COLOUR BAR TO THE RIGHT AND LIGHT BLUE LINES REPRESENT MAJOR RIVERS.
10N
11N
12N
13N
14N
15N
16N
TRAMY
DANANG
QUANGNGAI
NHATRANG
PHANRANG
PHANTHIET
BATO
QUYNHON
TUYHOA
PHUQUY
TRUONGSA
107E 108E 109E 110E 111E 112E 113E
0
500
1000
1500
2000
2500
3000m
10N
9N
8N
11N
12N
13N
14N
15N
16N
0.12
0.08
0.120.16
0.08
0.11
0.10
0.15
0.12
0.12
0.04
10N
11N
12N
13N
14N
15N
16NDANANG
TRUONGSA
107E 108E 109E 110E 111E 112E 113E
0
500
1000
1500
2000
2500
3000m
10N
9N
8N
11N
12N
13N
14N
15N
16N
9.94
8.25
5.49
10.1
3.26
13.3
4.61
9.91
7.51
9.82
6.66
TRAMY
QUANGNGAI
NHATRANG
PHANRANG
PHANTHIET
BATO
QUYNHON
PHUQUY
SO UTH CENTR AL 3
FUTURE CLIMATE
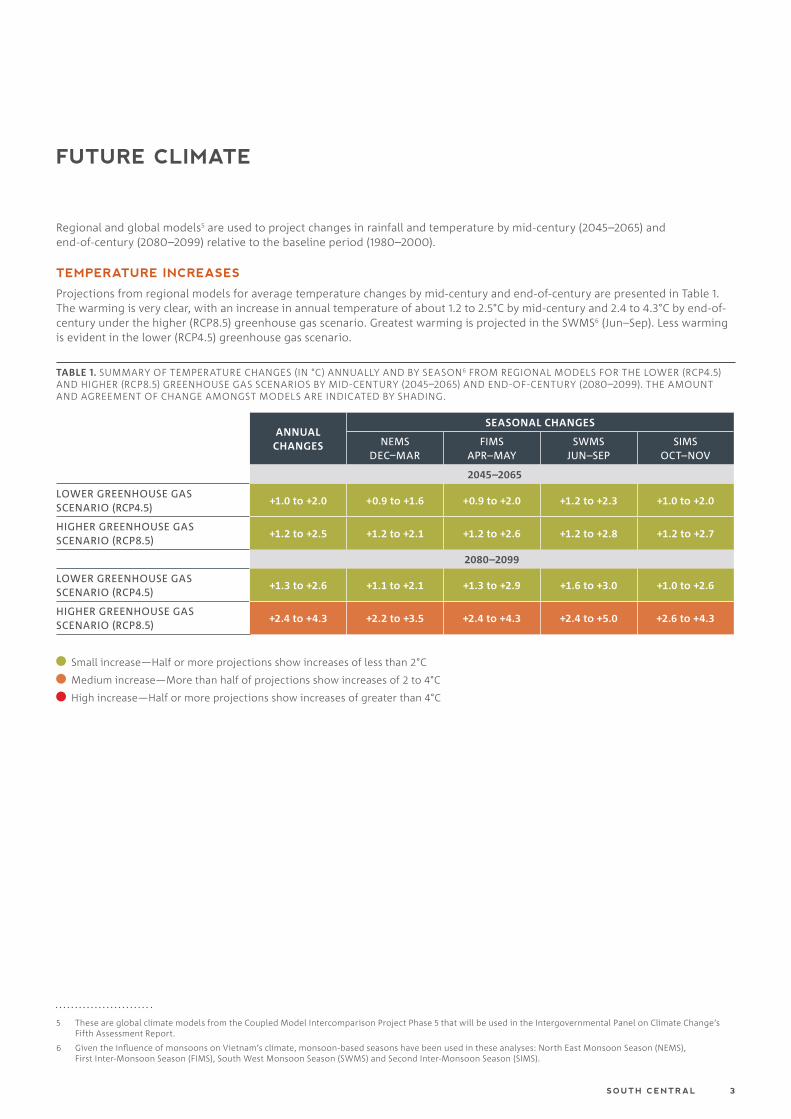
Regional and global models5 are used to project changes in rainfall and temperature by mid-century (2045–2065) and end-of-century (2080–2099) relative to the baseline period (1980–2000).
TEMPERATURE INCREASES
Projections from regional models for average temperature changes by mid-century and end-of-century are presented in Table 1. The warming is very clear, with an increase in annual temperature of about 1.2 to 2.5°C by mid-century and 2.4 to 4.3°C by end-of-century under the higher (RCP8.5) greenhouse gas scenario. Greatest warming is projected in the SWMS6 (Jun–Sep). Less warming is evident in the lower (RCP4.5) greenhouse gas scenario.
TABLE 1. SUMMARY OF TEMPERATURE CHANGES (IN °C) ANNUALLY AND BY SEASON6 FROM REGIONAL MODELS FOR THE LOWER (RCP4.5) AND HIGHER (RCP8.5) GREENHOUSE GAS SCENARIOS BY MID-CENTURY (2045–2065) AND END-OF-CENTURY (2080–2099). THE AMOUNT AND AGREEMENT OF CHANGE AMONGST MODELS ARE INDICATED BY SHADING.
ANNUAL CHANGES
SEASONAL CHANGES
NEMS DEC–MAR
FIMS APR–MAY
SWMS JUN–SEP
SIMS OCT–NOV
2045–2065
LOWER GREENHOUSE GAS SCENARIO (RCP4.5)
+1.0 to +2.0 +0.9 to +1.6 +0.9 to +2.0 +1.2 to +2.3 +1.0 to +2.0
HIGHER GREENHOUSE GAS SCENARIO (RCP8.5)
+1.2 to +2.5 +1.2 to +2.1 +1.2 to +2.6 +1.2 to +2.8 +1.2 to +2.7
2080–2099
LOWER GREENHOUSE GAS SCENARIO (RCP4.5)
+1.3 to +2.6 +1.1 to +2.1 +1.3 to +2.9 +1.6 to +3.0 +1.0 to +2.6
HIGHER GREENHOUSE GAS SCENARIO (RCP8.5)
+2.4 to +4.3 +2.2 to +3.5 +2.4 to +4.3 +2.4 to +5.0 +2.6 to +4.3
Small increase—Half or more projections show increases of less than 2°C
Medium increase—More than half of projections show increases of 2 to 4°C
High increase—Half or more projections show increases of greater than 4°C
5 These are global climate models from the Coupled Model Intercomparison Project Phase 5 that will be used in the Intergovernmental Panel on Climate Change’s Fifth Assessment Report.
6 Given the influence of monsoons on Vietnam’s climate, monsoon-based seasons have been used in these analyses: North East Monsoon Season (NEMS), First Inter-Monsoon Season (FIMS), South West Monsoon Season (SWMS) and Second Inter-Monsoon Season (SIMS).
H I G H - R ESO LUT I O N CL I MATE PROJ ECT I O N S FO R V I ETNAM4
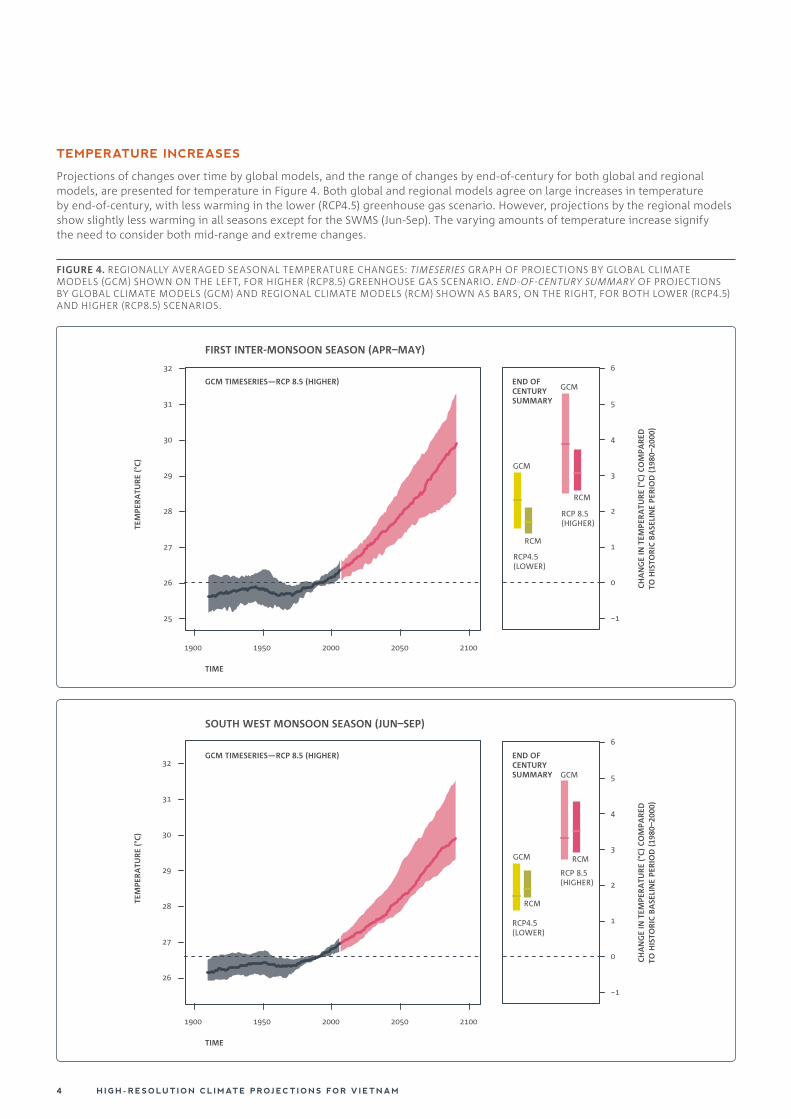
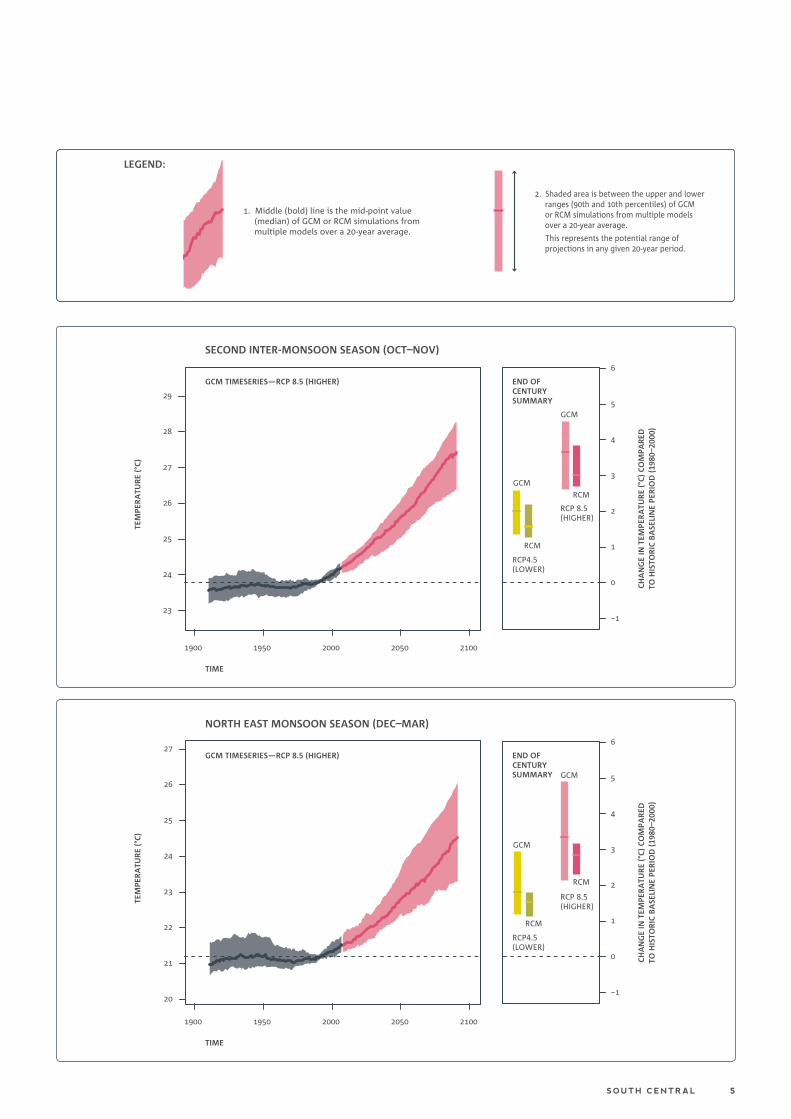
TEMPERATURE INCREASES
Projections of changes over time by global models, and the range of changes by end-of-century for both global and regional models, are presented for temperature in Figure 4. Both global and regional models agree on large increases in temperature by end-of-century, with less warming in the lower (RCP4.5) greenhouse gas scenario. However, projections by the regional models show slightly less warming in all seasons except for the SWMS (Jun-Sep). The varying amounts of temperature increase signify the need to consider both mid-range and extreme changes.
FIGURE 4. REGIONALLY AVERAGED SEASONAL TEMPERATURE CHANGES: TIMESERIES GRAPH OF PROJECTIONS BY GLOBAL CLIMATE MODELS (GCM) SHOWN ON THE LEFT, FOR HIGHER (RCP8.5) GREENHOUSE GAS SCENARIO. END-OF-CENTURY SUMMARY OF PROJECTIONS BY GLOBAL CLIMATE MODELS (GCM) AND REGIONAL CLIMATE MODELS (RCM) SHOWN AS BARS, ON THE RIGHT, FOR BOTH LOWER (RCP4.5) AND HIGHER (RCP8.5) SCENARIOS.
TIME
FIRST INTER-MONSOON SEASON (APR–MAY)
GCM TIMESERIES—RCP 8.5 (HIGHER)
TEM
PER
ATU
RE
(°C)
CHA
NG
E IN
TEM
PER
ATU
RE
(°C)
CO
MPA
RED
TO H
ISTO
RIC
BA
SELI
NE
PER
IOD
(19
80–2
000)
END OFCENTURYSUMMARY
RCM
RCP4.5(LOWER)
RCM
RCP 8.5(HIGHER)
GCM
GCM
1900 1950 2000 2050 2100
25
26
27
28
29
30
31
32
−1
0
1
2
3
4
5
6
TIME
SOUTH WEST MONSOON SEASON (JUN–SEP)
GCM TIMESERIES—RCP 8.5 (HIGHER)
TEM
PER
ATU
RE
(°C)
CHA
NG
E IN
TEM
PER
ATU
RE
(°C)
CO
MPA
RED
TO H
ISTO
RIC
BA
SELI
NE
PER
IOD
(19
80–2
000)
END OFCENTURYSUMMARY
RCM
RCM
RCP 8.5(HIGHER)
GCM
GCM
1900 1950 2000 2050 2100
−1
0
1
2
3
4
5
6
26
27
28
29
30
31
32
RCP4.5(LOWER)
SO UTH CENTR AL 5
LEGEND:
1. Middle (bold) line is the mid-point value (median) of GCM or RCM simulations from multiple models over a 20-year average.
2. Shaded is between the upper and lowerranges (90th and 10th percentiles) of GCMor RCM simulations from multiple modelsover a 20-year average.
This represents the potential range of projections in any given 20-year period.
23
24
25
26
27
28
29
TIME
SECOND INTER-MONSOON SEASON (OCT–NOV)
GCM TIMESERIES—RCP 8.5 (HIGHER)
TEM
PER
ATU
RE
(°C)
CHA
NG
E IN
TEM
PER
ATU
RE
(°C)
CO
MPA
RED
TO H
ISTO
RIC
BA
SELI
NE
PER
IOD
(19
80–2
000)
END OFCENTURYSUMMARY
RCM
RCM
RCP 8.5(HIGHER)
GCM
GCM
1900 1950 2000 2050 2100
−1
0
1
2
3
4
5
6
RCP4.5(LOWER)
20
21
22
23
24
25
26
27
TIME
NORTH EAST MONSOON SEASON (DEC–MAR)
GCM TIMESERIES—RCP 8.5 (HIGHER)
TEM
PER
ATU
RE
(°C)
CHA
NG
E IN
TEM
PER
ATU
RE
(°C)
CO
MPA
RED
TO H
ISTO
RIC
BA
SELI
NE
PER
IOD
(19
80–2
000)
END OFCENTURYSUMMARY
RCM
RCM
RCP 8.5(HIGHER)
GCM
GCM
1900 1950 2000 2050 2100
−1
0
1
2
3
4
5
6
RCP4.5(LOWER)
LEGEND:
1. Middle (bold) line is the mid-point value (median) of GCM or RCM simulations from multiple models over a 20-year average.
2. Shaded area is between the upper and lowerranges (90th and 10th percentiles) of GCMor RCM simulations from multiple modelsover a 20-year average.
This represents the potential range of projections in any given 20-year period.
H I G H - R ESO LUT I O N CL I MATE PROJ ECT I O N S FO R V I ETNAM6
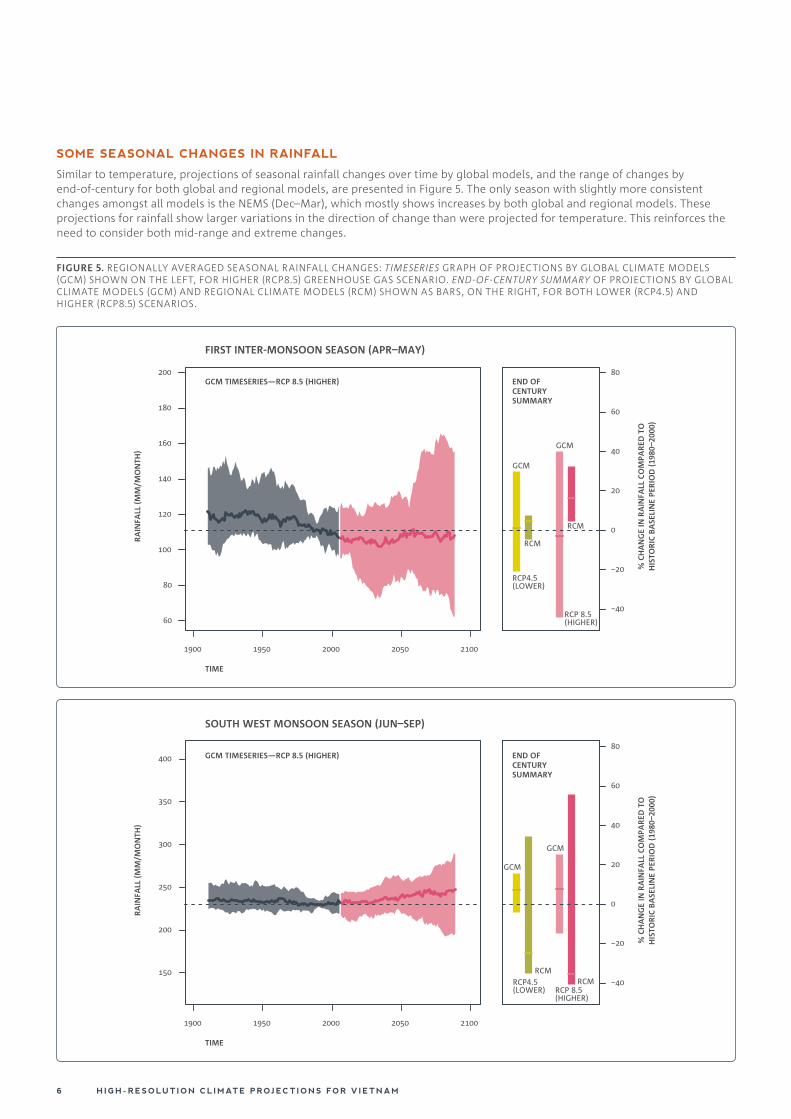
SOME SEASONAL CHANGES IN RAINFALL
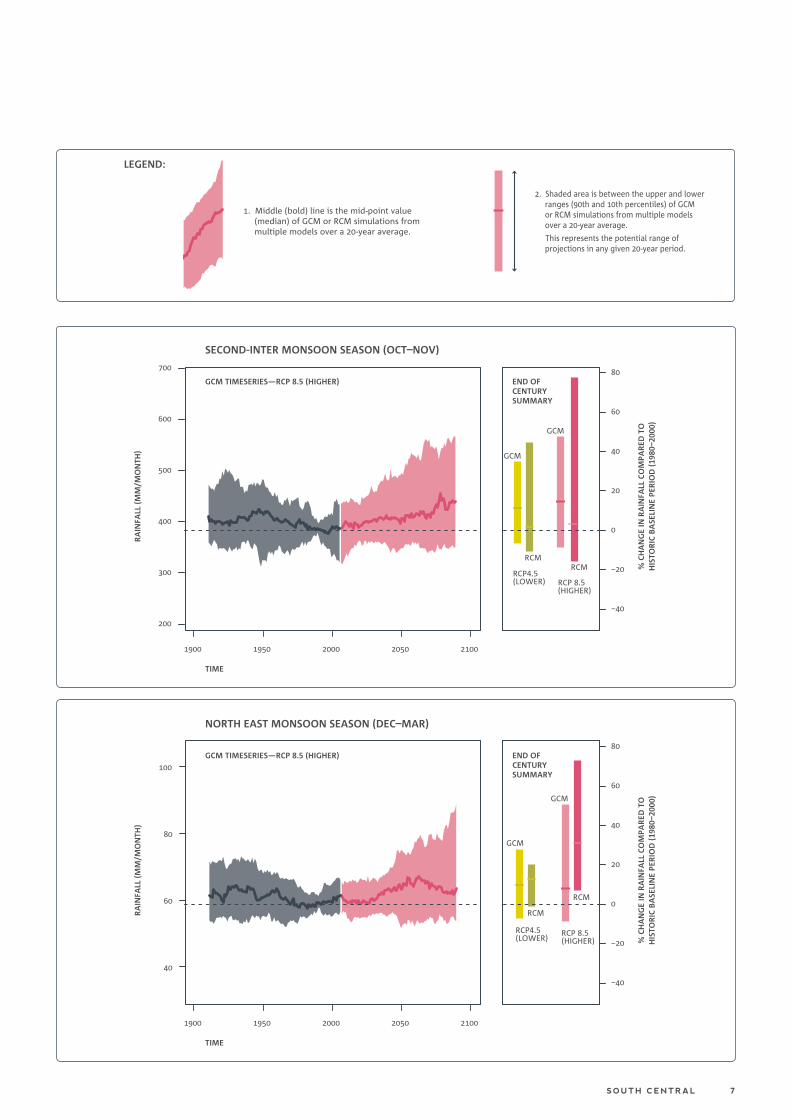
Similar to temperature, projections of seasonal rainfall changes over time by global models, and the range of changes by end-of-century for both global and regional models, are presented in Figure 5. The only season with slightly more consistent changes amongst all models is the NEMS (Dec–Mar), which mostly shows increases by both global and regional models. These projections for rainfall show larger variations in the direction of change than were projected for temperature. This reinforces the need to consider both mid-range and extreme changes.
FIGURE 5. REGIONALLY AVERAGED SEASONAL RAINFALL CHANGES: TIMESERIES GRAPH OF PROJECTIONS BY GLOBAL CLIMATE MODELS (GCM) SHOWN ON THE LEFT, FOR HIGHER (RCP8.5) GREENHOUSE GAS SCENARIO. END-OF-CENTURY SUMMARY OF PROJECTIONS BY GLOBAL CLIMATE MODELS (GCM) AND REGIONAL CLIMATE MODELS (RCM) SHOWN AS BARS, ON THE RIGHT, FOR BOTH LOWER (RCP4.5) AND HIGHER (RCP8.5) SCENARIOS.
TIME
FIRST INTER-MONSOON SEASON (APR–MAY)
RCP4.5(LOWER)
RCM
1900 1950 2000 2050 2100
END OFCENTURYSUMMARY
GCM TIMESERIES—RCP 8.5 (HIGHER)
RA
INFA
LL (
MM
/MO
NTH
)
% C
HA
NG
E IN
RA
INFA
LL C
OM
PAR
ED T
OH
ISTO
RIC
BA
SELI
NE
PER
IOD
(19
80–2
000)
60
80
100
120
140
160
180
200
−40
−20
0
20
40
60
80
GCM
GCM
RCP 8.5(HIGHER)
RCM
TIME
SOUTH WEST MONSOON SEASON (JUN–SEP)
RCP4.5(LOWER)
1900 1950 2000 2050 2100
END OFCENTURYSUMMARY
GCM TIMESERIES—RCP 8.5 (HIGHER)
RA
INFA
LL (
MM
/MO
NTH
)
% C
HA
NG
E IN
RA
INFA
LL C
OM
PAR
ED T
OH
ISTO
RIC
BA
SELI
NE
PER
IOD
(19
80–2
000)
−40
−20
0
20
40
60
80
150
200
250
300
350
400
GCM
GCM
RCP 8.5(HIGHER)
RCMRCM
SO UTH CENTR AL 7
TIME
SECOND-INTER MONSOON SEASON (OCT–NOV)
1900 1950 2000 2050 2100
END OFCENTURYSUMMARY
GCM TIMESERIES—RCP 8.5 (HIGHER)
RA
INFA
LL (
MM
/MO
NTH
)
% C
HA
NG
E IN
RA
INFA
LL C
OM
PAR
ED T
OH
ISTO
RIC
BA
SELI
NE
PER
IOD
(19
80–2
000)
−40
−20
0
20
40
60
80
200
300
400
500
600
700
GCM
GCM
RCP4.5(LOWER) RCP 8.5
(HIGHER)
RCMRCM
40
60
80
100
TIME
NORTH EAST MONSOON SEASON (DEC–MAR)
1900 1950 2000 2050 2100
END OFCENTURYSUMMARY
GCM TIMESERIES—RCP 8.5 (HIGHER)
RA
INFA
LL (
MM
/MO
NTH
)
% C
HA
NG
E IN
RA
INFA
LL C
OM
PAR
ED T
OH
ISTO
RIC
BA
SELI
NE
PER
IOD
(19
80–2
000)
−40
−20
0
20
40
60
80
GCM
GCM
RCP4.5(LOWER)
RCP 8.5(HIGHER)
RCM
RCM
LEGEND:
1. Middle (bold) line is the mid-point value (median) of GCM or RCM simulations from multiple models over a 20-year average.
2. Shaded area is between the upper and lowerranges (90th and 10th percentiles) of GCMor RCM simulations from multiple modelsover a 20-year average.
This represents the potential range of projections in any given 20-year period.
H I G H - R ESO LUT I O N CL I MATE PROJ ECT I O N S FO R V I ETNAM8
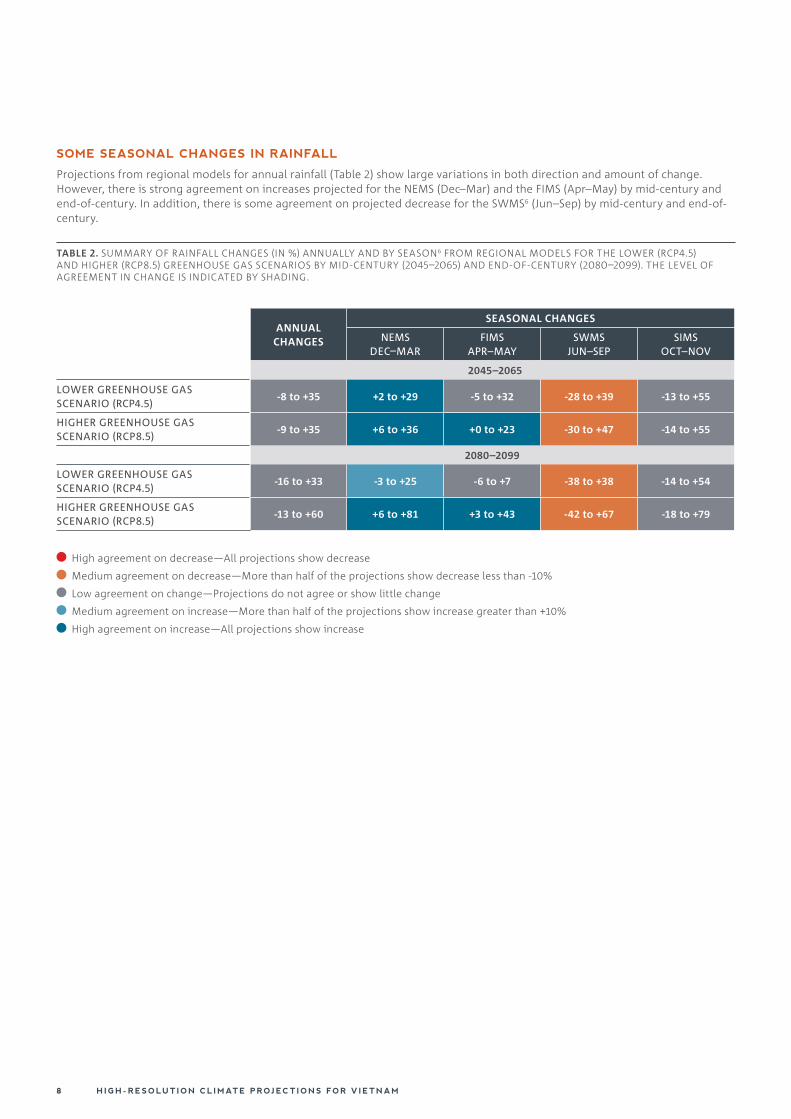
SOME SEASONAL CHANGES IN RAINFALL
Projections from regional models for annual rainfall (Table 2) show large variations in both direction and amount of change. However, there is strong agreement on increases projected for the NEMS (Dec–Mar) and the FIMS (Apr–May) by mid-century and end-of-century. In addition, there is some agreement on projected decrease for the SWMS6 (Jun–Sep) by mid-century and end-of-century.
TABLE 2. SUMMARY OF RAINFALL CHANGES (IN %) ANNUALLY AND BY SEASON6 FROM REGIONAL MODELS FOR THE LOWER (RCP4.5) AND HIGHER (RCP8.5) GREENHOUSE GAS SCENARIOS BY MID-CENTURY (2045–2065) AND END-OF-CENTURY (2080–2099). THE LEVEL OF AGREEMENT IN CHANGE IS INDICATED BY SHADING.
ANNUAL CHANGES
SEASONAL CHANGES
NEMS DEC–MAR
FIMS APR–MAY
SWMS JUN–SEP
SIMS OCT–NOV
2045–2065
LOWER GREENHOUSE GAS SCENARIO (RCP4.5)
-8 to +35 +2 to +29 -5 to +32 -28 to +39 -13 to +55
HIGHER GREENHOUSE GAS SCENARIO (RCP8.5)
-9 to +35 +6 to +36 +0 to +23 -30 to +47 -14 to +55
2080–2099
LOWER GREENHOUSE GAS SCENARIO (RCP4.5)
-16 to +33 -3 to +25 -6 to +7 -38 to +38 -14 to +54
HIGHER GREENHOUSE GAS SCENARIO (RCP8.5)
-13 to +60 +6 to +81 +3 to +43 -42 to +67 -18 to +79
High agreement on decrease—All projections show decrease
Medium agreement on decrease—More than half of the projections show decrease less than -10%
Low agreement on change—Projections do not agree or show little change
Medium agreement on increase—More than half of the projections show increase greater than +10%
High agreement on increase—All projections show increase
CLIMATE EXTREMES
Projected changes throughout the 21st century for a number of key climate extremes that affect this region are summarised below:
MORE AND LONGER HEATWAVES
The number and length of heatwaves (consecutive periods with hot conditions) are projected to increase by end-of-century.
INCREASE IN THE NUMBER OF HOT DAYS
The number of hot days (days with maximum temperatures above 35°C) is projected to increase by end-of-century.
LESS INTENSE EXTREME RAINFALL
Due to their rarity, changes in extreme rainfall events (annual maxima of 1-day and 5-day rainfall amounts) are not easy to project and are often associated with a large degree of uncertainty. Nevertheless, some regional projections show a tendency towards less intense extreme rainfall.
FEWER DROUGHTS, BUT LONGER
Some projections by regional models show that droughts (consecutive periods with a rainfall deficit) are expected to occur less often but may last longer.
SOUTHWEST MONSOON WEAKENS
Both the length and intensity of the southwest monsoon are expected to decrease significantly, based on some projections by regional models. By mid-century, the season length is projected to be reduced by about two weeks and rainfall is reduced by -40%. This trend continues until end-of-century.
FEWER BUT POSSIBLY MORE INTENSE TROPICAL CYCLONES (TYPHOONS)
Preliminary analysis of projections by regional models in this study suggests that the number of tropical cyclones may decrease in the East Vietnam Sea by mid-century. Other studies support this decreasing trend and suggest increases in intensity by end-of-century.
SEA LEVELS WILL CONTINUE TO RISE
The new projections indicate that the rate of sea-level rise during this century will be larger than the last. Sea levels rise approximately 100 to 400mm by mid-century with further increase by end-of-century and beyond. In addition, ground subsidence can occur in regions where there is ground water extraction or possible loss of sediment supply as rivers become more managed (i.e. more dams). These effects may be contributing to the substantially larger rates of relative sea-level rise at some locations.
CONTACT
VIETNAM INSTITUTE OF METEOROLOGY, HYDROLOGY AND ENVIRONMENTWEB http://www.imh.ac.vn/ Assoc. Prof. Dr. Nguyen Van ThangEMAIL [email protected] +84 - 4 - 38359415 For more information, please visit the project website: WWW.VNCLIMATE.VN


![Datasheet HCPV-301H-10 (Ver.1.0)...[ ] = 26.23 × RH+ 1032 RH [%] = 0.03812 × V out – 39.36 4 / 15 Version 1.0 / 2017 Relative Humidity Accuracy HCPV series sensor module is able](https://img.pdfslide.us/doc/110x75/5f488be3c70da032a936c5d0/datasheet-hcpv-301h-10-ver10-2623-rh-1032-rh-003812-.jpg)