Embed Size (px)
Citation preview
SPECIAL SECTION: CLIMATE CHANGE AND INDIA
CURRENT SCIENCE, VOL. 90, NO. 3, 10 FEBRUARY 2006 334
*For correspondence. (e-mail: [email protected])
High-resolution climate change scenarios for India for the 21st century K. Rupa Kumar*, A. K. Sahai, K. Krishna Kumar, S. K. Patwardhan, P. K. Mishra, J. V. Revadekar, K. Kamala and G. B. Pant Indian Institute of Tropical Meteorology, Pune 411 008, India
A state-of-art regional climate modelling system, known as PRECIS (Providing Regional Climates for Impacts Studies) developed by the Hadley Centre for Climate Prediction and Research, is applied for India to develop high-resolution climate change scenarios. The present-day simulation (1961–1990) with PRECIS is evaluated, including an examination of the impact of enhanced resolution and an identification of biases. The RCM is able to resolve features on finer scales than those re-solved by the GCM, particularly those related to im-proved resolution of the topography. The most notable advantage of using the RCM is a more realistic repre-sentation of the spatial patterns of summer monsoon rainfall such as the maximum along the windward side of the Western Ghats. There are notable quantitative biases in precipitation over some regions, mainly due to similar biases in the driving GCM. PRECIS simula-tions under scenarios of increasing greenhouse gas concentrations and sulphate aerosols indicate marked increase in both rainfall and temperature towards the end of the 21st century. Surface air temperature and rainfall show similar patterns of projected changes under A2 and B2 scenarios, but the B2 scenario shows slightly lower magnitudes of the projected change. The warming is monotonously widespread over the country, but there are substantial spatial differences in the projected rainfall changes. West central India shows maximum expected increase in rainfall. Extremes in maximum and minimum temperatures are also ex-pected to increase into the future, but the night tem-peratures are increasing faster than the day temperatures. Extreme precipitation shows substantial increases over a large area, and particularly over the west coast of India and west central India.
Keywords: Regional climate model, downscaling, re-gional climate projections, Indian climate, Indian monsoon. HUMAN activities since the beginning of the industrial revo-lution have led to unprecedented changes in the chemical composition of the earth’s atmosphere. We now have credible evidence to show that such changes have the potential to influence earth’s climate1, though it is difficult to clearly delineate the characteristics of climate change associated with natural and anthropogenic forcings due to complex
interactions within the climate system. Although meteoro-logical data compiled over the past century suggest that the earth is warming, there are significant differences at re-gional levels. Climate variations and change, caused by external forcings, may be partly predictable, particularly on the larger (e.g. continental, global) spatial scales. Because human activities, such as the emission of greenhouse gases or land-use change, do result in external forcing, it is be-lieved that the large-scale aspects of human-induced climate change are also partly predictable. However, the ability to actually do so is limited because we cannot accurately predict population change, economic policy, technological development, and other relevant characteristics of future human activity. In practice, therefore, one has to rely on care-fully constructed scenarios of human behaviour and deter-mine climate projections on the basis of such scenarios. The Third Assessment Report (TAR) of the IPCC (Inter-governmental Panel on Climate Change) notes that the current versions of atmosphere–ocean general circulation models (AOGCMs) have generally well simulated the features of the present-day climate at the large and conti-nental scale1. Though the large inter-model differences on a regional scale with the consequent uncertainties is a cause for concern, an encouraging sign is that the AOGCMs have been showing steady improvement over the recent past. The effects of climate change are expected to be greatest in the developing world, especially in countries reliant on primary production as a major source of income. One of the high priorities for narrowing gaps between cur-rent knowledge and policymaking needs is the quantita-tive assessment of the sensitivity, adaptive capacity and vulnerability to climate change, particularly in terms of the major agro-economic indicators in the developing countries. To systematically pursue such assessments, the most fundamental requirement is the availability of reli-able estimates of future climatic patterns on the regional scale, which can be readily used by different impact assess-ment groups. This needs a systematic validation of the climate model simulations and development of suitable regional climate change scenarios, estimations of the as-sociated uncertainties. Climate scenarios often make use of climate projections (descriptions of the modelled response of the climate system to scenarios of greenhouse gas and aerosol concentrations or some other hypothetical forcings on the climatic com-
SPECIAL SECTION: CLIMATE CHANGE AND INDIA
CURRENT SCIENCE, VOL. 90, NO. 3, 10 FEBRUARY 2006 335
ponents), by manipulating model outputs and combining them with observed climate data. Our current level of un-derstanding of the components of the climate system and their interactions has reached an advanced stage, with the availability of a hierarchy of coupled ocean–atmosphere–sea–ice–land–surface models to provide indicators of global response as well as possible regional patterns of climate change. A variety of experiments has been performed by different modelling groups in the world, to simulate the expected climate change patterns under different emission scenarios prepared under IPCC coordination. Prominent among the scenarios are the IS92a and SRES2, for which extensive model simulated data are made available to the climate change research community by the IPCC Data Distribution Centre (http://www.ipccddc.cru.uea.ac.uk/). While global atmosphere–ocean coupled models have provided good representations of the planetary scale fea-tures, their application to regional studies is limited by their coarse resolution (~300 km). For example, these models do not contain realistic topographical features like the Western Ghats along the west coast of India, and con-sequently fail to reproduce their predominant influence on the peninsular monsoon rainfall patterns3–5. Developing high resolution models on a global scale is not only compu-tationally prohibitively expensive for climate change simulations, but also suffers from the errors due to inade-quate representation of high-resolution climate processes worldwide. It is in this context that regional climate models (RCMs) provide an opportunity to dynamically down-scale global model simulations to superimpose the re-gional detail of specified regions. Developing high-resolution climate change scenarios helps in: (i) a realis-tic simulation of the current climate by taking into ac-count fine-scale features of the terrain etc.; (ii) more detailed predictions of future climate changes taking into account local features and responses; (iii) representation of the smaller islands and their unique features; (iv) bet-ter simulation and prediction of extreme climatic events; and (v) generation of detailed regional data to drive other region-specific models analysing local-scale impacts6. In the present paper, we present the results of regional climate model simulations for India, based on the second generation Hadley Centre regional climate model known as PRECIS (Providing Regional Climates for Impacts Studies). An evaluation of the model skills and biases is made by comparing with observed precipitation and tem-perature patterns with those in the baseline simulation. Future scenarios of the regional climate towards the end of the 21st century are also presented.
Data and analysis
The regional climate model PRECIS
PRECIS is an atmospheric and land surface model of lim-ited area and high resolution, which is locatable over any
part of the globe. Dynamical flow, the atmospheric sulphur cycle, clouds and precipitation, radiative processes, the land surface and the deep soil are all formulated, while the boundary conditions at the limits of the model’s do-main are required to be specified. PRECIS is forced at its lateral boundaries by the simulations of a high-resolution global model (HadAM3H) with a horizontal resolution of 150 km × 150 km, in the so-called ‘time slice’ experi-ments. HadAM3H is an atmosphere-only GCM which has been derived from the atmospheric component7 of HadCM3, the Hadley Centre’s state-of-the-art coupled model which has a horizontal resolution of 3.75° longi-tude by 2.5° latitude. The idea is that a high resolution atmosphere-only GCM can be used to obtain an improved regional-level simulation over specific periods of interest identified from the coupled model integration, as it is computationally too expensive to run these high resolu-tion GCMs themselves over century-long integrations. In the present experiments, two time slices, namely 1961–90 and 2071–2100, have been selected from 240-year long transient simulations8 (1860–2100) with HadCM3. Observed time-dependent fields of SST and sea-ice (HadISST1 data-set9) are used as lower boundary conditions in the control simulation with HadAM3H. In the climate change ex-periments, the HadCM3 SST anomaly is added to the ob-served data to use as the lower boundary forcing. Time-dependent greenhouse gas and aerosol concentrations are the same as those in the corresponding HadCM3 time slice, and initial atmospheric and land surface conditions are interpolated from HadCM3. HadAM3H has been fa-voured over HadCM3 for driving the RCMs, since it has a higher resolution and exhibits an improved control climate, especially with respect to the positioning of the storm tracks of the Northern Hemisphere10,11. Ensembles of three baseline simulations for the period 1961–1990, three simulations for the A2 future scenario (2071–2100) and one simulation for the B2 future scenario (2071–2100) have been run with HadAM3H and assessed12. PRECIS has been configured for a domain extending from about 1.5°N to 38°N and 56°E to 103°E. In the choice of an RCM domain, it is desirable to select a do-main that is both large enough so that the regional model can develop its own internal regional-scale circulations, but not too large that the climate of the RCM deviates significantly from the GCM in the centre of the domain. In the present case, it is presumed that the domain chosen is adequate to include almost all the regional-scale circu-lation mechanisms. Using a similar domain, the RCM was demonstrated to provide a realistic representation of the intraseasonal variability of the Indian summer mon-soon, responding to both the global forcing via the lateral boundary conditions and independent internal dynamics13. The horizontal resolution is 1.24° latitude × 1.88° lon-gitude in the driving GCM (HadAM3H) and 0.44° × 0.44° in the RCM (PRECIS). With a nominal resolution of 50 km versus 150 km, the RCM provides a more real-
SPECIAL SECTION: CLIMATE CHANGE AND INDIA
CURRENT SCIENCE, VOL. 90, NO. 3, 10 FEBRUARY 2006 336
istic representation of orographic features over South Asia. A more complete description of PRECIS is pro-vided by Jones et al.14. A one-way nesting procedure is used, with lateral boundary conditions for the RCM being specified by the GCM. The lateral boundary coupling oc-curs across a linearly-weighted 4-point buffer zone at each vertical level. The RCM is driven at its lateral boundaries by relaxing surface pressure (p*), the horizontal wind components (u and v on the 19 model levels) and cloud-conserved tem-perature and moisture variables (theta and qt on the 19 model levels) towards values interpolated in time from data saved every 6 hours from the GCM integration. Orographic heights in the RCM are equal to those in the GCM in the 4-point buffer zone, as well as the 4 rows/columns imme-diately within it (referred to as the 8-point buffer zone). Various surface boundary forcing fields are required to drive the RCM. Prescribed observed SSTs are obtained by temporal interpolation from monthly mean fields of the Hadley Centre 1° × 1° resolution HadISST1 dataset9. Future SSTs are obtained by adding the HadCM3 SST anomaly to the observed data. The land–sea mask and surface topography are derived from the US Navy 10-min resolution dataset, and spatially varying vegetation and soil properties for the land surface scheme are prescribed from the 1° × 1° climatology of Wilson and Hendersen-Sellers15. Initial conditions for the RCM (including at-mospheric prognostic variables, soil and canopy moisture contents, deep soil temperatures and snow amount) are interpolated from the GCM timestep corresponding to the start date of the RCM simulation. Simulations using PRECIS have been performed to generate the climate for present (1961–1990) and a future period (2071–2100) for two different socio-economic scenarios both characterized by regionally focused devel-opment but with priority to economic issues in one (A2 scenario) and to environmental issues in the other (B2 scenario). Three-member ensembles have been simulated for the baseline (1961–1990) and one simulation each has been made for A2 and B2 scenarios towards the end of the 21st century (2071–2100). The model simulations are performed with and without including sulphur cycle, to understand the role of regional patterns of sulphate aero-sols in climate change. However, the effect of black car-bon (soot) has not been included in the simulation experiments. Using the model output from these experi-ments, high-resolution climate change scenarios have been developed for various surface and upper air parame-ters of critical importance to the impact assessments.
Observed data
The basic data for the evaluation of baseline simulations of PRECIS have been taken from the Climatic Research Unit (CRU), University of East Anglia global gridded
data set16. For additional evaluation of the Indian part of the domain, the regional mean rainfall and surface tem-perature series from the homogeneous monthly data sets developed by the Indian Institute of Tropical Meteorol-ogy (IITM; http://www.tropmet.res.in) have been used. Details of these data sets are discussed by Pant and Rupa Kumar17.
Analysis of extremes
Climate change studies over the past few decades have mostly focused on the changes in mean values. However, it is now being increasingly recognized that the manifes-tations of such changes in the occurrence of extreme weather and climatic events, particularly on the regional and local scales, are of paramount importance in assessing the socio-economic impacts of climate change. Analyses of extremes requires daily data, primarily on surface tem-peratures and precipitation. Some global analyses of the extremes have been made with the available data18,19, but a clear picture of such changes with regional detail is yet to emerge. A major issue that comes up while assessing changes in extremes is to objectively define and quantify the various types of extremes in weather elements. The joint World Meteorological Organization Commission for Climatology (CCl)/World Climate Research Programme (WCRP) project on climate variability and predictability (CLIVAR) Expert team on Climate Change Detection, Monitoring and Indices (ETCCDMI) coordinated efforts to develop a suite of relevant indices and enable their global analyses through regional participation. In the pre-sent study, we use some of the indices developed by the ETCCDMI to evaluate the simulations of PRECIS in rep-resenting the extremes during the baseline period, and then examine the future projections of the extremes. The indices considered in this context are: (i) highest daily maximum temperature, (ii) lowest daily minimum tem-perature, (iii) highest 1-day precipitation and (iv) highest 5-day precipitation. The observed indices have been cal-culated based on daily data during the period 1961–90 over a well-spread network of 40 stations for the temperatures and 147 stations for precipitation. Identical parameters for the regional model simulations are also worked out, both for the baseline period and the future scenarios.
Global model projections of the climate over India
Assessments of the relative skills of a range of atmosphere–ocean coupled general circulation models (AOGCMs) are available concerning their ability to simulate the broad features of present-day observed surface climatological features. The large-scale tropical precipitation patterns in winter (DJF) and summer (JJAS) seasons, as simulated by several AOGCMs models have been examined earlier3–5,20.
SPECIAL SECTION: CLIMATE CHANGE AND INDIA
CURRENT SCIENCE, VOL. 90, NO. 3, 10 FEBRUARY 2006 337
While most models simulate the general migration of tropical rain belts from the austral summer to the boreal summer, some of them miss the rainfall maximum in the tropical Pacific Ocean. Apart from this, in the Indian monsoon context, the observed maximum rainfall during the monsoon season along the west coast of India and the north Bay of Bengal and adjoining northeast India is not quite realistically simulated in many models excepting HadCM3 and CSIRO and to some extent in DKRZ. This may possibly be linked to the coarse resolution of the models as the heavy rainfall over these regions is gener-ally in association with the steep orography. However, the annual cycle in the simulated precipitation averaged over the South Asian region (land and sea) showed re-markably similar patterns with the observed, though there are substantial quantitative biases. The annual surface air temperature patterns over the South Asian region when compared with the observed fields also show a general match of gross features. The models capture the gross features of the monsoon in terms of low rainfall amount coupled with high variability over northwest India. How-ever, some of the finer details of regional significance are not represented in some of the models; for instance, ECHAM4 fails to reproduce the rainfall minimum in the rain shadow region over eastern peninsula, while HadCM2 seems to underestimate the rainfall over the Indo-Gangetic plains4. The simulated monsoon rainfall patterns in these models differ from the observed patterns in some respects probably due to the obvious coarse resolution of the AOGCMs. The horizontal and vertical resolutions of the atmosphere in the AOGCMs appear to be strongly re-lated to the skill of the models on regional scale. Coupled atmosphere–ocean general circulation models indicate general warming and enhanced rainfall over India in a greenhouse gas increase scenario, the changes be-coming particularly conspicuous after the 2040s3–5,20,21. Inclusion of projected increases in sulphate aerosols damps the sensitivity of the regional climate to green-house gas increase, but the effect of the greenhouse gases still dominates the projected changes3. While there is considerable consensus in temperature projections, there is some disagreement among the models on rainfall changes3–5. In a study with four different GCMs, Douville et al.22 found a significant spread in the summer monsoon precipitation anomalies despite a general weakening of the monsoon circulation. They concluded that, for decades to come, the increase in the atmospheric water content could be more important than the increase in the land–sea thermal gradient for understanding the evolution of the monsoon precipitation. They found that the monsoon sen-sitivity to CO2 doubling is not only related to changes in the horizontal transport of water vapour, but also to changes in the precipitation efficiency, which depends on soil moisture. Therefore, the treatment of land surface hydrology in the GCMs is a critical factor in determining monsoon sensitivity.
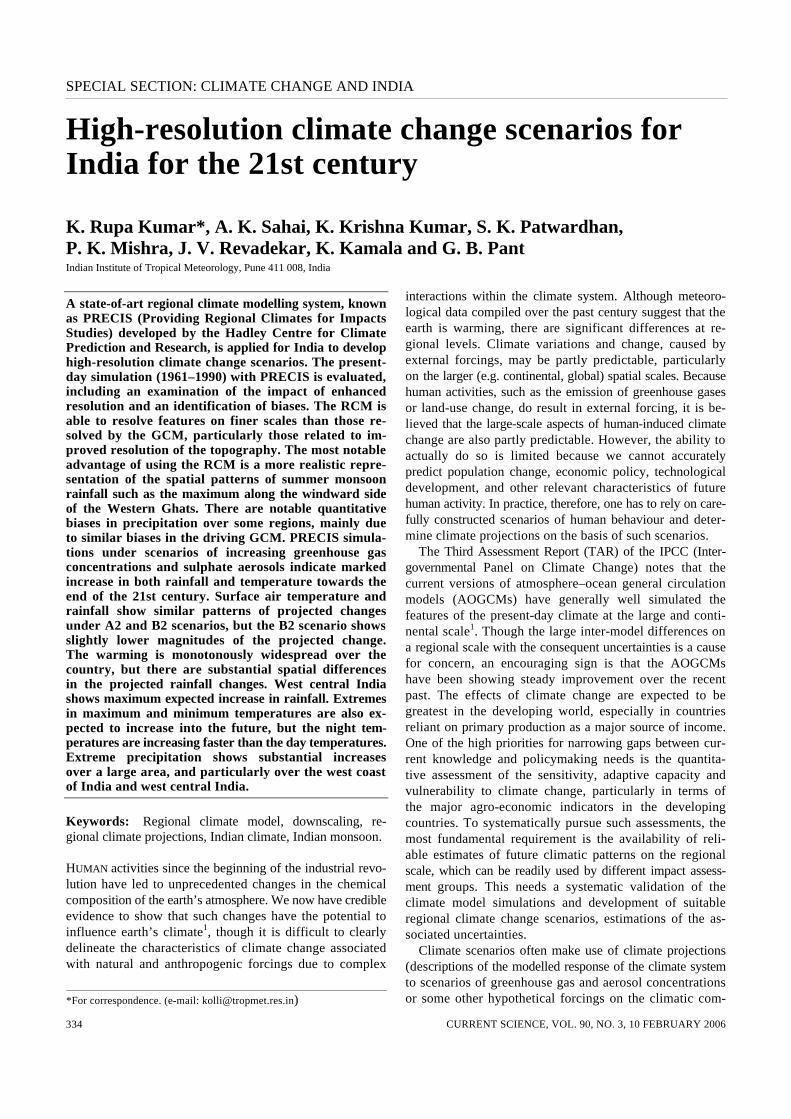
Considering all the land-points in India according to the resolution of each AOGCM, the arithmetic averages of rainfall and temperature fields are worked out to gen-erate country-level (all-India) monthly data for the entire duration of model simulations and for different experi-ments (Figure 1). GHG simulations with IS92a scenarios show marked increase in both rainfall and temperature by the end of 21st century relative to the baseline. There is a considerable spread among the models in the magnitudes of both precipitation and temperature projections, but more conspicuously in the case of summer monsoon rain-fall. The increase in rainfall from the baseline period (1961–90) to the end of 21st century ranges between 15 and 40% among the models. In case of mean annual tem-perature, the increase is much is of the order of 3 to 6ºC. At a glance one can realize that the change in rainfall in these two increased greenhouse gas simulations is not as high as that noted earlier in IS92a scenarios. Compared to A2 scenario, the B2 simulations show much subdued trends into the future. The temperature however shows comparable increasing trends in IS92a and A2 but B2 shows slightly lower trends. Most models project enhanced precipitation during the monsoon season, particularly over the northwestern parts of India. However, the magnitudes of projected change differ considerably from one model to the other. There is very little or no change noted in the monsoon rainfall over a major part of peninsular India. As far as the tem-perature trends into the future are concerned, all the mod-els show positive trends indicating widespread warming into the future. Examination of the spatial patterns of an-nual temperature changes in the two future time slices for different models indicates that the warming is more pro-nounced over the northern parts of India. The different models/experiments generally indicate the increase of temperature to be of the order of 2–5°C across the country. The warming is generally higher in IS92a scenario runs compared to A2 and B2 simulations. Also, the warming is more pronounced during winter and post-monsoon months compared to the rest of the year. Interestingly, this is a conspicuous feature of the observed temperature trends from the instrumental data analyses over India4,5. High-resolution GCMs are beginning to provide a more realistic representation of the extremes in daily precipitation during the Indian summer monsoon season, allowing the development of more reliable projections of short-duration precipitation characteristics such as extremes23,24. However, such projections are available only for a couple of models for a limited number of scenarios.
Evaluation of PRECIS simulations of Indian climate
The high-resolution regional simulations generated using PRECIS have been studied in detail to evaluate the model skills in representing the regional climatological features,
SPECIAL SECTION: CLIMATE CHANGE AND INDIA
CURRENT SCIENCE, VOL. 90, NO. 3, 10 FEBRUARY 2006 338
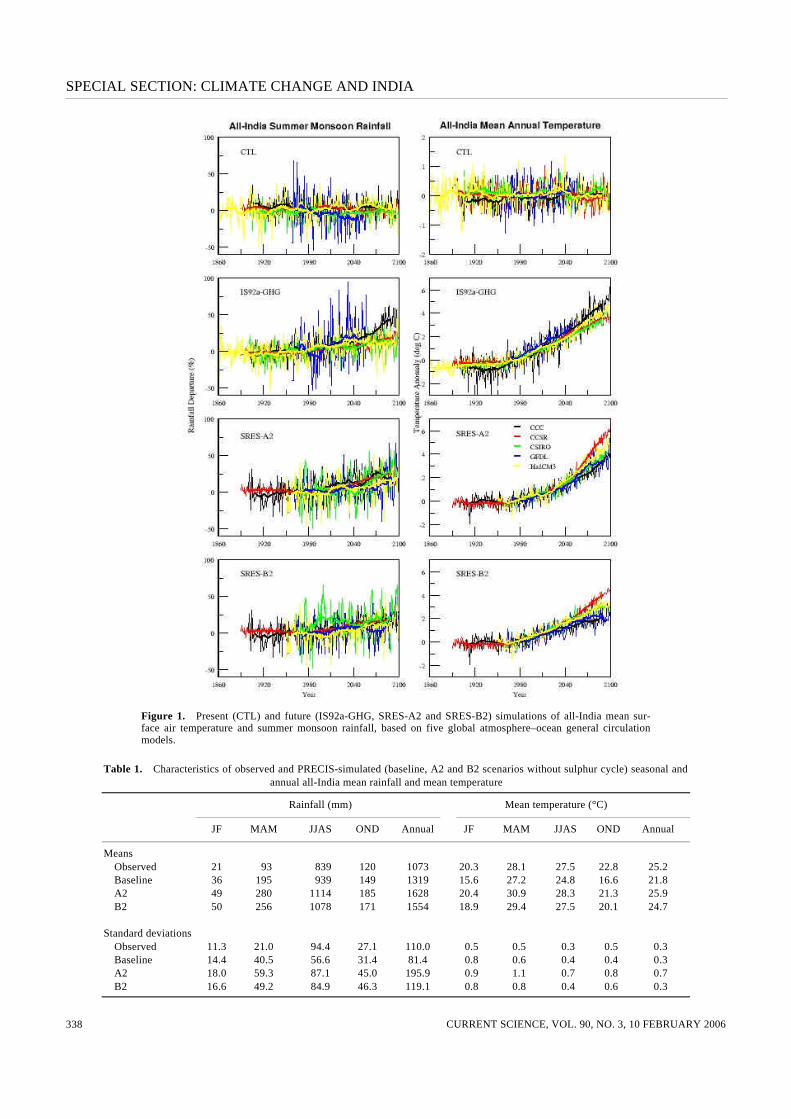
Figure 1. Present (CTL) and future (IS92a-GHG, SRES-A2 and SRES-B2) simulations of all-India mean sur-face air temperature and summer monsoon rainfall, based on five global atmosphere–ocean general circulation models.
Table 1. Characteristics of observed and PRECIS-simulated (baseline, A2 and B2 scenarios without sulphur cycle) seasonal and annual all-India mean rainfall and mean temperature
Rainfall (mm) Mean temperature (°C)
JF MAM JJAS OND Annual JF MAM JJAS OND Annual
Means Observed 21 93 839 120 1073 20.3 28.1 27.5 22.8 25.2 Baseline 36 195 939 149 1319 15.6 27.2 24.8 16.6 21.8 A2 49 280 1114 185 1628 20.4 30.9 28.3 21.3 25.9 B2 50 256 1078 171 1554 18.9 29.4 27.5 20.1 24.7 Standard deviations Observed 11.3 21.0 94.4 27.1 110.0 0.5 0.5 0.3 0.5 0.3 Baseline 14.4 40.5 56.6 31.4 81.4 0.8 0.6 0.4 0.4 0.3 A2 18.0 59.3 87.1 45.0 195.9 0.9 1.1 0.7 0.8 0.7 B2 16.6 49.2 84.9 46.3 119.1 0.8 0.8 0.4 0.6 0.3
SPECIAL SECTION: CLIMATE CHANGE AND INDIA
CURRENT SCIENCE, VOL. 90, NO. 3, 10 FEBRUARY 2006 339
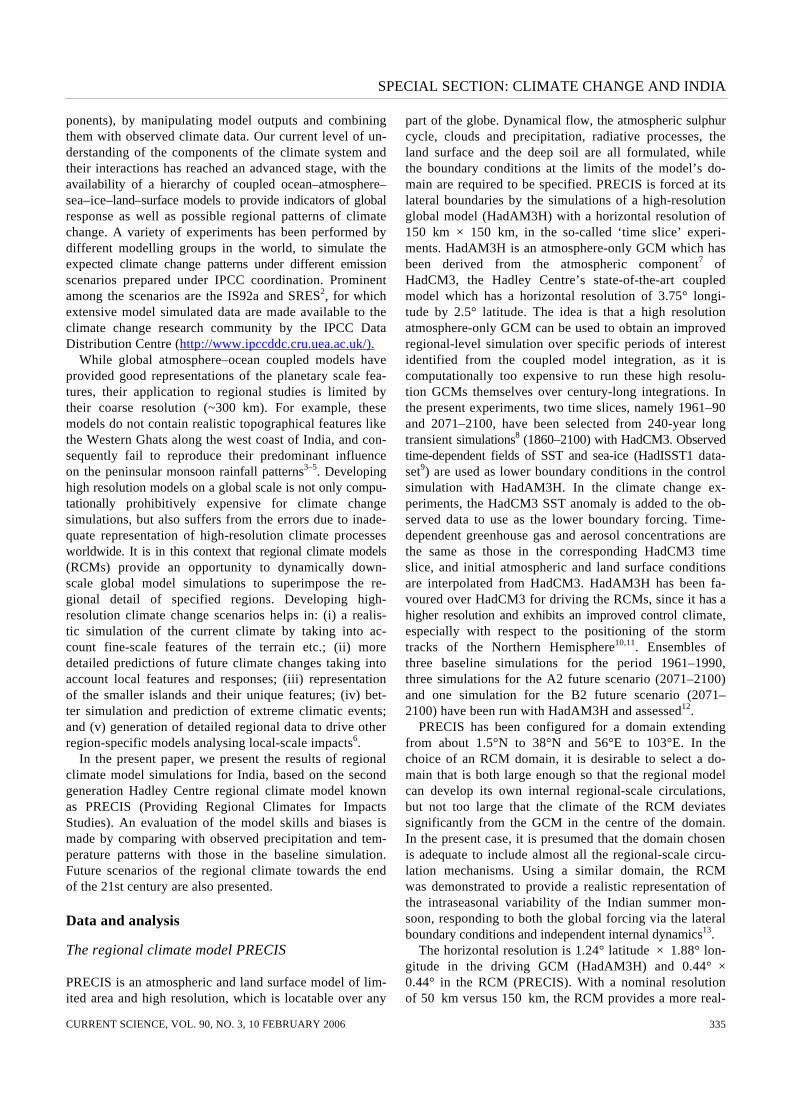
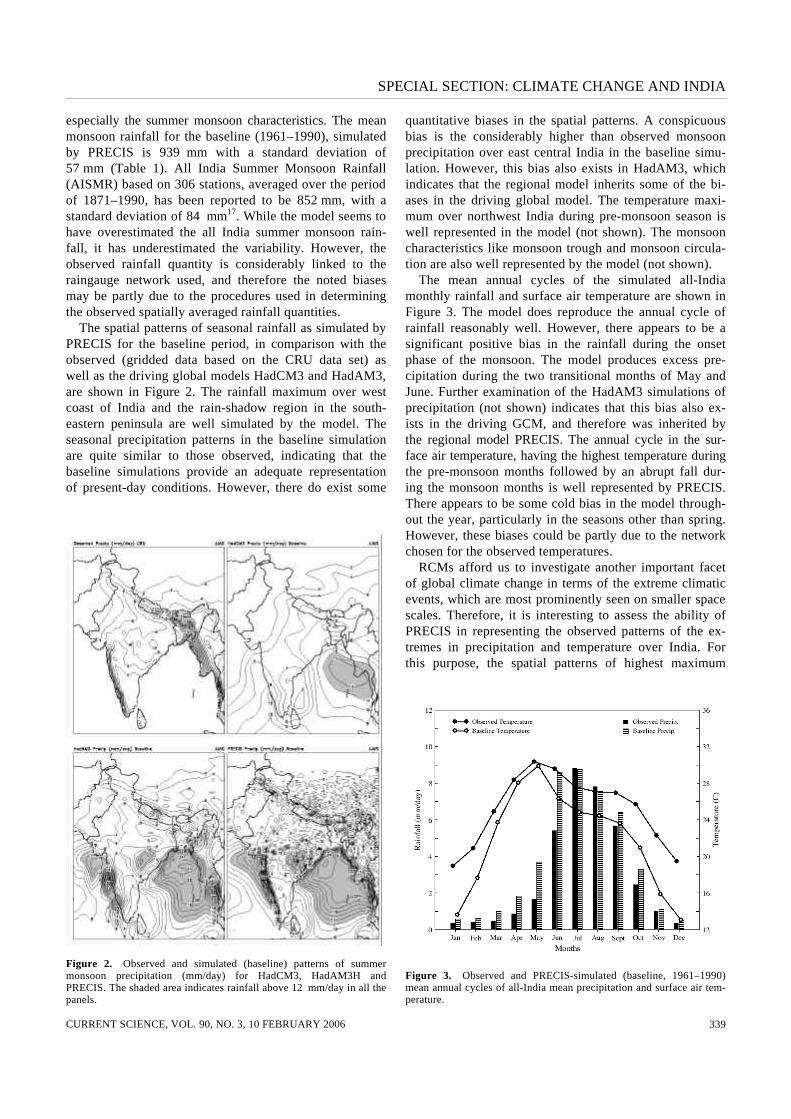
especially the summer monsoon characteristics. The mean monsoon rainfall for the baseline (1961–1990), simulated by PRECIS is 939 mm with a standard deviation of 57 mm (Table 1). All India Summer Monsoon Rainfall (AISMR) based on 306 stations, averaged over the period of 1871–1990, has been reported to be 852 mm, with a standard deviation of 84 mm17. While the model seems to have overestimated the all India summer monsoon rain-fall, it has underestimated the variability. However, the observed rainfall quantity is considerably linked to the raingauge network used, and therefore the noted biases may be partly due to the procedures used in determining the observed spatially averaged rainfall quantities. The spatial patterns of seasonal rainfall as simulated by PRECIS for the baseline period, in comparison with the observed (gridded data based on the CRU data set) as well as the driving global models HadCM3 and HadAM3, are shown in Figure 2. The rainfall maximum over west coast of India and the rain-shadow region in the south-eastern peninsula are well simulated by the model. The seasonal precipitation patterns in the baseline simulation are quite similar to those observed, indicating that the baseline simulations provide an adequate representation of present-day conditions. However, there do exist some
Figure 2. Observed and simulated (baseline) patterns of summer monsoon precipitation (mm/day) for HadCM3, HadAM3H and PRECIS. The shaded area indicates rainfall above 12 mm/day in all the panels.
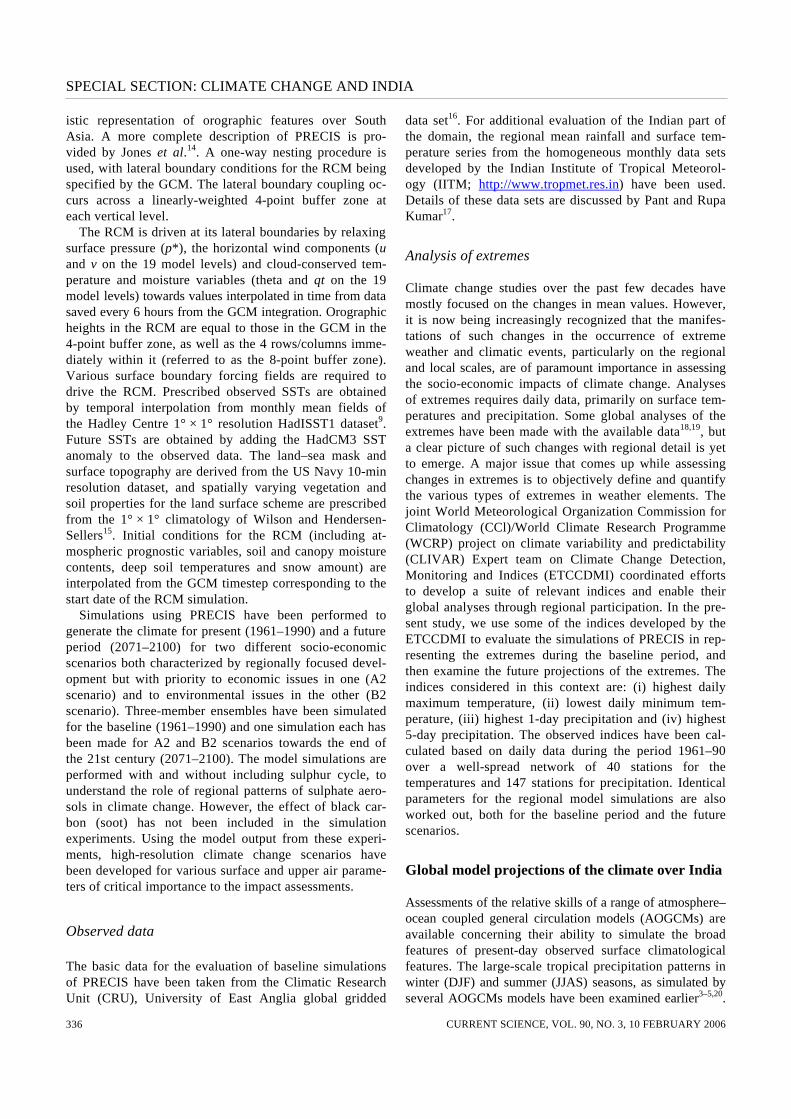
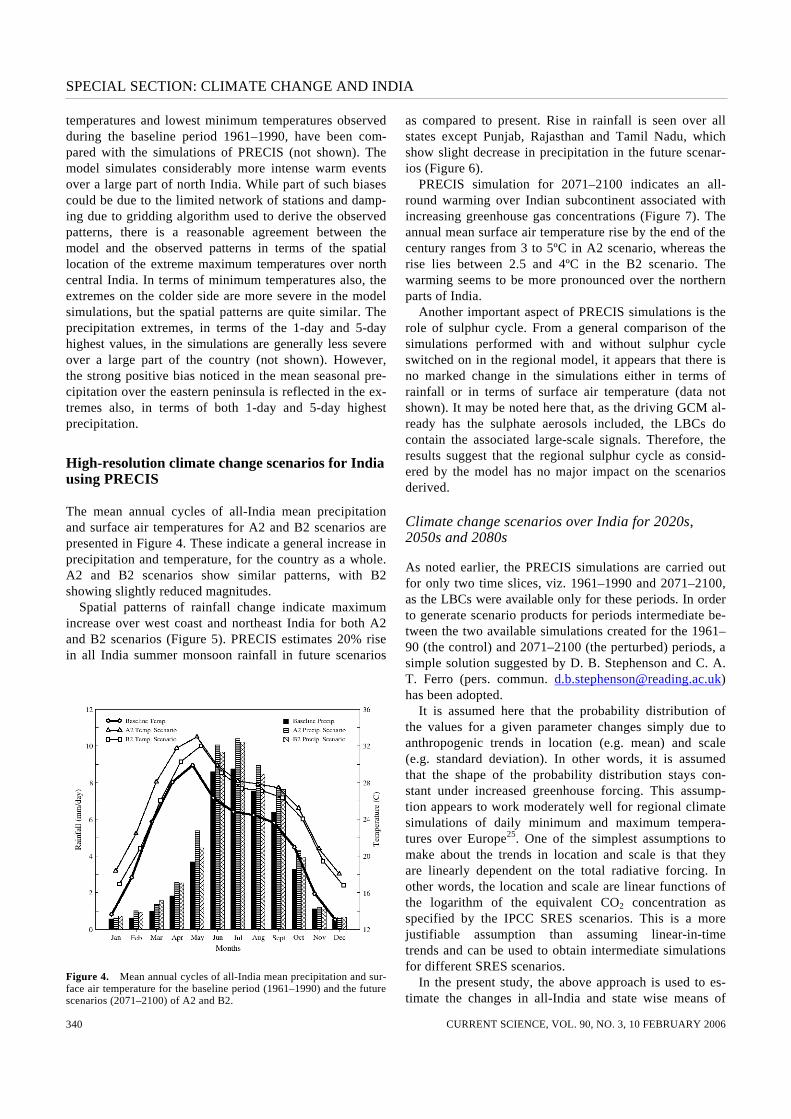
quantitative biases in the spatial patterns. A conspicuous bias is the considerably higher than observed monsoon precipitation over east central India in the baseline simu-lation. However, this bias also exists in HadAM3, which indicates that the regional model inherits some of the bi-ases in the driving global model. The temperature maxi-mum over northwest India during pre-monsoon season is well represented in the model (not shown). The monsoon characteristics like monsoon trough and monsoon circula-tion are also well represented by the model (not shown). The mean annual cycles of the simulated all-India monthly rainfall and surface air temperature are shown in Figure 3. The model does reproduce the annual cycle of rainfall reasonably well. However, there appears to be a significant positive bias in the rainfall during the onset phase of the monsoon. The model produces excess pre-cipitation during the two transitional months of May and June. Further examination of the HadAM3 simulations of precipitation (not shown) indicates that this bias also ex-ists in the driving GCM, and therefore was inherited by the regional model PRECIS. The annual cycle in the sur-face air temperature, having the highest temperature during the pre-monsoon months followed by an abrupt fall dur-ing the monsoon months is well represented by PRECIS. There appears to be some cold bias in the model through-out the year, particularly in the seasons other than spring. However, these biases could be partly due to the network chosen for the observed temperatures. RCMs afford us to investigate another important facet of global climate change in terms of the extreme climatic events, which are most prominently seen on smaller space scales. Therefore, it is interesting to assess the ability of PRECIS in representing the observed patterns of the ex-tremes in precipitation and temperature over India. For this purpose, the spatial patterns of highest maximum
Figure 3. Observed and PRECIS-simulated (baseline, 1961–1990) mean annual cycles of all-India mean precipitation and surface air tem-perature.
SPECIAL SECTION: CLIMATE CHANGE AND INDIA
CURRENT SCIENCE, VOL. 90, NO. 3, 10 FEBRUARY 2006 340
temperatures and lowest minimum temperatures observed during the baseline period 1961–1990, have been com-pared with the simulations of PRECIS (not shown). The model simulates considerably more intense warm events over a large part of north India. While part of such biases could be due to the limited network of stations and damp-ing due to gridding algorithm used to derive the observed patterns, there is a reasonable agreement between the model and the observed patterns in terms of the spatial location of the extreme maximum temperatures over north central India. In terms of minimum temperatures also, the extremes on the colder side are more severe in the model simulations, but the spatial patterns are quite similar. The precipitation extremes, in terms of the 1-day and 5-day highest values, in the simulations are generally less severe over a large part of the country (not shown). However, the strong positive bias noticed in the mean seasonal pre-cipitation over the eastern peninsula is reflected in the ex-tremes also, in terms of both 1-day and 5-day highest precipitation.
High-resolution climate change scenarios for India using PRECIS
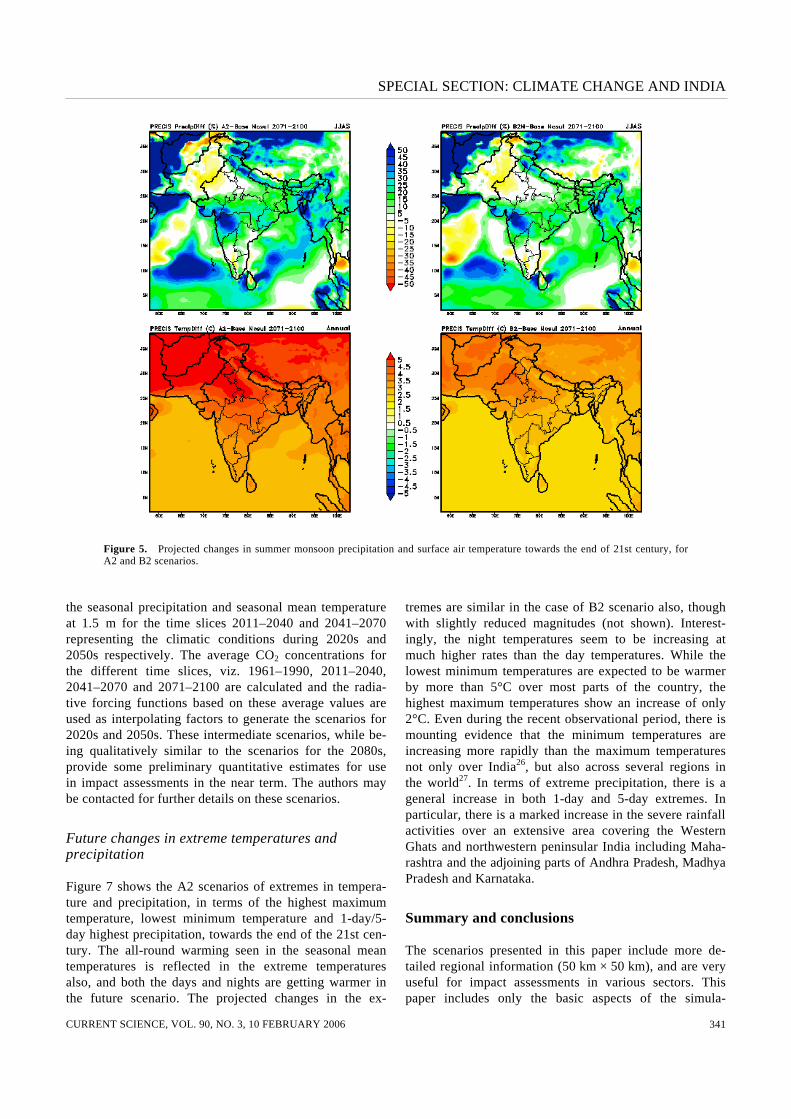
The mean annual cycles of all-India mean precipitation and surface air temperatures for A2 and B2 scenarios are presented in Figure 4. These indicate a general increase in precipitation and temperature, for the country as a whole. A2 and B2 scenarios show similar patterns, with B2 showing slightly reduced magnitudes. Spatial patterns of rainfall change indicate maximum increase over west coast and northeast India for both A2 and B2 scenarios (Figure 5). PRECIS estimates 20% rise in all India summer monsoon rainfall in future scenarios
Figure 4. Mean annual cycles of all-India mean precipitation and sur-face air temperature for the baseline period (1961–1990) and the future scenarios (2071–2100) of A2 and B2.
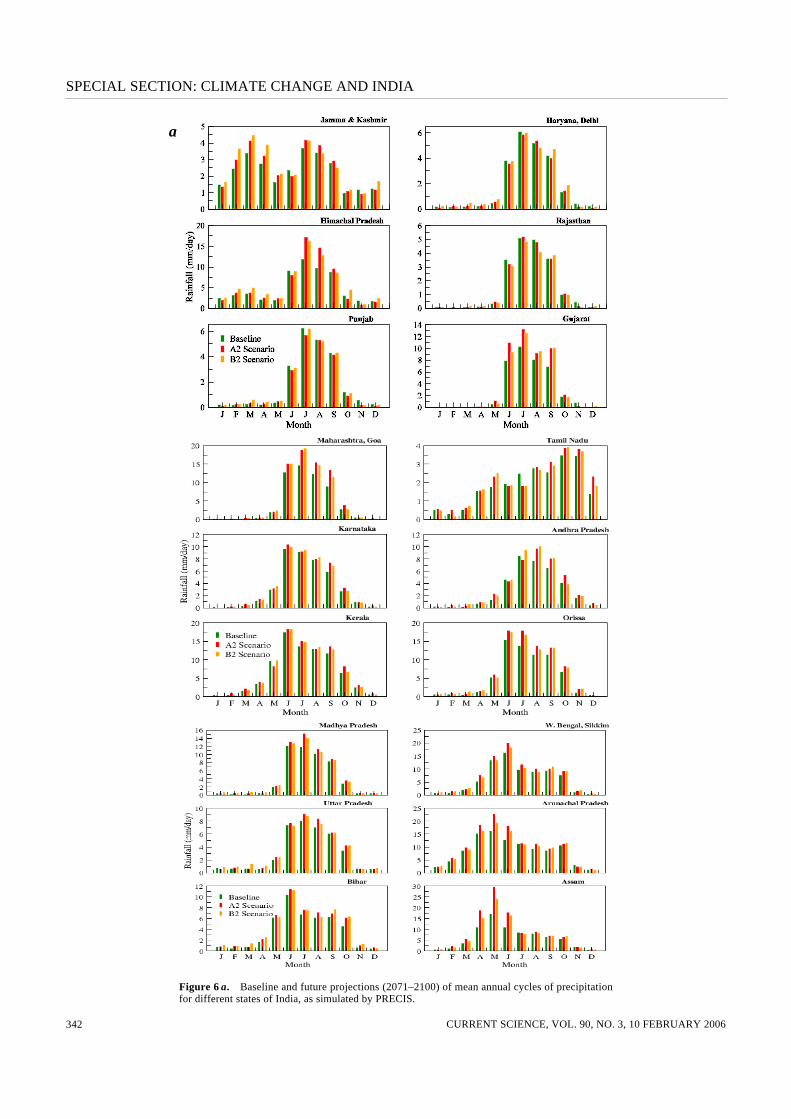
as compared to present. Rise in rainfall is seen over all states except Punjab, Rajasthan and Tamil Nadu, which show slight decrease in precipitation in the future scenar-ios (Figure 6). PRECIS simulation for 2071–2100 indicates an all-round warming over Indian subcontinent associated with increasing greenhouse gas concentrations (Figure 7). The annual mean surface air temperature rise by the end of the century ranges from 3 to 5ºC in A2 scenario, whereas the rise lies between 2.5 and 4ºC in the B2 scenario. The warming seems to be more pronounced over the northern parts of India. Another important aspect of PRECIS simulations is the role of sulphur cycle. From a general comparison of the simulations performed with and without sulphur cycle switched on in the regional model, it appears that there is no marked change in the simulations either in terms of rainfall or in terms of surface air temperature (data not shown). It may be noted here that, as the driving GCM al-ready has the sulphate aerosols included, the LBCs do contain the associated large-scale signals. Therefore, the results suggest that the regional sulphur cycle as consid-ered by the model has no major impact on the scenarios derived.
Climate change scenarios over India for 2020s, 2050s and 2080s
As noted earlier, the PRECIS simulations are carried out for only two time slices, viz. 1961–1990 and 2071–2100, as the LBCs were available only for these periods. In order to generate scenario products for periods intermediate be-tween the two available simulations created for the 1961–90 (the control) and 2071–2100 (the perturbed) periods, a simple solution suggested by D. B. Stephenson and C. A. T. Ferro (pers. commun. [email protected]) has been adopted. It is assumed here that the probability distribution of the values for a given parameter changes simply due to anthropogenic trends in location (e.g. mean) and scale (e.g. standard deviation). In other words, it is assumed that the shape of the probability distribution stays con-stant under increased greenhouse forcing. This assump-tion appears to work moderately well for regional climate simulations of daily minimum and maximum tempera-tures over Europe25. One of the simplest assumptions to make about the trends in location and scale is that they are linearly dependent on the total radiative forcing. In other words, the location and scale are linear functions of the logarithm of the equivalent CO2 concentration as specified by the IPCC SRES scenarios. This is a more justifiable assumption than assuming linear-in-time trends and can be used to obtain intermediate simulations for different SRES scenarios. In the present study, the above approach is used to es-timate the changes in all-India and state wise means of
SPECIAL SECTION: CLIMATE CHANGE AND INDIA
CURRENT SCIENCE, VOL. 90, NO. 3, 10 FEBRUARY 2006 341
Figure 5. Projected changes in summer monsoon precipitation and surface air temperature towards the end of 21st century, for A2 and B2 scenarios.
the seasonal precipitation and seasonal mean temperature at 1.5 m for the time slices 2011–2040 and 2041–2070 representing the climatic conditions during 2020s and 2050s respectively. The average CO2 concentrations for the different time slices, viz. 1961–1990, 2011–2040, 2041–2070 and 2071–2100 are calculated and the radia-tive forcing functions based on these average values are used as interpolating factors to generate the scenarios for 2020s and 2050s. These intermediate scenarios, while be-ing qualitatively similar to the scenarios for the 2080s, provide some preliminary quantitative estimates for use in impact assessments in the near term. The authors may be contacted for further details on these scenarios.
Future changes in extreme temperatures and precipitation
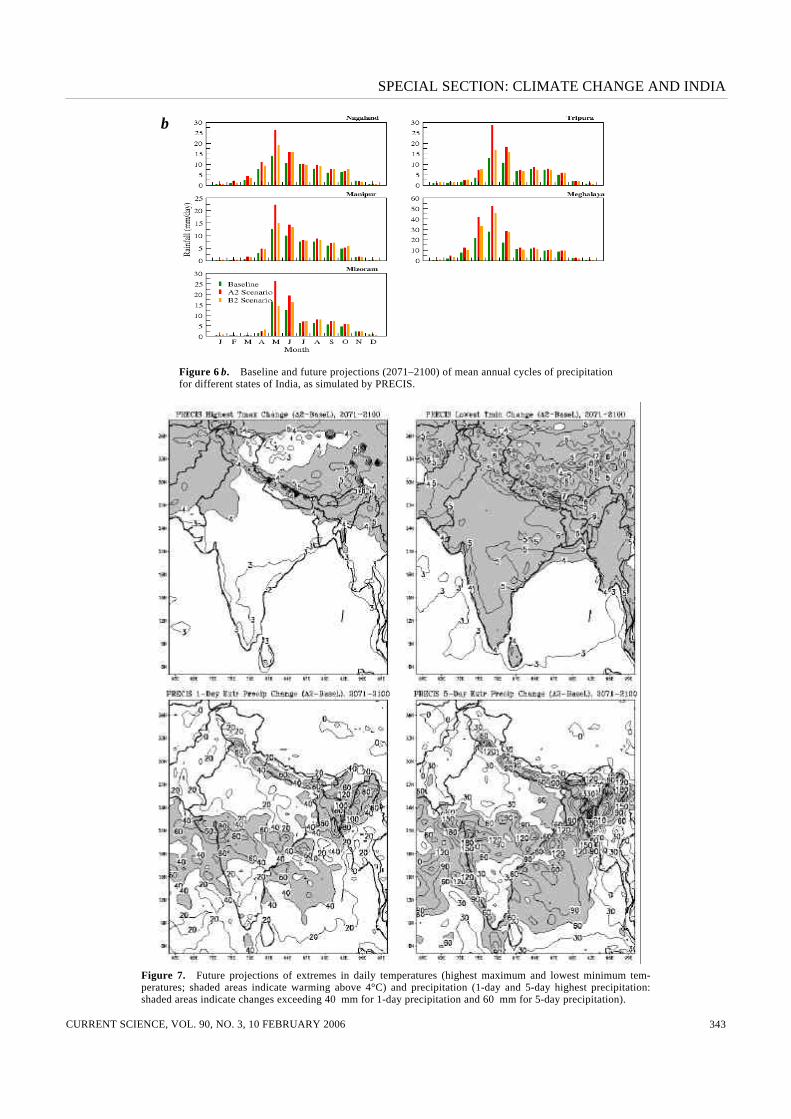
Figure 7 shows the A2 scenarios of extremes in tempera-ture and precipitation, in terms of the highest maximum temperature, lowest minimum temperature and 1-day/5-day highest precipitation, towards the end of the 21st cen-tury. The all-round warming seen in the seasonal mean temperatures is reflected in the extreme temperatures also, and both the days and nights are getting warmer in the future scenario. The projected changes in the ex-
tremes are similar in the case of B2 scenario also, though with slightly reduced magnitudes (not shown). Interest-ingly, the night temperatures seem to be increasing at much higher rates than the day temperatures. While the lowest minimum temperatures are expected to be warmer by more than 5°C over most parts of the country, the highest maximum temperatures show an increase of only 2°C. Even during the recent observational period, there is mounting evidence that the minimum temperatures are increasing more rapidly than the maximum temperatures not only over India26, but also across several regions in the world27. In terms of extreme precipitation, there is a general increase in both 1-day and 5-day extremes. In particular, there is a marked increase in the severe rainfall activities over an extensive area covering the Western Ghats and northwestern peninsular India including Maha-rashtra and the adjoining parts of Andhra Pradesh, Madhya Pradesh and Karnataka.
Summary and conclusions
The scenarios presented in this paper include more de-tailed regional information (50 km × 50 km), and are very useful for impact assessments in various sectors. This paper includes only the basic aspects of the simula-
SPECIAL SECTION: CLIMATE CHANGE AND INDIA
CURRENT SCIENCE, VOL. 90, NO. 3, 10 FEBRUARY 2006 342
Figure 6 a. Baseline and future projections (2071–2100) of mean annual cycles of precipitation for different states of India, as simulated by PRECIS.
a
SPECIAL SECTION: CLIMATE CHANGE AND INDIA
CURRENT SCIENCE, VOL. 90, NO. 3, 10 FEBRUARY 2006 343
Figure 6 b. Baseline and future projections (2071–2100) of mean annual cycles of precipitation for different states of India, as simulated by PRECIS.
Figure 7. Future projections of extremes in daily temperatures (highest maximum and lowest minimum tem-peratures; shaded areas indicate warming above 4°C) and precipitation (1-day and 5-day highest precipitation: shaded areas indicate changes exceeding 40 mm for 1-day precipitation and 60 mm for 5-day precipitation).
b
SPECIAL SECTION: CLIMATE CHANGE AND INDIA
CURRENT SCIENCE, VOL. 90, NO. 3, 10 FEBRUARY 2006 344
tion results; the regional model output contains a large number of additional parameters that can be obtained from the authors for use in the impact assessment models. While the scenarios presented in this study are indicative of the expected range of rainfall and temperature changes, it must be noted that the quantitative estimates still have large uncertainties associated with them. The following are some of the major conclusions based on the results presented in this paper: 1. PRECIS shows good skill in depicting the surface
climate over the Indian region, particularly the oro-graphic patterns of summer monsoon precipitation, both in terms of mean and extremes.
2. A major bias involving overestimation of rainfall over the eastern peninsula has been inherited by the re-gional model from its parent model, indicating the critical importance of the skills of driving GCMs in representing the large-scale features.
3. Model simulations under scenarios of increasing greenhouse gas concentrations and sulphate aerosols indicate marked increase in both rainfall and tempera-ture towards the end of the 21st century.
4. Surface air temperature as well as rainfall show simi-lar patterns of projected changes under A2 and B2 scenarios, but the B2 scenario shows slightly lower magnitudes of the projected change.
5. The warming is monotonously widespread over the country, but there are substantial spatial differences in the projected rainfall changes. West central India shows maximum expected increase in rainfall.
6. Extremes in maximum and minimum temperatures are also expected to increase into the future, but the night temperatures are increasing faster than the day tem-peratures. Extreme precipitation shows substantial in-creases over a large area, particularly over the west coast of India and west central India.
1. Houghton, J. T. et al. (eds), Climate Change 2001: The Scientific Basis. Contribution of Working Group I to the Third Assessment Report of the Intergovernmental Panel on Climate Change, Cam-bridge University Press, 2001, pp. 881.
2. Special Report on Emission Scenarios (SRES), A special report of Working Group III of the Intergovernmental Panel on Climate Change, Cambridge University Press, 2000, pp. 599.
3. Rupa Kumar, K. and Ashrit, R. G., Regional aspects of global cli-mate change simulations: Validation and assessment of climate re-sponse of the Indian monsoon region to transient increase of greenhouse gases and sulphate aerosols. Mausam, 2001, 52, 229–244.
4. Rupa Kumar, K., Krishna Kumar, K., Ashrit, R. G., Patwardhan, S. K. and Pant, G. B., Climate change in India: Observations and model projections. In Climate Change and India (eds Shukla, P. R., Sharma, S. K. and Ramana, P. V.), Tata McGraw-Hill Ltd, New Delhi, 2002, pp. 24–75.
5. Rupa Kumar, K., Krishna Kumar, K., Prasanna, V., Kamala, K., Deshpande, N. R., Patwardhan, S. K. and Pant, G. B., Future cli-mate scenarios. In Climate Change and India: Vulnerability As-sessment and Adaptation (eds Shukla, P. R., Subodh K. Sharma,
Ravindranath, N. H., Amit Garg and Sumana Bhattacharya), Universities Press, Hyderabad, 2003, pp. 69–127.
6. Noguer, M., Richard Jones, David Hassell, Debbie Hudson, Simon Wilson, Geoff Jenkins and John Mitchell, Workbook on Generat-ing High Resolution Climate Change Scenarios using PRECIS, Hadley Centre for Climate Prediction and Research, Met Office, Bracknell, UK, 2002, pp. 43.
7. Gordon, C. et al., The simulation of SST, sea ice extents and ocean heat transport in a version of the Hadley Center coupled model without flux adjustments. Climate Dynamics, 2000, 16, 147–168.
8. Johns, T. C. et al., Anthropogenic climate change for 1860 to 2100 simulated with the HadCM3 model under updated emissions sce-narios. Hadley Centre Technical Note No. 22, Hadley Centre for Climate Prediction and Research, UK Meteorological Office, 2001.
9. Rayner, N. A. et al., Global analyses of SST, sea ice and night ma-rine air temperature since the late nineteenth century. J. Geophys. Res., 2002, 108, No. D14, 4407 10.1029/2002JD002670.
10. Jones, R. G. et al., Configuring new climate models for Europe with improved climatologies via better representation of physical processes. UKMO Second Year Report for MERCURE, EC Con-tract ENV4.CT97.0485, 1999.
11. Stratton, R. A., Report on aspects of variability in high-resolution versions of HadAM3. Hadley Centre Technical Note No. 53, Had-ley Centre for Climate Prediction and Research, U.K. Meteoro-logical Office, 2004, pp. 32.
12. Hudson, D. A. and Jones, R. G., Regional climate model simula-tions of present-day and future climates of Southern Africa. Tech-nical Note No. 39, Hadley Centre for Climate Prediction and Research, UK, 2002, pp. 42.
13. Bhaskaran, B., Murphy, J. M. and Jones, R. G., Intraseasonal oscilla-tion in the Indian summer monsoon simulated by global and nested regional climate models. Mon. Wea. Rev., 1998, 126, 3124–3134.
14. Jones, R. et al., Generating high resolution climate change scenar-ios using PRECIS, Hadley Centre for Climate Prediction and Re-search, Met Office Hadley Centre, UK, 2004, pp. 40.
15. Wilson, M. F. and Hendersen-Sellers, A., A global archive of land cover and soils data for use in general circulation models. J. Cli-matol., 1985, 5, 119–143.
16. New, M., Lister, D., Hulme, M. and Makin, I., A high-resolution data set of surface climate over global land areas. Climate Res., 2002, 21, 1–25.
17. Pant, G. B. and Rupa Kumar, K., Climates of South Asia, John Wiley & Sons, Chichester, 1997, pp. 320.
18. Groisman, P. Y. et al., Changes in the probability of heavy pre-cipitation: Important indicators of climatic change. Climatic Change, 1999, 42, 243–283.
19. Frich, P., Alexander, L. V., Della-Marta, P., Gleason, B., Haylock, M., Klein Tank, A. M. G. and Peterson, T., Observed coherent changes in climatic extremes during the second half of the twenti-eth century. Clim. Res., 2002, 19, 193–212
20. Lal, M. and Harasawa, H., Future climate change scenarios for Asia as inferred from selected coupled atmosphere–ocean global climate models. J. Meteorol. Soc. Japan, 2001, 79, 219–227.
21. Lal, M. and Singh, S. K., Global warming and monsoon climate. Mausam, 2001, 52, 245–262.
22. Douville, H., Royer, J-F., Polcher, J., Cox, P., Gedney, N., Ste-phenson, D. and Valdes, P-J., Impact of CO2 doubling on the Asian summer monsoon: Robust versus model-dependent re-sponses. J. Meteorol. Soc. Japan, 2000, 8, 421–439.
23. May, W., Simulation of the variability and extremes of daily rainfall during the Indian summer monsoon for present and future times in a global time-slice experiment. Clim. Dyn., 2004a, 22, 183–204.
24. May, W., Potential of future changes in the Indian summer mon-soon due to greenhouse warming: analysis of mechanisms in a global time-slice experiment. Clim. Dyn., 2004b, 22, 389–414;

SPECIAL SECTION: CLIMATE CHANGE AND INDIA
CURRENT SCIENCE, VOL. 90, NO. 3, 10 FEBRUARY 2006 345
Mooley, D. A. and Parthasarathy, B., Fluctuations of all-India summer monsoon rainfall during 1871–1978. Climatic Change, 1984, 6, 287–301.
25. Ferro, C. A. T., Hannachi, A. and Stephenson, D. B., Simple non-parametric techniques for exploring changing probability distribu-tions of weather. J. Climate, 2005 (in press).
26. Kothawale, D. R. and Rupa Kumar, K., On the recent changes in surface temperature trends over India. Geophys. Res. Lett., 2005 (in press).
27. Alexander, L. V. et al., Global observed changes in daily climate extremes of temperature and precipitation. J. Geophys. Rev., 2005 (submitted).
ACKNOWLEDGEMENTS. This work is part of a Joint Indo-UK col-laborative programme on climate change impacts in India. The authors
are grateful to the Department for Environment, Food and Rural Affairs (DEFRA), Government of United Kingdom, for sponsoring this project and the Ministry of Environment and Forests (MoEF), Government of India, for coordinating its implementation. In particular, the active in-terest and encouragement of Dr David Warrilow of DEFRA and Dr Subodh Sharma of MoEF have been of great help. We are also grateful to the Hadley Centre for Climate Prediction and Research, UK Mete-orological Office, for making available regional models and their data products required for this study. Messrs ERM India Private Ltd, the fa-cilitating agency to manage the project implementation, and their CEO and Vice-Chairman, Dr T. K. Moulik and Project Consultant, Dr Subrata Bose, have taken excellent care of the various logistics. Computational/ visualization/documentation work for this project has been done using the open source software RedHat Linux, Intel FORTRAN, GrADS, xmGrace, OpenOffice, etc.


![High resolution climate scenarios on Mediterranean test ... detected for statistical downscaling ap-03 ... ii) Orvieto and iii) ... PRUDENCE [8] and CORDEX [17],](https://img.pdfslide.us/doc/110x75/5b2a05c57f8b9acb148b6f4b/high-resolution-climate-scenarios-on-mediterranean-test-detected-for-statistical.jpg)