Embed Size (px)
Citation preview
HIGH-QUALITY VERSUS LOW-QUALITY GROWTH IN TURKEY:
CAUSES AND CONSEQUENCES*
Daron Acemoğlu (MIT)
Murat Üçer (Global Source Partners, Koç University)
Abstract
Turkey’s economy has made important strides in the 17 years since the financial crisis of 2001, averaging an annual growth rate of about 5.7%. But the quality of this growth has been poor, especially since 2007, with little-to-no productivity growth, limited technological upgrading, substantial (mis)allocation of resources to the construction sector and a huge surge in credit. This growth has also been generally unequal. This low-quality, unequal growth has been in the context of worsening economic institutions, underpinned by deteriorating political institutions.
This paper attempts to understand the causes and consequences of low-quality growth in Turkey, briefly interrupted by a period of higher-quality growth between 2002 and 2006. The main thesis of our paper is that the lack of high-quality, shared growth in Turkey is rooted in the nature and evolution of its economic institutions, which are themselves closely linked to the country’s political institutions. The short episode of high-quality and more equally shared growth came as a result of institutional improvements, but duly disappeared as these institutional gains were reversed.
Keywords: economic growth, emerging markets, high-quality growth, institutions, productivity, shared prosperity, Turkey.
JEL classification: E65, O52.
* We are grateful to Merve Aksoylar for the growth accounting calculations, Derya Karakaya for help with the data and figures, and to Dani Rodrik, Cihat Tokgöz and the editors of this volume, Asaf Savaş Akat and Seyfettin Gürsel, for useful comments and suggestions. The usual caveat applies.

1
I. INTRODUCTION
Much of the emerging world has returned to rapid growth following the global financial crisis of 2007-2009. Figure 1 shows GDP per capita (in purchasing power parity, PPP) in a sample of selected emerging economies over the last two decades, where rapid growth in China, Turkey, Malaysia and Mexico since 2009 is visible. Much of this growth may be less sustainable than first meets the eye, however. Growth driven by consumption, credit and government spending, without sufficient investment and productivity growth, tends to run out of steam more rapidly and may even prepare conditions for subsequent economic crashes. Put simply, the key question is whether emerging economy growth during this period is “low-quality”, meaning that it is not associated with significant productivity and technological improvements.
Figure 1
Source: IMF, World Economic Outlook Database Note: The figure shows purchasing power parity-based GDP, expressed in constant international dollars, divided by total population.
Figure 2 depicts total factor productivity (TFP) growth in the same economies. With the exception of China, TFP growth in these economies has been disappointing over the last 10 years, and in all

2
cases TFP growth is significantly slower than in the previous two decades.1 Figure 3 shows one potential reason for this: in these same economies, there has also been a sizable expansion of credit as a percent of GDP.
Figure 2
Source: The Conference Board Note: Simple period averages. For definition of total factor productivity, see footnote 8 below. The figure also reports the Conference Board's alternative, much lower estimate for TFP growth in China, which eschews official growth figures.
Moreover, much of this growth has not been broadly shared within the population, raising another set of concerns about its social desirability and its sustainability. The average Gini coefficient in China over the last 10-15 years is around 0.41, in Argentina it is 0.43, in Mexico it is 0.45, and in Brazil, it is even higher, 0.53 (although it has been declining from its yet higher levels, near 0.60, in the late 1980s).2 These levels of inequality are damaging to sustainable growth because they raise political tensions and conflict and encourage ultimately self-defeating “populist” policies.
1 However, as the figure shows, Conference Board's alternative estimates for China that do not rely on the official statistics paint a much less rosy TFP picture for this country as well. 2 Roughly speaking, the Gini coefficient represents the differential income shares of the high percentiles of the income distribution relative to the rest of the distribution. In particular, a Gini of zero implies a perfectly equal distribution, while a Gini of one means that the very rich few households capture all of the income. See below for a more formal definition. More directly, the income share of the top 1% of households is 13.9% in China, 23.6% in Brazil, 23.4% in Turkey, and 17% in Argentina (according to the World Inequality Database, where there are no available data for Mexico).

3
Figure 3
Source: Bank for International Settlements Note: The figure shows bank credit to the private non-financial sector, as a percent of GDP. The private non-financial sector includes non-financial corporations (both private-owned and public-owned), households and non-profit institutions serving households, as defined in the 2008 System of National Accounts.
In this paper, we investigate the challenges of generating high-quality and shared growth in one emerging economy, Turkey. By high-quality growth we refer to economic growth driven by productivity improvements and technological upgrading. This sort of growth also typically entails improvements in the human capital and skills of the workforce. By shared growth, we mean growth from which the population at large benefits.
Though there are no universal recipes for achieving high-quality and/or shared growth, recent research has emphasized the role of institutional factors.3 Of primary importance is the complex of economic institutions that Acemoğlu and Robinson (2012) refer to as “inclusive economic institutions”. These are based on secure property rights, lack of coercion and systematic discrimination in the labor market, a functioning legal system, public services, health and education investments and a basic social safety net creating a level-playing field. These institutions, undergirded by political institutions that distribute political voice and power broadly in society and
3 See the discussion in Commission on Growth and Development (2008). Dollar, Kleinberg and Kraay (2013) document that growth is good for the poor on average, but this average decline of poverty masks considerable heterogeneity and is not entirely undisputed.

4
introduce basic checks on the exercise of political authority, appear to predict long-run, shared economic prosperity.4
Recent research also suggests that changes in economic and political institutions can have a major impact on the extent and nature of economic growth even in relatively short periods of time. Acemoğlu, Naidu, Restrepo and Robinson (2019) study the economic implications of a transition from a nondemocratic to a democratic regime and find that democratization increases economic growth substantially in the next 20 years (causing approximately a 20% rise in GDP per capita). Moreover, this growth boost tends to be high-quality and shared: it is accompanied with higher taxes, more spending and better outcomes in education and health, and greater investments. Consistent with the institutional emphasis in Acemoğlu and Robinson (2012), this political change goes hand-in-hand with improvements in economic institutions, such as economic reforms in product, labor and financial markets.
Another important argument in this literature is worth mentioning. Even though inclusive economic institutions, founded on inclusive political institutions, are conducive to faster growth, there should be no presumption that they emerge swiftly. Institutions are shaped by distributional conflicts and the relative powers of competing groups and individuals in society. Institutional reform follows either the collapse of existing political balances or results from new political coalitions in favor of reform coming together. Neither of these two paths works smoothly or rapidly, if at all.
Our basic premise in this paper, building on our prior work, Acemoğlu and Üçer (2015), is that the recent Turkish macroeconomic experience confirms the role of institutions in shaping the extent and nature of economic growth. While Turkey has achieved considerable economic modernization and growth over the last three decades, much of this has been low-quality and the gains have been distributed rather unequally. These problems are rooted in the institutional structure of the Turkish economy. In fact, the short five years between 2002 and 2006, during which growth took a higher-quality form, accompanied with productivity improvements and technological upgrading, took place in the context of major improvements in economic and political institutions. When these improvements were reversed in the subsequent years, the quality of growth declined and inequality rose.
In the next section, we introduce our definitions for high-quality growth and shared growth, and discuss their institutional foundations. Section III is the heart of the paper and develops our narrative on the extent and nature of economic growth in Turkey since the early 1990s. We document the limited extent of productivity improvements and technological upgrading in this growth process. This is visible in the lack of productivity growth and the types of goods the Turkish
4 See, for example, Acemoğlu, Johnson and Robinson (2001, 2005).

5
economy exports. It has also generally been unshared prosperity. Inequality in Turkey has remained high and appears to have increased further since 2006. The Turkish economy has continued to generate jobs during this time period, but much of this growth has come from services, and has likely been driven at least in part by government subsidies, rather than by productivity growth and private sector investment.
Section IV provides a brief discussion of the evolution of Turkish economic and political institutions and their impact on the nature of growth. We highlight how changes in the nature of Turkish growth are linked to the ups and downs of Turkish economic institutions, and how economic and political institutions are tightly connected.
Section V concludes by linking the current macroeconomic ills to the economic and institutional developments of the last two decades and stresses the extent to which many of these problems are consequences of recent low-quality growth. Looking forward, it also outlines reforms that look most promising for tackling both the short-run and the medium-run economic problems confronting the country.
II. HIGH-QUALITY GROWTH: A CONCEPTUAL FRAMEWORK
Saudi Arabia grew at a pace of almost 15% per annum in the 1970s.5 This turbo-charged growth rate was not achieved by technological improvements, innovation or even improved efficiency in the allocation of resources, but by oil exports in a period during which energy prices rose by six-fold.6 During this period, the content of educational curricula deteriorated, however, turning increasingly towards religious indoctrination, and in part as a result, economic opportunities for Saudi workers dwindled. Four out of five workers employed in the private sector in Saudi Arabia are now foreigners.7
Though Saudi Arabia is an extreme case, it vividly illustrates why the growth rate alone is not a sufficient gauge for measuring the success of an economy. Two problematic aspects of this type of growth are clear in the Saudi case. First, growth was not driven by productivity and technological improvements. This is an indication that the economy is not upgrading its productive potential (advanced economies during this period experienced steady productivity improvements, even if at a slower rate than in the 1950s and 1960s; see, e.g., Gordon, 2017). It is also often associated with a less sustainable type of growth. In the Saudi case, this lack of sustainability was rooted in the
5 Simple averages, OECD data. 6 Inflation-adjusted oil price data from macrotrends.net. 7 See, for example, International Monetary Fund (2019a).

6
economy’s dependence on international energy prices. Since 2014, for instance, as oil prices declined sharply, Saudi growth fell to a paltry 1.8%.8
Second, given the repressive and non-representative political system in Saudi Arabia, the gains which at first accrued to the national oil company, Aramco, were controlled and captured by the extended royal family and its cronies. As a result, Saudi Arabia remains a highly unequal country. We do not have Gini coefficients for Saudi Arabia, but World Inequality Database shows very high levels of inequality. For example, the bottom 50% in the Saudi economy gets 8% of national income, while the top 1% receives 20%.
Both productivity/technological improvements and shared prosperity are socially desirable, even if sharply missing from the Saudi experience. The first refers to whether growth is “high-quality”, and the second to how broadly shared its gains are.
High-quality growth is first and foremost about whether growth is driven by productivity improvements and technological upgrading.9 The standard measure of productivity in economics is total factor productivity (also sometimes called multi-factor productivity), or TFP for short. TFP growth looks at how much of growth in incomes (or gross domestic product, GDP) is due to improvements in technology and more efficient allocation of resources as opposed to increasing the labor force or the capital stock of the economy.10
Its interpretation is simple and powerful: a TFP growth of zero would imply that if an economy had the same level of capital stock and the same labor force (with exactly the same skills) the following year as this year, then its GDP would remain the same. In contrast, a TFP growth of 2% would imply that such an economy would have 2% higher GDP. Therefore, TFP growth is a boon to the economy. In addition, it captures the extent to which an economy is improving its productive potential. When focusing on advanced economies at the world technological frontier, TFP growth also represents how successful they are in inventing and introducing new production processes or products. For developing economies, which are typically behind the technology frontier, TFP growth captures how well they are able to import and adopt existing technologies and remove
8 In other cases, unsustainability may result because of excessive credit growth (often fueling rapid consumption or unproductive investment growth). On the link between credit and crises, see Schularick and Taylor (2012), who document a strong correlation between credit growth and financial crises in a sample of 14 countries between 1870 and 2008. 9 We use the term high-quality growth rather than “sustainable growth” both to emphasize the critical role of productivity growth and technological upgrading and to highlight that sustainability is one possible consequence of the quality of economic growth. 10 TFP growth is computed as a residual from GDP growth such that,
TFP growth = GDP growth - contribution of physical capital - contribution of human capital, where the contributions of physical and human capital are computed from the growth of the relevant capital stock and human capital measures multiplied by their (average) factor shares.
7
prevailing productive inefficiencies.11 Thus, the failure to achieve high TFP growth for developing economies is also a failure to benefit from existing technological opportunities.
Because TFP is measured as a residual and is subject to considerable error,12 it is useful to look at other proxies of the technological capabilities of an economy. One useful set of measures come from the content of exports. As economies adopt new technologies, they move up in the value chain and the content of their exports tends to change towards higher-tech and higher value-added products (see Hidalgo and Hausmann, 2009). Motivated by this observation, we look at export composition as an additional measure of the productive and technological capabilities of an economy.
Productivity improvements and technological upgrading often necessitate the upgrading of the skills of the workforce. Hence, it is also useful to track how the amount of educational investments and the skills of the workforce change over time. TFP growth and export content matter not just because of their direct impact on GDP and as measures of how efficiently the economy is growing, but also because TFP-driven growth tends to be more durable. In contrast, growth unaccompanied by productivity improvements or growth fueled by commodity price booms or expansion in a few traditional sectors tends to be less sustainable, and often ends with sharp recessions and crashes.
It is equally clear why we should care about how shared growth is. In addition to normative concerns about the undesirability of growth accompanied with increasing impoverishment of a major part of the population, existing evidence suggests that widening inequality fuels conflict and may itself be a cause of future recessions. This is both because of the political conflict often associated with high levels of inequality and because of short-term, distortionary policies that this type of growth appears to engender.13
Several measures of inequality can be informative about how shared prosperity is. The most common is the Gini coefficient, which roughly measures the “excess” share of income captured by richer percentiles of the income distribution. For example a Gini coefficient of zero would mean perfect equality, while a Gini coefficient of one would represent a situation in which only one
11 See Acemoğlu, Aghion and Zilibotti (2006) on distance to the frontier and growth among follower countries. See Acemoğlu (2009) for a broad discussion of structural transformation and changes in the efficiency of production process among developing countries. 12 Most importantly, it is difficult to fully accommodate capacity utilization and quality of education and equipment into TFP calculations. See Acemoğlu (2009, Chapter 3) for discussion. 13 See Alesina and Perotti (1996) on the link between income inequality and instability. Alesina and Rodrik (1994) and Persson and Tabellini (1994) claimed that high inequality also leads to lower growth, but the link between inequality and growth appears to be more multifaceted (e.g., Banerjee and Duflo, 2003). Nevertheless, the literature on economic populism supports the notion that high inequality fuels distortionary macroeconomic policies as well as other inefficiencies in the economy (e.g., Dornbusch and Edwards, 1991, Kauffman and Stallings, 1991, Weyland, 2001).
8
person, or a very small fraction of people, command all of the income or wealth in the economy.14 Although shared prosperity can in principle be achieved by redistribution, in most instances it emerges as a result of a growth process which leads to employment growth (since unemployment is often very unequally distributed, its burden tends to be felt by less educated and poorer segments of society) and broad-based wage growth. Entry barriers, cozy government-business deals, and corruption often contribute to greater inequality by creating artificial advantages and conferring excessive economic or political power on some of the players in the economy.
What factors underpin high-quality and shared growth? Though there is no universal consensus on this question, the recent literature emphasizes institutions as major determinants of both high-quality growth and the distribution of resources. Douglass North (1982, 1991) stressed the importance of institutional factors. More recently, Acemoğlu, Johnson and Robinson (2001, 2005) provide cross-country evidence, exploiting colonial origins of different types of institutions, documenting the major role of institutions and long-run growth. Hall and Jones (1999) and Caselli (2005) show that measures of productivity, such as TFP, are correlated with such institutional differences. Acemoğlu, Johnson, Robinson and Thaicharoen (2003) document that countries with better economic institutions are much more stable and do not suffer as severe recessions as those with worse institutions.
Acemoğlu and Robinson (2012) further develop the theory of institutions and present several historical cases bolstering the notion that better institutions are associated with less unequal and more shared prosperity. In addition, they provide some simple definitions of the most important prerequisites of the institutional complex that undergird high-quality and shared growth. They propose the notion of “inclusive economic institutions” to capture the most important aspect of this complex. They write (p.74):
“Inclusive economic institutions… are those that allow and encourage participation by the great mass of people in economic activity that make best use of their talents and skills and that enable individuals to make the choices they wish. To be inclusive, economic institutions must feature secure private property, an unbiased system of law, and the provision of public services that provides a level playing field in which people can exchange and contract; it also must permit the entry of new businesses and allow people to choose their careers.”
14 More formally, the Gini coefficient is computed from the Lorenz curve of income. The Lorenz curve plots the cumulative fraction of total income of different percentiles of the distribution of income. The Gini coefficient is defined as the area between the Lorenz curve and the 45° line (which represents perfect equality) divided by 1/2. This explains why a Gini coefficient of zero represents perfect equality, and when the cumulative fraction of total income of all percentiles except the very top is zero, this area is equal to the entire triangle below the 45° line and is thus equal to 1/2, giving a Gini coefficient of one. In addition to the Gini coefficients, we sometimes report shares of national income accruing to bottom 50% and top 1% of the population from the World Inequality Database.

9
They further stress that inclusive economic institutions are unstable unless they are bolstered by “inclusive political institutions”, which distribute political power and voice broadly in society, introduce effective checks on political and economic elites, and have the capacity to enforce laws, tax and regulate economic activity, and provide effective public services. This definition highlights that inclusive political institutions must be democratic, as nondemocratic regimes will lead to the monopolization of political power in the hands of a narrow segment and will exclude the majority of the population from effective political participation. Nevertheless, elections are not sufficient for political institutions to be inclusive. Electoral democracies may still entail little effective political competition and may be propped up by clientelistic policies based on selective transfers or the mobilization of ethnic or religious groups. They may also fail to place sufficient constraints and checks on elected officials.
We will see these links between inclusive economic and political institutions and high-quality, shared growth in the Turkish context as well.
The difficulties of emerging economies to transition from their existing economic structure have also received attention in recent debates. Some economists have claimed the existence of a “middle income trap” whereby emerging economies find it difficult to break away from the middle-income status into higher levels of income.15 This is particularly true because such a transition often necessitates greater investments in technology, faster productivity growth and more efficient allocation of resources (e.g., Eichengreen, Park and Shin, 2014). Though there is some evidence indicating that many emerging economies find a transition to a higher-quality growth difficult, this appears to be related to their institutional structures. Economies, such as South Korea, have swiftly broken through such a “trap” because of major political and economic reforms (e.g., Acemoğlu, Naidu, Restrepo and Robinson, 2019).
A more recent case illustrates the same point. Poland, starting from a fairly low level of income per capita in the 1990s, undertook major economic and political reforms, in part as a result of its accession to the European Union. These institutional reforms came with rapid productivity growth and technological improvements. As a result, Poland has almost tripled its GDP per capita (in PPP) in two and a half decades (Piatkowski, 2018).
In the rest of the paper, we interpret the recent Turkish macroeconomic developments through the lenses of this framework. We start by documenting how high-quality economic growth and shared prosperity have evolved over the last three decades and then explain their relationship with Turkey’s economic and political institutions.
15 The concept was first introduced by Indermit Gill and Homi Kaharas in a World Bank report on East Asia in 2007; see World Bank (2007). For a retrospective by the authors a decade later, see Gill and Kaharas (2015).

10
III. THE QUALITY OF RECENT TURKISH GROWTH
Figure 4 plots the evolution of GDP growth in Turkey since the 1960s. In addition to the high volatility of macroeconomic performance visible from this series, the bold line, which depicts the five-year moving average, reveals a number of important patterns. First, Turkish growth slowed down appreciably after the 1960s to an average annual pace of less than 2% in the 1970s. After a short-lived boost in the early 1980s, partly as a result of economic reforms implemented by then-prime minister Turgut Özal, growth once again lost momentum and returned to under 2% throughout the 1990s.16 This was followed by a notable increase in the growth rate in the early 2000s reaching an average of around 7.6% per annum during 2002-2006. This rapid growth window was then punctured by the effects of the global recession in 2009. Turkey subsequently returned to relatively rapid growth, even if this has fallen short of the levels of the early 2000s.
Figure 4
Source: Turkstat and our calculations Note: This figure shows the annual GDP growth in the Turkish economy and its five-year moving average. GDP growth numbers from 1998 are based on new National Income Accounts data released in December 2016, while for prior years we use growth rates from the old data series.
16 For a detailed account of Turkish economic growth since 1820, see Pamuk (2018).

11
The rest of this section probes the quality and nature of this growth experience, documenting that with the exception of the 2002-2006 interlude, growth has been low-quality — with little-to-no productivity growth — and far from shared.17
a. Quality of Turkish Growth: TFP
As already discussed in the previous section, the most direct measure of the quality of growth is TFP (total factor productivity). Figure 5 plots the World Bank’s recent estimates of Turkish TFP growth (together with the contribution from capital and labor). The chart also provides at the bottom the average TFP growth rate over four sub-periods (1989-1995; 1996-2001; 2002-2006; and 2007-2017). We complement this figure with our own calculations in Figure 6, which show similar patterns.18
What is striking about these pictures is that with the exception of the 2002-06 period, TFP growth is virtually zero in every one of our sub-periods. This is the pattern summed up by the World Bank as,
“economic growth in Turkey since the 1980s has been driven largely by factor accumulation, with only periodic boost in productivity.”
In contrast, the average TFP growth during the 2002-06 window is 4.1% in the World Bank data and 5.2% in our own estimates. This unusually rapid TFP growth explains a large part of the growth surge during this window, approximately 54% and 68%, respectively. Put slightly differently, without TFP growth, Turkish GDP during this short five-year period would have grown only by a relatively unimpressive 2-3%.
17 Several data revisions, most notably the 2016 revision of the National Income Accounts data and the 2014 revision to labor/employment data, create breaks in Turkish economic time series. We overcome these challenges by splicing historical series using growth rate estimates (based on old data) and percentages of GDP by sector. The old and revised series are similar when we go back in time, with the most dramatic differences concentrated in the post-2009 period. 18 See World Bank (2019). Estimates by IMF (2018) and Atiyas and Bakış (2020) in this volume yield similar results.

12
Figure 5
Source: World Bank (2019) Note: This figure is reproduced from data provided by the World Bank; period averages are calculated as simple arithmetic averages.
The post-2009 era is particularly noteworthy in this respect. On the one hand, GDP growth returns to a relatively high level, averaging around 6.5% per annum. But TFP growth almost completely disappears. In the World Bank data, there is essentially zero TFP growth, while our estimates put TFP growth at slightly negative.19
In sum, TFP estimates paint a picture of persistently low-quality growth in Turkey, punctured with an episodic rise in productivity during 2002-2006. We will see that other indicators point in the same direction.
19 The post-2007 period is affected by the sharp drop and then recovery associated with the global financial crisis. If we leave these years out and focus on 2011-2018, average TFP growth (our estimates) is slightly better, 0.4% per annum, which is still much lower than the average between 2002 and 2006, 5.2% per annum.

13
Figure 6
Source: Our calculations. Note: Calculations are based on a standard growth accounting framework as in Hall and Jones (1999), with weights of 1/3 and 2/3 assigned for capital and labor shares, respectively. Capital stock series has been derived from gross fixed capital formation, applying the standard perpetual inventory method and has been adjusted for capacity utilization, while human capital stock stands for employment adjusted for education using Mincerian returns.
b. Quality of Turkish Growth: Exports
TFP growth measures both technological upgrading and more efficient allocation of resources in the economy. A complementary gauge for technological upgrading is the technology content of the country’s exports. Turkey’s merchandise exports increased rapidly in the early 2000s, as shown in Figure 7, and continued to rise, albeit at a slower pace, after 2008. Turkey’s share of world exports too increased rapidly during the early 2000s, and stabilized thereafter, as Figure 8 indicates.

14
Figure 7
Source: Turkstat Note: Figures are in current U.S. dollars; export values are reported in f.o.b., import values in c.i.f. Figure 8
Source: World Bank Note: The figure shows Turkish merchandise exports as a share of world total exports. Exports are measured f.o.b., in current U.S. dollars.

15
The changes in the technology content of exports reveal a more nuanced pattern, however. In Figure 9 we present the evolution of the composition of Turkish exports in the past three decades. We report the fraction of exports in high-tech, medium-high-tech, medium-low-tech and low-tech categories.20 As the figure shows, from the late 1990s until about 2007 there is a rapid decrease in the share of low-tech industries and a substantial increase in the share of medium-high-tech industries in Turkish exports. For example, Turkey now exports less in textiles (its share of Turkish exports fell from 40% to less than 20% between 1999 and 2007) and more in household durables and vehicles (the share of these goods rose from around 10% to 30% between 1999 and 2007).
Notably, both of these improvements stop after 2008. Turkish exports show no further quality or technology upgrading over the last 10 years.
Figure 9
Source: Turkstat Note: The figure shows Turkey’s manufacturing exports according to technology intensity, based on the OECD’s ISIC Rev. 3 classification, which provides technology content in four categories: high-tech, medium-high-tech, medium-low-tech and low-tech.
20 This classification follows the OECD. High-tech includes aircraft and spacecraft, pharmaceuticals, computing machinery; medium-high-tech includes, among others, motor vehicles, trailers and semi-trailers, railroad equipment, electrical machinery and apparatus; medium-low-tech includes building and repairing of ships and boats, rubber and plastic products, basic metals; and low-tech includes textiles, tobacco, food and beverages.

16
This slowdown of technology upgrading is not a consequence of the fact that Turkey has already reached a high level. Figure 10 shows, based on World Bank data, the evolution of the share of medium and high-tech exports in total manufactured exports for a number of countries since 1990. Turkish exports appear to be less technology intensive than those of Mexico, Malaysia, China, and comparable to those of Brazil and Argentina.21
Figure 10
Source: World Bank Note: This figure shows the evolution of medium and high-tech exports as a percentage of total manufacturing exports.
In one of its recent biannual surveys on the Turkish economy (OECD, 2016), the OECD summarizes the situation as follows:
“While Turkey incorporates an increasing share of foreign value added in its own exports (backward participation), its capacity to provide intermediate inputs other countries’ exports (forward participation) is still limited.”
21 Figure 10 uses World Bank data, which are available at a different level of aggregation than the OECD data used in Figure 9. In particular, the World Bank computes the technology content of exports from UN Comtrade data, which combine high- and medium-tech exports into a single category (following the SITC Rev. 3 classification). This has no bearing on the evolution of technology content of Turkish exports since, as shown in Figure 9, Turkey's high-tech and medium-high-tech shares closely follow each other, and their behavior is essentially identical to that of medium and high-tech exports in Figure 10.

17
It goes on to state that there is “substantial room for progress in corporate governance and managerial skills, as well as the use of ICT tools in production and management processes.”
In sum, it is remarkable how little technological upgrading and productivity improvement there has been in the Turkish economy during the last decade, despite its relatively rapid growth.
c. The Quality of Turkish Growth: Education
Skill shortages are one of the major reasons for lack of productivity growth and technology upgrading around the world.22 We will see that Turkey made important progress in the 2000s, especially as educational spending increased (World Bank, 2014), but Turkey lags behind other OECD countries and many emerging economies in terms of educational attainment, and the quality of education has remained low and regressed further over the last several years.
This can be seen in Figure 11, which plots the fraction of 25-34-year-olds with less than upper secondary education in 2017. At 44%, Turkey fares much worse than the OECD average (15%) and also underperforms other emerging economies including Argentina, Colombia, Brazil, and Saudi Arabia.23
The quality of education may be even more important than its quantity (e.g., Hanushek and Woessman, 2016), and here the situation for Turkey looks even grimmer. Figure 12 presents the evolution of the gap between the PISA scores in reading, math, science and average skills of Turkish high school students and the OECD average for five periods, 2003, 2006, 2009, 2012, and 2015.24 Turkey starts significantly behind the OECD average in all areas in 2003. As remarked above, we then see some notable improvements as this gap, especially in math and reading, narrows during the next three periods. This favorable trend reverses suddenly in 2015, however, and all of the gaps shoot back up to the same or even higher levels than in 2003.25
22 See Cappelli (2015) for a general discussion and Acemoğlu and Restrepo (2019) for the role of skill shortages in productivity and technology adoption in the context of automation. 23 Though educational attainment has increased in Turkey over the last two decades, this has been more or less at the same pace as the rest of the OECD, leaving Turkey's relative standing roughly unchanged. 24 PISA is the OECD's Program for International Student Assessment. Every three years it tests 15-year-old students from all over the world in reading, mathematics and science. The tests are designed to gauge how well the students master key subjects in order to be prepared for real-life situations in the adult world. PISA cycles are referred to by the year in which the students were tested. 25 For an analysis of the narrowing of this gap between 2003 and 2012, see Rivera-Batiz and Durmaz (2014) and Gursel and Durmaz (2014). To our knowledge, there is no formal analysis of the sudden widening of this gap in 2015, although government's 2012 education “reforms” are likely to have played a role. Comprehensive reforms introduced in March 2012 raised compulsory schooling from eight to 12 years (primary, junior-high and senior-high), but simultaneously changed the curriculum away from math and science, and allowed vocational tracks after four years of compulsory primary education. These vocational tracks notably included religious (“imam hatip”)

18
Figure 11
Source: OECD, Education at a Glance
The patterns shown by the OECD Survey of Adult Skills (PIAAC) are similar. According to this survey, the Turkish workforce lacks the skills necessary to perform complex tasks and scores poorly at problem solving. As a result, Turkey ranks second to last among the OECD countries both in literacy and numeracy skills (only Chile is below Turkey).26
schools. According to data from the Ministry of Education, the number of religious schools increased from 1624 in 2011-12 to 3394 in 2018, now making up 29% of all schools. 26 PIAAC measures adults' proficiency in three key information-processing skills: literacy, numeracy and problem-solving in technology-rich environments. See Kavuncu and Polat (2019) for a detailed assessment of Turkey's numbers.

19
Figure 12
Source: OECD, Program for International Student Assessment (PISA) Note: Shows the difference between the OECD international average and Turkey’s results in three key subjects (reading, mathematics, science) and their averages.
d. How Shared Has Turkish Growth Been?
If Turkish growth has been relatively low-quality for most of the last three decades, has it at least generated shared gains? The answer is broadly no.
Figure 13 shows the Gini coefficient for Turkey from the World Bank. Two patterns are noteworthy. First, the level of inequality in Turkey is relatively high, comparable to those in China, Argentina, and Mexico. (For comparison, the Gini coefficient is around 0.30 in Germany and Sweden).

20
Figure 13
Source: World Bank Note: The figure reports the Gini coefficient for Turkey. A higher Gini coefficient corresponds to a greater level of inequality. See above for a detailed discussion of the Gini coefficient.
Second, and equally notable, is the evolution of the Gini over the last two decades or so. It declines from almost 0.43 in the beginning to the 2000s to just over 0.38 by 2006. However, from 2007 onwards the Gini starts increasing, and now stands at around 0.42 again.
Comparison by income percentiles, based on the World Inequality Database, reveals broadly similar trends. The share of national income accruing to the bottom 50% first rises but then falls, while the share going to the top 1% first declines but then rises significantly approaching 25% (see Figure 14).27
27 In contrast to the behavior of the Gini coefficient from World Bank data and the top income share from the World Inequality Database, Gini numbers from Turkstat do not show as clear an increase in inequality until 2014. The World Bank and Turkstat data draw on the same household surveys, but use different methodologies. Among other differences, Turkstat implements an adjustment for the age composition of households.

21
Figure 14
Source: World Inequity Database (WID) Note: This figure reports the income shares of the top 1% and bottom 50% of income distribution.
The silver lining is that, as we will discuss next, Turkish employment growth has been relatively robust, creating economic opportunities for Turkish workers. Nevertheless, we will see that in line with the low-quality nature of Turkish growth, much of this employment has come not from industry but from construction and services. Moreover, with private sector growth faltering in recent years, the government has begun to play a more important role in employment generation both directly through public-sector employment and indirectly by means of various employment subsidies for the private sector.28
e. Sources of Growth since 2007
The patterns we have documented so far raise an obvious question: if there is no TFP growth, little technological upgrading and only limited improvements in the skills of the workforce, how and why has the Turkish economy grown over the last decade or so? The answer to this question is
28 According to Turkstat figures, the public sector has hired about one million more workers since early 2018 , while (non-agricultural) private-sector employment has declined by about 1.5 million. While the change in the status of some 700,000 outsourced workers (from private to public sector) in early 2018 has played a major role in this, this shift does not fully account for the scale of the change in public versus private sector employment levels in this period.

22
important both for understanding the causes of low-quality growth in Turkey, and for assessing the nature of the difficulties the Turkish macroeconomy is currently experiencing.
The answer is that Turkish growth in this period has largely been fueled by credit and has been in part driven by a massive surge in the construction sector. Figure 15 shows the evolution of the credit to GDP ratio in the Turkish economy since the late 1980s. After decades of relatively stable (and low) credit availability, credit growth outstripped GDP growth starting in the mid-2000s. As a result, the credit to GDP ratio, which stood at less than 30% in 2006, rose to above 65% by late 2017.29 This credit expansion and other government policies (documented below) propelled a rapid construction boom.
Figure 15
Source: The Central Bank of the Republic of Turkey. Note: Total credit to private sector (households and non-financial corporations).
29 About one third of this credit is to the household sector, while the rest is to (non-financial) corporations. Much of the latter category is denominated in foreign currency, and currency fluctuations account for the volatility in the last few years.

23
Correspondingly, Figure 16 shows the composition of investment (gross fixed capital formation as a percent of GDP).30 After a rebound in the aftermath of Turkey’s 2001 crisis, machinery and equipment investment declined as a percent of GDP between 2006 and 2009, and essentially stagnated thereafter. In sharp contrast, construction investment has increased from less than 10% of GDP in the early 2000s to about 18% at present.31
Figure 16
Source: Turkstat Note: The figure uses December 2016 National Income Accounts data from 1998 through 2018 for total investment, and from 2009 through 2018 for machinery and equipment and construction investment sub-components, which are available since 2009 only. Prior years have been derived using the old GDP series. See footnote 14.
Much of this investment was in residential and commercial property, for which there now appears to be a huge oversupply, perhaps as large as 2 million dwellings.32 The government has played a defining role in the construction boom, both through public-private partnership projects, which supported infrastructure investments, and through TOKİ, the State Housing Agency, which has built a large number of low-income and more recently, luxury dwellings. Taking into account
30 The data from the Central Bank used in Figure 16 are constructed with a different methodology and from different sources than the BIS series used in Figure 3. Nevertheless, the two series are very similar. 31 The fact that machinery and equipment investment was high between 2002 and 2006 but only construction investment surged after this date suggests that investment has not been constrained by lack of savings or credit, but has been shaped by economic and political incentives, which encouraged construction projects and made other (especially manufacturing) investments less attractive over the last 13 years. 32 For an analysis of the construction sector dynamics during this period, see IMF (2016) and Demiralp et.al. (2015).
24
investments, fees and other transfers, the contract value of the public-private partnership projects is estimated to have reached some $140 billion.33
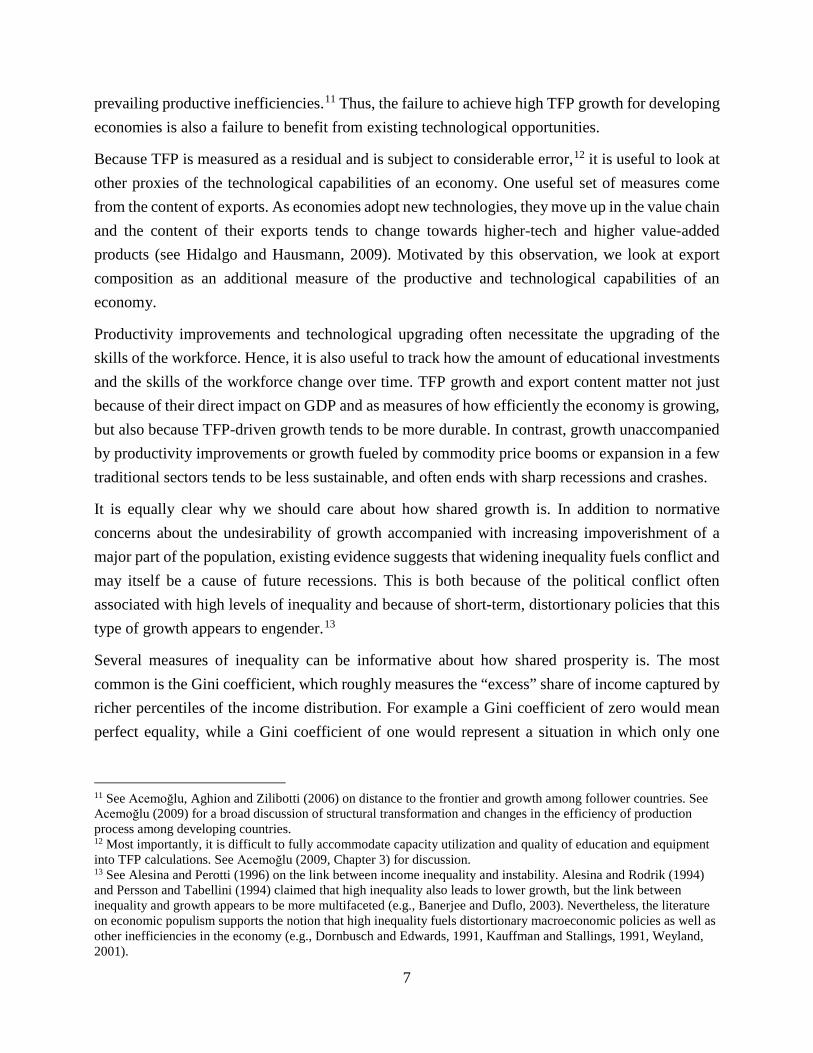
Government interventions have also been a major contributor to credit growth during recent years. With private banks increasingly unwilling or unable to lend in recent years (concerned about their own balance sheets as well as the balance sheets of their customers), the government has asked state banks to take over lending as the patterns documented in Figure 17 make it clear.34
Figure 17
Source: BRSA and our calculations Note: The coverage differs slightly before and after 2014 so that the credit series include only the deposit banks prior to 2014, but both the deposit and participation banks thereafter.
Sectoral employment trends, presented in Figure 18, paint a similar picture. Between 2002 and 2006, there is a rapid decline in agricultural employment (by about 1.3-1.4 million), but this is counterbalanced by robust increases in both industrial (0.4 million) and service (0.9 million) jobs. Employment has continued to grow since 2010, but this growth has been disproportionately in
33 See Presidency of Strategy and Budget, koi.sbb.gov.tr. The liabilities created by both the public-private partnership projects and TOKİ’s investments are off balance sheet and are not included in the government's spending and deficit numbers. 34 In particular, over the last five years the share of loans by state banks rose from 30% to almost 45% while the share of private banks declined from 70% to 55%.

25
services and construction: service and construction employment grew by about 55% and 60%, respectively, between 2007 and 2018, while employment in industry and agriculture grew about 20%.35
Figure 18
Source: Turkstat, Uysal and Furkan (2019) and our calculations Note: Absolute number of employed by sector.
One of the major aspects of low-quality growth we have already emphasized is its fragile nature. This fragility is visible in the recent Turkish experience. As our Figure 7 above illustrates, credit-fueled growth has led to much more rapid expansion of imports than exports, causing a significant current account deficit (averaging around 5% of GDP in the last 10 years),36 and may be one of the factors contributing to high inflation (around 10% over the last 10 years and 15% more recently).
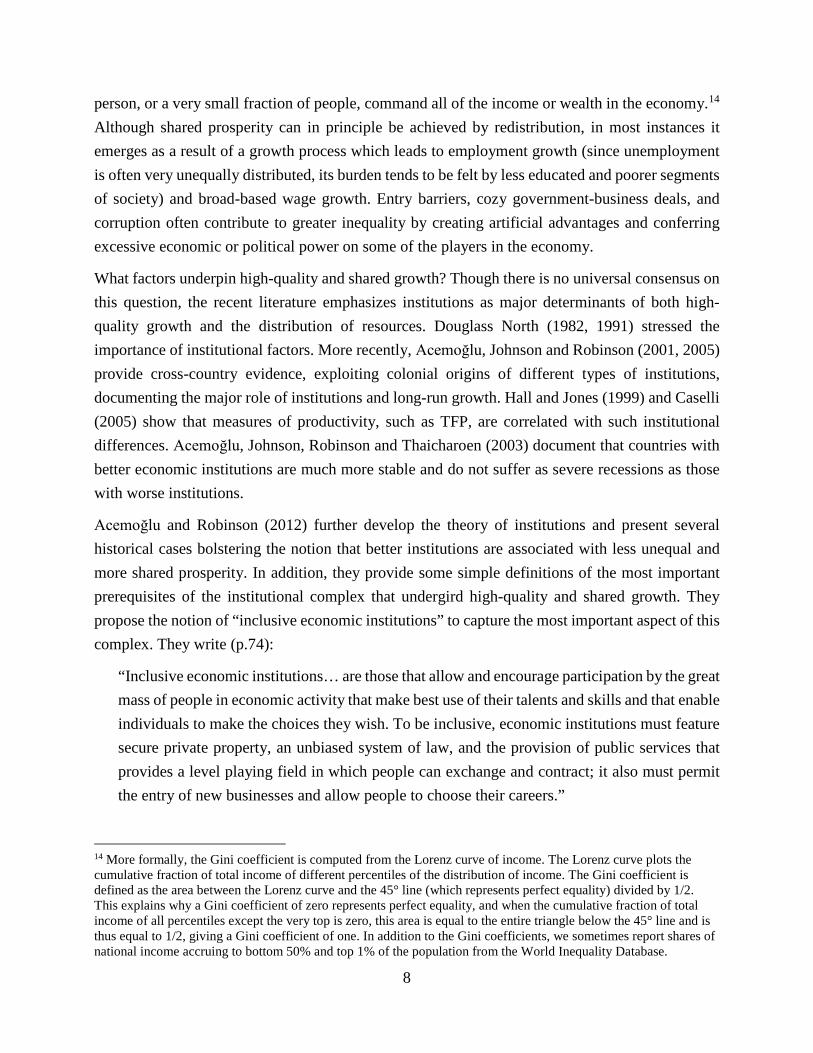
Another indication of this fragility has been the composition of capital inflows into the Turkish economy. Figure 19 shows that the share of foreign direct investment (FDI) and long-term capital
35 Revised Turkstat data are available from 2014. These data are extended back to 2005 by Turkstat, and further to 1988 by us using growth rates of old series. There is a very sharp jump in employment in 2014 in the revised Turkstat data. Following the recommendation in Uysal and Kavuncu (2019), this jump is smoothed using the geometric average with 2013. Differences in sectoral classifications between the old and new time series introduce additional measurement error in the sectoral time series. 36 In 2019, current account deficit has disappeared, but this is largely owing to the sharp contraction in economic activity.
26
flows have been replaced by shorter-term, more fickle flows. FDI flows (excluding real estate), which were essentially zero in early 2000s, rose to 3% of GDP in 2006 and then stayed around that level for a few years, but then declined to 0.5% of GDP recently.
Figure 19
Source: CBRT, Balance of Payments Statistics Note: The figure shows (net) capital inflows in three broad categories: foreign direct investment, long-term borrowing by residents, mainly loans contacted by the private sector; and the sum of portfolio flows and short-term borrowing.
IV. THE INSTITUTIONAL FOUNDATIONS OF LOW-QUALITY GROWTH
The prime cause of low-quality and unshared growth in Turkey is to be found in the nature and evolution of Turkish institutions. Though the Republic of Turkey, founded in 1923, repudiated much of the institutional heritage of the Ottoman Empire and undertook sweeping reforms, Turkish institutions never became truly inclusive. The military and bureaucratic elites were excessively powerful throughout, politics remained top-down, and democratic activity was periodically suppressed, upended and interrupted by military actions and sometimes coups.

27
The one-party rule, imposed by the founder of the republic, Mustafa Kemal Atatürk, dominated Turkish politics during the first three decades of its existence.37 Despite the veneer of republican institutions, there was very little popular participation in politics and no civil society activity to speak of during this era. One party rule formally came to an end in the first semi-democratic elections of 1950, which brought the Democratic Party to power. This party, fashioning itself as a representative of the provincial business interests and conservative cultural values, at first spearheaded an economic and political opening of the country, but by the end of the decade had turned increasingly authoritarian and repressive. In 1960, the military moved against the Democratic Party and proceeded to hang its leader, Adnan Menderes. The military then engineered two more coups, in 1971 and 1980, and also brought down an Islamist coalition government in 1997 with the threat of a coup (and subsequent action by the Constitutional Court closed the party). Even during periods of electoral democracy, the military frequently intervened in matters of state and foreign policy.
Lack of democratic and popular participation created an environment without proper political checks, and consequently, government-business relations remained opaque and were mired in irregularities and systematic favoritism. For most of this period, connections to the government created myriad advantages for certain businesses, breeding corruption and limiting the competitiveness of the Turkish economy.
This political environment did not encourage broad-based, high-quality public good provision and contributed to underinvestment in education and skills. It was also not conducive to FDI, which was for the most part discouraged by the authorities. This took away one of the most direct channels via which the technology of Turkish industry could be upgraded. It also made the economy more prone to current account imbalances. Much of the growth of the economy, as a consequence, has been highly volatile, with periods of growth followed by sharp recessions as our Figure 4 above shows.
These institutional weaknesses have been a mainstay of the Turkish economy more recently too. In its regular biannual survey of the Turkish economy, the OECD concluded (2016, p. 89):
“Turkey’s participation in [global value chains] remains below potential owing to institutional features that hamper efficient allocation of capital and labor, obstacles inherent in bilateral trade agreements and entry regulations, underdeveloped human capital and insufficient investment in innovation, R&D and knowledge-based capital.”
37 See Zurcher (2004) for a summary of Turkey's 20th-century political history and Pamuk (2018) for its economic history.
28
Bolstering the plausibility of our interpretation — on a causal link from institutions to low-quality growth — is the fact that Turkey’s high growth episode between 2002 and 2006 overlapped with major institutional and political changes. During this brief period of five years, there was a general opening in economic institutions, raising competitiveness, reducing macroeconomic and microeconomic policy uncertainty, stemming bureaucratic and government corruption, and bringing a modicum of rule-based decision-making instead of the extreme discretion that had characterized earlier periods. These changes in economic institutions started in 2001, in the aftermath of Turkey’s severe financial crisis, but they were then continued by the first AK Party (Justice and Development Party) government that came to power in 2002.
The changes in economic institutions were tightly linked to political developments. During this period, military tutelage waned, Turkish democracy deepened, and a range of ambitious political and social reforms were initiated under the auspices of the EU-accession process.
However, this brief period of institutional reform did not last and was followed by major reversals in both economic and political institutions, as we explain in this section. Consistent with our interpretation, as institutions started deteriorating after 2006, low-quality growth set in again, and prosperity became less shared.
a. The Evolution of Turkish Economic Institutions
Let us start with economic institutions. The evidence suggests that the 2000s witnessed a major change from the previous decades in terms of “delegation of the decision-making power to relatively independent agencies, and the establishment of rules that constrain the discretion of the executive” (Atiyas, 2012).
A key pillar of macroeconomic policy reform was the granting of greater independence to the Central Bank starting in 2001. A new law defined the sole objective of the Central Bank as achieving and maintaining price stability in the context of first implicit and then formal inflation targeting, and prohibited direct lending to the government.
Monetary policy reforms were complemented by equally major fiscal reforms. Most notably, two new laws enacted transparent controls on ministerial spending, borrowing and off-budget expenditures. The first, the Public Finance and Debt Management (PFDM) Law of 2002, brought all central government borrowing under strict and transparent rules and imposed uniform reporting requirements on all debts. The second, the Public Financial Management and Control Law (PFMCL) of 2003, rationalized fiscal management and established “principles and merits, multi-year budgeting, budget scope, budget execution, performance management and strategic planning, internal control, accounting, monitoring and reporting.” The sum total of these two laws was to

29
significantly increase fiscal accountability of the government, and they duly introduced much greater discipline to public finances.
Equally sweeping was a new procurement law, introduced under pressure from the IMF and the World Bank in 2002. This law targeted the high levels of corruption and irregularities in public procurement, which had become commonplace under the auspices of the highly politicized and ineffective State Procurement Law of the early 1980s. The new laws increased transparency and opened the tender process to competitive bidding. There were similar changes in the regulatory front and a number of new independent autonomous agencies were founded or were further empowered.38
In sum, there were striking steps towards best-practice laws and regulations during this short period of time, and many of these reforms started having immediate effect. Even if from the beginning some of them were not as ambitious as they first appeared and there were systematic inconsistencies, the reforms created a sea change in public finances and signaled the coming of a more accommodating environment for domestic and foreign businesses.
In part as a result of these reforms, the overall institutional environment in the Turkish economy improved significantly in the early 2000s. Figure 20 provides the World Bank’s assessment of changes in various dimensions of Turkish economic institutions for two sub-periods, 2000-2007 and 2008-2017.39 Indices of voice and accountability, government effectiveness, rule of law and control of corruption all show major improvements during the early 2000s (see the notes to Figure 20 for the definitions of these indices).
38 Prominent examples include the Public Procurement Authority, the Banking Regulatory and Supervision Agency, the Energy Market Regulatory Authority, the Telecommunications Authority, the Competition Authority, and the Capital Markets Board. These agencies professionalized the bureaucracy and reduced discretionary government influence over regulation and the policy uncertainty that this entailed. 39 These indicators come from the Worldwide Governance Indicators project of the World Bank, which constructs aggregate indicators for six broad dimensions of governance, based on the views of a large number of enterprise, citizen and expert survey respondents in industrial and developing countries. The six dimensions are: 1) Voice & Accountability (perceptions of the extent to which a country's citizens are able to participate in selecting their government, as well as freedom of expression, freedom of association, and a free media), 2) Political Stability and Lack of Violence (perceptions of the likelihood of political instability and/or politically-motivated violence, including terrorism), 3) Government Effectiveness (perceptions of the quality of public services, the quality of the civil service and the degree of its independence from political pressures, the quality of policy formulation and implementation, and the credibility of the government's commitment to such policies), 4) Regulatory Quality (perceptions of the ability of the government to formulate and implement sound policies and regulations that permit and promote private sector development), 5) Rule of Law (perceptions of the extent to which agents have confidence in and abide by the rules of society, and in particular the quality of contract enforcement, property rights, the police, and the courts, as well as the likelihood of crime and violence); and 6) Control of Corruption (perceptions of the extent to which public power is exercised for private gain, including both petty and grand forms of corruption, as well as "capture" of the state by elites and private interests).

30
Figure 20
Source: World Bank. Note: This figure reports six governance indicators during the pre-crisis (2000-2007) and post-crisis (2008-2017) periods.
Particularly important for Turkish business environment was the mounting corruption of the 1980s and 1990s. Data from the Transparency International, summarized in Figure 21, show a steady reduction in perceived corruption during this era, with Turkey’s position in international rankings improving from around high-70s to just above 50 in the mid-2000s.40
40 The corruption perception index ranks countries and territories based on how corrupt their public sector is perceived to be. A country or territory’s score indicates the perceived level of public sector corruption on a scale of 0-100, where 0 means that a country is perceived as highly corrupt and 100 means it is perceived as very clean. A country's rank indicates its position relative to the other countries and territories included in the data set.

31
Figure 21
Source: Transparency International Note: This figure reports the evolution of the corruption perception index and Turkey’s rank among countries in Transparency International’s data set.
But this encouraging picture soon started to crumble from 2006-2007 onwards. First came the complete stalling of the structural reform efforts. This was followed by the dismantling of some of the earlier reforms and deterioration in the overall institutional environment. The institutional slide accelerated during AK Party’s third term that began in June 2011.
The gutting of the procurement law, which was introduced with great expectations and initially had some impact, is indicative of the extent and nature of the reversal in the quality of economic institutions during this period. It also signals that AK Party was never at ease with the new law, seeing it from the very beginning as a constraint on its infrastructure investment plans and the funneling of state resources toward its own constituencies. As the party gained confidence and control, the procurement law was gradually weakened and sidelined. There was first a significant expansion of “exceptions”, which undercut the transparency and competitiveness of the procurement process. These were followed by major changes in the tender rules (from open tenders to restricted ones), the introduction of various advantages for domestic bidders, and the implementation of rather high minimum monetary limits, below which procurement of goods and services would be exempted from the law. In the words of the EU accession report in 2014,

32
“Turkey's public procurement legislation remains not in line with the acquis in a number of aspects. This includes numerous derogations and exemptions from the scope of the law. Both the classical and utilities sectors are formally subject to the same law and procedures, thus making the legislation for the utilities sector more restrictive than envisaged by the EU Utilities Directive. [...] There have been various allegations of political influence on public tenders.”
As documented by Gürakar (2016), the number of contracts that were left outside the transparent public procurement practices increased substantially starting around 2005. By 2011 about 44% of all contracts were taking place outside of the confines of the new law, and the number of contracts awarded by open tender had dwindled.41
The procurement law was in fact not as comprehensive as it first appeared, as important budgetary items were not covered by the law. These included spending, public-private partnerships and most importantly, the State Housing Development Administration, TOKİ, which was at the time directly attached to the Prime Minister’s Office.42 As detailed in Atiyas (2012), although TOKİ’s exemptions were originally limited to public housing projects, in 2011 these were extended to procurement for other public-sector construction projects (e.g., stadiums, public parks and buildings). Because TOKİ was further exempted from the budgetary rules imposed by PFMCL, this critical part of the public procurement process was never subject to effective monitoring. The organization has also played an increasingly unaccountable role in taking over and redistributing land in many urban areas. The EU’s Progress Report of May 2019 summarizes the situation as follows:
“The vast and increasing number of exemptions inserted into the framework law on public procurement has become a matter of growing concern. In particular, tenders at municipal level and for public-private partnerships for large infrastructure investments remained prone to corruption”
Arguably more ominous was the aggressive attacks by the government on autonomous agencies. As explained in Özel (2015), after some de facto meddling in the affairs of these agencies (e.g., in the form of influencing the election of board members or the hiring and firing of staff), the government formally ended the independence of these agencies in 2011. Decree No. 649 legislated that ministers would have “the authority to inspect all transactions and activities of the related,
41 Gürakar (2016), pp. 53-54. Also see Gürakar and Meyersson (2016) who look specifically at the construction auction projects and find that “increased discretion in public procurement not only increased costs – in terms of both the winning bid and rebate value – but also increased the likelihood of the winning firm being politically connected to the ruling AKP”. 42 After the switch to the presidential system, TOKİ has been brought under the purview of the Ministry of Environment and Urban Planning.
33
attached and affiliated agencies” (which included the autonomous regulatory agencies), thus giving the ministers and their staff the ability to restrict the independence of these agencies. At around the same time, the idea of independent regulatory institutions has been dealt another blow, with the then-deputy prime minister Ali Babacan stating that “it was time for some independent agencies to re-delegate their authority” (Özel, 2015). This “re-delegation” has subsequently intensified, and with systematic political meddling, these agencies have duly lost all independence.
The evolution of the Central Bank independence illustrates these institutional dynamics. Starting in the second half of the decade the Central Bank came under heavy pressure from the then-prime minister Erdoğan to reduce interest rates. Even though the Bank’s leadership was fairly compliant to the prime minister’s demands, the pressure on the institution mounted. In July 2019, its governor, already hand-picked by the government, was abruptly sacked for not being sufficiently accommodating. Thereafter, the Central Bank started reducing the interest rates, used its cash reserves to finance the government budget deficit, and initiated backdoor sales of foreign exchange reserves to state banks to bolster the value of the lira. The whole episode is damaging not just because of its implications for macroeconomic policy, but because it demonstrates the unwillingness of the administration to be restrained even by the most pliable organizations.
This sharp reversal in economic reforms had immediate effects on economic institutions. Our Figure 20 above based on World Bank governance indicators reveal major deterioration in all dimensions of economic institutions — including stability and regulatory quality where Turkey was already not doing very well, and voice and accountability, government effectiveness, rule of law and control of corruption where Turkey had shown improvements in the early 2000s. Consistent with these patterns, Figure 21 reveals an abrupt turnaround in corruption perceptions, most likely reflecting mounting non-transparency and discretion in public procurements and intensifying government involvement in business decisions.
b. The Evolution of Turkish Political Institutions
We have argued that the turnaround in Turkey’s economic performance is a reflection of the turnaround in economic policies and institutions, including the stalling or reversal in the process of much-needed structural reforms. But this only provides a proximate answer to the deeper question of why economic policies and institutions improved in the first phase and then went into a reversal. We argue that both the initial improvements in economic institutions and their subsequence slide have political roots.
During its first five years of rule the AK Party became, largely unwittingly and perhaps even unwillingly, an instrument of political reform. This period witnessed the broadening of the political
34
base as the military tutelage in Turkish politics, probably the most important factor holding back Turkish democracy and civil society, ended. A confluence of factors came together to make the early 2000s a propitious time for such a fundamental transformation in Turkish politics. But this period, and the resulting political opening, was short-lived.
The AK Party came to power after a basic structure of economic reforms had been put in place following the 2001 financial crisis. The party at first lacked a deep bench of qualified experts to take over the relevant bureaucracies, limiting its reach and ambitions.
Equally important was that the AK Party was elected with a limited mandate, with just 34% of the vote, and as a partial outsider to the corridors of power. It was viewed more as a representative of an increasingly disenfranchised and dissatisfied segment of Turkish society. This segment included provincial, conservative businessmen, the urban poor (who were often recent migrants), and the rural population (excluding Kurds and Alevis). These less Westernized, more religious, and more conservative social groups were never welcomed by the Republic’s rulers, the so-called “Kemalist elites”, named after their ideological commitment to the principles of Mustafa Kemal Atatürk, and often defined to include the military, the bureaucracy and big, urban-based conglomerates, and argued to be represented by the state’s party, the Republican People’s Party. The reality was more nuanced, however. Conservative ideology associated with the base of the AK Party was not systematically excluded from power for most of the republican period and became particularly important both in school curricula and as the active rhetoric of many governments since the 1980 military coup, especially as a strategy to combat the presumed threat from the left.
This nuance did not stop many conservative Turks from feeling excluded and sidelined politically and culturally. Many started seeing a powerful culture war in Turkey, in which they felt they were disadvantaged. It is this culture war that was invoked and bombastically summarized by Prime Minister Recep Tayyip Erdoğan’s famous statement:
“In this country there is a segregation of Black Turks and White Turks. Your brother Tayyip belongs to the Black Turks.”43
The AK Party’s rise to power thus came to be seen as the political empowerment of this previously-excluded group. During their early rule, they conceived their survival to depend on democracy (which they interpreted as respecting the electoral results rather than succumbing to a military intervention against them).
Additionally, the AK Party came on the scene when EU-Turkey relations were revitalized. The party presented itself as a staunch supporter of EU accession. The process leading up to the
43 While the exact timing of this statement is a matter of debate, it first rose to prominence when quoted in a New York Times interview with the newly-elected Erdoğan by Deborah Sontag in May 2003.
35
accession negotiations, launched on October 2005, had started reasonably earnestly and had gained significant momentum by 2006, and had the strong backing of the Turkish public.44
The initial optimism about the EU accession process provided a powerful anchor to institutional reforms in Turkey. Many agreed with the sentiment of a widely discussed report from 2004:
“Our starting assumption is that it is likely that accession negotiations would start during 2005, but that they would last for quite some time, with membership materialising only around 2012-15. We therefore take a long- term perspective and explore particular areas in which the EU and Turkey could cooperate during the long interim negotiating period.” (The European Transformation of Turkey, Derviş et al, 2004)
Consequently, the role that the IMF and the World Bank played on bolstering economic reforms in the aftermath of the 2001 financial crisis came to be complemented by the European Union as a guarantor of political reforms.
Indeed, EU accession process was vital for kickstarting sweeping advances in civil and political rights, reducing the military’s role in politics, initiating judicial reforms, and providing a template for best-practice legislation in a wide range of areas. EU pressure also enabled the initiation of various difficult reforms, including improved property rights for non-Muslim religious foundations, the lifting of draconian penalties against speech construed as criticizing Turkish identity, the introduction of the ability of civilian courts to try military personnel, the banning the trials of civilians in military courts, laws protecting children, improved trade union rights (including the right for public service workers to sign collective labor agreements, removing previous bans on political and solidarity strikes), and permission for individuals to apply to the Constitutional Court in cases where their freedoms of fundamental rights are violated (Hale, 2011).
These were followed by the lifting of bans against Kurdish protests and legislation allowing state-run Turkish radio and television to broadcast in Kurdish, the ending of the emergency rule over the last two of the 13 Kurdish-majority provinces, the introduction of broad civilian supervision over defense expenditures, and the removal of National Security Council presence in the oversight of cinema, video, musical works and radio and television as well as a shift in the government’s willingness to generally respect rulings by the European Court of Human Rights. These reforms were by and large a direct result of EU-Turkey engagement (Kirişçi, 2011 and Gürsoy, 2011).
The military and nationalist forces were opposed to these reforms, and in all likelihood they would have been more strenuously resisted in the absence of the shepherding role of the European Union.
44 According to surveys conducted by the German Marshall Fund, those in favor of EU rose from 40% in the late 1990s to 70% around 2004-2005, but dwindled rapidly thereafter (see below).

36
Equally critical was that the prospect of EU accession acted as an anchor and a carrot to the ruling party — there were major economic gains from closer ties with Europe. It wasn’t just the economic benefits of EU accession that motivated the AK Party, however. Since the AK leaders viewed themselves under constant threat from the military, closer ties to EU appeared as an attractive insurance strategy against a military coup. Since the majority of the population was increasingly keen on becoming part of Europe, the cards were stacked against any moves that would alienate Turkey’s European partners.
The overall consequence of this battery of reforms was a clear improvement in the perceived quality of Turkish political institutions. Figure 22 and 23 present the evolution of a measure of political rights and a measure of freedom of expression from the Freedom House. They both show improvements during the early 2000s, but even sharper deteriorations thereafter, reflecting the about-face in the character of Turkish politics after the mid-2000s. This reversal reflected several trends coming together.
First, the economic institutional framework put in place after the 2001 crisis ceased to constrain AK Party elites and mayors as they found myriad ways of circumventing the regulations and laws, as we recounted in the case of the procurement law.
Second, the 2002 election brought the beginnings of the end of the two major center-right parties, with their votes going almost in block to the AK Party in the 2007 elections. The AK Party thus became a much more formidable electoral force and by 2011 commanded almost 50% of the vote.

37
Figure 22
Source: Freedom House Note: The Political Rights index measures the degree of freedom in the electoral process, political pluralism and participation, and functioning of government. Until 2003, average ratings for political rights that fell between 1.0 and 2.5 were designated Free; between 3.0 and 5.5 Partly Free, and between 5.5 and 7.0 Not Free. From 2003 onward, average ratings that fall between 3.0 and 5.0 are Partly Free, and those between 5.5 and 7.0 are Not Free.
Third and perhaps even more importantly, the balance between the AK Party (and its base) and the Kemalist forces changed dramatically. Much of the military establishment was already unhappy about both the AK Party’s rise to power and their increasingly marginalized role in the 2000s, when the AK Party nominated its number two, Abdullah Gül, for the presidency. The military, and their civilian allies, were alarmed by the fact that Gül’s wife wore a headscarf and would represent Turkey in international forums and inhabit Atatürk’s presidential palace.
This, combined with their general unease about the political direction of the country, made the military top brass move to threaten another coup with a web memorandum in April 2007. The Constitutional Court started proceedings to close the AK Party for anti-secular activities. But the situation was different in 2007 than in 1960 or 1997. The AK Party had already organized deeper social networks within modern Turkish society, and had taken control of large parts of the bureaucracy and the increasingly heavily militarized police, while the status of the traditional military within Turkish society was at an all-time low. As noted previously, the EU accession process also provided a strong bulwark against military meddling in Turkish politics. The military's threat this time came to nothing.

38
Figure 23
Source: Freedom House, V-Dem. Note: This figure reports the freedom of expression index, which measures to what extent the government respects press and media freedom, the freedom of ordinary people to discuss political matters at home and in the public sphere, as well as the freedom of academic and cultural expression. The scale is from low (0) to high (1).
This episode not only sidelined perhaps the most powerful opponent of the AK Party, the Kemalist generals, but also further radicalized the AK leadership. According to some insider accounts, leading AK figures are reported to have packed their bags during the events of April 2007, fully expecting the military to come to power and put them in jail. Their David and Goliath reading of Turkish history — where the victimized “Black Turks” are stamped out by the conspiracy of Kemalist “White Turks” — was both confirmed and embellished. They may have concluded that they had to destroy the anti-AK military elites. They may have even come to see the dismantling of the existing institutional structures, which they saw as biased towards hostile groups, as a political necessity.
This is also the period during which the collaboration between AK Party supporters in the bureaucracy and the members of the secretive Gülen movement, led by the reclusive Islamic preacher, self-exiled in Pennsylvania, Fethullah Gülen, may have become stronger. The Gulenists had already taken sometimes open, sometimes clandestine root in many parts of the bureaucracy, police force and the military. They now started working more closely with the government to purge
39
Kemalists and independents from these positions. Particularly notable were the sham Ergenekon and Sledgehammer trials, targeting former and some current mid-ranking soldiers and generals.45
Finally, the EU’s anchor for Turkish institutional reforms and leverage over Turkish politicians came to an abrupt end at around 2010 as the accession process almost completely stalled. Several factors played a role in this rupture. The first stumbling block was Cyprus. The collapse of the UN-sponsored talks on a comprehensive settlement and Turkey's unwillingness to extend the Customs Union to Cyprus brought relations to a standstill and caused the suspension of eight ongoing chapters in 2006. During this period, the government and many nationalist elements in the population intensified their resistance to the legal and human rights reforms, which they saw as strengthening Kurds and other minorities. Furthermore, there was a backlash against Turkey in some of the key European countries, most notably in France’s referendum and the rise of Nicholas Sarkozy, with an explicitly anti-Turkish accession platform. These developments started transforming attitudes towards the European Union within the Turkish population. As disillusionment set in, support for EU took a tumble, falling from above 70% in 2004 to a low of 40% in 2007 (Acemoğlu and Üçer, 2015).
The implications of all of these trends for the Turkish political institutions have been striking. After 2007, the government started cracking down against various critical media outlets and independent societal organizations, many of which had started flourishing thanks to the greater freedoms of the early 2000s. In May 2013, protests erupted in Gezi Park, near İstanbul’s Taksim Square. The protests were a reaction to plans to build a new shopping mall in one of the few remaining green areas of the city, but they quickly turned into a broader movement critical of government policies and corruption, and started articulating demands for greater freedom of belief, expression and media. Similar protests got underway in other major cities. Hopes that there would be a dialogue between the government and the protesters were soon dashed, and a heavy-handed crackdown followed.
The mid-2010s also witnessed three other developments, with major implications for Turkey’s institutions. The first was a sharp reversal in the government’s Kurdish policy, most notably with the complete reversal of the so-called “peace process” that Erdoğan himself had initiated. Simultaneously, Erdoğan started courting nationalist votes and took a much more hardline attitude towards Kurdish demands. The result was a significant deterioration in the security situation and the resumption of armed conflict in the southeast of the country.
The second was a falling out between Erdoğan and Gülen (and their supporters). Their power struggle culminated in a botched coup attempt in July 2016, which appears to have been
45 On the Ergenekon trials, see Jenkins (2011). On the Sledgehammer case, see Rodrik (2014).

40
masterminded by Gülen’s allies in the military. The failed coup attempt was followed by a state of emergency and a systematic purge of both Gulenists and other critics of the government from the bureaucracy and security forces, that ended up with the arrest or dismissal of some 140,000 state employees (Kingsley, 2017). Though by all accounts Gulenist penetration in the bureaucracy and security services was real and highly damaging to Turkish institutions, the post-coup purges were often carried out without due process and the whole process further weakened the independence of the judiciary.
The third major development was the narrow approval of Erdoğan’s proposed change in Turkey’s constitution in an April 2017 referendum, transforming the country from parliamentary to a presidential system. The new constitution concentrates significant powers in the hands of a directly elected president, who now controls all executive authority, sets economic and foreign policy, has sweeping appointment powers, and is subject to very weak checks and balances. Though the new presidential system is still in flux, it has already massively expanded executive power, reduced political pluralism, and removed de jure and de facto constraints on political discretion (see Makovsky, 2017, Alirıza, 2018, Demirtaş, 2019, and Kirişçi and Toygur, 2019).
All of these changes have been associated with a broader weakening of democratic institutions, further restrictions on the freedom of speech, less independence for media, and a further deterioration in Turkey’s record on human and civil rights. The indices shown in Figures 22 and 23 above confirm these trends.
Equally telling is the number of journalists jailed in Turkey, which is plotted in Figure 24 together with the total number of imprisoned journalists in the world. Despite the fact that most journalists today are allied with the government, happy to faithfully toe its line, Turkey not only tops the list of countries where it is most precarious to be a journalist, but accounts for a staggering 25-30% of total number of jailed journalists in the world.
All in all, Turkish political institutions, which became more democratic and more inclusive in the first half of the 2000s for a variety of reasons, started moving in the opposite direction, and the last 10 years or so have witnessed a significant deterioration in civil rights, freedom of speech and media freedom as well as a less constrained political environment with more curtailed participation from society and societal organizations. There is a strong overlap between the timing of the political reversal and the volte-face in economic institutions.

41
Figure 24
Source: Committee to Protect Journalists Note: Shows the total number of imprisoned journalists around the world and in Turkey, as well as the ratio of imprisoned journalist in Turkey as percent of total.
V. THE WAY FORWARD
The account of the Turkish macroeconomy we have provided has three major implications.
First, the achievements of the Turkish economy have been hampered by its institutional structure that has made its growth low-quality and often unsustainable. The economy has not generated shared prosperity either, because the same institutional characteristics have underpinned a more unequal distribution of resources in the economy.
Second, the brief interlude between 2002 and 2006 demonstrates that improvements in political institutions, bolstered by significant weakening in Turkey’s democratic institutions, are feasible and can bear dividends relatively quickly in terms of productivity growth, more rapid economic change, and more equally shared prosperity.
Third, these socially costly dynamics notwithstanding, there is no reason to expect the political process to bring such high-quality growth by itself. Indeed, the 13 years since 2006 have witnessed the resurgence of low-quality growth driven by deteriorating economic and political institutions. The fallback from this episode of relatively rapid but low-quality growth has been a familiar one: the specter of protracted economic stagnation.

42
In the rest of this concluding section, we briefly discuss what our framework and prospective suggest as the best way forward.
Because low-quality growth has been sustained by rapid expansion of credit to households and especially to the corporate sector, we may be in the midst of a triple balance sheet slowdown. The corporate sector is heavily indebted and anecdotal evidence suggests that a significant fraction of companies are already facing serious financial difficulties. Problems on household balance sheets may further increase the strains on the system, especially as they may lead to a sharp decline in demand for housing, worsening the already precarious situation facing the construction sector.46 Finally, the balance sheet of the banking sector looks compromised. The fraction of nonperforming loans on the balance sheets of private banks has increased sharply and now (as of early October) exceeds 5% of all loans, and in the absence of efforts to systematically clean these balance sheets, this fraction is only likely to grow in the near future.47
These problems could spell trouble for short-term prospects of the Turkish economy. Although the more sanguine view of a “V-shaped” recovery, similar to Turkey’s experience in the 2001 and 2009 recessions, is popular among some commentators, business representatives and government officials, a more prolonged period of stagnation or perhaps even a “second-dip” may be more likely in the years ahead. This is partly because of the persistently low-quality nature of growth we documented above that appears to have run out of steam, and partly because of the above-described balance sheet problems among banks, corporations and households, coupled with the absence of any comprehensive restructuring framework, which raise the likelihood of a lengthy period of low investment and weak or even negative job growth.
The way forward, therefore, must involve not only a focus on how to improve the quality of Turkish growth in the medium-term, but proactive steps to redress the balance sheets of households, firms and banks.
The solutions to these problems are linked. The Turkish economy can avoid a sharp recession by strengthening corporate and banking balance sheets, which in turn necessitates robust capital inflows. The only way to attract capital inflows on favorable terms and maturity structure is to improve the business environment as perceived by foreign firms and investors. This means embracing the same types of economic reforms that Turkey undertook in the early 2000s, including
46 Indeed, home sales have been shrinking at an annual rate of about 20% throughout the first eight months of 2019. 47 In all likelihood, this number is a severe underestimate because of the large size of so-called Stage II loans (loans under close monitoring) and lax regulations, making banks themselves unwilling to declare nonperforming loans. The government has recently (September 2019) instructed banks to recognize a portion of these nonperforming loans, amounting to TL46 billion (around $8 billion). See also Dalgın and Sak (2019) and IMF (2019b).

43
major institutional reforms and a less discretionary and more predictable microeconomic policy framework.
The most important institutional reforms, just as in the early 2000s, include improving the legal system (both in terms of its efficiency and independence from the executive), reducing policy uncertainty (for example, by restoring the independence of the Central Bank and other regulatory agencies, and reducing politician discretion in economic decisions), increasing competitiveness, and stemming corruption. Such reforms can only be credible, however, if they are underpinned by genuine reforms strengthening Turkish democracy.
None of this is easy or even likely. As emphasized in Acemoğlu and Robinson (2012) as well as in our account of the evolution of Turkish political institutions above, political change and reform seldom happen simply because there is an urgent need for them; rather, they follow their own logic, often depending on political balances and the formation of the relevant coalitions. Unless political change takes place, deep-rooted economic reforms remain unlikely.
Perhaps the greatest danger for Turkey then is a further worsening of the political situation together with half-hearted interventions to prevent corporate and banking failures, without dealing with the root causes of Turkey’s low-quality, unsustainable economic growth.
44
REFERENCES Acemoğlu, Daron. Introduction to Modern Economic Growth, Princeton University Press, (2009).
Acemoğlu, Daron, Aghion, Philippe and Zilibotti, Fabrizio. “Distance to Frontier, Selection, and Economic Growth”, Journal of the European Economic Association, Vol. 4(1), pp. 37–74, (2006, March).
Acemoğlu, Daron, Johnson Simon and Robinson, James A. “The Colonial Origins of Comparative Development: An Empirical Investigation”, The American Economic Review, Vol. 91, No. 5, pp. 1369-1401, (2001, December).
Acemoğlu, Daron, Johnson, Simon and Robinson, James A. “Institutions as the Fundamental Cause of Long-Run Growth”, Handbook of Economic Growth, VolumeIA. Edited by Philippe Aghion and Steven N. Durlauf, pp.385-472, (2005).
Acemoğlu, Daron, Johnson, Simon, Robinson, James and Thaicharoen, Yunyong. “Institutional Causes, Macroeconomic Symptoms: Volatility, Crises and Growth”, Journal of Monetary Economics, Vol. 50, pp. 49–123, (2003).
Acemoğlu, Daron, Naidu, Suresh, Restrepo, Pascual and Robinson, James A. “Democracy Does Cause Growth”, Journal of Political Economy, Vol. 127(1), pp. 47-100, (2019, February).
Acemoğlu, Daron and Restrepo, Pascual. “Automation and New Tasks: How Technology Displaces and Reinstates Labor”, Journal of Economic Perspectives, Vol. 33, No.2, pp. 3-30, (2019).
Acemoğlu, Daron and Robinson, James. Why Nations Fail, Crown Publishing Group, (2012).
Acemoğlu, Daron and Üçer, Murat. “The Ups and Downs of Turkish Growth, 2002-2015: Political Dynamics, the European Union and the Institutional Slide”, The Search for Europe: Contrasting Approaches, BBVA Open Mind Press, (2015, October).
Alesina, Alberto and Rodrik, Dani. “Distributive Politics and Economic Growth”, Quarterly Journal of Economics, (1994).
Alesina, Alberto and Perotti, Roberto. “Income Distribution, Political Instability, and Investment”, European Economic Review, Vol .40, pp.1203-1228, (1996, June).
Alirıza, Bülent. “Erdoğan Takes Total Control of ‘New Turkey’”, Center for Strategic and International Studies, (July 18, 2018).
Atiyas, İzak. “Economic Institutions and Institutional Change in Turkey during the
Neoliberal Era”, New Perspectives on Turkey, No. 14, pp. 45-69, (2012, September).

45
Banerjee, Abhijit and Esther Duflo. “Inequality and Growth: What Can the Data Say” Journal of Economic Growth, Vol. 3, pp. 267-299, (2003).
Caselli, Francesco. “Accounting for Cross-Country Income Differences”, Handbook of Economic Growth, edition 1, Vol. 1, pp. 679-741, Elsevier, (2005).
Cappelli, Peter H. “Skill Gaps, Skill Shortages, and Skill Mismatches: Evidence and Arguments for the United States”, Sage Journal, Vol. 68, issue: 2, pp. 251-290, (2015).
Dalgın, Burak, Sak, Güven. Re-ensuring Flow of Credit to Return To Growth: The Case For A Turkish Troubled Assets Restructuring Program (2019, April)
Demiralp, Selva, Demiralp, Seda and Gümüş, İnci. “The State of Property Development in Turkey: Facts And Comparisons”, Koç University-Tüsiad Economic Research Forum, Working Paper 1503, (2015, January).
Demirtaş, Serkan. “The first year of Turkey’s presidential system”, Hürriyet Daily News, (2019, July 10).
Derviş, Kemal, Emerson, Michael, Gros, Daniel, and Ülgen, Sinan. “The European Transformation of Modern Turkey”, Brussels: Centre for European Policy Studies, Istanbul: Economics and Foreign Policy Forum, (2004, September).
Dollar, David, Kleinberg, Tatjana and Kraay, Aart. “Growth Still is Good for the Poor”, Policy Research working paper; No. WPS 6568. Washington, DC: World Bank, (2013).
Dornbusch, Rudiger and Edwards, Sebastian. The Macroeconomics of Populism, University of Chicago Press, (1991, January).
Eichengreen, Barry, Park, Donghyun and Shin, Kwanho. “Growth Slowdowns Redux”, Japan and the World Economy, Vol. 32, pp. 65-84, (2014).
Gill, Indermit S. and Kharas, Homi. “The Middle-Income Trap Turns Ten”, World Bank, Policy Research Working Paper, No. 7403, Washington, DC, (2015, August).
Gill, Indermit and Kharas, Homi. “An East Asian Renaissance: Ideas for Economic Growth”, World Bank, Washington, DC. (2007).
Gordon, Robert J. The Rise and Fall of American Growth: The U.S. Standard of Living since the Civil War, Princeton University Press; Reprint edition, (2017, August).
Gürakar, Esra. Politics of Favoritism in Public Procurement in Turkey Reconfigurations of Dependency Networks in the AKP Era, Palgrave Macmillan, US, (2016).

46
Gürakar, Esra and Meyersson, Erik. “State Discretion, Political Connections and Public Procurement: Evidence from Turkey”, (Website), (2016, March).
Gürsel, Seyfettin, Durmaz, Mine. “Large But Insufficient Increase In Quality Of Education?”, BETAM Research Brief, (2014, January) Gürsoy, Yaprak. “The Impact of EU Driven Reforms on the Political Autonomy of the Turkish Military”, in Part I. “Turkey and the European Union: Accession and Reform”, guest edited by Avcı, Gamze and Çarkoğlu Ali., South European Society and Politics (2011, June). Hale, William. “Human Rights and Turkey's EU Accession Process: Internal and External Dynamics, 2005–10”, in Part I. “Turkey and the European Union: Accession and Reform”, guest edited by Avcı, Gamze and Çarkoğlu Ali., South European Society and Politics (2011, June). Hall, Robert E and Jones, Charles I. “Why Do Some Countries Produce So Much More Output Per Worker Than Others?”, Oxford University Press, Vol. 114, No. 1, pp. 83-116, (1999, February).
Hanushek, Eric and Ludger Woessman, “The Role of Education Quality for Economic Growth”, World Bank Policy Research Working Paper No. 4122, (2016, April).
Hidalgo, César A. and Hausmann, Ricardo. “The Building Blocks of Economic Complexity”, PNAS, Vol. 106, No. 26, pp. 10570-10575, (2009, June).
International Monetary Fund, Saudi Arabia: Article IV Consultation Staff Report, (2019a, September).
International Monetary Fund, Turkey: Staff Concluding Statement of the Article IV Consultation Mission, (2019b, September).
International Monetary Fund, “Understanding Turkish Residential Real Estate Dynamics”, in Turkey: Selected Issues, Country Report, No. 17/33, pp. 45-64, (2016, December).
Jenkins, Gareth. “Ergenekon, Sledgehammer, and the Politics of Turkish Justice: Conspiracies and Coincidences”, Rubin Center, (2011).
Kauffman, Robert R. and Stallings, Barbara. The Political Economy of Latin American Populism, University of Chicago Press, (1991, January).
Kavuncu, Furkan and Polat, Sezgin. “A Brief Assessment of Adult’ Skills in Turkey: Results from Survey of Adult Skills (PIAAC)” TÜSİAD - Sabancı University Competitiveness Forum Working Paper No, 2019-1 (2019, April).
Kingsley, Patrick. “Erdoğan Says He Will Extend His Sweeping Rule Over Turkey”, The New York Times, (2017, May).

47
Kirişçi, Kemal. “The Kurdish Issue in Turkey: Limits of European Union Reform” Southern European Society and Politics (2011).
Kirişçi, Kemal, Toygür, İlke. “Turkey's New Presidential System and a Changing West: Implications for Turkish Foreign Policy and Turkish-West Relations”, Foreign Policy at Brookings, Turkey Project Policy Paper, No.15, pp. 1-21, (2019, January).
Makovsky, Alan. “Erdoğan’s Proposal for an Empowered Presidency”, Center for American Progress, (2017, March)
North, Douglass C. Structure and Change in Economic History, W. W. Norton & Company, (1982, October).
North, Douglass C. “Institutions”, Journal of Economic Perspectives, Vol. 5 No. 1, pp.97-112, (1991).
OECD. OECD Economic Surveys: Turkey, (2016).
Özel, Işık.“Reverting Structural Reforms in Turkey: Towards an Illiberal Economic Governance?”, Global Turkey in Europe Series Policy Brief, (2015, May).
Persson, Torsten and Tabellini, Guido. “Is Inequality Harmful for Growth?”, American Economic Review, Vol. 84, pp. 600-621, (1994).
Pamuk, Şevket. Uneven Centuries: Economic Development of Turkey since 1820, Princeton University Press, (2018)
Piatkowski, Marcin. Europe's Growth Champion, Oxford University Press, (May, 2018).
Rivera-Batiz, Francisco L., Durmaz, Mine. “Why Did Pisa Test Scores Rise In Turkey?”, BETAM Research Brief, (October, 2014)
Rodrik, Dani. “The Plot Against the Generals”, (Website), (2014).
Schularick, Moritz and Taylor, Alan M. “Credit Booms Gone Bust: Monetary Policy, Leverage Cycles, and Financial Crises, 1870-2008”, American Economic Review, Vol. 102, No. 2, pp. 1029-61, (2012, April).
Uysal, Gökçe and Kavuncu, Furkan. “Tüik Temel İşgücü Göstergelerinin Geriye Doğru Revizyonu (1988-2018)”, Unpublished BETAM note, (June, 2019).
The World Bank, Turkey's Transitions: Integration, Inclusion, Institutions, Country Economic Memorandum, (2014, December).
The World Bank. Commission on Growth and Development, (2008).

48
The World Bank, Country Economic Memorandum: “Firm Productivity and Economic Growth in Turkey”, (2019, June).
Weyland, Kurt. “Clarifying a Contested Concept: Populism in the Study of Latin American Politics”, Comparative Politics, Ph.D. Programs in Political Science, City University of New York, Vol. 34, No. 1, pp. 1-22, (2001, October).
Zurcher, Erik. J. Turkey A Modern History, I.B. Tauris, (2004).