Embed Size (px)
Citation preview

High Precision Polarimetry for MOLLER
Kent PaschkeUniversity of Virginia
January 15, 2010MOLLER Director’s Review, Jefferson Laboratory

Goal: 0.4%
Continuous monitoring during production (protects against drifts and systematic current-dependence to polarization)
Statistical power to facilitate cross-normalization (get to systematics limit in about 1 hour)
Must establish unimpeachable credibility for 0.4% polarimetry
two independent measurements which can be cross-checked.CHAPTER 3. SYSTEMATIC CONTROL 34
Background Process Fractional Error (%)
Signal Statistics 2.08Absolute value of Q2 0.5beam (second order) 0.4beam polarization 0.4e + p(+γ) → e + X(+γ) 0.4beam (first order) 0.3e + p(+γ) → e + p(+γ) 0.3γ(∗) + p → π + X 0.3Transverse polarization 0.2neutrals (soft photons, neutrons) 0.1
Total 1.02
Table 3.2: Summary of systematic errors
expected to have any polarization asymmetry.
3.6 Summary of Systematic Errors
We summarize the considerations above and tabulate our estimates of the mostimportant systematic errors in decreasing order of importance in Table 3.2. It isinstructive to recall that the raw asymmetry is about 32 ppb and that the rawstatistical error is 0.6 ppb or about 2%.

Route to precision polarimetryCompton
MøllerUpgraded Møller polarimeter (Spring 2010) will be compatible with 11 GeV
• high field to saturate iron foil limits target polarization error• low-duty cycle can be used to measure at high current• invasive, used to test Compton polarimetry normalization
Atomic Hydrogen gas target for Møller polarimetry: would provide non-invasive, high-precision monitor at high current
Existing Compton polarimeter will be compatible with 11 GeV
Independent detection of photons and electrons provides two (nearly) independent polarization measurements at high precision
- will be described by Eugene Chudakov

Compton Polarimetry
Two largely independent polarimetry measurements from asymmetries in
detected electrons and photons
0 500 1000 1500 2000 2500 3000
−5
0
5
10
15
20
25
30
Asy
mm
etry
(%)
photon energy (MeV)
Ee=11GeVλ=532nm
0 500 1000 1500 2000 2500 30000
0.1
0.2
0.3
0.4
0.5
0.6
0.7 Ee=11GeVλ=532nm
Cro
ss-s
ectio
n (b
arn)
photon energy (MeV)
Knowledge of analyzing power dominates systematic uncertainty

Hall A Compton Polarimeter30 cm
Infrared (1064 nm)high-gain Optical Cavity
Scintillating Crystal Calorimeter photon detector
Silicon Microstrip tracking electron detector
- Detection of backscattered photons and recoil electrons- new green (532 nm) laser cavity coming on-line for Spring 2010
Standard Equipment upgrade plan for 11 GeV Operation - Reduce chicane bend angle

SLD Compton Polarimeter“The scanning Compton polarimeter for the SLD experiment” (SLAC-PUB-7319)
• Pulsed laser
• ~1000 scattered electrons per pulse
• 2/3 operating time was calibration, not “production”
• Integrating electron and photon detectors
• Published results δP/P∼0.5%
Photon detectors were not used for production running

This polarimeter [2] detects Compton-scattered electrons from the collision ofthe longitudinally polarized 45.6 GeV electron beam [3] with a circularly polarizedphoton beam. The photon beam is produced from a pulsed Nd:YAG laser witha wavelength of 532 nm. After the Compton Interaction Point (CIP), the elec-trons pass through a dipole spectrometer; a nine-channel Cherenkov detector thenmeasures electrons in the range 17 to 30 GeV. Figure 1 shows the location of theCherenkov detector with respect to the Compton spectrum; the response functionfor channel 6 (as determined from an EGS simulation) is indicated as well.
The counting rates in each Cherenkov channel are measured for parallel and anti-parallel combinations of the photon and electron beam helicities. The asymmetryformed from these rates is given by
A(E) =R(→→) − R(→←)
R(→→) + R(→←)= PePγAC(E)
where Pe is the longitudinal polarization of the electron beam at the CIP, Pγ isthe circular polarization of the laser beam at the CIP, and AC(E) is the Comptonasymmetry function.
The laser (Spectra Physics GCR130) has a nominal repetition rate of 17 Hz. Itfires on every 7th electron pulse; the electron pulse rate is 120 Hz. Every 7 secondsthe laser fires on the 6th pulse rather than the 7th to avoid any synchronization ofthe laser firing with instabilities in the electron beam. Laser off pulses are used fordetermining backgrounds. The typical Compton collision rate is approximately 1000Compton scatters per collision pulse, with approximately 100 Compton scatteredelectrons detected by each of the 7 Cherenkov channels spanning the Comptonspectrum. Typical signal to background ratio in Channel 7 is about 5:1.
02468
10
Unpolarized Cross Section
[mb
/mm
]
-0.6
-0.4
-0.2
0.0
0.2
0.4
0.6
0.8
1.0
6 8 10 12 14 16 18 20
ScatteringAsymmetry Channel 6
Response
Transverse Distance from Neutral Beamline [cm]
Figure 1: Compton kinematics
The laser is polarized with a lin-ear polarizer and two Pockels cellsas shown in Figure 2. The axes ofthe linear polarizer and the PS Pock-els cell are along the x,y axes, whilethe axes of the CP Pockels cell arealong u,v (u,v axes are rotated by 45◦
with respect to x,y). This configura-tion can generate arbitrary ellipticalpolarization, and can compensate forphase shifts in the laser transport op-tics. Measurements of Pγ are madebefore and after the CIP (see Fig-ure 2). An harmonic beam sampler(Gentec HBS-532-100-1C-10) trans-mits 98% of the laser power and gen-erates two 1% beams at forward angles of 10◦, which preserve the circular polariza-tion, Pγ, of the main beam to better than 0.1%. Pγ is determined from photodiode
2
8 Oct 2001 11:14 AR AR140-11.tex AR140-11.SGM ARv2(2001/05/10) P1: GJC
SLD PHYSICS 361
TABLE 2 Compton polarimeter systematic errors
on the beam polarization and, in italics, the total
accelerator-related systematic error
Uncertainty (%) δPPe/PPe
Laser polarization 0.10
Detector linearity 0.20
Analyzing power calibration 0.40
Electronic noise 0.20
Total polarimeter uncertainty 0.50
Chromaticity and interaction point corrections 0.15
procedures (smaller and better-determined beam energy spread and polarization
energy dependence) reduced the size of this chromaticity correction and its associ-
ated error from its value of 1.1± 1.7% when it was first observed in 1993 to below0.2%. An effect of comparable magnitude arose from the small precession of the
electron spin in the final focusing elements between the SLC IP and the CIP. The
contribution of depolarization during collision was determined to be negligible, as
expected, by comparing polarimeter data takenwith andwithout beams in collision.
All effects combined yielded a correction with the uncertainty given in Table 2.
Table 3 gives the fully corrected, luminosity-weighted, average polarizations
corresponding to each of the SLD runs. Improvements in GaAs photocathode
performance are evident in the 1993 run (first use of a strained-lattice material)
and the 1994–1995 run (inwhich the active layer was three times thinner). Changes
in the achieved polarization in later years mainly reflect variation in photocathode
manufacture.
A number of experiments and redundant systems were used to verify the high-
precision polarimeter. Most important were the following:
! Moderate precision Møller and Mott polarimeters confirmed the high-
precision Compton polarimeter result to∼3% (1993–1995), and gamma po-larimeters were operated in parallel with the electron detector polarimeter
(1996–1998). Møller polarimeters located at the end of the SLAC linac and
in the SLC electron extraction line were used to cross-check the Compton
polarimeter. The perils of using a less reliable method to test a precision
TABLE 3 Luminosity-weighted average polarization values for all SLD data
1992 1993 1994–1995 1996 1997–1998
0.224± 0.006 0.630± 0.011 0.7723± 0.0052 0.7616± 0.0040 0.7292± 0.0038
An
nu
. R
ev.
Nu
cl.
Par
t. S
ci.
20
01
.51
:34
5-4
12
. D
ow
nlo
aded
fro
m a
rjo
urn
als.
ann
ual
rev
iew
s.o
rgb
y J
EF
FE
RS
ON
LA
B o
n 0
6/0
1/0
6.
Fo
r p
erso
nal
use
on
ly.
Collider Compton Polarimetery
Electron detector was corrected for energy calibration, response function
sin2θW rests on a single electron detector channel !
Electron Detector
Detector element at the Compton edge was least sensitive to corrections, and so most precise
collider specific
Bounded by cross-calibration with photon detectorTable from:
Annu. Rev. Nucl. Part. Sci. 2001. 51:345–412
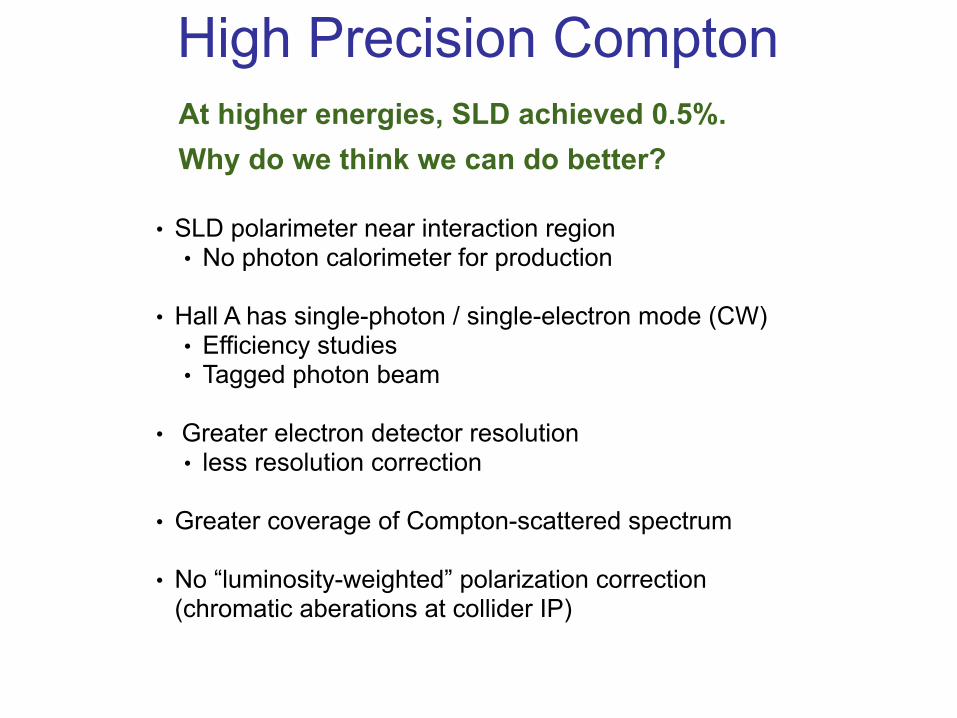
High Precision ComptonAt higher energies, SLD achieved 0.5%.Why do we think we can do better?
• SLD polarimeter near interaction region• No photon calorimeter for production
• Hall A has single-photon / single-electron mode (CW)• Efficiency studies• Tagged photon beam
• Greater electron detector resolution• less resolution correction
• Greater coverage of Compton-scattered spectrum
• No “luminosity-weighted” polarization correction (chromatic aberations at collider IP)

Existing electron detector
Silicon Microstrip Detectors 4 planes of 192 µstrips(240 µm pitch)
3rd dipole
3rd dipole
4th dipole
e! detector
primary beam
scattered photons
scattered e!
Dispersive axis
Figure 1: Layout of the detection of the hall A Compton polarimeter.
Table 1 shows the Compton scattering kinematics for a IR and a green laserand for 3 different beam energies. The figure of merit at λ = 1064nm is too lowto meet the requirements of future high precision parity experiments in the 1 GeVrange (PREX, Qweak). Therefore we present in the following section an upgradeof the laser setup to double the frequency and the power of the light accumulatedin the optical cavity.Two strategies are discussed for the detection of the Compton scattered particles:
- Upgrade of the semi-integrated method:Going to green doubles the separation between the scattered electrons andthe primary beam (Table 1). Thus the electron detector can still be used tocover half of the Compton spectrum at 0.85 GeV and determine the responsefunction of the photon detector.
- Integrated and energy weighted photon signal:A second method consists of weighing the photon signal by the energy de-posited in the detector and integrate it over the whole Compton spectrumfor each polarization state. Then the measured asymmetry can be written
AE =E+ − E−
E+ + E− (1)
with
E± = L±T±∫ 1
ρmin
E(ρ) ε(ρ)dσ
dρ(ρ) (1± PePγAl(ρ))
E is the energy deposited in the calorimeter, ε the detection efficiency. Usinga photon detector with a high light yield can bring the detection thresholdρmin small enough with respect to the Compton edge so that it can be as-sumed to be negligible. Then the sensitivity to the detector response, main
7
0 10 20 30 40
−5
0
5
10
15
20
25
30
PREX H-III PV-DIS
11 GeV
Ana
lyzi
ng P
ower
(%)
Distance from primary beam (mm)

Electron analysis at 11 GeV
Distance from primary beam [mm]0 10 20 30 40
Ana
lyzi
ng P
ower
[%]
−5
0
5
10
15
20
25
30
Analyzing Power, 11 GeV and 532 nm
Distance from primary beam [mm]0 10 20 30 40
Ana
lyzi
ng P
ower
[%]
−5
0
5
10
15
20
25
30
• Asymmetry Fit: using Compton edge and 0xing to calibrate
• Integration: Compton edge to 0xing• Edge “single strip”- a single microstrip, 250 micron
pitch, right at the compton edge. dAp/dx ~ 0.9% / mm (locate strip to 1/2 own width = 0.1% error in Ap)
• Minimum single strip- a single microstrip, at the asymmetry minimum
Analyzing power should be very well known, but other systematic effects must be treated carefully
deadtime, rescattered backgrounds, efficiency, magnetic uniformity, variation in primary beam position, false asymmetries

Photon analysis at 11 GeV
photon energy [MeV]0 500 1000 1500 2000 2500 3000
Ana
lyzi
ng P
ower
[%]
−5
0
5
10
15
20
25
30
Analyzing Power, 11 GeV and 532 nm
photon energy [MeV]0 500 1000 1500 2000 2500 3000
Ana
lyzi
ng P
ower
[%]
−5
0
5
10
15
20
25
30
• Energy Weighted Integration: no energy calibration or threshold, only the linearity of the average response function determines uncertainty in analyzing power
• Asymmetry Fit: using Compton edge and 0xing to calibrate
photon energy [MeV]0 500 1000 1500 2000 2500 3000
Cro
ss−s
ectio
n [b
arns
]
0
0.1
0.2
0.3
0.4
0.5
0.6
0.7
Cross−section, 11 GeV and 532 nm
photon energy [MeV]0 500 1000 1500 2000 2500 3000
Cro
ss−s
ectio
n [b
arns
]
0
0.1
0.2
0.3
0.4
0.5
0.6
0.7
Analyzing power should be very well known, but other systematic effects must be treated carefully
deadtime or linearity, pile up, response function, time-variation in backgrounds or gain, false asymmetries

0 10 20 30 40
−5
0
5
10
15
20
25
30
Design (4.5GeV)
PREXH-III
PV-DIS
11 GeV
Distance from primary beam (mm)A
sym
met
ry %
New Level of Precision for JLab
So why haven’t we done better before?
• Low energy = small asymmetries • long time to precision • cross-checks are difficult
• No one tried zero-crossing technique• Zero crossing near beam at low E
• Recent calorimeter upgrade: more photons/MeV, less shower loss
• photon calorimetry gets tricky at small Eγ
• features of Compton spectrum are at lower energy, compared to Bremsstrahlung maximum
• It hasn’t been needed! 3% polarimetry was often good enough, 1.5% was available when needed, 1% has been demonstrated
A serious focus on systematic studies will be required

New Concerns at 11 GeV
Synchrotron radiation will carry an order of magnitude more power than present 6 GeV running
How much larger will the halo and tail be, due to synchrotron blowup and the small CEBAF magnetic apertures?
- Design appropriate shielding and collimation for both electron and photon detector- Understand effects of shielding through simulation studies
Can we get rid of the small apertures in the interaction region?Narrow aperture is driven by need to protect mirrors, which need to be close to maintain luminosity when using a CW beam

Hall A Compton Interaction Region
• 23 mrad crossing angle• 1 cm e- beam aperture
“Transfer function” translates measured laser polarization after transmission to laser polarization at the Compton interaction point
Do we know the polarization in the cavity by monitoring the transmitted light?
- Study of spare cavity mirrors, - infer from changes in monitor polarization when cavity is inserted
Additional study required
Present uncertainty: 0.35%
Small crossing angle (and therefore small apertures) are necessary to obtain sufficient luminosity

RF Pulsed LaserRF pulsed laser, at 499 MHz (or some small nearby frequency)
Such a laser is feasible: - similar 75 MHz/ 750 MHz system at FEL (Shukui Zhang)- high power IR laser amplification - high-peak power leading to high doubling efficiency
Interest in R&D: JLab, UVa, and Argonne (Zheng-Tian Lu, Jaideep Singh)
Crossing angle can be 3x larger and maintain comparable luminosity
High duty factor: still single-photon/electron mode
The “single-shot” laser path reduces uncertainty in the laser polarization measurement

R&D StudiesSimulations- rescattering of Compton signal into electron detector- synchrotron light load on electron detector- synchrotron light power spectrum at photon detector- calorimeter response function- halo background characteristics
Laser System Studies- RF pulsed laser development to reduce backgrounds and improve knowledge of laser polarization - study of laser polarization transfer through cavity mirrors
Detector options - Trade light for speed in photon calorimeter?- Implications of Cerenkov calorimeter (low energy insensitivity)- photon detector linearity studies

Summary of Compton Uncertainties
correlated
uncorrelated
Participants from UVa, Syracuse, JLab, CMU, ANL, Miss. St.
Independent detection of photons and electrons provides two (nearly) independent polarization measurements;
each should be better than 0.5%
Relative Error (%) electron photonEbeam 0.03 0.03Laser Polarization 0.20 0.20Radiative Corrections 0.1 0.1False Asymmetries 0.01 0.01Background 0.05 0.05Deadtime / Pileup 0.2 0.1Analyzing power 0.15 0.40Total 0.34 0.47
This would represent a significant step beyond what has been done at JLab before, but there is no fundamental
reason why it should not be achievable.

Summary
Atomic Hydrogen Møller polarimetry: would provide entirely independent, non-invasive, high precision measurement
Existing Compton polarimeter will be compatible with 11 GeV
The challenge is serious, but the goal is feasible!
Planning, and a sustained focus during the runtime, will be required to push the device to the required precision.
Additional cross-check from Møller polarimeter significantly better than 1%
Independent electron and photon measurements each better than 0.5%