Embed Size (px)
Citation preview
Evidence Report 71 July 2013
High Performance Working in the Employer Skills Surveys

High Performance Working in the Employer Skills Surveys
Professor Stephen Wood, Mr Mark Burridge, Drs William Green, Sandra
Nolte, Daniela Rudloff
School of Management, University of Leicester
Aoife Ni Luanaigh
Senior Research Manager
UK Commission for Employment and Skills
July 2013

High Performance Working in the Employer Skills Surveys
ii
Foreword
The UK Commission for Employment and Skills is a social partnership, led by
Commissioners from large and small employers, trade unions and the voluntary sector.
Our ambition is to transform the UK’s approach to investing in the skills of people as an
intrinsic part of securing jobs and growth. Our strategic objectives are to:
Maximise the impact of employment and skills policies and employer behaviour to
support jobs and growth and secure an internationally competitive skills base;
Work with businesses to develop the best market solutions which leverage greater
investment in skills;
Provide outstanding labour market intelligence which helps businesses and people
make the best choices for them.
The third objective, relating to intelligence, reflects an increasing outward focus to the UK
Commission’s research activities, as it seeks to facilitate a better informed labour market,
in which decisions about careers and skills are based on sound and accessible evidence.
Relatedly, impartial research evidence is used to underpin compelling messages that
promote a call to action to increase employers’ investment in the skills of their people.
Intelligence is also integral to the two other strategic objectives. In seeking to lever
greater investment in skills, the intelligence function serves to identify opportunities where
our investments can bring the greatest leverage and economic return. The UK
Commission’s first strategic objective, to maximise the impact of policy and employer
behaviour to achieve an internationally competitive skills base, is supported by the
development of an evidence base on best practice: “what works?” in a policy context.
Our research programme provides a robust evidence base for our insights and actions,
drawing on good practice and the most innovative thinking. The research programme is
underpinned by a number of core principles including the importance of: ensuring
‘relevance’ to our most pressing strategic priorities; ‘salience’ and effectively translating
and sharing the key insights we find; international benchmarking and drawing insights
from good practice abroad; high quality analysis which is leading edge, robust and action
orientated; being responsive to immediate needs as well as taking a longer term
perspective. We also work closely with key partners to ensure a co-ordinated approach to
research.

High Performance Working in the Employer Skills Surveys
iii
This project explores the variables relating to High Performance Working (HPW) which
were included in the UK Commission’s Employer Skills Survey 2011, as well as how they
relate to training activity, skill deficiencies and product market strategies. It identifies the
take up of HPW practices across the UK, how this changed between 2007 and 2011, and
take-up patterns by establishment sector, size, occupation and geography. It then
identifies the predictors of the likelihood of being a HPW organisation.
Sharing the findings of our research and engaging with our audience is important to
further develop the evidence on which we base our work. Evidence Reports are our chief
means of reporting our detailed analytical work. All of our outputs can be accessed on the
UK Commission’s website at www.ukces.org.uk.
But these outputs are only the beginning of the process and we are engaged in other
mechanisms to share our findings, debate the issues they raise and extend their reach
and impact.
We hope you find this report useful and informative. If you would like to provide any
feedback or comments, or have any queries please e-mail [email protected], quoting
the report title or series number.
Lesley Giles
Deputy Director
UK Commission for Employment and Skills

High Performance Working in the Employer Skills Surveys
iv
Table of Contents
Executive Summary ............................................................................................. 1
1 Introduction .................................................................................................. 1
2 High Performance Working and the UK Commission’s employer surveys ................................................................................................................. 3
2.1 Models of High Performance Working................................................................... 3
2.2 The impact of High Performance Working ............................................................ 4
2.3 The UK Commission’s surveys .............................................................................. 5
3 The use of HPW practices in 2011 ........................................................... 10
3.1 HPW uptake by ownership sector ........................................................................ 11
3.2 HPW Uptake by broad industrial sector .............................................................. 13
3.3 HPW uptake by establishment size...................................................................... 16
3.4 HPW uptake by country ........................................................................................ 17
3.5 HPW uptake by English regional grouping ......................................................... 19
3.6 HPW Uptake by Largest Occupational Group in the workplace ....................... 21
3.7 HPW Uptake in establishments that are part of a larger organisation ............. 23
3.8 HPW Uptake by Product Market Strategy ........................................................... 25
3.9 Summary ................................................................................................................. 30
4 The relationships between HPW practices .............................................. 31
4.1 Relationships between use of practices ............................................................. 31
4.2 Predictors of being a HPW organisation ............................................................. 33
4.3 Potential outcome concomitants for HPW .......................................................... 41
4.4 Summary ................................................................................................................. 44
5 Change in uptake of HPWPs (2007 to 2011) ............................................ 46
5.1 Use of HPW practices ............................................................................................ 46
5.2 Predictors of being a HPW organisation ............................................................. 48
5.3 Summary ................................................................................................................. 51
6 Conclusions ............................................................................................... 53
Annex A .............................................................................................................. 59
Bibliography ....................................................................................................... 73

High Performance Working in the Employer Skills Surveys
v
Tables and figures
Table 1: Groupings of HPW practices ........................................................................... 2
Figure 2.1: The 4A model of HPW capability ................................................................ 3
Table 2.1 HPW indicators in the UK Commission’s skills surveys ............................. 6
Figure 2.1: HPW practices and concomitants in the 2011 survey ............................... 8
Table 2.2: HPW practices and corresponding questions in the 2011 survey ............. 8
Figure 3.1: Use of HPW Practices across the UK in 2011 .......................................... 10
Figure 3.2: Use of practices by broad ownership sector ........................................... 12
Figure 3.3: Use of practices by broad industrial grouping ........................................ 14
Table 3.1 Proportion of establishments adopting 9+ of 14 HPW practices by sector .. 15
Figure 3.4: Use of HPW practices by establishment size .......................................... 16
Figure 3.5: Uptake of HPW practices by UK nation .................................................... 18
Figure 3.6: Use of HPW practices by English regional grouping .............................. 20
Table 3.2: Use of HPW practices by largest occupational group in the workplace (% of establishments) ........................................................................................................ 22
Figure 3.7: Use of HPW practices by membership of larger organisation................ 24
Table 3.3: Questions for strategy variables in the 2011 survey ................................ 25
Figure 3.8: HPW practices by establishment’s level of goods or services customisation ............................................................................................................... 26
Table 3.4 HPW Practices by level of non-price dependence (% of establishments) 27
Figure 3.9 HPW practices by extent to which the establishment leads on new product/process development ..................................................................................... 28
Figure 3.10 HPW Practices by whether the establishment competes for a premium quality of product or service ........................................................................................ 29
Table 4.1: Factor analysis of Involvement and Skills acquisition practices ............. 32
Figure 4.1: Predictors of elements of HPW ................................................................. 34
Table 4.2: Predictors of HPW subsystems (whole economy) .................................... 35
Table 4.3: Predictors of HPW Subsystems with inclusion of strategy variables (Private Sector) ............................................................................................................. 38
Table 4.4: Predictors of HPW Subsystems including Investors in people and business plan as explanatory variables (whole economy) ........................................ 39
Table 4.5: Predictors for HPW establishment (UK Commission time-series definition) .................................................................................................................. 41
Table 4.6: Regression results for recruitment and retention ..................................... 42
Table 4.7: Regression results for extent of training ................................................... 43
Table 4.8: Regression results for skills deficiencies ................................................. 44
Figure 5.1: HPW use in 2007 and 2011, and change .................................................. 46
Figure 5.2: HPW practices change 2011-2007 by establishment size band .............. 47
Figure 5.3: Likelihood of being a HPW establishment by sector .............................. 48
Table 5.1: Predictors of being a HPW organisation (2007 and 2011) ........................ 49

High Performance Working in the Employer Skills Surveys
vi
Table 5.2: Distribution of the number of practices across establishments .............. 50
Table 5.3: Cumulative uptake of practices across establishments (% of establishments adopting at least X practices) ........................................................... 51
Table A.1: Predictors of Total Use of Practices in 2007 and 2011 and comparison with 2011 Results for HPW scales ............................................................................... 59
Table A.2: Predictors of Investors in People, ISO9000 and Business Plan in 2007 and 2011 60
Table A.3: Correlation matrix for the Employee Involvement practices ................... 61
Table A.4: Correlation matrix for the Skills and Involvement practices ................... 61
Table A.5: Correlation matrix for the Motivational practices ..................................... 62
Table A.6: Correlation matrix for the UKC14 practices .............................................. 63
Table A.7: Factor analysis of the UKC14 practices .................................................... 64
Table A.8: Predictors of HPW Subsystems (whole economy) ................................... 65
Table A.9: Predictors of HPW subsystems (by Private and Public sector) .............. 66
Table A.10: Predictors of Motivational Supports (whole economy) .......................... 67
Table A.11: Motivational supports (Private Sector) .................................................... 68
Table A.12: Motivational supports (Public Sector) ..................................................... 69
Table A.13: Motivational Supports with inclusion of strategy variables (Private Sector) 70
Table A.14: Predictors of HPW Subsystems including Investors in people and business plan as explanatory variables (whole economy) ........................................ 71
Table A.15: Motivational Support including Investors in people and business plan as explanatory variables (whole economy) ................................................................ 72
High Performance Working in the Employer Skills Surveys
1
Executive Summary
‘High Performance Working is a general approach to managing organisations that aims to
stimulate more effective employee involvement and commitment to achieve high levels of
performance’ (Belt and Giles 2009: ii). It is important because raising the supply of skills
does not automatically result in the raising of workplace productivity. These skills need to
be used and applied effectively in the workplace. High Performance Working (HPW)
practices apply across a range of areas, including approaches to work organisation,
employment relations, management and leadership, and organisational development.
Defining and measuring HPW
This study explores the adoption of HPW as measured in the UK Commission’s Employer
Skills Survey 2011. Defining and measuring HPW is complex because: a holistic
approach covers a wide range of business practices; some of those practices will not be
applicable to all businesses (so not to adopt individual practices will not necessarily mean
the business is not generally adopting HPW practices); and no existing survey tool
completely covers all aspects of HPW. To do so would require a bespoke tool and, to
date, this has not been created (see Bates, Cox and Robertson-Giles, 2009).
Nevertheless, the UK Commission’s skills surveys include questions relating to the use of
some High Performance Working Practices. Skills for the Workplace: Employer
Perspectives (2008), which reported the findings from the 2007 Employer Perspectives
Survey of 13,500 employers, included 16 indicators of HPW. Establishments adopting ten
or more of the practices were identified as HPW organisations. The UK Commission’s
Employer Skills Survey 2011 included 14 of these same practices, as well as a wider
range of related variables. To obtain as consistent a measure as possible, the UK
Commission definition of HPW establishments is those adopting nine or more of these 14
practices in 2011.
However, it is also useful to explore the take-up of the individual indicators and of a wider
set of metrics available in the 2011 survey. In exploring these wider metrics, three groups
of practices are identified around employee involvement, skills acquisition and
motivational practices (see Table 1).

High Performance Working in the Employer Skills Surveys
2
Table 1: Groupings of HPW practices
Employee Involvement
Skills Acquisition
Motivational Practices
Task discretion
Task variety
Problem solving teams
Descriptions
Project teams
Team briefings
Suggestion scheme
Staff survey
Induction
Work shadowing
Off-the-job training
On-the-job training
Training plan
Training budget
Annual performance review
Evaluation of training
Organisational Performance-related pay
Individual performance-related pay
Formal employee consultation procedures
Formal discipline and dismissal procedures
Flexible benefits
Flexible working
Equal opportunity policy
Thus the report considers the take-up of individual HPW practices; the ‘UK Commission’s
measure’ (which is consistent between the 2007 and 2011 surveys); and take up around
the three groups of practices.
This report provides an analysis of the survey data and assesses:
The level of uptake of HPW practices individually and on a group basis across the
UK.
The pattern of HPW practices uptake by sector, size, occupation and geography.
The relationships amongst HPW practices and between them and other variables in
the 2011 Employer Skills Survey.
The best predictors of the likelihood of an establishment being a HPW organisation.
The change in the uptake of HPW practices from 2007 to 2011.
The UK Commission’s Employer Skills Survey is a survey of 87,000 business
establishments of all sizes across the UK.
The level of uptake of HPW practices across the UK
The use of HPW practices in 2011 in the UK varies by practice. The most commonly
reported practices are task discretion (87 per cent) and task variety (87 per cent), with
team briefings (79 per cent) and access to flexible working (78 per cent) close behind.
The least commonly used practice is creating project teams (9 per cent), although 57 per
cent of establishments use problem-solving teams. Three fifths (62 per cent) of
establishments have a business plan, 16 per cent Investors in People accreditation and
12 per cent ISO9000 accreditation.

High Performance Working in the Employer Skills Surveys
3
The pattern of HPW practices uptake by sector, size, occupation and geography
The percentage of establishments using employee involvement, skills acquisition, and
motivational practices strongly reflects the size of the establishment, with practices more
likely to be adopted in larger establishments. The sectors with the highest proportions of
establishments adopting at least nine of the 14 practices included in the UK Commission
definition of HPW are mining and quarrying, financial services, public administration and
education. Public administration, education, and health and social work establishments
report the highest use of individual HPW practices.
Establishments in which the largest occupational group comprises professionals,
associate professionals, or caring, leisure and other service occupations make the
greatest use of the employee involvement practices. Three of the eight employee
involvement practices (task discretion, task variety and problem solving teams) are more
likely to be adopted by establishments with higher levels of customisation.
Establishments adopt a similar percentage of skill acquisition and motivational practices
irrespective of their level of customisation. Establishments competing in markets with high
or premium quality products or services are more likely to adopt HPW practices than
establishments that produce standard or basic quality products or services.
There is variation in the uptake of HPW practices by country. Overall, establishments in
Scotland use training-related practices most consistently. Use of motivational HPW
practices varies across countries. Uptake rates for task discretion and task variety are
quite similar between broad English regions. Higher uptakes are reported for the North of
England for six of the eight skills acquisition practices. The use of motivational supports is
more diverse across regions.
The relationships amongst HPW practices and between them and other variables in the 2011 Employer Skills Survey
There are significant relationships between the use of most HPW practices but they are
relatively weak. The use of factor analysis confirms that a single common factor does not
underlie all the practices. The analysis shows that there are three groupings of practices:
role involvement, including task discretion and variety
organisational involvement
skills and knowledge acquisition practices.

High Performance Working in the Employer Skills Surveys
4
Establishments that lead the way in terms of developing new products, services or
techniques, are more likely to adopt HPW practices. Establishments stating that they
compete in markets with high or premium quality products or services are more likely to
adopt all HPW practices than establishments that produce standard or basic quality
products or services.
The relationship between HPW and recruitment and retention problems (the number of
hard-to-fill vacancies as a percentage of total employment and whether the establishment
has difficulty retaining staff) is mixed. The skills acquisition practices are significantly
positively related to both variables, perhaps because establishments experiencing
recruitment and retention difficulties adopt skills acquisition practices to overcome the
difficulties. Motivational practices are not strongly associated with recruitment and
retention difficulties, but there is a positive relationship between individual performance-
related pay and difficulty retaining staff.
Training is measured by the average of the numbers of days training employees receive
at an establishment and the percentage of establishment staff trained. Skill acquisition
practices are positively related to both variables.
Skills deficiencies are measured by whether the establishment has skills gaps and skills
shortage vacancies. Role involvement practices are positively related to skills gaps, and
skill acquisition practices are positively related to both skills gaps and skills shortage
vacancies. These findings may reflect the fact that organisations with skill-related
challenges have adopted HPW practices, but the direction of causality is unclear.
The best predictors of the likelihood of an establishment being a HPW organisation
There are significant relationships between the use of some of the practices in the UK
Commission’s time-series definition of HPW organisations. Providing training, having a
training plan, a training budget, evaluating training, having a business plan, employee
consultation and performing annual reviews are practices that are highly correlated with
each other. This suggests that they are usually interconnected and implemented
together.

High Performance Working in the Employer Skills Surveys
5
For the UK Commission’s time-series definition of being a HPW establishment, predictors
include size (with smaller workplaces less likely to be HPW establishments) and being
part of a larger organisation (more likely). All else being equal, establishments in the
manufacturing and construction groups are significantly less likely to be HPW
establishments, and those in the public sector are significantly more likely than those in
private services (the latter reflects the pattern of uptake). However, region is not a
predictor. Customised production is positively related to the probability of being a HPW
establishment when considering the whole economy and the public sector.
The change of uptake of HPW practices from 2007 to 2011
There has been a decline in the use of almost all the practices between 2007 and 2011 in
the UK. Work shadowing, annual performance review, evaluation of training and
individual performance-related pay experienced the greatest decreases.
The change in use of HPW practices varies by establishment size. In large
establishments (250 or more employees), the proportion using project teams, training,
annual performance review, employee consultation, flexible benefits, ISO9000 and with a
business plan increased. The greatest decline in the proportion of establishments using
individual HPW practices was for the smallest establishments.
Analysis was also undertaken on the predictors of being a HPW organisation (having at
least nine of the 14 practices) in 2007 and 2011. Predictors in both years included sector
and size of establishment, as well as being part of a larger organisation. There are two
differences between the two years. Establishments in the primary sector were less likely
than those in other sectors to be HPW organisations in 2007, but not in 2011. However,
establishments in the construction sector were less likely than those in other sectors to be
HPW organisations in 2011, but not in 2007.

High Performance Working in the Employer Skills Surveys
1
1 Introduction
The UK Commission’s Employer Skills Survey 2011 includes a number of indicators
which cover various aspects of High Performance Working (HPW). High performance
working is defined as ‘a general approach to managing organisations that aims to
stimulate more effective employee involvement and commitment to achieve high levels of
performance’ (Belt and Giles 2009: ii). HPW is important because raising the supply of
skills does not automatically result in the raising of workplace productivity and employee
engagement. These skills need to be used and applied effectively in the workplace. High
performance working practices cover a range of areas, including approaches to work
organisation, employment relations, management and leadership, and organisational
development.
High performance work practices include skill and knowledge acquisition, employee
involvement and motivational practices. They include enriched job design, team work,
functional flexibility, idea capturing, training and development, information sharing and
appraisal, performance-related pay and equal opportunities policies. Research evidence
suggests that adoption of HPW practices is linked to improved organisational
performance, and that such practices are most effective in influencing behaviour when
used together and viewed as a synergistic set (sometimes referred to as ‘high
performance work systems’).
The UK Commission’s Employer Perspectives Survey 2007 and Employer Skills Survey
2011 include a range of practices associated with HPW systems. The objectives of this
project are to provide comprehensive and robust analysis of the survey’s data to assess:
the level of uptake of HPW practices across the UK;
the pattern of HPW practices uptake by sector, size, occupation and geography;
the relationships amongst HPW practices and between them and other variables
asked about in the survey;
the best predictors of the likelihood of a business being a HPW organisation;
the change of uptake of HPW practices from 2007 to 2011.

High Performance Working in the Employer Skills Surveys
2
This report presents the results of the analysis of the high performance work practices
contained in the UK Commission’s Employer Skills Survey of 2011 and compares it
where possible with data on a smaller range of practices in the 2007 Employer
Perspectives Survey.
Section 2 of this report defines high performance working and the conceptual context of
the study, including a classification of the variables into categories. Section 3 outlines the
level of uptake of HPW practices across the UK, as well as the pattern of HPW practices
uptake by sector, size, occupation and geography. Section 4 covers the relationships
between the HPW practices as they are used by organisations and identifies predictors of
the likelihood of a business being a HPW organisation. Section 5 outlines how the use of
individual and groupings of practices has changed from 2007 to 2011. Section 6
discusses the overall findings and implications for future surveys and policy.
High Performance Working in the Employer Skills Surveys
3
2 High Performance Working and the UK Commission’s employer surveys
High Performance Working encompasses the bringing together and implementation of a
number of practices in a holistic way to effectively manage an organisation. It is based on
theory that individual and organisational performance is affected by the way work is
designed and organised, opportunities for employees’ involvement in business decisions,
abilities and knowledge of staff, and their motivation to participate and do productive
work. There are a number of models of HPW, as outline in the rest of this chapter.
2.1 Models of High Performance Working
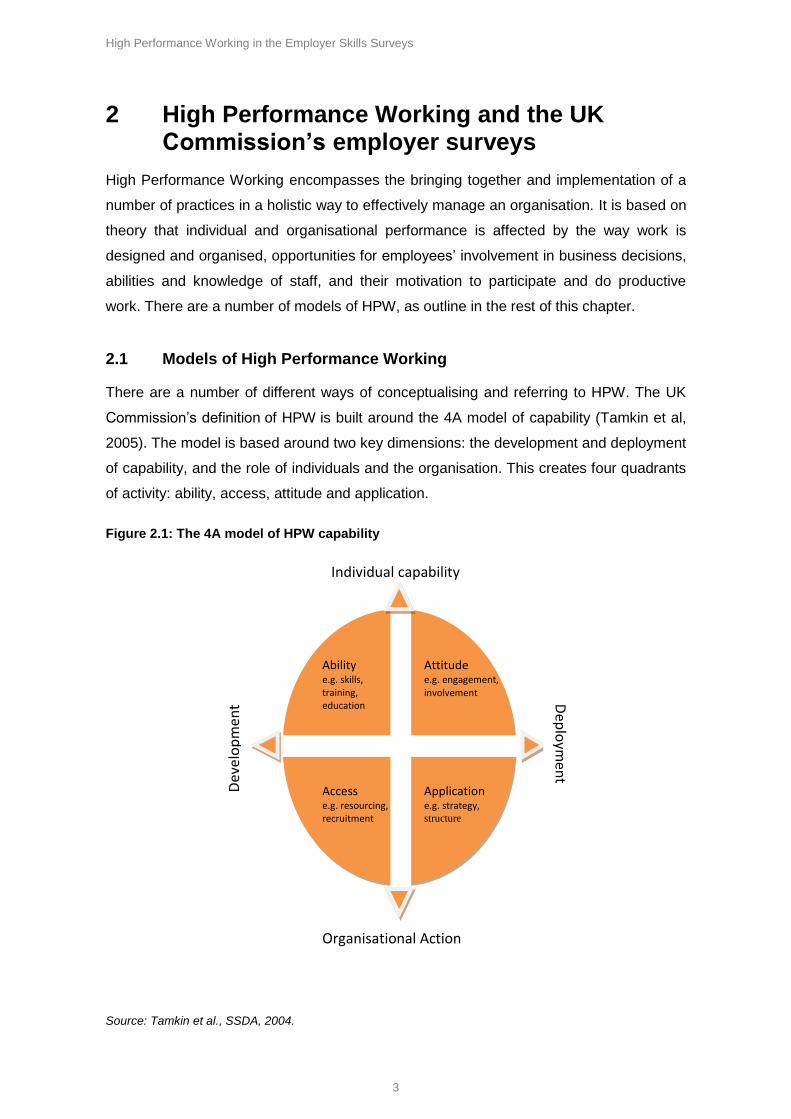
There are a number of different ways of conceptualising and referring to HPW. The UK
Commission’s definition of HPW is built around the 4A model of capability (Tamkin et al,
2005). The model is based around two key dimensions: the development and deployment
of capability, and the role of individuals and the organisation. This creates four quadrants
of activity: ability, access, attitude and application.
Figure 2.1: The 4A model of HPW capability
Source: Tamkin et al., SSDA, 2004.
Individual capability
Ability e.g. skills, training, education
Attitude e.g. engagement, involvement
Access e.g. resourcing, recruitment
Application e.g. strategy, structure
Dev
elo
pm
ent D
eplo
ymen
t
Organisational Action

High Performance Working in the Employer Skills Surveys
4
There are other conceptual models of HPW. For example, the AMO model is built around
three themes: ability; motivation; and opportunity to participate. What the models share is
a focus on involving both employers and employees in providing a supportive
environment and displaying discretionary efforts (Belt and Giles, 2009).
2.2 The impact of High Performance Working
In general, returns from increasing the use of HPW practices are seen as exponential, as
there are synergistic effects between the practices. However, organisations may
emphasise different practices, and adopt very different approaches to HPW. For
example, the emphasis within one organisation may be on intensive training and
development (focusing on skills acquisition), and in another on performance management
that centres on goal-setting. Much research on the effects of HPW practices is based on
aggregating the use of practices to form global indexes. However, this may mask
differences between organisations with quite different approaches to management. For
example, one organisation could implement merit pay, promotion on merit and profit-
sharing and no involvement practices, and another implement quality circles, team work
and formal job descriptions.
There is considerable research showing that adopting HPW practices is related to
organisational performance. However, the results vary significantly across performance
measures and give little guidance to which if any practices or approaches are likely to be
associated with higher performance. The use of certain practices may be strongly
correlated; for example organisations with training budgets are more likely to have
training plans for employees. However, it may be that different configurations of use are
in fact equally effective, or alternatively those organisations that use particular
combinations are correctly fitting their HRM to their circumstances.
There are no strong theories explaining why managements will introduce HPW practices
or systems, or why they are more common in certain types of workplace. Factors typically
included in discussion are sector, organisational size, strategic context and direction, and
operational management methods. For example, it may be argued that workplaces in the
service sector use HPW practices more than those in other sectors, on the grounds of
closer relationships between the organisation and its customers or clients; that
organisational size is important because there are economies of scale in practice use;
that organisations for whom producing high quality products and being innovative in
products or processes are of paramount importance are more likely to adopt HPW
practices; and that the use of HPW practices is fundamental to modern operational
methods such as Lean Production.
High Performance Working in the Employer Skills Surveys
5
It has also been argued that non-profit and public sector organisations are more likely to
use role and organisational involvement management than private ones, while private
sector organisations may use motivational supports more than non-profit and public
sector organisations (Kalleberg et al, 2006). Some research suggests that workplaces
that have high levels of representative voice are more likely to have HPW practices as
they are one means of involving and developing the knowledge of workers. This project
explores the best predictors of organisations adopting HPW practices.
2.3 The UK Commission’s surveys
The UK Commission’s 2011 Employer Skills Survey was a telephone survey consisting of
over 87,500 interviews. The sample frame was selected through a stratified random
sampling approach to include establishments of all four UK nations, every region of the
four nations, SIC-defined sector and size band. The overall response rate was 39 per
cent. The survey included questions on the use of a number of HPW practices and
related indicators. The UK Commission’s 2007 Employer Perspectives Survey was a
telephone survey of over 13,500 establishments, with quotas set by sector (Sector Skills
Council footprint), size and nation. The overall response rate was 37 per cent.
The UK Commission included 16 indicators of HPW in its skills for business surveys, the
most recent of which was carried out in 2007 and published as Skills for the Workplace:
Employer Perspectives (Shury, Davies and Riley, 2008). A composite measure
combining these 16 indicators was created and a score of 10 out of 16 (where each
indicator accounted for 1) was considered to indicate that an establishment was a HPW
establishment. In the 2011 UK Commission’s Employer Skills Survey, 14 of these same
practices were included in the survey, as well as additional measures that map onto the
4As model of HPW outlined in Section 2. A score of 9 out of 14 indicates that an
establishment was a HPW establishment.
Table 2.1 below maps 30 indicators included in the 2007 and 2011 surveys that can be
considered to be HPW measures. The cells shaded in grey correspond to the 14
indicators that appeared in the 2007 composite HPW measure and are repeated again in
2011. Some of the HPW indicators are composite measures – for example, ‘training
provided’ covers respondents who provide either on-the-job or off-the-job training, or
both.

High Performance Working in the Employer Skills Surveys
6
Table 2.1 HPW indicators in the UK Commission’s skills surveys
Indicator 2007
2011
Awards performance related bonuses X X
Individual performance related pay X X
Flexible benefits X X
Training provided X X
Training plan X X
Training budget X X
Annual performance review X X
Work shadowing X X
Formally assess performance after training X X
Investors in People accredited X X
Holds ISO9000 X X *
Creates teams to work on projects X X *
Business plan X X
Employee consultation X X *
Training needs assessment X
Consult with trade unions X
Steps taken to overcome recruitment difficulties X
Identification of high potential individuals X*
Staff have formal written job description X
Give employees information about the financial position of the establishment
X X*
Have teams of people that solve specific problems X*
Have an equal opportunities policy X*
Formal procedure for dealing with discipline and dismissals X*
Methods to communicate or share information X*
Employees have task discretion and variety in their work X*
Access to flexible working X
Steps taken to overcome a lack of proficiency amongst staff X
Types of on- and off- the job training provided X
High Performance Working in the Employer Skills Surveys
7
The analysis in this report is based on the UK-wide data files for the UK Commission’s
Employer Skills Survey 2011 and Employer Perspectives Survey 2007. In 2011, in order
to maintain a reasonable interview length, establishments in the sample outside of
Scotland were randomly allocated to two modules, and only those in the first module (and
all establishments in Scotland) were asked questions relating to HPW. These are marked
with an asterisk in Table 2.1. In addition, the 2011 data file includes responses from
establishments with one or more people working at them, whereas the 2007 EPS sample
is of establishments with two or more people working at them. In order to ensure
comparability with the population covered by the 2007 survey, the descriptive analysis
excludes establishments with just one person working at them. The unweighted base size
for the HPW questions in the 2011 sample was 44,691; slightly over half the total sample.
The HPW and related indicators in the 2011 survey can be grouped into sets of practices.
The analysis undertaken for this project, including assessing the correlations between
practice use, is based on three main groups of practices: work organisation (opportunities
for employee involvement and participation); skills acquisition (training and development);
and motivation enhancement (incentives to perform in line with the organisation’s
objectives) (Appelbaum et al. 2000; Kalleberg et al. 2006; de Menezes and Wood 2006).
These groupings align well with the 4As model identified above. Only one practice (Equal
opportunities policy) relates to the Access category. The remaining three areas
(application, attitude and ability) correspond reasonably closely to employee involvement,
motivational practices and skills acquisition respectively.
In addition, three of the practices can be viewed as concomitants of HPW. Investors in
People and ISO 9000 accreditation are useful indicators of high performance working as
many of the criteria imply the use of HPW practices, but have been classified as
concomitants in the analysis of predictors of the adoption of HPW. Having a business
plan is also not necessarily associated with the HPW, as the content may not always
include HR issues, so has also been classed as a concomitant.
Figure 2.1 sets out the classification of practices and concomitants used in the main
analysis. Table 2.2 lists the questions used to measure each of these practices and
concomitants in the Employer Skills Survey 2011.

High Performance Working in the Employer Skills Surveys
8
Figure 2.1: HPW practices and concomitants in the 2011 survey
Employee Involvement
Task discretion
Task variety
Problem solving teams
Descriptions
Project teams
Team briefings
Suggestion scheme
Staff survey
Skills Acquisition
Induction
Work shadowing
Off-the-job training
On-the-job training
Training plan
Training budget
Annual performance review
Evaluation of training
Motivational Practices
Organisational Performance-related pay
Individual performance-related pay
Formal employee consultation procedures
Formal discipline and dismissal procedures
Flexible benefits
Flexible working
Equal opportunity policy Concomitants
Investors in People accreditation
ISO9000 accreditation
Business plan
Table 2.2: HPW practices and corresponding questions in the 2011 survey
Practice Question
Employee Involvement
Task discretion To what extent would you say that employees at your establishment have discretion over how they do their work?
Task variety To what extent would you say that employees at your establishment have variety in their work?
Problem solving teams Does your establishment have teams of people that solve specific problems or discuss aspects of work performance? These are sometimes known as ‘problem-solving groups’ or ‘continuous improvement groups’.
Descriptions Approximately what proportion of your staff has a formal written job description?
Project teams Does your establishment create teams of people, who don’t usually work together, to work on a specific project?
Team briefings Which of the following methods do you use to communicate or share information in this workplace: [Scheduled team meetings]?
Suggestion scheme Which of the following methods do you use to communicate or share information in this workplace: [Formal stuff suggestion scheme]?
Staff survey Which of the following methods do you use to communicate or share information in this workplace: [Annual staff surveys]?
Skills Acquisition
Induction Which of the following types of training have you funded or arranged for employees at this establishment over the past year: [induction training]?
Work shadowing And has your establishment done any of the following to aid the development of your employees in the last 12 months: [provided opportunities for staff to spend time learning through watching others perform their job roles]?
High Performance Working in the Employer Skills Surveys
9
Off-the-job training Over the past 12 months, have you arranged or funded any off-the-job training or development for employees at this site – by off-the-job training we mean training away from the individual’s immediate work position, whether on your premises or elsewhere.
On-the-job training Over the past 12 months, have you arranged or funded any on-the-job training or development for employees at this site – by this I mean activities that would be recognised as training by the staff, and not the sort of learning by experience which could take place all the time.
Training plan Does your establishment have any of the following: [a training plan that specifies in advance the level and type of training your employees will need in the coming year]?
Training budget Does your establishment have any of the following: [a budget for training expenditure]?
Annual performance review (staff appraisal in 2007)
And approximately what proportion of your staff has an annual performance review?
Evaluation of training Does your establishment formally assess whether the training and development received by an employee has an impact on their performance?
Motivational
Organisational Performance-related pay
Bonuses that are based on the overall performance of the company?
Individual performance-related pay
And does your establishment have any of the following pay and incentive schemes for your employees: [individual performance-related pay]?
Formal employee consultation procedures (incl. trade unions)
Does your establishment have formal procedures in place for employee consultation (such as staff association, employee forum or trade union consultation)?
Formal discipline and dismissal procedures
Is there a formal procedure for dealing with discipline and dismissals (other than redundancies) for non-managerial employees?
Flexible benefits And does your establishment have any of the following pay and incentive schemes for your employees: [flexible benefits]? (Where additional clarification was required, the interviewer would supply the following: ‘This is the option to use some pre-tax pay for extra benefits such as pensions, childcare vouchers, life assurance [sic] etc.’)
Flexible working To what extent would you say that employees at your establishment have access to flexible working?
Equal opportunity policy Does your establishment have an equal opportunities policy?
Concomitants
Investors in People accreditation
Is your establishment currently accredited with the Investors in People Standard?
ISO9000 accreditation Does your establishment currently hold any of the ISO 9000 standards?
Business plan Does your establishment have a business plan that specifies the objectives for the coming year?
Chapter 3 provides a detailed analysis of the use of HPW practices across the UK in 2011.

High Performance Working in the Employer Skills Surveys
10
3 The use of HPW practices in 2011
This chapter describes the level of uptake of HPW practices across the UK, and the
pattern of uptake by sector, size, occupation and geography. This includes the 14
practices encompassed in the UK Commission’s definition as well as related practices.
The use of HPW practices in 2011 in the UK varies by practice. The most commonly used
practices are discretion (87 per cent) and variety (87 per cent), with team briefings (79
per cent) and access to flexible working (78 per cent) close behind. The least commonly
used practice is creating project teams (9 per cent), although 57 per cent of
establishments use problem-solving teams. The spread in the use of motivational
supports is particularly large, and ranges from 78 per cent for flexible working to 21 per
cent for individual performance-related pay. Three fifths (61.8 per cent) of establishments
have a business plan, 15.8 per cent Investors in People accreditation and 12.4 per cent
ISO9000 accreditation (Figure 3.1).
Figure 3.1: Use of HPW Practices across the UK in 2011
Source: UKCESS 2011
0 20 40 60 80 100
Discretion
Variety
Problem solving teams
Formal job descriptions
Project teams
Team briefings
Suggestion scheme
Staff survey
Induction
Work shadowing
Off-the-job training
On-the-job training
Training plan
Training budget
Annual performance review
Evaluation of training
Organisational performance-related pay
Individual performance-related pay
Formal employee consultation
Formal discipline and dismissal …
Flexible benefits
Flexible Working
Equal opportunity policies
Investors in people accreditation
ISO9000 accreditation
Business plan
Proportion of establishments adopting
practice

High Performance Working in the Employer Skills Surveys
11
3.1 HPW uptake by ownership sector
There are substantial differences in practice use between establishments in the private,
voluntary, and public sectors (Figure 3.2). Both central and local government
establishments make more use of almost all HPW practices compared to those in the
private or voluntary sectors. The most significant differences are: the use of training
budgets (23 per cent of private sector establishments had a training budget in 2011
compared to 55 per cent of central government and 73 per cent of local government
workplaces); the use of training plans (33 per cent in the private sector compared to
roughly 72 per cent in the public sector); and the use of an annual performance review
system (51 per cent in the private and 93 per cent in the public sector).
Overall, 13 per cent of private sector establishments have Investors in People
accreditation (as do 30 per cent of voluntary sector establishments). In the public sector,
40 per cent of central government and 46 per cent of local government establishments
have Investors in People accreditation. In the case of ISO9000 11 per cent of voluntary
sector establishments have accreditation, 13 per cent of private sector, 15 per cent of
local government, and 16 per cent of central government establishments. Private sector
establishments are less likely to have a business plan than those in other sectors (58 per
cent of private sectors establishments have a business plan compared to 80 per cent or
more in the other three sectors).

High Performance Working in the Employer Skills Surveys
12
Figure 3.2: Use of practices by broad ownership sector
Source: UKCESS 2011
Base: N = 44691
0 20 40 60 80 100
Task discretion
Task variety
Problem solving teams
Formal job descriptions
Project teams
Team briefings
Suggestion scheme
Staff survey
Induction
Work shadowing
Off-the-job training
On-the-job training
Training plan
Training budget
Annual performance review
Evaluation of training
Organisational performance-related pay
Individual performance-related pay
Formal employee consultation procedures
Formal discipline and dismissal procedures
Flexible benefits
Flexible working
Equal opportunity policy
Investors in People accreditation
ISO9000 accreditation
Business plan
Central Government Local Government
Voluntary Sector Private Sector

High Performance Working in the Employer Skills Surveys
13
3.2 HPW Uptake by broad industrial sector
Differences in the level of adoption of HPW practices are also evident by broad industrial
groupings (primary, manufacturing, construction, private services and public services)
(Figure 3.3). Specifically, 31 per cent of service sector establishments have a training
budget compared to 21 per cent of manufacturing workplaces and even lower figures for
the primary and construction sectors. Similarly, 40 per cent of establishments in the
service sector have a training plan compared to only around 25 per cent in the other three
sectors.
Establishments in the manufacturing sector are most likely to make use of project teams
and have organisational performance-related pay. In contrast, establishments in the
service sector are more likely to make use of a number of employee involvement and
skills acquisition practices. Around 35 per cent of workplaces in the primary and
construction sectors use annual performance reviews, compared to approximately 60 per
cent in services and 50 per cent in manufacturing. Sixty-five per cent of service sector
establishments and 57 per cent of manufacturing workplaces have a business plan with
the figure being somewhat lower for the primary industries (51 per cent) and construction
industry (42 per cent). Two in ten (18 per cent) service sector establishments have
Investors in People accreditation compared with fewer than 10 per cent in the other three
industrial sector groupings (primary, manufacturing and construction), and 26 per cent of
manufacturing establishments have ISO9000 accreditation compared to 12 per cent or
less for the other groupings.
If we differentiate between private and public services (a combination of central and local
government establishments), public service workplaces make substantially more use of
all HPW practices identified in the survey except organisational performance-related pay,
individual performance-related pay and flexible working. The biggest differences involved
annual performance review (93.5 per cent in public services compared to 58.4 per cent in
private services and even less in the other sectors) and employee consultation (87.2 per
cent in public services compared to 45 per cent in private services and even lower in
other sectors). Forty-four per cent of public service establishments have Investors in
People compared to 16 per cent of those in private services; 15 per cent of public
services establishments have ISO9000 compared with 12 per cent in private services;
and 83 per cent of public service establishments have a business plan, compared to 65
per cent of private service ones.

High Performance Working in the Employer Skills Surveys
14
Figure 3.3: Use of practices by broad industrial grouping
Source: UKCESS 2011
0 20 40 60 80 100
Task discretion
Task variety
Problem solving teams
Formal job descriptions
Project teams
Team briefings
Suggestion scheme
Staff survey
Induction
Work shadowing
Off-the-job training
On-the-job training
Training plan
Training budget
Annual performance review
Evaluation of training
Organisational performance-related pay
Individual performance-related pay
Formal employee consultation procedures
Formal discipline and dismissal procedures
Flexible benefits
Flexible working
Equal opportunity policy
Investors in People accreditation
ISO9000 accreditation
Business plan
Public Services
Private Services
Construction
Manufacturing
Primary

High Performance Working in the Employer Skills Surveys
15
The sectors with the highest proportions of establishments adopting at least nine of the
14 practices included in the UK Commission definition of HPW are mining and quarrying,
financial services, public administration, and education (Table 3.1).
Table 3.1 Proportion of establishments adopting 9+ of 14 HPW practices by sector
Sector %
Agriculture, hunting, forestry and fishing 6.8
Mining and quarrying 44.9
Manufacturing 16.3
Electricity, gas and water supply 26.4
Construction 7.4
Wholesale and retail trade 22.4
Hotels and restaurants 18.3
Transport, storage and communications 12.4
Financial services 43.6
Real estate, renting and business activities 17.6
Public admin. and defence, compulsory social security 54.3
Education 46.5
Health and social work 33.3
Community, social and personal service activities 17.9
Source: UKCESS 2011. Base sizes vary.
Analysis by industrial sector (2-digit SIC) reveals that public administration, education,
and health and social work establishments report by far the highest use of individual
HPW practices. In each of these industrial groups over 90 per cent of establishments
make use of work shadowing and 85 per cent indicate that their employees engage in
either on- or off-the-job training and are subject to annual performance reviews. Public
administration and educational establishments also make substantially more use of both
problem solving teams, with 73 per cent in each reporting their use compared to 60 per
cent or less in all other industries, and project teams, with 35 per cent in public
administration and 40 per cent in educational establishments compared to 18 per cent or
less elsewhere. Financial services make significantly more use of organisational
performance-related pay and individual performance-related pay than any other industry
with 58 per cent of workplaces using the organisational performance-related pay
compared to a figure of only 37 per cent for the next highest user, the wholesale and
retail trades, and 51 per cent using individual performance-related pay compared to only
25 per cent for the next biggest user, electricity, gas and water supply. In addition,
establishments in agriculture and construction make very little use of flexible benefits with
only 11 per cent compared to 20 per cent or more in most of the other industries.

High Performance Working in the Employer Skills Surveys
16
3.3 HPW uptake by establishment size
The percentage of establishments using all types of HPW practices strongly reflects the
size of the establishment (Figure 3.4). With three exceptions (task discretion, task variety
and flexible working), practices are more likely to be adopted in larger establishments.
However, there is not necessarily a linear relationship between establishment size band
and adoption of practices. For example, the largest and smallest establishments are most
likely to adopt flexible working and task variety.
Figure 3.4: Use of HPW practices by establishment size
Source: UKCESS 2011
0% 20% 40% 60% 80% 100%
Task discretion
Task variety
Problem solving teams
Formal job descriptions
Project teams
Team briefings
Suggestion scheme
Staff survey
Induction
Work shadowing
Off-the-job training
On-the-job training
Training plan
Training budget
Annual performance review
Evaluation of training
Organisational performance-related pay
Individual performance-related pay
Formal employee consultation procedures
Formal discipline/dismissal procedures
Flexible benefits
Flexible working
Equal opportunity policy
Investors in people accreditation
ISO9000 accreditation
Business plan
HPW establishment
250+
50-249
25-49
5-24
2-4

High Performance Working in the Employer Skills Surveys
17
3.4 HPW uptake by country
There is also variation in the uptake of HPW practices by country. Uptake rates for task
discretion and task variety are nearly uniform (Figure 3.5): between 86 per cent (Wales)
and 87 per cent (Scotland) for the former, between 85 per cent (Wales) and 89 per cent
(Scotland) for the latter. In comparison, the spread in uptake is wider for problem-solving
teams: Northern Ireland and Wales are very similar with 52 per cent and 53 per cent
respectively, followed by 57 per cent for England and 62 per cent for Scotland. The use of
project teams is very low, ranging from 9 per cent (England) to 11 per cent (Scotland).
The use of work shadowing is highest for Northern Ireland (85 per cent), followed by
Scotland (81 per cent) and England (77 per cent); Wales has the lowest uptake rates at
73 per cent. Training budgets exist in 26 per cent of establishments in Wales, 27 per cent
in England, 32 per cent in Northern Ireland and 34 per cent in Scotland. Training plans
are reported to be in use by 37 per cent of establishments in England, followed closely by
38 per cent in Wales, 41 per cent in Northern Ireland and a slightly higher uptake of 46
per cent for Scotland.
Overall, establishments in Scotland use training-related practices most consistently. Of
the skills acquisition practices, Scotland has the highest uptake rate for: induction, off-the-
job training, on-the-job training, training plan, training budget, annual performance review
and evaluation of training. Use of motivational HPW practices varies across countries and
in particular Wales’ uptake is substantially lower than that of other regions for formal
employee consultation, formal discipline and dismissal procedures and equal opportunity
policies. Across countries, uptake of the Investors in People accreditation is highest in
Scotland (18 per cent), followed by Northern Ireland (17 per cent) and England and
Wales (16 per cent in each).
Scotland also has the highest uptake rate for ISO9000 accreditation (14 per cent). Uptake
in Northern Ireland is 12 per cent, England 12 per cent and Wales 13 per cent. Lastly,
Scotland exhibits the highest rates for business plans with 64 per cent, with England at
62 per cent and Northern Ireland with 60 per cent. The lowest uptake is observed for
Wales where 58 per cent of establishments have a business plan.

High Performance Working in the Employer Skills Surveys
18
Figure 3.5: Uptake of HPW practices by UK nation
Source: UKCESS 2011
0 20 40 60 80 100
Task discretion
Task variety
Problem solving teams
Descriptions
Project teams
Team briefings
Suggestion scheme
Staff survey
Induction
Work shadowing
Off-the-job training
On-the-job training
Off-and on-the-job training
Off- or on-the-job training
Training plan
Training budget
Annual performance review
Evaluation of training
Organisational performance-related pay
Individual performance-related pay
Formal employee consultation procedures
Formal discipline and dismissal procedures
Flexible benefits
Flexible working
Equal opportunity policy
Investors in People accreditation
ISO9000 accreditation
Business plan
Northern Ireland
Scotland
Wales
England

High Performance Working in the Employer Skills Surveys
19
3.5 HPW uptake by English regional grouping
Uptake rates for task discretion and task variety are quite similar between regions within
England (North, Midlands and South), with uptake rates of 86 per cent for task discretion
in both the North and the Midlands; however, with 88 per cent the South is closer to
Scotland’s 87 per cent than to the two other English regions (Figure 3.6). For task variety,
uptake varies from 86 per cent in the North region to 87 per cent in the Midlands. When
looking at uptake rates for project teams within England’s regions, the North has the
highest uptake rate of all three regions with 11 per cent. Differences within regions are
slightly more pronounced for staff suggestion schemes which are used in 47 per cent of
establishments in the North, compared to 46 per cent in the Midlands and 43 per cent in
the South.
Of the three English regions, higher uptakes are reported for the North for six out of eight
skills acquisition practices: work shadowing, off-the-job training, on-the-job training,
training plan, training budget and evaluation of training. Particularly for training plan, the
uptake rates of the North are substantially higher (40 per cent) than the other two regions
at 36 per cent for the Midlands and 35 per cent for the South, and are thus more similar
to the uptake rates of Northern Ireland (41 per cent) or Wales (38 per cent) than the two
other English regions.
The use of motivational supports is more diverse across regions. The North has a higher
uptake for formal employee consultation, formal discipline and dismissal procedures and,
marginally, for equal opportunity policy than the Midlands and the South. For formal
employee consultation and formal discipline and dismissal procedure the North of
England has an uptake rate that is substantially higher than that of the other two regions.
In fact, the uptake rates for formal discipline and dismissal procedures are more similar to
Scotland’s 74 per cent than to the 68 per cent for the Midlands or the South.
Looking at individual regions within England, Investors in People accreditation is highest
in the North (19 per cent of establishments) and lowest in the South (14 per cent). The
ISO9000 accreditation rate varies from 12 per cent in the South to 13 per cent in the
North. The North shows a similar rate to Wales (12 per cent). Lastly, 61 per cent of the
establishments in the Midlands have a business plan, in contrast to 62 per cent in the
South and in the North. Here, the individual regions are closer to the rate for England as
a whole than they are to any of the other UK countries.

High Performance Working in the Employer Skills Surveys
20
Figure 3.6: Use of HPW practices by English regional grouping
Source: UKCESS 2011
0 20 40 60 80 100
Task discretion
Task variety
Problem solving teams
Descriptions
Project teams
Team briefings
Suggestion scheme
Staff survey
Induction
Work shadowing
Off-the-job training
On-the-job training
Off-and on-the-job training
Off- or on-the-job training
Training plan
Training budget
Annual performance review (staff …
Evaluation of training
Organisational performance-related pay
Individual performance-related pay
Formal employee consultation …
Formal discipline and dismissal …
Flexible benefits
Flexible working
Equal opportunity policy
Investors in People accreditation
ISO9000 accreditation
Business plan
South
Midlands
North

High Performance Working in the Employer Skills Surveys
21
3.6 HPW Uptake by Largest Occupational Group in the workplace
The data set includes data on the occupation of the largest group of employees (Table
3.2), but not an overall occupation distribution of the workforce. In some cases the largest
occupation group represents all of the employees within a particular workplace (this is
true of 28 per cent of the establishments surveyed) but it can be as low as 20 per cent;
the mean is 57 per cent. There are differences in the extent of practice use when one
classifies establishments according to their largest occupation group.
With only a few exceptions, establishments in which the largest occupational group
comprises professionals, associate professionals, or caring, leisure and other service
occupations make the greatest use of all the involvement practices. These workplaces
exhibit the highest prevalence of five practices, namely: task variety, problem solving
teams, formal job descriptions, project teams and team briefings.
The pattern is similar for skills acquisition practices. Establishments where the largest
occupational group consists of professionals, associate professionals or caring, leisure
and other service occupations adopt a higher proportion of almost all the skills acquisition
practices. For example, 43 per cent of associate professional-dominated establishments
maintain a training budget in comparison to 29 per cent of establishments where
sales/customer services occupations represent the largest group. These same
workplaces also adopt a greater proportion of off-the-job and on-the-job training with the
lowest figure for off-the-job training within these three groups being that for associate
professionals with 59 per cent in comparison to 45 per cent for establishments where
skilled trades represent the largest group, and the lowest figure for on-the-job training
within the same three groups being that for associate professionals with 62 per cent, in
comparison to 56 per cent for establishments where sales/customer service occupations
dominate.
The picture is different for motivational practices, where establishments in which
professionals, associate professionals, or caring, leisure and other service occupations
are the largest occupational group do not consistently adopt a higher proportion of HPW
practices.
High Performance Working in the Employer Skills Surveys
22
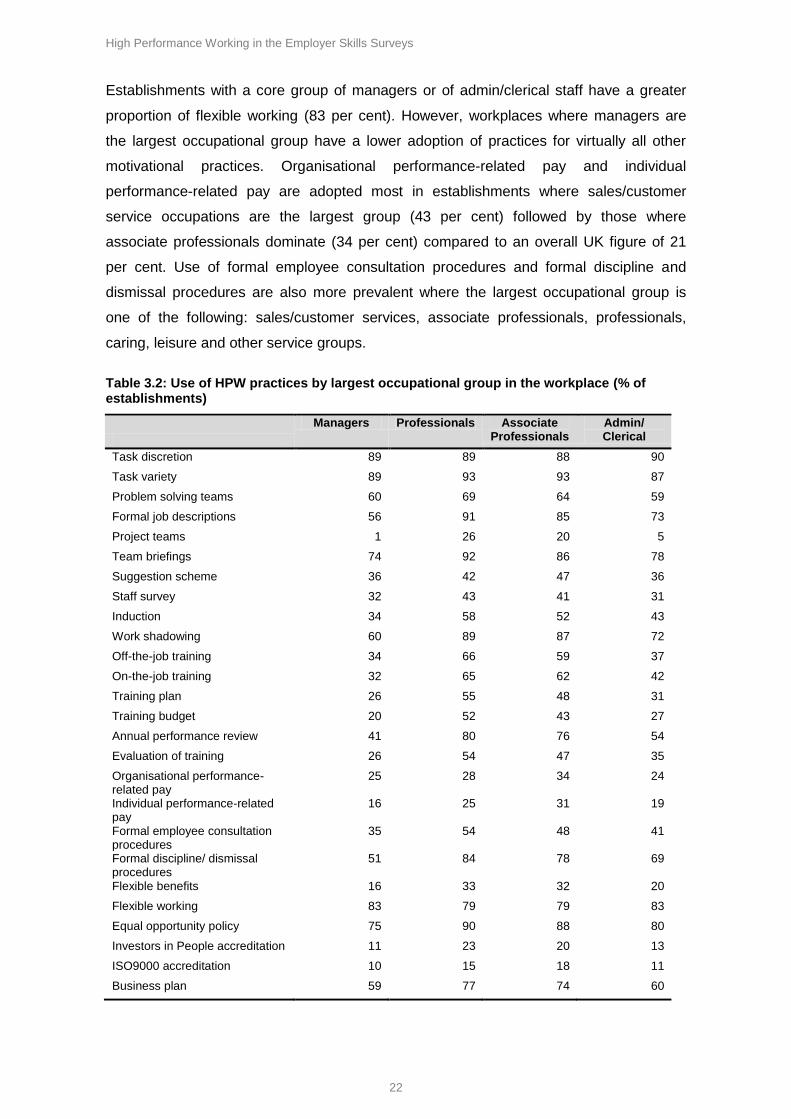
Establishments with a core group of managers or of admin/clerical staff have a greater
proportion of flexible working (83 per cent). However, workplaces where managers are
the largest occupational group have a lower adoption of practices for virtually all other
motivational practices. Organisational performance-related pay and individual
performance-related pay are adopted most in establishments where sales/customer
service occupations are the largest group (43 per cent) followed by those where
associate professionals dominate (34 per cent) compared to an overall UK figure of 21
per cent. Use of formal employee consultation procedures and formal discipline and
dismissal procedures are also more prevalent where the largest occupational group is
one of the following: sales/customer services, associate professionals, professionals,
caring, leisure and other service groups.
Table 3.2: Use of HPW practices by largest occupational group in the workplace (% of establishments)
Managers Professionals Associate Professionals
Admin/ Clerical
Task discretion 89 89 88 90
Task variety 89 93 93 87
Problem solving teams 60 69 64 59
Formal job descriptions 56 91 85 73
Project teams 1 26 20 5
Team briefings 74 92 86 78
Suggestion scheme 36 42 47 36
Staff survey 32 43 41 31
Induction 34 58 52 43
Work shadowing 60 89 87 72
Off-the-job training 34 66 59 37
On-the-job training 32 65 62 42
Training plan 26 55 48 31
Training budget 20 52 43 27
Annual performance review 41 80 76 54
Evaluation of training 26 54 47 35
Organisational performance-related pay
25 28 34 24
Individual performance-related pay
16 25 31 19
Formal employee consultation procedures
35 54 48 41
Formal discipline/ dismissal procedures
51 84 78 69
Flexible benefits 16 33 32 20
Flexible working 83 79 79 83
Equal opportunity policy 75 90 88 80
Investors in People accreditation 11 23 20 13
ISO9000 accreditation 10 15 18 11
Business plan 59 77 74 60
High Performance Working in the Employer Skills Surveys
23
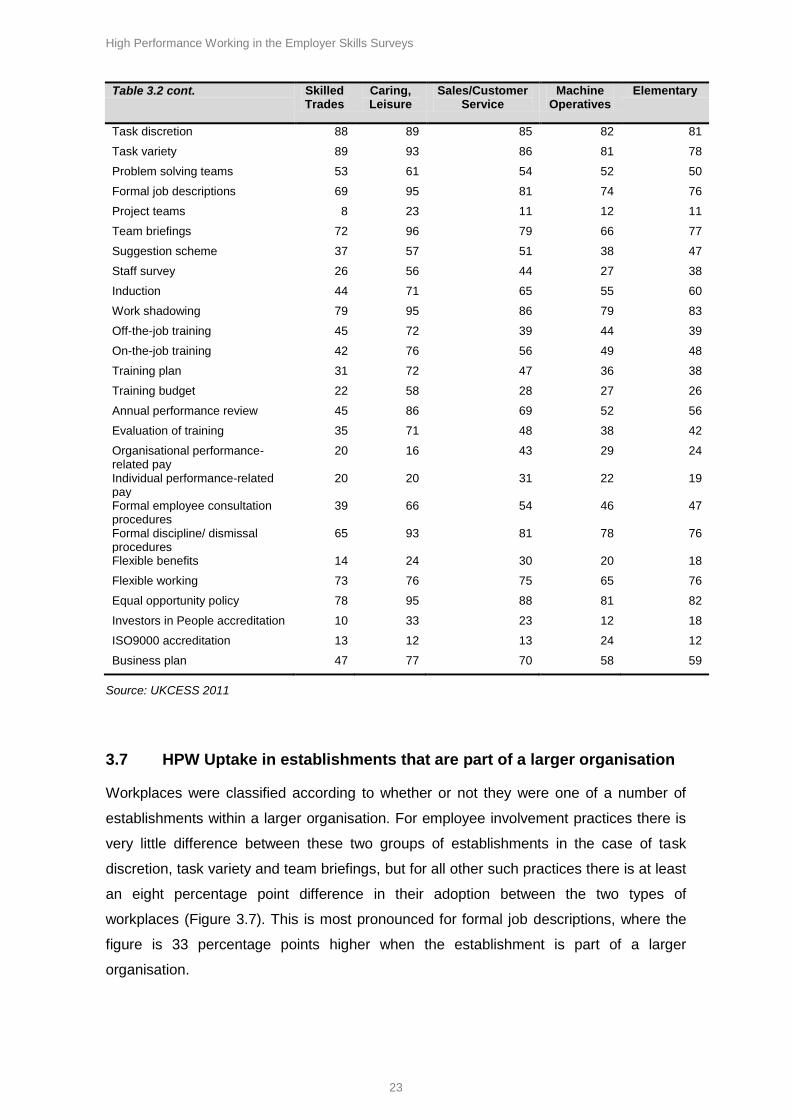
Table 3.2 cont. Skilled Trades
Caring, Leisure
Sales/Customer Service
Machine Operatives
Elementary
Task discretion 88 89 85 82 81
Task variety 89 93 86 81 78
Problem solving teams 53 61 54 52 50
Formal job descriptions 69 95 81 74 76
Project teams 8 23 11 12 11
Team briefings 72 96 79 66 77
Suggestion scheme 37 57 51 38 47
Staff survey 26 56 44 27 38
Induction 44 71 65 55 60
Work shadowing 79 95 86 79 83
Off-the-job training 45 72 39 44 39
On-the-job training 42 76 56 49 48
Training plan 31 72 47 36 38
Training budget 22 58 28 27 26
Annual performance review 45 86 69 52 56
Evaluation of training 35 71 48 38 42
Organisational performance-related pay
20 16 43 29 24
Individual performance-related pay
20 20 31 22 19
Formal employee consultation procedures
39 66 54 46 47
Formal discipline/ dismissal procedures
65 93 81 78 76
Flexible benefits 14 24 30 20 18
Flexible working 73 76 75 65 76
Equal opportunity policy 78 95 88 81 82
Investors in People accreditation 10 33 23 12 18
ISO9000 accreditation 13 12 13 24 12
Business plan 47 77 70 58 59
Source: UKCESS 2011
3.7 HPW Uptake in establishments that are part of a larger organisation
Workplaces were classified according to whether or not they were one of a number of
establishments within a larger organisation. For employee involvement practices there is
very little difference between these two groups of establishments in the case of task
discretion, task variety and team briefings, but for all other such practices there is at least
an eight percentage point difference in their adoption between the two types of
workplaces (Figure 3.7). This is most pronounced for formal job descriptions, where the
figure is 33 percentage points higher when the establishment is part of a larger
organisation.

High Performance Working in the Employer Skills Surveys
24
Use of all skills acquisition practices is higher when the establishment is part of a larger
organisation. Most notably induction, on-the-job training, training plan, training budget,
annual performance review and evaluation of training practices, where the difference
between the two groups of establishments is over 20 per cent.
Motivational practices follow the same pattern as the skills acquisition practices, with the
exception that more establishments that are not part of a larger organisation adopt
flexible working than do establishments that are part of a larger organisation. Overall it is
clear that when an establishment is within a larger organisation it is more likely to adopt
HPW practices.
Figure 3.7: Use of HPW practices by membership of larger organisation
Source: UKCESS 2011
0 10 20 30 40 50 60 70 80 90 100
Task discretion Task variety
Problem solving teams
Formal job descriptions Project teams
Team briefings
Suggestion scheme Staff survey
Induction Work shadowing
Off - the - job training On - the - job training
Training plan Training budget
Annual performance review
Evaluation of training Organisational performance - related pay
Individual performance - related pay
Formal employee consultation Formal discipline/ dismissal
Flexible benefits Flexible working
Equal opportunity policy Investors in people accreditation
ISO9000 accreditation Business plan
Establishment part of a larger organisation Stand - alone establishment
High Performance Working in the Employer Skills Surveys
25
3.8 HPW Uptake by Product Market Strategy
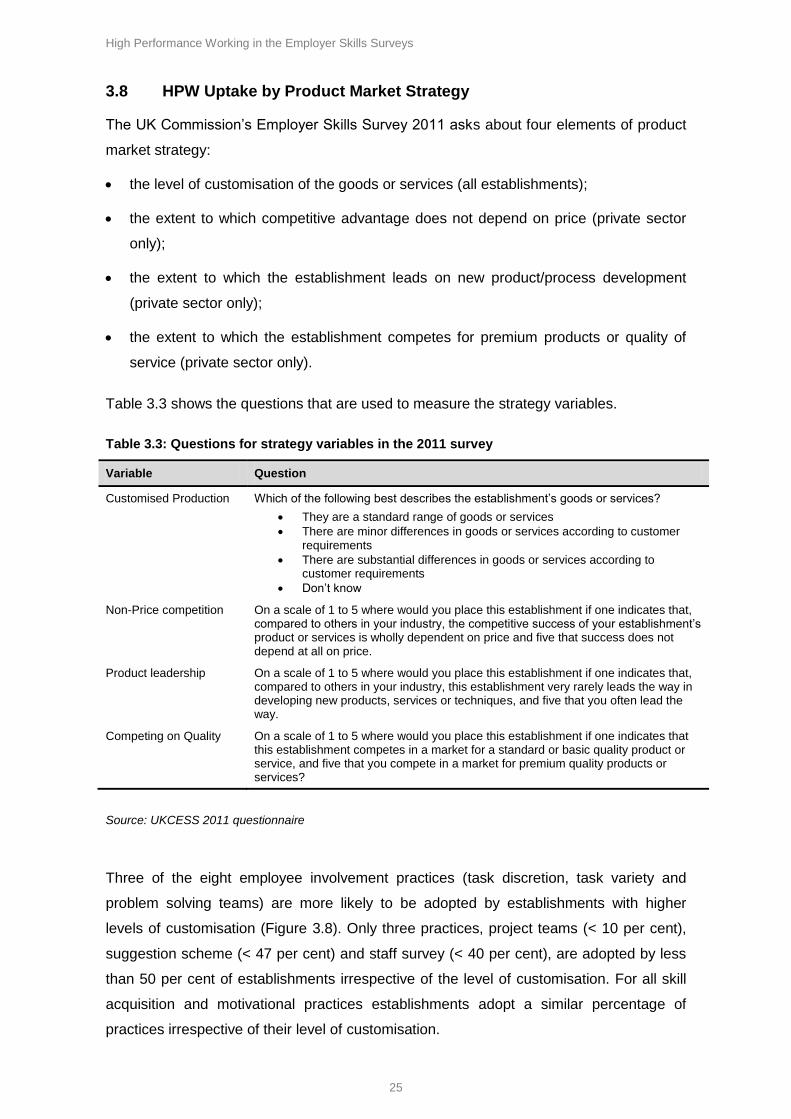
The UK Commission’s Employer Skills Survey 2011 asks about four elements of product
market strategy:
the level of customisation of the goods or services (all establishments);
the extent to which competitive advantage does not depend on price (private sector
only);
the extent to which the establishment leads on new product/process development
(private sector only);
the extent to which the establishment competes for premium products or quality of
service (private sector only).
Table 3.3 shows the questions that are used to measure the strategy variables.
Table 3.3: Questions for strategy variables in the 2011 survey
Variable Question
Customised Production Which of the following best describes the establishment’s goods or services?
They are a standard range of goods or services
There are minor differences in goods or services according to customer requirements
There are substantial differences in goods or services according to customer requirements
Don’t know
Non-Price competition On a scale of 1 to 5 where would you place this establishment if one indicates that, compared to others in your industry, the competitive success of your establishment’s product or services is wholly dependent on price and five that success does not depend at all on price.
Product leadership On a scale of 1 to 5 where would you place this establishment if one indicates that, compared to others in your industry, this establishment very rarely leads the way in developing new products, services or techniques, and five that you often lead the way.
Competing on Quality On a scale of 1 to 5 where would you place this establishment if one indicates that this establishment competes in a market for a standard or basic quality product or service, and five that you compete in a market for premium quality products or services?
Source: UKCESS 2011 questionnaire
Three of the eight employee involvement practices (task discretion, task variety and
problem solving teams) are more likely to be adopted by establishments with higher
levels of customisation (Figure 3.8). Only three practices, project teams (< 10 per cent),
suggestion scheme (< 47 per cent) and staff survey (< 40 per cent), are adopted by less
than 50 per cent of establishments irrespective of the level of customisation. For all skill
acquisition and motivational practices establishments adopt a similar percentage of
practices irrespective of their level of customisation.

High Performance Working in the Employer Skills Surveys
26
Two of the strategy variables, the extent to which the establishment leads on new product
or process development and the extent to which the establishment competes for premium
products or quality of service, are associated with a greater adoption of the three
concomitants, Investors in People accreditation, ISO9000 accreditation, and a business
plan. The other two strategy variables, the level of customisation of goods or services and
the extent to which competitive advantage does not depend on price, are not associated
with the adoption of these three concomitants.
Figure 3.8: HPW practices by establishment’s level of goods or services customisation
Source: UKCESS 2011
0% 10% 20% 30% 40% 50% 60% 70% 80% 90% 100%
Task discretion
Task variety
Problem solving teams
Formal job descriptions
Project teams
Team briefings
Suggestion scheme
Staff survey
Induction
Work shadowing
Off-the-job training
On-the-job training
Training plan
Training budget
Annual performance review
Evaluation of training
Organisational performance- related pay
Individual performance-related pay
Formal employee consultation procedures
Formal discipline/ dismissal procedures
Flexible benefits
Flexible working
Equal opportunity policy
Investors in people accreditation
ISO9000 accreditation
Business plan
HPW establishment
Substantial differences Minor differences Standard range

High Performance Working in the Employer Skills Surveys
27
There are no consistent differences in establishments’ adoption of practices according to
their level of non-price dependency or competition (Table 3.4).
Table 3.4 HPW Practices by level of non-price dependence (% of establishments)
1 (Wholly price
dependent) 2 3 4
5 (Not at all price
dependent)
Task discretion 84.7 86.3 88.0 88.8 84.6
Task variety 81.3 85.6 88.0 89.7 87.1
Problem solving teams 51.6 51.3 53.3 56.0 54.8
Formal job descriptions 65.3 69.7 69.1 67.8 66.3
Project teams 6.5 7.8 7.5 8.1 7.0
Team briefings 67.9 77.9 77.5 77.8 74.9
Suggestion scheme 37.7 43.8 44.0 42.8 39.1
Staff survey 30.4 33.5 35.7 35.9 32.3
Induction 49.7 51.5 49.4 48.2 46.7
Work shadowing 70.2 77.8 75.6 76.4 68.9
Off-the-job training 31.6 39.1 40.5 42.3 38.9
On-the-job training 37.6 47.0 44.2 46.6 41.1
Training plan 32.6 35.4 32.2 35.5 33.0
Training budget 19.5 23.4 23.5 26.8 23.8
Annual performance review 46.7 51.9 51.1 54.0 48.4
Evaluation of training 33.8 37.2 36.2 38.0 35.4
Organisational performance- related pay 25.1 31.8 31.2 32.7 28.2
Individual performance-related pay 20.8 24.4 22.8 23.4 20.5
Formal employee consultation procedures 40.5 41.1 38.8 40.7 37.7
Formal discipline/ dismissal procedures 64.7 66.7 65.9 65.1 61.9
Flexible benefits 16.7 21.9 18.9 20.6 18.8
Flexible working 77.0 78.1 77.6 81.1 79.6
Equal opportunity policy 76.1 81.0 79.5 80.2 76.8
Investors in people accreditation 14.1 12.4 11.8 13.4 13.5
ISO9000 accreditation 13.3 15.0 12.4 12.5 10.9
Business plan 56.1 59.3 57.5 60.8 58.9
HPW establishment (defined by UKCES) 14.7 17.2 16.1 18.5 16.1
Source: UKCESS 2011
For all employee involvement, skills acquisition and motivational practices,
establishments that lead the way in terms of developing new products, services or
techniques are more likely to adopt HPW practices than those establishments that rarely
lead the way (Figure 3.9).

High Performance Working in the Employer Skills Surveys
28
Figure 3.9 HPW practices by extent to which the establishment leads on new product/process development
Source: UKCESS 2011
The data shows that establishments that compete in markets with high or premium quality
products or services (establishments which replied 3, 4 or 5 to the question) are more
likely to adopt all HPW practices than establishments that produce standard or basic
quality products or services (Figure 3.10).
0% 20% 40% 60% 80% 100%
Task discretion
Task variety
Problem solving teams
Formal job descriptions
Project teams
Team briefings
Suggestion scheme
Staff survey
Induction
Work shadowing
Off-the-job training
On-the-job training
Training plan
Training budget
Annual performance review
Evaluation of training
Organisational performance- related pay
Individual performance-related pay
Formal employee consultation procedures
Formal discipline/ dismissal procedures
Flexible benefits
Flexible working
Equal opportunity policy
Investors in people accreditation
ISO9000 accreditation
Business plan
HPW establishment (defined by UKCES)
5 (Often) 4 3 2 1 (Very rarely)

High Performance Working in the Employer Skills Surveys
29
Figure 3.10 HPW Practices by whether the establishment competes for a premium quality of product or service
Source: UKCESS 2011
0% 20% 40% 60% 80% 100%
Task discretion
Task variety
Problem solving teams
Formal job descriptions
Project teams
Team briefings
Suggestion scheme
Staff survey
Induction
Work shadowing
Off - the - job training
On - the - job training
Training plan
Training budget
Annual performance review
Evaluation of training
Organisational performance - related …
Individual performance - related pay
Formal employee consultation …
Formal discipline/ dismissal …
Flexible benefits
Flexible working
Equal opportunity policy
Investors in people accreditation
ISO9000 accreditation
Business plan
HPW establishment (defined by …
5 (Premium) 4 3 2 1 (Standard)

High Performance Working in the Employer Skills Surveys
30
3.9 Summary
The use of HPW practices in 2011 in the UK varies by practice. The most commonly used
practices are discretion (87 per cent) and variety (87 per cent), with team briefings (79
per cent) and access to flexible working (78 per cent) close behind. The least commonly
used practice is creating project teams (9 per cent).
The percentage of establishments using all types of HPW practices strongly reflects the
size of the establishment, with practices more likely to be adopted in larger
establishments. The sectors with the highest proportions of establishments adopting at
least nine of the 14 practices included in the UK Commission definition of HPW are
mining and quarrying, financial services, public administration, and education. Public
administration, education, and health and social work establishments report the highest
use of individual HPW practices.
There is variation in the uptake of HPW practices by country. Overall, establishments in
Scotland use training-related practices most consistently. Use of motivational HPW
practices varies across countries. Uptake rates for task discretion and task variety are
quite similar between English regions. Higher uptakes are reported for the North for six
out of eight skills acquisition practices, but the use of motivational supports is more
diverse across regions.
Establishments in which the largest occupational group comprises professionals,
associate professionals, or caring, leisure and other service occupations make the
greatest use of all the involvement practices.
Three of the eight employee involvement practices (task discretion, task variety and
problem solving teams) are more likely to be adopted by establishments with higher
levels of customisation. For all skill acquisition and motivational practices establishments
adopt a similar percentage of practices irrespective of their level of customisation. In
general, establishments competing in markets with high or premium quality products or
services are more likely to adopt HPW practices than establishments that produce
standard or basic quality products or services.

High Performance Working in the Employer Skills Surveys
31
4 The relationships between HPW practices
This section identifies the relationships between the use of HPW practices, as well as
potential predictors of adopting bundles of HPW practices and being a HPW organisation.
This section assesses the grouping of practices by identifying which (if any HPW
practices) are linked to common factors. It uses factor analysis to assess whether there is
an underlying common factor that explains the correlations amongst variables
4.1 Relationships between use of practices
There are significant relationships between the use of most practices but some are
relatively weak. The analysis reveals that the relationships between practices within the
same groupings are stronger than those involving pairs that span groups. The average
correlation between pairs of practices within the same grouping is equal to 0.49, whereas
the average correlation between pairs that span over groups is equal to 0.30, a
statistically significant difference. These correlations between practices in the same group
are shown in Tables A.3 to A.6 (Annex A). If the correlations between practices were
approximately uniform across all pairs then this would suggest that all HPW practices
tend to be used together. However, as they are not this indicates a more fragmented use;
and as sets of HPW practices are not uniformly correlated, this suggests that there are
various dimensions to HPW systems.
Task discretion and variety are only weakly correlated with the other practices in the
group whereas they correlate quite strongly with each other. This suggests two distinct
dimensions/factors within the involvement group of practices consistent with the
classification into role and organisational involvement. In the case of skills acquisition, all
correlations are high suggesting there is only one underlying factor, whereas the
motivational practices are only weakly correlated indicating fragmented use and the lack
of a common factor.
The use of factor analysis firstly confirms that a single common factor does not underlie
all the practices. The analysis shows that there are three groupings of practices:
role involvement (task discretion and variety);
organisational involvement (problem solving teams, formal job descriptions; project
teams; team briefings; suggestion scheme; staff survey; and annual performance
review);

High Performance Working in the Employer Skills Surveys
32
skills and knowledge acquisition practices (induction; work shadowing; off-the-job
training; on-the-job training; training plan; training budget; and evaluation of
training).
These groupings differ from those suggested by the literature (Employee involvement,
Skills acquisition, and Motivational practices).
Table 4.1 shows the results of the factor analysis for the relevant HPW practices, with the
figures in bold indicating which practices are underpinned by the factors identified. Factor
1 corresponds to the organisational involvement grouping, factor 2 to the skills and
knowledge acquisition grouping, and factor 3 to the role involvement grouping.
Table 4.1: Factor analysis of Involvement and Skills acquisition practices
Factor 1 Factor 2 Factor 3
Task discretion -0.0560 -0.0255 0.6918
Task variety 0.0854 0.1228 0.7234
Problem solving teams 0.6957 0.3186 0.0471
Formal job descriptions 0.5599 0.4475 0.0607
Project teams 0.6658 0.2941 0.0937
Team briefings 0.9274 0.3000 -0.0292
Suggestion scheme
0.7558 0.2514 0.0096
Staff Survey 0.7669 0.2718 0.0282
Induction 0.3774 0.7510 -0.0193
Work shadowing 0.4494 0.5380 0.1201
Off-the-job training
0.2436 0.6505 0.0932
On-the-job training
0.3046 0.8051 0.0170
Training Plan 0.4852 0.5566 0.0636
Training Budget 0.4357 0.5401 0.1297
Evaluation of training
0.3370 0.7544 0.0643
Annual performance review
0.6258 0.4830 0.1372
Variance 4.69779 3.95975 1.08590
Note: The numbers in bold represent those which are higher than 0.5.
High Performance Working in the Employer Skills Surveys
33
There are significant relationships between the use of some of the practices in the UK
Commission’s time-series definition of HPW organisations (Tables A.4 and A.5).
Providing training, having a training plan, a training budget, evaluating training, having a
business plan, employee consultation and performing annual reviews are practices that
are highly correlated with each other. This suggests that they usually are interconnected
and implemented together. The correlations between all other practices are lower,
suggesting no grouping between them.
4.2 Predictors of being a HPW organisation
The results in Table 4.1 suggest that we can meaningfully measure three dimensions of
HPW, and use composite measures to test potential predictors of HPW systems and their
effects. In the case of motivational supports, each practice has to be measured
separately for such an analysis.
Predictors included in the analysis are listed here and represented in Figure 4.1:
country;
establishment size;
broad industrial sector;
whether the organisation has a formal employee voice mechanism;
strategy (only private sector organisations were asked about price dependency,
product leadership and competing on quality);
whether the establishment is part of a larger organisation;
whether the establishment adopts a total quality management system (ISO 9000 is
used as a proxy).
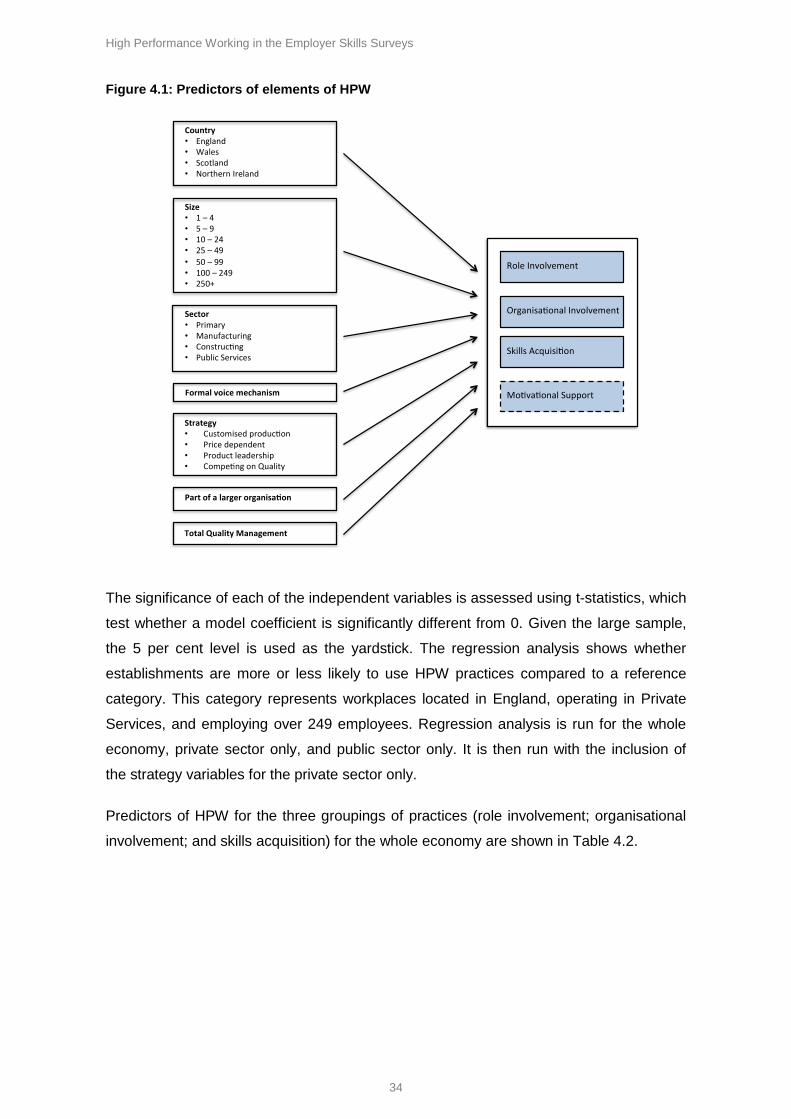
High Performance Working in the Employer Skills Surveys
34
Figure 4.1: Predictors of elements of HPW
The significance of each of the independent variables is assessed using t-statistics, which
test whether a model coefficient is significantly different from 0. Given the large sample,
the 5 per cent level is used as the yardstick. The regression analysis shows whether
establishments are more or less likely to use HPW practices compared to a reference
category. This category represents workplaces located in England, operating in Private
Services, and employing over 249 employees. Regression analysis is run for the whole
economy, private sector only, and public sector only. It is then run with the inclusion of
the strategy variables for the private sector only.
Predictors of HPW for the three groupings of practices (role involvement; organisational
involvement; and skills acquisition) for the whole economy are shown in Table 4.2.
Country• England• Wales• Scotland• NorthernIreland
Size• 1–4• 5–9• 10–24• 25–49
• 50–99• 100–249• 250+
Sector• Primary• Manufacturing• Construc ng• PublicServices
Strategy• Customisedproduc on• Pricedependent• Productleadership• Compe ngonQuality
TotalQualityManagement
Partofalargerorganisa on
Formalvoicemechanism
Organisa onalInvolvement
SkillsAcquisi on
Mo va onalSupport
RoleInvolvement

High Performance Working in the Employer Skills Surveys
35
Table 4.2: Predictors of HPW subsystems (whole economy)
Dependent Variable
Independent Variable
Role Involvement Organisational
Involvement Skills Acquisition
Beta Coeff.
t-value Beta
Coeff. t-value
Beta Coeff.
t-value
Northern Ireland .008 0.66 .002 0.10 .087 2.63 **
Scotland .009 0.79 -.010 -0.50 .060 2.26 *
Wales -.011 -0.93 -.048 -2.38 ** .001 0.07
England
Primary .029 1.80 -.287 -6.65 ** -.018 -0.44
Manufacturing -.012 -1.32 -.119 -7.43 ** -.213 -10.59 **
Construction .006 0.67 -.222 -10.49 ** -.102 -4.28 **
Public Services .065 8.74 ** .128 12.14 ** .114 7.51 **
Private Services
Size 1-4 .106 6.70 ** -.821 -43.86 ** -.666 -35.09 **
Size 5-9 .088 5.66 ** -.555 -36.00 ** -.270 -18.96 **
Size 10-24 .048 3.14 ** -.032 -2.15 * -.112 -8.74 **
Size 25-49 .022 1.39 -.012 -0.85 -.015 -1.25
Size 50-99 -.011 -0.68 -.005 -0.35 .009 0.77
Size 100-249 -.012 -0.67 .010 0.63 .006 0.48
Size >=250
Formal voice mechanisms1 .052 8.51 ** .421 34.84 ** .352 23.77 **
Part of a larger organisation
-.002 -0.39 .635 56.10 ** .225 16.69 **
Customised production .032 9.73 ** .008 1.60 .051 7.27 **
Total quality management .002 0.36 .135 12.70 ** .119 8.62 **
Constant .372 20.76 ** .778 35.09 ** 1.146 48.12 **
* = p < .05, ** = p < .01
Role involvement practices are more prevalent in public services relative to private
services, and establishments with less than 25 employees relative to those with more
than 249 employees (see Table 4.2). They are also associated with formal employee
consultation procedures and customised production. They are not however related to
being part of a wider organisation or to total quality management.
1 ISO9000 is used as a measure of Total Quality Management and formal employee consultation as a measure of
Employee Voice.

High Performance Working in the Employer Skills Surveys
36
The picture is not as consistent for the regression for organisational involvement, where
significant coefficients are both positive and negative. Organisational involvement is more
prevalent in public services and less prevalent in primary industries, construction and
manufacturing relative to private services. Workplaces with less than 25 employees are
less likely to practice organisational involvement relative to those with more than 249
employees. Formal employee consultation procedures have a positive relationship with
organisational involvement. Being part of a wider organisation and total quality
management are significantly positively related to organisational involvement, but
customised production is unrelated to it. Region is also significant: establishments in
Northern Ireland and Scotland make more use of organisational involvement practices
than those in England.
The results for skills acquisition are similar to those for organisational involvement. Use of
skills acquisition practices is more prevalent in public services relative to private services
and less likely to be implemented in construction or manufacturing. Workplaces with less
than 25 employees are less likely to practice skills acquisition. Formal employee
consultation procedures, being part of a wider organisation and total quality management
are significantly positively related to skills acquisition as they were for organisational
involvement. Finally, unlike organisation involvement, customised production is positively
related to skills acquisition.
Regional differences exist: organisational involvement is less prevalent, relative to
England, in establishments located in Wales, and more prevalent in Northern Ireland and
Scotland. Organisational performance-related pay is less prevalent in Northern Ireland,
and workplaces with an equal opportunity policy are more prevalent there than in
England. For establishments in Scotland, individual performance-related pay and flexible
working are less prevalent relative to England.
Analysis of the private and public sector separately reveals differences in relation to
customised production (Table A.9). In the private sector this variable is negatively related
to both organisational involvement and skills acquisition but unrelated to role involvement.
In contrast it is highly significantly positively related to all three dimensions in the public
sector. In the private sector, the less production or service is customised the greater the
level of organisational involvement and skills acquisition; in the public sector the opposite
is true and the more production or service is customised, the greater the level of role
involvement, organisational involvement and skills acquisition.

High Performance Working in the Employer Skills Surveys
37
The regression results for the motivational supports (Organisation performance-related
pay; Individual performance related pay; Formal discipline and dismissal procedures;
Flexible benefits; Flexible work; and Equal opportunity policies) are shown in Table A.10.
Formal voice mechanism is related positively to all of the motivational practices. Being
part of a larger organisation is also related to all the practices, but the nature of the
association varies between practices (for example, flexible working is less likely in
workplaces that are part of a larger organisation). Public services is positively associated
with formal discipline procedures, and equal opportunity policies is negatively related to
organisational performance-related pay, individual performance-related pay and flexible
working, and unrelated to flexible benefits. Region is significantly related to organisational
performance-related pay, individual performance-related pay, flexible working and having
an equal opportunity policy. All are less frequently adopted in Wales than in England.
Total quality management is positively associated with all the practices, with the
exception of flexible working which is unrelated to it. Finally, customised production is
also positively related to all but one of the practices, in this case formal discipline
procedure.
There are few differences in the predictors of motivational supports when separate
regressions are run for the private and public sectors (Tables A.11 and A.12).
Manufacturing workplaces in the private sector are less likely to have individual
performance-related pay than are those in services and other activities, when the type of
activity has no effect on this in the public sector. A minor difference occurs for formal
discipline procedures: in the private sector workplaces below 25 employees are less likely
to have these, but in the public sector the cut-off point is below 10 employees. The
biggest difference is within customised production. In private workplaces the more
customised the production or service the more likely are they to have organisational
performance-related pay, individual performance-related pay, and the less likely they are
to have formal discipline procedures; whereas in the public sector workplaces the more
customised the production or service the less likely are they to have organisational
performance-related pay, individual performance-related pay, and flexible working, and
the more likely they are to have formal discipline procedures and equal opportunity
policies.
When the strategy variables are included in the private sector analysis, some are
significant (Table 4.3). Product leadership and competing on quality are positively related
to organisational involvement. Competing on quality is positively related to role
involvement and product leadership to skills acquisition. Customised production is
positively related to skills acquisition.

High Performance Working in the Employer Skills Surveys
38
Table 4.3: Predictors of HPW Subsystems with inclusion of strategy variables (Private Sector)
Dependent Variable
Independent Variable
Role Involvement Organisational
Involvement Skills Acquisition
Beta Coeff.
t-value Beta
Coeff. t-value
Beta Coeff.
t-value
Northern Ireland .003 0.27 .014 0.45 .103 2.47 *
Scotland .004 0.32 .021 0.82 .082 2.59 **
Wales -.022 -1.58 -.073 -2.99 ** -.015 -0.57
England
Primary .035 2.23 * -.249 -5.47 ** -.003 -0.09
Manufacturing -.003 -0.34 -.081 -4.97 ** -.183 -8.94 **
Construction .014 1.49 -.147 -6.78 ** -.054 -2.19 *
Public Services
Private Services
Size 1-4 .139 6.19 ** -.866 -34.73 ** -.702 -29.62 **
Size 5-9 .119 5.38 ** -.520 -25.90 ** -.288 -15.91 **
Size 10-24 .073 3.32 ** .001 0.03 -.123 -7.45 **
Size 25-49 .031 1.41 .008 0.45 -.020 -1.26
Size 50-99 -.001 -0.08 .005 0.29 .006 0.40
Size 100-249 -.023 -0.90 -.007 -0.33 -.010 -0.59
Size >=250
Formal voice mechanisms .051 7.64 ** .407 30.30 ** .339 20.59 **
Part of a larger organisation -.010 -1.32 .623 44.81 ** .211 13.33 *
Customised production .019 4.77 ** .001 0.10 .023 2.75 **
Non-price competition .000 0.08 -.004 -0.98 -.001 -0.10
Product leadership .003 1.25 .032 6.97 ** .017 2.91 *
Competing on Quality .009 2.69 * .021 3.92 ** .025 3.63
Total quality management .009 1.10 .162 12.96 ** .143 9.24 *
Constant .313 11.21 ** .570 16.28 ** 1.039 26.03 *
* = p < .05 ** = p < .01
However, the inclusion of the strategy variables into the motivational supports models
reduces considerably the associations involving customised production. Product
leadership is significantly related to all the motivational supports with the exception of
equal opportunity policies. Non-price competition and competing on quality are unrelated
to all motivational supports. Having Investors in People and a business plan are both
related to all motivational supports with one exception as Investors in People is not
significant for organisational performance-related pay (Table 4.4).

High Performance Working in the Employer Skills Surveys
39
Table 4.4: Predictors of HPW Subsystems including Investors in people and business plan as explanatory variables (whole economy)
Dependent Variable
Independent Variable
Role Involvement Organisational
Involvement Skills Acquisition
Beta Coeff.
t-value Beta
Coeff. t-value
Beta Coeff.
t-value
Northern Ireland .008 0.70 .011 0.54 .092 3.01 **
Scotland .010 0.88 .001 0.05 .072 2.87 **
Wales -.009 -0.79 -.046 -2.40 * .008 0.40
England
Primary .032 1.93 -.269 -6.56 ** .001 0.03
Manufacturing -.007 -0.81 -.076 -4.80 ** -.166 -8.29 **
Construction .015 1.65 -.160 -7.70 ** -.033 -1.41
Public Services .064 8.45 ** .103 9.78 ** .083 5.80 **
Private Services
Size 1-4 .116 7.29 ** -.752 -43.59 ** -.588 -32.97 **
Size 5-9 .096 6.13 ** -.502 -35.26 ** -.208 -15.72 **
Size 10-24 .052 3.39 ** -.005 -0.43 -.080 -6.77 **
Size 25-49 .022 1.43 -.005 -0.39 -.005 -0.47
Size 50-99 -.011 -0.66 -.002 -0.16 .014 1.27
Size 100-249 -.012 -0.69 .009 0.61 .004 0.39
Size >=250
Formal voice mechanisms .041 6.69 ** .338 28.70 ** .263 18.03 **
Part of a larger organisation -.010 -1.51 .565 50.64 ** .150 11.21 **
Customised production .031 9.37 ** .002 0.55 .044 6.56 **
Total quality management -.003 -0.43 .084 8.36 ** .061 4.52 **
Investors in People -.001 -0.21 .119 12.41 ** .129 9.43 **
Business Plan .057 7.82 ** .393 24.93 ** .422 23.85 **
Constant .338 18.09 ** .510 22.12 ** .856 34.47 **
* = p < .05 ** = p < .01

High Performance Working in the Employer Skills Surveys
40
HPW Organisation
This section uses the UK Commission’s time-series definition of HPW, in which a score of
nine out of 14 on a composite measure combining 14 indicators from the 2011 Employer
Skills Survey (where each indicator accounted for one) was considered to indicate that an
establishment was HPW. Total quality management, Investors in People, having a
business plan and formal voice mechanism are excluded from the predictors in the
regression equation as they are included in the 14 indicators composing the UK
Commission’s time-series definition (the binary dependent variable).
Four different regression analyses were run: whole economy, private sector only, public
sector only, and private sector including strategy variables. Across all models, region is
not significant, the small-sized workplace has a negative impact, and being part of a
larger organisation has a positive impact on the likelihood of being a HPW organisation
(Table 4.5). Manufacturing and construction establishments are significantly less likely to
be HPW than those in the private service sector. The public sector is significantly more
likely to have it than private services. Customised production is positively related to the
probability of being a HPW establishment when considering the whole economy (model1)
and the public sector (model 3), but is negatively related to the private sector (model 2).
This relationship changes once the strategy variables are included, as both product
leadership and competing on quality are positively associated with being a HPW
establishment, while non-price competition is negatively related to it (model 4).

High Performance Working in the Employer Skills Surveys
41
Table 4.5: Predictors for HPW establishment (UK Commission time-series definition)
Dependent variable Independent variable
Whole economy (Model 1)
Private sector (Model 2)
Public sector (Model 3)
Private sector, with strategy variables
(Model 4)
Beta Coeff.
t-value Beta
Coeff. t-value
Beta Coeff.
t-value Beta
Coeff. t-value
Northern Ireland -.124 -0.57 -.130 -0.59 -.130 -0.60 .012 0.04
Scotland -.074 -0.65 -.058 -0.52 -.070 -0.62 -.031 -0.24
Wales -.104 -1.29 -.094 -1.18 -.103 -1.29 -.121 -1.27
England
Primary -.184 -0.84 -.214 -0.99 -.213 -0.98 -.142 -0.63
Manufacturing -.434 -5.34** -.411 -4.95** -.414 -5.07** -.356 -4.20**
Construction -.570 -6.38** -.557 -6.13** -.562 -6.27** -.435 -4.54**
Public Services .446 5.92**
Private Services
Size 1-4 -3.898 -25.75** -3.958 -26.43** -3.907 -25.94** -3.614 -19.25**
Size 5-9 -3.053 -21.25** -3.106 -21.75** -3.066 -21.39** -2.737 -15.29**
Size 10-24 -2.194 -15.43** -2.239 -15.85** -2.206 -15.56** -1.916 -10.79**
Size 25-49 -1.660 -11.53** -1.672 -11.67** -1.660 -11.57** -1.418 -7.87**
Size 50-99 -1.291 -8.70** -1.290 -8.75** -1.286 -8.70** -1.013 -5.48**
Size 100-249 -.672 -4.29** -.670 -4.31** -.668 -4.28** -.590 -3.01**
Size >=250
Part of a larger organisation
1.617 30.73** 1.590 31.15** 1.601 30.49** 1.595 26.79**
Customised production
.123 4.02** -.051 -2.08* .143 4.40** .016 0.44
Non-price competition
-.055 -2.32*
Product leadership
.216 8.55**
Competing on Quality
.118 4.81**
Constant .704 4.53** 1.122 7.71 .970 6.73** -.477 -2.19*
* = p < .05 ** = p < .01
4.3 Potential outcome concomitants for HPW
The UK Commission’s Employer Skills Survey does not include measures of
organisational performance, but a number of variables can be identified that may be
considered as outcomes of HPW practices or systems, which may themselves impact on
performance. These relate to recruitment, retention, training, and skills deficiencies.
Regression analysis is used to assess the extent to which they are related to the three
dimensions of the HPW and each motivational practices2.
2 This method only tests a relationship so if relationships are found this does not necessarily mean that the elements of the
HPW cause the outcomes we have tested.
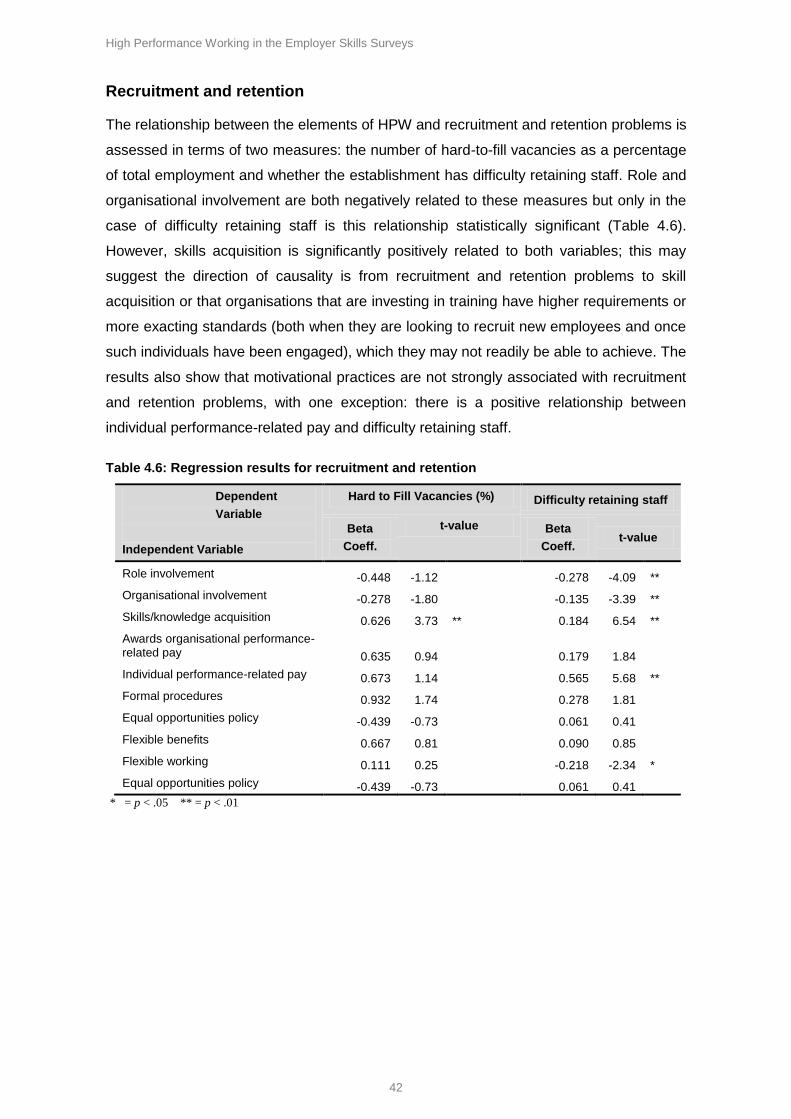
High Performance Working in the Employer Skills Surveys
42
Recruitment and retention
The relationship between the elements of HPW and recruitment and retention problems is
assessed in terms of two measures: the number of hard-to-fill vacancies as a percentage
of total employment and whether the establishment has difficulty retaining staff. Role and
organisational involvement are both negatively related to these measures but only in the
case of difficulty retaining staff is this relationship statistically significant (Table 4.6).
However, skills acquisition is significantly positively related to both variables; this may
suggest the direction of causality is from recruitment and retention problems to skill
acquisition or that organisations that are investing in training have higher requirements or
more exacting standards (both when they are looking to recruit new employees and once
such individuals have been engaged), which they may not readily be able to achieve. The
results also show that motivational practices are not strongly associated with recruitment
and retention problems, with one exception: there is a positive relationship between
individual performance-related pay and difficulty retaining staff.
Table 4.6: Regression results for recruitment and retention
Dependent
Variable
Independent Variable
Hard to Fill Vacancies (%) Difficulty retaining staff
Beta
Coeff.
t-value Beta
Coeff. t-value
Role involvement -0.448 -1.12 -0.278 -4.09 **
Organisational involvement -0.278 -1.80 -0.135 -3.39 **
Skills/knowledge acquisition 0.626 3.73 ** 0.184 6.54 **
Awards organisational performance-related pay 0.635 0.94 0.179 1.84
Individual performance-related pay 0.673 1.14 0.565 5.68 **
Formal procedures 0.932 1.74 0.278 1.81
Equal opportunities policy -0.439 -0.73 0.061 0.41
Flexible benefits 0.667 0.81 0.090 0.85
Flexible working 0.111 0.25 -0.218 -2.34 *
Equal opportunities policy -0.439 -0.73 0.061 0.41
* = p < .05 ** = p < .01

High Performance Working in the Employer Skills Surveys
43
Training
Training is measured by the average of the numbers of days training employees receive
at an establishment and the percentage of establishment staff trained. Skill acquisition is
positively related to both variables, indicating that establishments with these particular
policies engage in more training activity (see Table 4.7). However role and organisational
involvement are not related to training days or the amount of trained staff, but
organisational involvement is negatively related to the amount of trained staff, a result
which is hard to explain and may be coincidental. Of the motivational supports only
flexible working is related – positively – to the average number of days training.
Table 4.7: Regression results for extent of training
Dependent
Variable
Independent Variable
Average days training (per employee)
Staff trained (%)
Beta Coeff.
t-value Beta
Coeff. t-value
Role involvement -0.045 -0.37 0.441 0.58
Organisational involvement 0.038 0.50 -1.694 -2.81 **
Skills/knowledge acquisition 1.859 20.59 ** 18.042 34.23 **
Awards organisational performance-related pay -0.312 -1.38 -2.136 -1.64
Individual performance-related pay 0.541 1.73 -2.478 -1.64
Formal procedures 0.067 0.31 2.514 1.87
Flexible benefits -0.443 -1.84 -0.075 -0.03
Flexible work 0.570 3.35 ** -0.696 -0.62
Equal opportunities policy 0.040 0.23 0.255 0.19
* = p < .05 ** = p < .01
Skills deficiencies
Skills deficiencies are measured by whether the establishment has skills gaps, in the
sense that employees are not fully proficient at their jobs, and by skills shortage
vacancies. Neither measure of involvement is related to skills shortage vacancies, but
role involvement is positive and significant in the case of skills gaps (see Table 4.8). Skill
acquisition is positively related to both skills gap and skills shortage vacancies. Again this
may reflect a reverse direction of causality or that establishments that have implemented
skill acquisition to a greater extent have higher standards and requirements than those
that have not and as a result their managers perceive more skills deficiencies than their
less exacting counterparts.

High Performance Working in the Employer Skills Surveys
44
Table 4.8: Regression results for skills deficiencies
Dependent
Variable
Independent Variable
Skills gap Skills shortage vacancies
Beta
Coeff. t-value
Beta
Coeff. t-value
Role involvement -0.742 -3.35 ** 0.002 0.02
Organisational involvement -0.136 -1.09 -0.052 -1.30
Skills/knowledge acquisition 0.612 7.60 ** 0.216 5.93 **
Awards organisational performance-related pay 0.785 2.26 * 0.247 2.35 *
Individual performance-related pay 0.542 1.53 0.570 5.50 **
Formal procedures 0.427 1.06 0.142 0.69
Flexible benefits -0.126 -0.42 0.254 2.24 *
Flexible work -0.582 -2.15 * 0.016 0.18
Equal opportunities policy 0.118 0.28 -0.253 -1.24
* = p < .05 ** = p < .01
4.4 Summary
There are significant relationships between the use of some of the practices in the UK
Commission definition of HPW organisations. Providing training, having a training plan, a
training budget, evaluating training, having a business plan, employee consultation and
performing annual reviews are practices which are highly correlated with each other. This
suggests that they usually are interconnected and implemented together. Across the full
range of HPW practices, there are significant relationships between the use of most
practices but they are relatively weak. The analysis shows that there are three groupings
of practices:
role involvement, including task discretion and variety;
organisational involvement;
skills and knowledge acquisition practices.
For the UK Commission’s definition of being a HPW establishment, predictors include
size (with smaller workplaces less likely to be HPW) and being part of a larger
organisation (more likely). All else being equal, establishments in the manufacturing and
construction groups are significantly less likely to be a HPW organisation, and those in
the public sector are significantly more likely than those in private services. Region is not
a predictor. Customised production is positively related to the probability of being a HPW
establishment when considering the whole economy and the public sector.

High Performance Working in the Employer Skills Surveys
45
Establishments which lead the way in terms of developing new products, services or
techniques, are more likely to adopt HPW practices. Establishments stating that they
compete in markets with high or premium quality products or services are more likely to
adopt HPW practices than establishments that produce standard or basic quality products
or services.
The relationship between HPW and recruitment and retention problems (the number of
hard-to-fill vacancies as a percentage of total employment and whether the establishment
has difficulty retaining staff) is mixed. The skills acquisition practices are significantly
positively related to both variables. Motivational practices are not strongly associated with
recruitment and retention problems, but there is a positive relationship between individual
performance-related pay and difficulty retaining staff.
Training is measured by the average of the numbers of days training employees receive
at an establishment and the percentage of establishment staff trained. Skill acquisition
practices are positively related to both variables.
Skills deficiencies are measured by whether the establishment has skills gaps and skills
shortage vacancies. Role involvement practices are positively related to skills gaps, and
skill acquisition practices are positively related to both skills gap and skills shortage
vacancies. These findings may reflect organisations with skill-related challenges having
adopted HPW practices, but the direction of causality is unclear.

High Performance Working in the Employer Skills Surveys
46
5 Change in uptake of HPWPs (2007 to 2011)
This chapter describes the change in the uptake of HPWPs between 2007 and 2011. The
analysis covers practices that were asked about in both 2007 and 2011. It then identifies
changes in predictors of being a HPW organisation.
5.1 Use of HPW practices
Figure 5.1 shows the percentage of establishments with at least two people working at
that site that had each of the practices in 2007 and 2011, as well as the change.
Figure 5.1: HPW use in 2007 and 2011, and change
Source: UKCESS 2011 and UKEPS 2007.
Base size: 2011 N = 44691; 2007 N = 12557
There has been a decline in the use of almost all the practices between 2007 and 2011 in
the UK. Work shadowing, annual performance review, evaluation of training and
individual performance-related pay experienced the greatest absolute decreases.
However, the proportion of establishments with a business plan increased by 0.3
percentage points between 2007 and 2011.
-40.0 -20.0 0.0 20.0 40.0 60.0 80.0 100.0
Project teams
Work shadowing
Off-or on the job training
Training plan
Training budget
Annual performance review
Evaluation of training
Organisational peformance-related pay
Individual performance related pay
Formal employee consultation
Flexible benefits
Investors in people accreditation
ISO9000 accreditation
Business plan
Change
2007
2011

High Performance Working in the Employer Skills Surveys
47
The change in use of HPW practices varied by establishment size (Figure 5.2). In large
establishments (250 or more employees), the proportion using project teams, training,
annual performance review, employee consultation, flexible benefits, ISO9000 and with a
business plan increased. The greatest decline in the proportion of establishments using
individual HPW practices was for the smallest establishments (those employing between
2 and 4 individuals).
Figure 5.2: HPW practices change 2011-2007 by establishment size band
Source: UKCESS 2011 and UKEPS 2007.
Bases: N ≥ 873 and ≤ 24059
-25 -20 -15 -10 -5 0 5 10
HPW establishment (9 of 14)
Project teams
Work shadowing
Off- or on-the-job training
Training plan
Training budget
Performance-related bonuses
Individual performance-related pay
Annual performance review
Evaluation of training
Formal employee consultation procedures
Flexible benefits
Investors in people accreditation
ISO9000 accreditation
Business plan
250+ 50-249 25-49 5-24 2-4

High Performance Working in the Employer Skills Surveys
48
The percentage of establishments that could be classified as HPW organisations also
declined in the majority of sectors between 2007 and 2011 (Figure 5.3). The greatest
decline (in percentage point terms) was in the public administration sector (24 pp). The
agricultural sector saw a small increase (1pp).
Figure 5.3: Likelihood of being a HPW establishment by sector
Source: UKCESS 2011 and UKEPS 2007.
5.2 Predictors of being a HPW organisation
There are a number of potential predictors of HPW which were included in the 2007 and
2011 surveys. These include: country; industrial sector; sector of ownership;
establishment size band; whether the establishment has a formal voice mechanism for
employees; whether the establishment is part of a larger organisation; and whether the
establishment adopts a total quality management approach.
Predictors varied between 2007 and 2011. Establishments in Wales had a lower level of
practice use than the other countries in 2011 (but not in 2007), as did establishments in
the construction sector and those in public services.
-40.0 -20.0 0.0 20.0 40.0 60.0 80.0
Wholesale and retail trade
Transport, storage and communications
Real estate, renting and business activities
Public admin. and defence, compulsory social security
Mining and quarrying
Manufacturing
Hotels and restaurants
Health and social work
Financial services
Electricity, gas and water supply
Education
Construction
Community, social and personal service activities
Agriculture, hunting, forestry and fishing
Percentage point change 2011 2007

High Performance Working in the Employer Skills Surveys
49
The predictors of Investors in People, ISO9000 and business plan did not differ greatly
between 2007 and 2011. The most notable changes over time are in the public services
sector. In 2007 its achievement of ISO9000 was no different than in the private services
but in 2011 it was significantly lower; while in 2007 having a business plan was more
likely in public services than private services but by 2011 this difference had disappeared.
Analysis was also undertaken on the predictors of being a HPW organisation (having at
least nine of the 14 practices) in 2007 and 2011. There are two differences between the
two years. Establishments in the primary sector were less likely than those in other
sectors to be HPW organisations in 2007, but not in 2011. However, establishments in
the construction sector were less likely than those in other sectors to be HPW
organisations in 2011, but not in 2007 (Table 5.1)
Table 5.1: Predictors of being a HPW organisation (2007 and 2011)
Dependent
Variable
Independent Variable
HPW organisation – 2007 HPW organisation - 2011
Beta
Coeff.
T
value
Beta
Coeff.
T
value
Northern Ireland -.119 -0.50 -.135 -0.62
Scotland -.029 -0.18 -.075 -0.66
Wales .138 0.54 -.109 -1.36
England
Primary -.983 -4.64** -.199 -0.92
Manufacturing -.306 -2.50** -.400 -4.90**
Construction .125 0.65 -.551 -6.14**
Public Services 1.921 7.91** .421 5.69**
Private Services
Size 1-4 -3.100 -15.95** -3.886 -25.79**
Size 5-9 -2.477 -14.98** -3.050 -21.27**
Size 10-24 -1.691 -10.77** -2.191 -15.45**
Size 25-49 -1.232 -7.79** -1.658 -11.55**
Size 50-99 -.950 -6.12** -1.284 -8.68**
Size 100-249 -.634 -3.64** -.668 -4.28**
Size >=250 .
Part of a larger organisation 1.573 12.11** 1.601 30.47**
Constant .724 4.33** .945 -6.54**
The predictors of Investors in People, ISO9000 and business plan did not differ greatly
between 2007 and 2011 (Table A.2).

High Performance Working in the Employer Skills Surveys
50
Examining the total use of HPW practices covered in the surveys shows that 40 per cent
of establishments implement between two and five practices, 34 per cent of
establishments implement 9 or more practices, but only three per cent of establishments
use 15 or 16 practices (Table 5.2).
This contrasts with the distribution of the total use of the practices in the UK
Commission’s measure of being a HPW establishment. The number of establishments
using between two and five practices, 40 per cent is quite close to the percentage for the
more broadly defined HPW measure, but only 19 per cent of establishments use between
nine and 14 of the practices in the UK Commission measure.
Table 5.2: Distribution of the number of practices across establishments
Table 5.3 identifies the cumulative use of HPW practices by establishment. There is no
point at which the adoption of additional practices clearly tails off; rather, this is more
gradual. This may suggest that there is not a clear cut-off point at which a definition of
HPW organisation should be set based on the proportions of establishments adopting
practices.
0
2
4
6
8
10
12
0 1 2 3 4 5 6 7 8 9 10 11 12 13 14 15 16
Pro
po
rtio
n o
f e
stab
lish
me
nts
Number of practices adopted
All HPW practices in survey UK Commission measure

High Performance Working in the Employer Skills Surveys
51
Table 5.3: Cumulative uptake of practices across establishments (% of establishments adopting at least X practices)
Number of practices
Proportion of establishments - all HPW
practices in survey
Proportion of establishments – practices in UK Commission
measure
0 0.8 7.1
1 3.3 17
2 12.6 27.4
3 23.3 38.4
4 33.5 47.6
5 43.1 56.4
6 51.2 65.1
7 58.8 73.3
8 66.2 81.2
9 73 88.1
10 79.2 93.5
11 84.8 97
12 89.3 99
13 93.5 99.8
14 96.9 100
15 98.8
16 100
5.3 Summary
There has been a decline in the use of almost all the practices between 2007 and 2011 in
the UK. Work shadowing, annual performance review, evaluation of training and
individual performance-related pay experienced the greatest absolute decreases.
However, the proportion of establishments with a business plan increased slightly
between 2007 and 2011.
The change in use of HPW practices varied by establishment size. In large
establishments (250 or more employees), the proportion using project teams, training,
annual performance review, employee consultation, flexible benefits, ISO9000 and with a
business plan increased. The greatest decline in the proportion of establishments using
individual HPW practices was for the smallest establishments (those employing between
two and four individuals).

High Performance Working in the Employer Skills Surveys
52
Analysis was also undertaken on the predictors of being a HPW organisation (having at
least nine of the 14 practices) in 2007 and 2011. Predictors in both years included sector
and size of establishment, as well as being part of a larger organisation. There are two
differences between the two years. Establishments in the primary sector were less likely
than those in other sectors to be HPW organisations in 2007, but not in 2011. However,
establishments in the construction sector were less likely than those in other sectors to be
HPW organisations in 2011, but not in 2007.

High Performance Working in the Employer Skills Surveys
53
6 Conclusions
This chapter summarises the level of uptake of HPW practices across the UK; the pattern
of HPW practices uptake by sector, size, occupation and geography; the relationships
amongst HPW practices and between them and other variables asked about in the
survey; the best predictors of the likelihood of a business being a HPW organisation; and
the change of uptake of HPW practices from 2007 to 2011. It then considers potential
changes to the UK Commission’s Employer Skills Survey questionnaire.
The level of uptake of HPW practices across the UK
The use of HPW practices in 2011 in the UK varies by practice. The most commonly used
practices are discretion (87 per cent) and variety (87 per cent), with team briefings (79
per cent) and access to flexible working (78 per cent) close behind. The least commonly
used practice is creating project teams (nine per cent), although 57 per cent of
establishments use problem-solving teams. Three fifths (62 per cent) of establishments
have a business plan, 16 per cent Investors in People accreditation and 12 per cent
ISO9000 accreditation.
The pattern of HPW practices uptake by sector, size, occupation and geography
The percentage of establishments using all types of HPW practices strongly reflects the
size of the establishment, with practices more likely to be adopted in larger
establishments. The sectors with the highest proportions of establishments adopting at
least nine of the 14 practices included in the UK Commission definition of HPW are
mining and quarrying; financial services; public administration and education. Public
administration, education, and health and social work establishments report the highest
use of individual HPW practices.
There is variation in the uptake of HPW practices by country. Overall, establishments in
Scotland use training-related practices most consistently. Use of motivational HPW
practices varies across countries. Uptake rates for task discretion and task variety are
quite similar between English regions. Higher uptakes are reported for the North for six
out of eight skills acquisition practices, but the use of motivational supports is more
diverse across regions.

High Performance Working in the Employer Skills Surveys
54
Establishments in which the largest occupational group comprises professionals,
associate professionals, or caring, leisure and other service occupations make the
greatest use of all the involvement practices.
Three of the eight employee involvement practices (task discretion, task variety and
problem solving teams) are more likely to be adopted by establishments with higher
levels of customisation. For all skill acquisition and motivational practices establishments
adopt a similar percentage of practices irrespective of their level of customisation.
Establishments competing in markets with high or premium quality products or services
are more likely to adopt HPW practices than establishments that produce standard or
basic quality products or services.
The relationships amongst HPW practices and between them and other variables asked about in the 2011 Employer Skills Survey
There are significant relationships between the use of most HPW practices but some are
relatively weak. The use of factor analysis confirms that a single common factor does not
underlie all the practices. The analysis shows that there are three groupings of practices,
which differ from those suggested by the literature (Employee involvement, Skills
acquisition, and Motivational practices).
role involvement, including task discretion and variety;
organisational involvement;
skills and knowledge acquisition practices.
Establishments that lead the way in terms of developing new products, services or
techniques are more likely to adopt HPW practices. Establishments that compete in
markets with high or premium quality products or services are more likely to adopt all
HPW practices than establishments that produce standard or basic quality products or
services.
The relationship between HPW and recruitment and retention problems (the number of
hard-to-fill vacancies as a percentage of total employment and whether the establishment
has difficulty retaining staff) is mixed. The skills acquisition practices are significantly
positively related to both variables. Motivational practices are not strongly associated with
recruitment and retention, but there is a positive relationship between individual
performance-related pay and difficulty retaining staff.

High Performance Working in the Employer Skills Surveys
55
Training is measured by the average of the numbers of days training employees receive
at an establishment and the percentage of establishment staff trained. Skill acquisition
practices are positively related to both variables.
Skills deficiencies are measured by whether the establishment has skills gaps and skills
shortage vacancies. Role involvement practices are positively related to skills gaps, and
skill acquisition practices are positively related to both skills gap and skills shortage
vacancies. These findings may reflect organisations with skill-related challenges having
adopted HPW practices, but the direction of causality is unclear.
The best predictors of the likelihood of an establishment being a HPW organisation
Prevalent concepts of high performance working rest on the notion that performance is
affected by work organisation, involvement, abilities and motivation. The analysis in this
report identifies three dimensions of high performance work systems: role involvement,
organisational involvement and skills acquisition.
There are broad similarities between the predictors of these three dimensions, with
sector, size, strategy, being part of a larger organisation being significantly related to all
three. All are also positively related to employee voice mechanisms. However, there is
variation across the three dimensions by sectors and size range. The differences in the
predictors between the private and public sectors are not especially marked, but public
service workplaces tend to have higher levels of all dimensions of HPW.
There are significant relationships between the use of some of the practices in the UK
Commission’s time-series definition of HPW organisations. Providing training, having a
training plan, a training budget, evaluating training, having a business plan, employee
consultation and performing annual reviews are practices that are highly correlated with
each other. This suggests that they are usually interconnected and implemented
together.
For the UK Commission’s time-series definition of being a HPW establishment, predictors
include size (with smaller workplaces less likely to be HPW) and being part of a larger
organisation (more likely). All else being equal, establishments in the manufacturing and
construction groups are significantly less likely to be practising HPW, and those in the
public sector are significantly more likely than those in private services. Region is not a
predictor. Customised production is positively related to the probability of being a HPW
establishment when considering the whole economy and the public sector.

High Performance Working in the Employer Skills Surveys
56
The change of uptake of HPW practices from 2007 to 2011
There has been a decline in the use of almost all the practices between 2007 and 2011 in
the UK. Work shadowing, annual performance review, evaluation of training and
individual performance-related pay experienced the greatest absolute decreases.
However, the proportion of establishments with a business plan increased by 0.3
percentage points between 2007 and 2011.
The change in use of HPW practices varied by establishment size. In large
establishments (250 or more employees), the proportion using project teams, training,
annual performance review, employee consultation, flexible benefits, ISO9000 and with a
business plan increased. The greatest decline in the proportion of establishments using
individual HPW practices was for the smallest establishments (those employing between
2 and 4 individuals).
Analysis was also undertaken on the predictors of being a HPW organisation (having at
least nine of the 14 practices) in 2007 and 2011. Predictors in both years included sector
and size of establishment, as well as being part of a larger organisation. There are two
differences between the two years. Establishments in the primary sector were less likely
than those in other sectors to be HPW organisations in 2007, but not in 2011. However,
establishments in the construction sector were less likely than those in other sectors to be
HPW organisations in 2011, but not in 2007.
The comparison between the use of HPW practices in 2007 and 2011 shows a decline for
all practices. Nevertheless the drop in the use of these practices is more severe for work
shadowing, annual performance review, evaluation of training and individual
performance-related pay, with this being especially large in manufacturing, electricity, gas
and water supply and construction. Moreover this change in practices is more
pronounced for very small establishments employing less than five individuals. This
highlights the importance of considering freestanding small- and medium- sized
organisations separately from other establishments.
Issues for consideration
There are limited studies of both the relationship between practices or the predictors of
high performance working. However, the results of this study are broadly similar to those
so far. The assessment of the relationship between practices and dimensionality of high
performance working are in line with work on the Workplace Employee Relations Surveys
(WERS) of both 1998 and 2004 (de Menezes and Wood, 2006; Wood and de Menezes,
2008).

High Performance Working in the Employer Skills Surveys
57
The UK Commission’s time-series measure of HPW does not include many indicators
related to employee involvement, and so under-uses the indicators in the 2011 survey to
some extent. In addition, several questions were only asked of establishments with over
nine employees (problem solving groups and teams), and others of those with over nine
employees or part of a larger organisation (annual staff surveys, team meeting and
suggestion schemes). This may have intensified the relationships found between size
and HPW variables, though the variation in the size bands that are significantly related to
these suggest that this may not be that significant.
The primary recommendation would be that all the practices included in our three
measures are asked in future surveys. The additional coverage of high performance
practices in 2011 has paid dividends and now the survey series has a good range of
these. Measures of teamwork, functional flexibility and quality circles might be included;
so also might measures of motivational supports that are perhaps more specific to
supporting involvement or skills acquisition. For example, job security guarantees have
the potential to support idea-capturing schemes and group pay systems to support team
work.
Graded scales might add information. For example, the percentage of people who are
involved in project teams might be used. This would allow replication of the study
reported here as a binary variable could be constructed from these, while allowing for
more refined descriptions and analysis if this is deemed to add value. Adding some
performance variables to the survey might also be beneficial since this would allow the
impact of high performance work systems to be tested.
Future survey design could also consider asking a question relating to adherence to
ISO14000 which focuses on waste and cost reduction through environmental
commitments. This would complement the question on ISO9000. ISO14000 is concerned
with an organisation’s impact on the environment which is increasingly being considered
as an organisation's performance indicator.
Finally, given the inability to ascertain whether the observed decline in practice use is
within workplaces or reflects the changing composition of the economy, the addition of a
panel element to the survey might be desirable.

High Performance Working in the Employer Skills Surveys
58
The implications for policy are twofold. First, that programmes to stimulate the use of
HPW should highlight its various dimensions. Second, the analysis of predictors may
imply on the one hand that workplaces that most need this approach are adopting them
and thus there is little need for policy intervention. On the other hand, it suggests that
policies directed at stimulating particular strategies and lean production could increase
the use of HPW practices.

59
Annex A
This section provides detailed tables of regression, correlation and factor analysis results.
Table A.1: Predictors of Total Use of Practices in 2007 and 2011 and comparison with 2011 Results for HPW scales
Dependent
Variable
Independent Variable
2007 Index 2011 Index
Role Involvement
2011
Organisational Involvement
2011
Skills Acquisition 2011
Beta
Coeff.
T
value
Beta
Coeff.
T
value
Beta
Coeff.
T
value
Beta
Coeff.
T
value
Beta
Coeff.
T
value
Northern Ireland
-.014 -0.44 .030 0.90 .002 0.20 .001 0.06 .080 2.48*
Scotland .005 0.22 -.004 -0.20 .009 0.77 -.010 -0.50 .060 2.25*
Wales .022 0.70 -.051 -2.62** -.013 -1.12 -.048 -2.40* -.001 -0.06
England
Primary -.238 -6.08** -.091 -2.23* .020 1.24 -.289 -6.67** -.029 -0.70
Manufacturing -.060 -2.74** -.154 -8.96** -.005 -0.52 -.117 -7.32** -.201 -9.97**
Construction -.006 -0.18 -.133 -6.39** .008 0.90 -.221 -10.46** -.097 -4.08**
Public Services
.164 4.97** .009 0.79 .059 8.07** .127 12.09** .104 6.89**
Private Services
Size 1-4 -.370 -15.48** -.638 -37.79** .107 6.77** -.821 -43.90** -.665 -35.29**
Size 5-9 -.254 -13.83** -.315 -23.23** .087 5.61** -.555 -36.06** -.271 -19.37**
Size 10-24 -.104 -7.26** -.129 -10.28** .047 3.09** -.032 -2.17* -.113 -9.04**
Size 25-49 -.042 -3.09** -.061 -4.96** .020 1.32 -.013 -0.87 -.017 -1.43
Size 50-99 -.041 -3.61** -.044 -3.49** -.011 -0.66 -.005 -0.35 .010 0.83
Size 100-249 -.010 -0.90 -.020 -1.58 -.011 -0.63 .010 0.65 .007 0.60
Size >=250 .
Formal voice
mechanism .307 13.73** .358 27.04** .051 8.43** .421 34.83** .351 23.76**
Part of a larger organisation
.216 9.58** .285 23.80** -.007 -1.08 .634 56.01** .219 16.18**
Total quality management
.122 7.16** .149 12.68** .006 0.83 .136 12.84** .125 9.10**
Constant 1.596 59.54** 1.456 77.79** .439 26.64** .794 39.54** 1.249 62.09**
* = p < .05
** = p < .01

60
Table A.2: Predictors of Investors in People, ISO9000 and Business Plan in 2007 and 2011
Dependent
Variable
Independent Variable
Investor in People 2007 Investor in People
2011
ISO9000
2007
ISO9000
2011
Business plan
2007
Business plan
2011
Beta Coeff.
T value
Beta Coeff.
T value
Beta Coeff.
T value
Beta Coeff.
T value
Beta Coeff.
T value
Beta Coeff.
T value
Northern Ireland -.016 -0.07 .022 0.13 .119 0.62 -.084 -0.79 .002 0.01 -.076 -0.64
Scotland -.130 -0.74 -.218 -1.96* -.274 -1.44 -.001 -0.01 .359 2.07** -.104 -0.95
Wales .327 1.34 -.002 -0.03 .253 0.84 .029 0.29 .111 0.47 -.153 -1.85
England
Primary -.377 -1.43 .066 0.35 -.449 -1.59 .352 2.47* -.792 -4.83** -.207 -1.76**
Manufacturing -.280 -1.55 -.543 -5.61** 1.213 7.36** 1.158 15.28** -.300 -2.17** -.319 -4.40**
Construction .128 0.58 -.220 -2.15* .741 3.13** .433 4.84** -.598 -3.20** -.684 -10.18**
Public Services 1.900 9.15** .710 9.85** .336 1.22 -.539 -6.04** 1.144 3.29** .140 1.15
Private Services
Size 1-4 -.968 -5.26** -.883 -7.38** -1.34 -6.65** -1.621 -13.15** -1.457 -7.35** -2.188 -9.66**
Size 5-9 -.794 -5.37** -.675 -6.07** -1.183 -6.44** -1.205 -10.87** -1.269 -6.71** -2.021 -9.00**
Size 10-24 -.523 -4.02** -.447 -4.12** -.806 -5.54** -.972 -9.03** -.938 -5.18** -1.611 -7.20**
Size 25-49 -.342 -2.69** -.284 -2.58** -.431 -3.17** -.788 -7.21** -.423 -2.27** -1.126 -4.99**
Size 50-99 -.212 -1.84 -.116 -1.02 -.528 -4.67** -.377 -3.35** -.374 -2.06* -.888 -3.84**
Size 100-249 -.236 -1.89 -.053 -0.45 -.151 -1.22 -.395 -3.35** -.178 -0.92 -.527 -2.14*
Size >=250
Formal voice mechanism .821 5.87** 1.078 17.00** 534 3.48** .767 12.12** 1.01 8.61** .936 18.92**
Part of a larger organisation 1.056 7.26** 1.24 21.38** .662 4.19** 1.036 16.41** .865 6.81** .756 13.97**
Constant -1.847 -8.23** -2.157 -16.58** -1.611 -6.70** -1.635 -12.87** 1.02 4.95** 2.033 8.91**
* = p < .05 ** = p < .01

High Performance Working in the Employer Skills Surveys
61
Table A.3: Correlation matrix for the Employee Involvement practices
Task
discretion Task
variety Problem solving
teams Formal job
descriptions Project teams
Team briefings
Suggestion scheme
Staff Survey
Task discretion 1.0000
Task variety 0.4973 1.0000
Problem solving teams -0.0126 0.1212 1.0000
Formal job descriptions -0.0167 0.1362 0.4931 1.0000
Project teams 0.0208 0.1670 0.8015 0.4758 1.0000
Team briefings -0.0320 0.1119 0.5455 0.5325 0.4973 1.0000
Suggestion scheme -0.0726 0.0998 0.7712 0.6258 0.7262 0.8004 1.0000
Staff Survey -0.0295 0.1246 0.5323 0.5431 0.5235 0.7429 0.7887 1.0000
Table A.4: Correlation matrix for the Skills and Involvement practices
Induction Work
shadowing Off-the-job
training On-the-job
training Training
Plan Training Budget
Annual performance review
Evaluation of training
Induction 1.0000
Work shadowing 0.6158 1.0000
Off-the-job training 0.6050 0.4300 1.0000
On-the-job training 0.7874 0.5660 0.5579 1.0000
Training Plan 0.5484 0.5280 0.4700 0.5629 1.0000
Training Budget 0.5079 0.4656 0.5302 0.5413 0.6341 1.0000
Annual performance review 0.5499 0.5764 0.4486 0.5489 0.6144 0.6096 1.0000
Evaluation of training 0.6566 0.5704 0.6032 0.7478 0.6127 0.5121 0.5839 1.0000
High Performance Working in the Employer Skills Surveys
62
Table A.5: Correlation matrix for the Motivational practices
Org. performance-
related pay
Individual performance-related pay
Formal employee consultation procedures
Formal discipline and dismissal
procedures
Flexible benefits
Flexible working
Equal opportunity
policy
Org. performance-related pay
1.0000
Individual performance-related pay
0.5291 1.0000
Formal employee consultation procedures
0.1814 0.1911 1.0000
Formal discipline and dismissal procedures
0.2712 0.2988 0.6172 1.0000
Flexible benefits 0.4252 0.4026 0.3289 0.4230 1.0000
Flexible working 0.0440 0.0140 0.0111 -0.1124 0.0938 1.0000
Equal opportunity policy 0.2298 0.2194 0.5294 0.5931 0.3615 0.0135 1.0000

63
Table A.6: Correlation matrix for the UKC14 practices
Pro
ject te
am
s
Wo
rk s
had
ow
ing
Tra
inin
g p
rovid
ed
Tra
inin
g p
lan
Tra
inin
g b
ud
ge
t
An
nu
al p
erfo
rman
ce
revie
w
Eva
lua
tion
of tra
inin
g
Org
an
isa
tion
al
pe
rform
ance
-rela
ted
pay
Ind
ivid
ua
l pe
rform
ance
-re
late
d p
ay
Em
plo
ye
e c
on
sulta
tion
Fle
xib
le b
en
efits
Investo
rs in
Pe
ople
ISO
90
00
Bu
sin
ess p
lan
Project teams 1.0000
Work shadowing 0.4811 1.0000
Training provided 0.4734 0.5513 1.0000
Training plan 0.4411 0.5280 0.5837 1.0000
Training budget 0.4589 0.4653 0.5962 0.6337 1.0000
Annual performance review 0.4972 0.5764 0.5546 0.6145 0.6093 1.0000
Evaluation of training 0.4201 0.5657 0.9700 0.6075 0.5113 0.5790 1.0000
Organisational performance-related pay
0.1711 0.2710 0.2429 0.2204 0.1838 0.3815 0.2236 1.0000
Individual performance-related pay 0.2108 0.3244 0.2744 0.2649 0.2409 0.4066 0.2617 0.5291 1.0000
Employee consultation 0.4043 0.4017 0.3639 0.4677 0.4241 0.5169 0.4335 0.1814 0.1911 1.0000
Flexible benefits 0.3560 0.3661 0.3620 0.3894 0.3710 0.4754 0.3109 0.4252 0.4026 0.3288 1.0000
Investors in People 0.3729 0.3317 0.2933 0.4956 0.3983 0.4977 0.4133 0.1360 0.1641 0.4474 0.3218 1.0000
ISO9000 0.2592 0.1843 0.2500 0.3056 0.2492 0.3008 0.2391 0.2464 0.1755 0.2834 0.2536 0.3546 1.0000
Business plan 0.4579 0.4453 0.4401 0.5387 0.5741 0.6226 0.4903 0.3309 0.3035 0.4519 0.4173 0.3184 0.4696 1.0000

64
Table A.7: Factor analysis of the UKC14 practices
Factor 1 Factor 2 Factor 3
Organisational performance-related pay 0.1253 0.7868 0.0858
Individual performance-related pay 0.2447 0.6408 -0.0046
Flexible benefits 0.3721 0.4657 0.2177
Training provided 0.7373 0.1265 0.2481
Training plan 0.6959 0.1162 0.2074
Training budget 0.7208 0.3455 0.2395
Annual performance review 0.7092 0.2334 -0.0395
Work shadowing 0.7238 0.1342 0.1030
Evaluation of training 0.4685 0.0614 0.5318
Investors in People 0.2122 0.2044 0.4366
ISO9000 0.5702 0.1323 0.2072
Project teams 0.5986 0.2691 0.3401
Business plan 0.5285 0.1115 0.3413
Employee consultation 0.1253 0.7868 0.0858
Variance 4.01579 1.61569 0.97737
Note: The numbers in bold represent those which are higher than 0.5.

65
Table A.8: Predictors of HPW Subsystems (whole economy)
Dependent Variable
Independent Variable
Role Involvement Organisational Involvement Skills Acquisition
Beta Coeff.
t-value Beta
Coeff. t-value
Beta Coeff.
t-value
Northern Ireland .008 0.66 .002 0.10 .087 2.63 **
Scotland .009 0.79 -.010 -0.50 .060 2.26 *
Wales -.011 -0.93 -.048 -2.38 ** .001 0.07
England
Primary .029 1.80 -.287 -6.65 ** -.018 -0.44
Manufacturing -.012 -1.32 -.119 -7.43 ** -.213 -10.59 **
Construction .006 0.67 -.222 -10.49 ** -.102 -4.28 **
Public Services .065 8.74 ** .128 12.14 ** .114 7.51 **
Private Services
Size 1-4 .106 6.70 ** -.821 -43.86 ** -.666 -35.09 **
Size 5-9 .088 5.66 ** -.555 -36.00 ** -.270 -18.96 **
Size 10-24 .048 3.14 ** -.032 -2.15 * -.112 -8.74 **
Size 25-49 .022 1.39 -.012 -0.85 -.015 -1.25
Size 50-99 -.011 -0.68 -.005 -0.35 .009 0.77
Size 100-249 -.012 -0.67 .010 0.63 .006 0.48
Size >=250
Formal voice mechanisms .052 8.51 ** .421 34.84 ** .352 23.77 **
Part of a larger organisation -.002 -0.39 .635 56.10 ** .225 16.69 **
Customised production .032 9.73 ** .008 1.60 .051 7.27 **
Total quality management .002 0.36 .135 12.70 ** .119 8.62 **
Constant .372 20.76 ** .778 35.09 ** 1.146 48.12 **
* = p < .05, ** = p < .01

High Performance Working in the Employer Skills Surveys
66
Table A.9: Predictors of HPW subsystems (by Private and Public sector)
Dependent Variable
Independent Variables
PRIVATE PUBLIC
Role Involvement Organisational Involvement
Skills Acquisition Role Involvement Organisational Involvement
Skills Acquisition
Beta Coeff.
t-value Beta
Coeff. t-value
Beta Coeff.
t-value Beta
Coeff. t-value
Beta Coeff.
t-value Beta
Coeff. t-value
Northern Ireland .0050 0.42 -.006 -0.29 .078 2.35* .002 0.21 .003 0.14 .081 2.50*
Scotland .0116 0.94 -.007 -0.36 .063 2.36* .009 0.79 -.009 -0.43 .060 2.27*
Wales -.011 -0.94 -.048 -2.40* .001 0.03 -.013 -1.10 -.046 -2.31* -.000 -0.01
England
Primary .017 1.08 -.281 -6.38** -.029 -0.69 .019 1.20 -.292 -6.76 -.031 -0.75
Manufacturing -.010 -1.04 -.094 -5.73** -.193 -9.44** -.005 -0.57 -.121 -7.55 -.203 -10.09**
Construction .004 0.54 -.201 -9.45** -.091 -3.80** .007 0.87 -.223 -10.58 -.098 -4.15**
Public Services
Private Services
Size 1-4 .093 5.88** -.842 -46.10** -.683 -36.77** .106 6.72** -.827 -44.10** -.669 -35.56**
Size 5-9 .074 4.77** -.566 -37.62** -.285 -20.71** .086 5.58** -.559 -36.28** -.274 -19.67**
Size 10-24 .036 2.37* -.048 -2.90** -.125 -10.16** .047 3.06** -.036 -2.45* -.116 -9.30**
Size 25-49 .016 1.02 -.016 -1.12 -.022 -1.81 .021 1.35 -.013 -0.92 -.017 -1.44
Size 50-99 -.014 -0.86 -.007 -0.51 .007 0.58 -.010 -0.65 -.006 -0.41 .009 0.80
Size 100-249 -.013 -0.72 .009 0.57 .005 0.43 -.011 -0.63 .009 0.59 .007 0.57
Size >=250
Formal voice mechanisms .055 9.05** .410 34.14** .349 23.35** .052 8.48** .423 35.05** .352 23.87**
Part of a larger organisation -.004 -0.70 .617 55.14** .212 15.77** -.007 -1.09 .634 55.99** .219 16.17**
Customised production .003 1.18 -.059 -13.36** -.028 -4.91** .024 8.85** .046 10.34** .039 6.29**
Total quality management .003 0.49 .145 13.74** .128 9.21** .006 0.80 .135 12.71** .124 9.04**
Constant .447 26.57** .928 44.25** 1.323 60.57** .440 26.78** .801 39.79** 1.253 62.50**
* = p < .05, ** = p < .01
67
Table A.10: Predictors of Motivational Supports (whole economy)
Dependent variable
Independent variable
Organisation performance-related pay
Individual performance related
pay
Formal discipline and dismissal procedures
Flexible benefits Flexible work Equal opportunity
policies
Beta
Coeff. t-value
Beta Coeff.
t-value Beta
Coeff. t-value Beta Coeff. t-value
Beta Coeff.
t-value Beta
Coeff. t-value
Northern Ireland -.519 -5.07** -.039 -0.21 .009 0.05 -.168 -1.74 -.144 -1.59 .603 3.33**
Scotland -.055 -0.52 -.362 -3.36** -.181 -1.23 -.144 -1.33 -.218 -2.12* -.070 -0.45
Wales -.321 -3.96** -.256 -3.03** -.180 -1.74 .036 0.39 -.296 -3.56** -.319 -3.13**
England
Primary -.258 -1.94 -.015 -0.09 -.497 -3.43** -.118 -0.80 .134 1.05 -.718 -5.50**
Manufacturing .051 0.71 -.145 -1.87 -.221 -2.24** -.093 -1.14 -.376 -5.50** -.332 -3.28**
Construction -.128 -1.68 -.138 -1.70 -.194 -2.49** -.331 -3.75** -.175 -2.54* -.350 -4.32**
Public Services -2.328 -27.13** -1.013 -15.57** .888 3.02** .003 0.05 -.277 -4.16* 1.069 4.91**
Private Services
Size 1-4 -1.161 -10.46** -1.161 -10.56** -3.426 -5.85** -1.858 -16.46** -.236 -1.87 -1.890 -4.27**
Size 5-9 -.703 -6.67** -.724 -7.07** -1.966 -3.36** -1.408 -13.48** -.621 -5.15** -1.237 -2.80**
Size 10-24 -.533 -5.16** -.504 -5.05** -1.126 -1.92 -1.072 -10.50** -.666 -5.64** -.770 -1.75
Size 25-49 -.427 -4.07** -.380 -3.75** -.471 -0.79 -.933 -9.02** -.763 -6.41** -.378 -0.85
Size 50-99 -.418 -3.84** -.350 -3.33** -.332 -0.54 -.758 -7.06** -.920 -7.54** -.110 -0.24
Size 100-249 -.180 -1.57 -.247 -2.23** .241 0.33 -.493 -4.38** -.590 -4.62** .272 0.53
Size >=250
Formal voice mechanisms
.237 4.67** .502 8.98** 1.657 22.55** .674 12.76** .167 3.29** 1.503 18.08**
Part of a larger organisation
.790 15.39** .513 9.70** 1.244 15.27** .959 18.64** -.341 -6.48** .570 6.62**
Customised production .191 7.54** .096 3.53** -.020 -0.62 .070 2.68** .149 5.79** .089 2.61**
Total quality management .443 7.32** .318 5.26** .631 4.87** .442 7.59** -.079 -1.39 .542 4.28**
Constant -.800 -6.51** -.998 -8.01** 2.967 5.02** -.712 -5.69** 1.540 11.21** 2.396 5.33**
* = p < .05 ** = p < .01

High Performance Working in the Employer Skills Surveys
68
Table A.11: Motivational supports (Private Sector)
Dependent
variable
Independent variable
Organisation performance-related
pay
Individual performance-related
pay
Formal discipline and dismissal procedures
Flexible benefits Flexible work Equal opportunity
policies
Beta
Coeff. t-value
Beta Coeff.
t-value Beta
Coeff. t-value
Beta Coeff.
t-value Beta
Coeff. t-value
Beta Coeff.
t-value
Northern Ireland -.514 -4.94** -.029 -0.17 -.011 -0.06 -.173 -1.79 -.173 -1.94 .568 3.23**
Scotland -.103 -0.96 -.389 -3.61** -.173 -1.17 -.145 -1.34 -.228 -2.21* -.063 -0.40
Wales -.354 -4.43** -.273 -3.23** -.190 -1.84 .034 0.37 -.313 -3.79** -.330 -3.25**
England
Primary -.297 -2.17* -.043 -0.27 -.509 -3.59** -.134 -0.90 .107 0.84 -.769 -5.94**
Manufacturing .026 0.35 -.191 -2.46* -.175 -1.78 -.083 -1.01 -.329 -4.78** -.294 -2.89**
Construction -.177 -2.27* -.186 -2.25* -.165 -2.10* -.329 -3.70** -.157 -2.28* -.337 -4.12**
Size 1-4 -.790 -7.61** -1.007 -9.22** -3.492 -5.96** -1.856 -16.68** -.169 -1.37 -2.000 -4.52**
Size 5-9 -.381 -3.95** -.602 -5.97** -2.024 -3.46** -1.410 -13.67** -.566 -4.80** -1.345 -3.05**
Size 10-24 -.241 -2.56* -.395 -4.03** -1.174 -2.00* -1.074 -10.63** -.619 -5.36** -.863 -1.96
Size 25-49 -.259 -2.71** -.332 -3.33** -.484 -0.82 -.935 -9.08** -.745 -6.36** -.421 -0.94
Size 50-99 -.274 -2.75** -.313 -3.02** -.333 -0.54 -.756 -7.07** -.901 -7.49** -.135 -0.29
Size 100-249 -.080 -0.77 -.217 -1.99* .222 0.31 -.490 -4.37** -.574 -4.56** .251 0.49
Size >=250
Formal voice mechanisms
.262 5.08** .533 9.49** 1.650 22.43** .676 12.81** .153 3.04** 1.504 18.12**
Part of a larger organisation
.868 16.67** .578 11.01** 1.189 14.50** .953 18.82** -.358 -6.82** .531 6.15**
Customised production .364 17.75** .258 12.36** -.181 -6.18** .012 0.60 .021 0.98 -.096 -3.26
Total quality management
.438 7.23** .307 5.06** .653 5.07** .448 7.69** -.054 -0.96 .556 4.38**
Constant -1.541 -13.67** -1.493 -12.58** 3.366 5.71** -.597 -5.07** 1.723 13.20** 2.891 6.47**
* = p < .05
** = p < .01
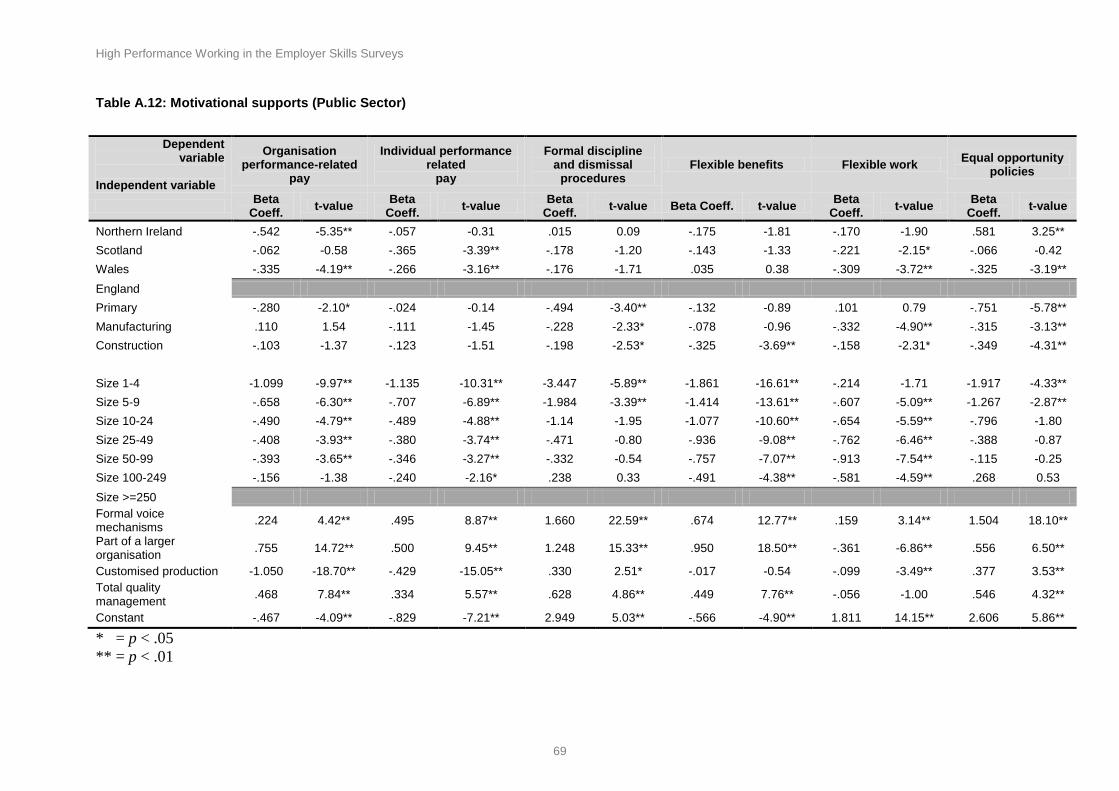
High Performance Working in the Employer Skills Surveys
69
Table A.12: Motivational supports (Public Sector)
Dependent
variable
Independent variable
Organisation performance-related
pay
Individual performance related
pay
Formal discipline and dismissal
procedures Flexible benefits Flexible work
Equal opportunity policies
Beta
Coeff. t-value
Beta Coeff.
t-value Beta
Coeff. t-value Beta Coeff. t-value
Beta Coeff.
t-value Beta
Coeff. t-value
Northern Ireland -.542 -5.35** -.057 -0.31 .015 0.09 -.175 -1.81 -.170 -1.90 .581 3.25**
Scotland -.062 -0.58 -.365 -3.39** -.178 -1.20 -.143 -1.33 -.221 -2.15* -.066 -0.42
Wales -.335 -4.19** -.266 -3.16** -.176 -1.71 .035 0.38 -.309 -3.72** -.325 -3.19**
England
Primary -.280 -2.10* -.024 -0.14 -.494 -3.40** -.132 -0.89 .101 0.79 -.751 -5.78**
Manufacturing .110 1.54 -.111 -1.45 -.228 -2.33* -.078 -0.96 -.332 -4.90** -.315 -3.13**
Construction -.103 -1.37 -.123 -1.51 -.198 -2.53* -.325 -3.69** -.158 -2.31* -.349 -4.31**
Size 1-4 -1.099 -9.97** -1.135 -10.31** -3.447 -5.89** -1.861 -16.61** -.214 -1.71 -1.917 -4.33**
Size 5-9 -.658 -6.30** -.707 -6.89** -1.984 -3.39** -1.414 -13.61** -.607 -5.09** -1.267 -2.87**
Size 10-24 -.490 -4.79** -.489 -4.88** -1.14 -1.95 -1.077 -10.60** -.654 -5.59** -.796 -1.80
Size 25-49 -.408 -3.93** -.380 -3.74** -.471 -0.80 -.936 -9.08** -.762 -6.46** -.388 -0.87
Size 50-99 -.393 -3.65** -.346 -3.27** -.332 -0.54 -.757 -7.07** -.913 -7.54** -.115 -0.25
Size 100-249 -.156 -1.38 -.240 -2.16* .238 0.33 -.491 -4.38** -.581 -4.59** .268 0.53
Size >=250
Formal voice mechanisms
.224 4.42** .495 8.87** 1.660 22.59** .674 12.77** .159 3.14** 1.504 18.10**
Part of a larger organisation
.755 14.72** .500 9.45** 1.248 15.33** .950 18.50** -.361 -6.86** .556 6.50**
Customised production -1.050 -18.70** -.429 -15.05** .330 2.51* -.017 -0.54 -.099 -3.49** .377 3.53**
Total quality management
.468 7.84** .334 5.57** .628 4.86** .449 7.76** -.056 -1.00 .546 4.32**
Constant -.467 -4.09** -.829 -7.21** 2.949 5.03** -.566 -4.90** 1.811 14.15** 2.606 5.86**
* = p < .05
** = p < .01

High Performance Working in the Employer Skills Surveys
70
Table A.13: Motivational Supports with inclusion of strategy variables (Private Sector)
Dependent variable
Independent variable
Organisation performance-related
pay
Individual performance related
pay
Formal discipline and dismissal procedures
Flexible benefits Flexible work Equal opportunity
policies
Beta
Coeff. t-value
Beta Coeff.
t-value Beta
Coeff. t-value Beta Coeff. t-value
Beta Coeff.
t-value Beta
Coeff. t-value
Northern Ireland -.517 -4.81** .047 0.23 -.079 -0.40 -.222 -1.86 -.148 -1.41 .674 3.45**
Scotland -.062 -0.53 -.370 -3.13** -.226 -1.42 -.116 -0.92 -.139 -1.17 -.098 -0.61
Wales -.330 -3.86** -.328 -3.53** -.183 -1.66 .078 0.72 -.313 -3.36** -.365 -3.46**
England
Primary -.398 -2.88** -.104 -0.62 -.502 -3.50** -.091 -0.59 .131 1.01 -.735 -5.70**
Manufacturing -.042 -0.57 -.220 -2.82** -.127 -1.28 -.065 -0.78 -.314 -4.53** -.256 -2.53*
Construction -.207 -2.66** -.203 -2.42* -.094 -1.18 -.269 -2.95** -.125 -1.75 -.298 -3.62**
Size 1-4 -1.190 -8.21** -1.020 -7.29** -3.771 -5.96** -1.815 -12.73** .058 0.39 -1.974 -4.03**
Size 5-9 -.800 -5.76** -.643 -4.89** -2.302 -3.64** -1.343 -10.08** -.372 -2.64** -1.310 -2.68**
Size 10-24 -.646 -4.73** -.454 -3.52** -1.434 -2.26* -1.032 -7.89** -.432 -3.13** -.851 -1.74
Size 25-49 -.513 -3.70** -.361 -2.77** -.722 -1.13 -.835 -6.28** -.419 -3.00** -.504 -1.02
Size 50-99 -.517 -3.63** -.343 -2.55* -.463 -0.69 -.664 -4.84** -.532 -3.71** -.130 -0.26
Size 100-249 -.203 -1.35 -.220 -1.56 -.248 -0.32 -.482 -3.34** -.357 -2.37* .120 0.21
Size >=250
Formal voice mechanisms
.340 6.39** .558 9.41** 1.692 21.60** .663 11.37** .167 3.07** 1.411 16.51**
Part of a larger organisation
.869 15.72** .576 10.01** 1.238 13.74** .917 15.79** -.388 -6.51** .496 5.42**
Customised production .096 3.51** .072 2.41* -.065 -1.78 .017 0.56 .021 0.70 .017 0.47
Non-price competition -.008 -0.47 -.040 -1.96 -.027 -1.12 .001 0.02 .010 0.51 .001 0.06
Product leadership .112 6.19** .098 4.71** .050 2.19* .095 4.67** .051 2.48* -.016 -0.68
Competing on Quality .004 0.21 .014 0.57 -.001 -0.06 .039 1.58 .023 1.00 .023 0.83
Total quality management
.391 6.01** .255 3.88** .628 4.68** .427 6.73** -.190 -3.09** .637 5.09**
Constant -.847 -4.73** -1.254 -6.93** 3.256 5.03** -1.1321 -6.15** 1.218 6.45** 2.537 4.99**
* = p < .05 ** = p < .01

71
Table A.14: Predictors of HPW Subsystems including Investors in people and business plan as explanatory variables (whole economy)
Dependent Variable
Independent Variable
Role Involvement Organisational Involvement
Skills Acquisition
Beta Coeff.
t-value Beta
Coeff. t-value
Beta Coeff.
t-value
Northern Ireland .008 0.70 .011 0.54 .092 3.01 **
Scotland .010 0.88 .001 0.05 .072 2.87 **
Wales -.009 -0.79 -.046 -2.40 * .008 0.40
England
Primary .032 1.93 -.269 -6.56 ** .001 0.03
Manufacturing -.007 -0.81 -.076 -4.80 ** -.166 -8.29 **
Construction .015 1.65 -.160 -7.70 ** -.033 -1.41
Public Services .064 8.45 ** .103 9.78 ** .083 5.80 **
Private Services
Size 1-4 .116 7.29 ** -.752 -43.59 ** -.588 -32.97 **
Size 5-9 .096 6.13 ** -.502 -35.26 ** -.208 -15.72 **
Size 10-24 .052 3.39 ** -.005 -0.43 -.080 -6.77 **
Size 25-49 .022 1.43 -.005 -0.39 -.005 -0.47
Size 50-99 -.011 -0.66 -.002 -0.16 .014 1.27
Size 100-249 -.012 -0.69 .009 0.61 .004 0.39
Size >=250
Formal voice mechanisms .041 6.69 ** .338 28.70 ** .263 18.03 **
Part of a larger organisation -.010 -1.51 .565 50.64 ** .150 11.21 **
Customised production .031 9.37 ** .002 0.55 .044 6.56 **
Total quality management -.003 -0.43 .084 8.36 ** .061 4.52 **
Investors in People -.001 -0.21 .119 12.41 ** .129 9.43 **
Business Plan .057 7.82 ** .393 24.93 ** .422 23.85 **
Constant .338 18.09 ** .510 22.12 ** .856 34.47 **
* = p < .05
** = p < .01

High Performance Working in the Employer Skills Surveys
72
Table A.15: Motivational Support including Investors in people and business plan as explanatory variables (whole economy)
Dependent variable
Independent variable
Organisation performance-related
pay
Individual performance related
pay
Formal discipline and dismissal procedures
Flexible benefits Flexible work Equal opportunity
policies
Beta
Coeff. t-value
Beta Coeff.
t-value Beta
Coeff. t-value Beta Coeff. t-value
Beta Coeff.
t-value Beta
Coeff. t-value
Northern Ireland -.518 -4.95** -.034 -0.19 .007 0.04 -.158 -1.62 -.139 -1.56 .614 3.46**
Scotland -.044 -0.42 -.349 -3.22** -.170 -1.15 -.122 -1.11 -.208 -1.99* -.054 -0.34
Wales -.310 -3.76** -.247 -2.89** -.144 -1.34 .042 0.45 -.289 -3.46** -.286 -2.71**
England
Primary -.230 -1.73 .015 0.09 -.482 -3.27** -.090 -0.60 .149 1.16 -.704 -5.30**
Manufacturing .110 1.50 -.073 -0.95 -.146 -1.47 -.007 -0.10 -.339 -4.90** -.259 -2.53*
Construction -.022 -0.29 -.030 -0.37 -.078 -0.99 -.222 -2.46** -.123 -1.76 -.241 -2.90**
Public Services -2.345 -
27.29** -1.064 -16.25** .834 2.78** -.060 -0.73 -.312 -4.62** .995 4.70**
Private Services
Size 1-4 -1.057 -9.52** -1.045 -9.53** -3.173 -5.41** -1.718 -15.22** -.162 -1.27 -1.634 -3.68**
Size 5-9 -.612 -5.82** -.625 -6.14** -1.711 -2.92** -1.287 -12.33** -.562 -4.62** -1.002 -2.26*
Size 10-24 -.484 -4.71** -.450 -4.55** -.924 -1.57 -.998 -9.81** -.634 -5.34** -.599 -1.36
Size 25-49 -.410 -3.94** -.361 -3.59** -.346 -0.58 -.897 -8.73** -.754 -6.31** -.283 -0.63
Size 50-99 -.406 -3.74** -.338 -3.25** -.235 -0.38 -.734 -6.88** -.918 -7.49** -.036 -0.08
Size 100-249 -.179 -1.57 -.246 -2.24* .290 0.40 -.485 -4.36** -.592 -4.62** .316 0.62
Size >=250
Formal voice mechanisms
.115 2.24* .369 6.50** 1.520 20.44** .523 9.70** .090 1.75 1.3449 16.02**
Part of a larger organisation
.705 13.08** .400 7.21** 1.139 13.63** .832 15.73** -.409 -7.55** .436 4.95**
Customised production .179 6.97** .084 3.09** -.037 -1.11 .060 2.27* .144 5.59** .076 2.20*
Total quality management .374 6.08** .226 3.68** .489 3.79** .331 5.60** -.137 -2.38* .387 2.98**
Investors in people .021 0.35 .190 2.93** .349 2.68** .320 5.39** .156 2.52* .433 3.18**
Business plan .667 11.43** .655 10.48** .697 11.06** .661 10.04** .309 5.60** .718 10.68**
Constant -1.230 -9.48** -1.446 -11.02** 2.402 4.05** -1.202 -9.09** 1.334 9.37** 1.843 4.07**
* = p < .05
** = p < .01

High Performance Working in the Employer Skills Surveys
73
Bibliography
Appelbaum, E., Bailey, T., Berg, P., and Kalleberg, A.L. (2000), Manufacturing
Advantage: Why High Performance Work Systems Pay Off, Ithaca, NY: Cornell
University Press.
Belt, V. and Giles, L. (2009), High Performance Working: A Synthesis of Key Literature,
Evidence Report 4, UK Commission for Employment and Skills. Wath upon Dearne:
UK Commission for Employment and Skills.
De Menezes L. and Wood S.J. (2006), ‘The reality of flexible work systems in Britain’.
International Journal of Human Resource Management 17(1): 106–38.
Kalleberg, A. L., Marsden, P. V., Reynolds, J., and Knoke, D. (2006). ‘Beyond profit?
Sectoral differences in high-performance work practices’. Work and Occupations,
33(3), 271-302.
Tamkin, P., Giles, L., Campbell, M. and Hillage, J (2004) Skills Pay: The Contribution of
Skills to Business Success, SSDA Research Report 5, Sector Skills Development
Agency. Wath Upon Dearne: Sector Skills Development Agency
Wood, S. and de Menezes, L. (2008). ‘Comparing perspectives on high involvement
management and organisational performance across the British economy’.
International Journal of Human Resource Management, 19(4), 639–683.
Evidence Reports present detailed findings of the research produced by the UK Commission for Employment and Skills. The reports contribute to the accumulation of knowledge and intelligence on skills and employment issues through the review of existing evidence or through primary research.
All of the outputs of the UK Commission can be accessed on our website at www.ukces.org.uk
UKCESRenaissance HouseAdwick ParkWath-upon-DearneRotherhamS63 5NBT +44 (0)1709 774 800F +44 (0)1709 774 801
UKCESSanctuary Buildings Great Smith St.Westminster LondonSW1P 3BTT +44 (0)20 7227 7800
This document is available at www.ukces.org.uk under “Publications”
ISBN 978-1-908418-50-0© UKCES 1st Ed/12.12