Embed Size (px)
Citation preview
The M
etLife Study of Working C
aregivers and Employer H
ealth Care C
ostsC
ASE ST
UD
Y
New Insights and Innovations for Reducing Health Care Costs for Employers
FEBRUARY2010
The MetLife Study of
Working Caregivers and Employer
Health Care Costs
University of PittsburghInstitute on Aging
Research for this case study was conducted by Steven M. Albert, Ph.D. and Richard Schulz, Ph.D. from the University of Pittsburgh Institute on Aging, University Center for Social and Urban Research, and Department of Behavioral and Community Health Services, and Alberto Colombi, M.D.
© 2010 MetLife
VariableAndLong-TermCareProductsAre:•NotADepositOrOtherObligationOfBank•NotFDIC-Insured•NotInsuredByAnyFederalGovernmentAgency
OnlyVariableAnnuityProducts:•NotGuaranteedByAnyBankOrCreditUnion•MayGoDownInValue
OnlyLong-TermCareProducts:•NotIssued,GuaranteedOrUnderwrittenByBankOrFDIC•NotAConditionToTheProvisionOrTermOfAnyBankingServiceOrActivity
•PolicyIsAnObligationOfTheIssuingInsuranceCompany
WORKING CAREGIVERS AND EMPLOYER HEALTH CARE COSTS 3
Executive Summary .................................................................................................4
› Key Findings ................................................................................................................................... 4
Introduction ............................................................................................................6
› What Is Known About the Effects of Caregiving on Employee Health
and Medical Care Expenditures ................................................................................................... 6
Methodology ............................................................................................................8
Major Findings ......................................................................................................10
› Demographics of Employee Caregivers ..................................................................................... 10
› Health of Employed Caregivers .................................................................................................. 12
› Behavioral Risk Factors and Preventive Care............................................................................ 18
› Medical Costs of Employee Caregiving ..................................................................................... 18
› Absenteeism and Work Productivity ......................................................................................... 21
Conclusions and Implications for Employers .........................................................23
› Corporate Eldercare and Other Benefits ................................................................................... 23
› Linking Wellness to Caregiving .................................................................................................. 25
Appendix A: Detailed Methodology .......................................................................27
Appendix B: Supplementary Tables .......................................................................29
Endnotes ................................................................................................................33
Table of Contents
4
The MetLife Mature Market Institute (MMI) and the National Alliance for Caregiving (NAC) have conducted a number of studies on the impact of family caregiving on work, including Sons at Work: Balancing Employment and Eldercare (2003) and Miles Away: The MetLife Study of Long-Distance Caregiving (2004).*
They also looked at the cost to employers of absenteeism, workplace disruptions, and reduced work status of working family caregivers in The MetLife Caregiving Cost Study: Productivity Losses to U.S. Business (2006),* finding that business loses between $17.1 and $33.6 billion per year.
While the MMI and NAC joint research efforts have established unique insights into the costs of caregiving to both individuals and employers, questions remained regarding the direct relationship between caregiving, health status, and health costs.
Unanswered questions included: What, if any, health cost and health condition differences exist between employed caregivers of elderly relatives and non-caregivers? What is the cost differential for employers in terms of health care for working caregivers and other employees? What policies and programs can employers put in place to promote healthier lifestyles among caregivers that will contribute to lower health care costs?
To best address these issues, the MMI and NAC partnered with leading researchers at the University of Pittsburgh Institute on Aging and the Department of Behavioral and Community Health Sciences, building on the University’s previous research on the impact of caregiving on health and its direct access to health cost data for major national employers.
This new MetLife study—Working Caregivers and Employer Health Care Costs—is a collaborative project of the MMI, NAC, and the University of Pittsburgh, and focuses on how caregiving, employer health costs, and employer-sponsored wellness benefits intersect.
It reports on a case-study analysis of anonymous aggregate responses from 17,097 U.S. employees of a major multi-national manufacturing corporation who completed health risk assessment (HRA) questionnaires. Nearly 12% of these employees reported caregiving for an older person, and generally those caregiving employees reported poorer health and more chronic disease than non-caregivers.
The findings indicate that there is an 8% differential in increased health care costs between caregiving and non-caregiving employees, potentially costing U.S. employers an extra estimated $13.4 billion per year. Since the employees in the study are caring for the elderly, the estimates provided are conservative given that those caring for a spouse or a younger family member were not included.
Although the case study approach limits the extent to which the results can be generalized, the analysis provides the first structured approach to understanding what these eldercare-related employee health costs might be.
Key Findings› Using the average additional cost of a series of
major health conditions (such as depression, hypertension, and diabetes) reported by employees with eldercare responsibilities and non-caregiving employees, the estimated
Executive Summary
*Todownloadacopyofthesestudies,pleasevisitwww.MatureMarketInstitute.com.
5
average additional health cost to employers is 8% more for those with eldercare responsibilities. Excess medical costs reached almost 11% for blue-collar caregivers and over 18% for male caregivers.
› When extrapolated to the business sector generally, this 8% differential in health care for caregiving employees is estimated conservatively as costing U.S. employers $13.4 billion per year.
› Employees providing eldercare were more likely to report fair or poor health in general. For example, among female employees ages 50 and older, 17% of caregivers reported fair or poor health compared to 9% of non-caregivers. Among men ages 18 to 39 and women ages 40 to 49, caregivers were also marginally more likely than non-caregivers to report lower health ratings.
› Employees providing eldercare were significantly more likely to report depression, diabetes, hypertension, or pulmonary disease regardless of age, gender, and work type.
› Female employees with eldercare responsibilities reported more stress at home than non-caregivers in every age group. Stress at home appears to affect younger female caregivers most frequently. Caregivers were more likely to report negative influences of personal life on their work.
› Eldercare demands were associated with greater health risk behaviors. Smoking is higher among male caregivers, especially among younger male caregivers and white-collar caregivers relative to non-caregivers. Alcohol use is higher among blue-collar caregivers.
› Employed caregivers find it more difficult than non-caregivers to take care of their own health or participate in preventive health screenings. For example, women caregivers were less likely to report annual mammograms than non-caregivers. Employed caregivers of all ages and gender defer preventive health screenings as well.
› Employees with eldercare responsibilities were more likely to report missed days of work. This was driven by the much higher absenteeism among younger caregiving employees, ages 18 to 39. Overall, 9% of non-caregivers missed at least one day of work over the past two weeks because of health issues compared to 10% of caregivers.
› Excess employee medical care costs associated with eldercare were highest among younger employees, males, and blue-collar workers.
› Younger caregivers (ages 18 to 39) demonstrated significantly higher rates of cholesterol, hypertension, chronic obstructive pulmonary disease (COPD), depression, kidney disease, and heart disease in comparison to non-caregivers of the same age.
Often mischaracterized as an “older worker” issue, demographic trends indicate that a greater number of employees of all ages will assume the role of family caregiver with an increasingly older population. The results demonstrate a clear impact of eldercare burdens on the health issues facing employees ages 18 to 39, as much as those ages 50 and older.
Together, these results suggest that caregiving for an older relative is an important factor in the health, medical care expense, and productivity of employees across all age groups, and therefore in the health costs for employers.
Employers can serve the best interests of their employees as well as those of their corporation by anticipating and responding to the challenges of eldercare for their employees.
In combination, eldercare benefits and wellness programs can provide not only the needed support to working caregivers, but also a vehicle to directly reduce employee health care costs, with resulting bottom-line benefits to the employer.
WORKING CAREGIVERS AND EMPLOYER HEALTH CARE COSTS
66
What Is Known About the Effects of Caregiving on Employee Health and Medical Care ExpendituresMiddle-aged women, many of whom are employed, provide the majority of care to older frail, disabled, and chronically ill relatives. The increasing labor force participation of women, along with older relatives living longer but with chronic illness, raises important questions about how effectively and at what cost the roles of family caregiver and worker can be combined.
The relationship between employment and caregiving is complex. Taking on the caregiving role for an ill or disabled relative may depend on whether or not the individual is employed, how flexible his or her job is, and how intensive the demands of the caregiving are. Employed caregivers with little flexibility in their jobs who are faced with intensive caregiving needs may be less likely to take on the caregiving role, or are more likely to reluctantly leave the workforce to accommodate their caregiving demands.
The MetLife study, Sons at Work: Balancing Employment and Eldercare, showed that men
share many of the same difficulties with caregiving identified by working women. Once caregiving has started, more than six out of 10 (62%) caregivers say that they make some sort of workplace accommodation, such as going in late/leaving early, taking a leave of absence, or dropping back to part-time.
Three percent chose early retirement and 6% gave up work entirely to care for an impaired or frail older relative. Thus, the relationship of caregiving and work may operate in both directions: Being employed reduces the likelihood of being a caregiver and being a caregiver reduces the likelihood of being employed.
The 2009 National Alliance for Caregiving and AARP national caregiver survey, Caregiving in the U.S. (funded by MetLife Foundation), reports that 73% of family caregivers say that they are employed full- or part-time,1 while others suggest that this figure might be as low as 38%.2 Reconciling these differences is difficult but important. To the extent that caregiving has economic consequences for the caregiver and for businesses, it will be essential to have accurate assessments of the number of those affected.
Most research has examined the effect of caregiving on women’s participation in the workforce and especially the short- and long-term economic impacts of work. Employed caregivers seem to be able to provide care to someone for 14 hours or less per week (considered a low level of caregiving) with little impact on their ability to stay on the job. However, providing 20 hours or more per week often results in major work adjustments, such as cutting back on hours or stopping work altogether, and the decline in annual income that goes with that work adjustment.
Introduction
WORKING CAREGIVERS AND EMPLOYER HEALTH CARE COSTS 7
Women with less than a high school education are most likely to make these workplace accommodations and then lose income. These short-term effects increase the chances of longer-term negative impacts, including lower economic and health status of the caregiver. Longer-term economic impacts may in part be attributed to the difficulty of re-entering the labor force once caregiving stops.3, 4, 5
Finally, data on the cost effects of caregiving on business and industry are scarce. The primary resource on this topic is The MetLife Caregiving Cost Study: Productivity Losses to U.S. Business.6
Using caregiver prevalence estimates derived from the study, the authors estimate a cost to employers of $17.1 to $33.6 billion annually attributable to caregiving. These costs are due primarily to absenteeism ($5.1 billion), shifts from full-time to part-time work ($4.8 billion), replacing employees ($6.6 billion), and workday interruptions ($6.3 billion).
Starting in the mid-1980s, in response to myriad workplace supports for childcare, employers began to develop a similar array of workplace-based supports for corporate eldercare programs for employees.
One survey found that 20% of companies with more than 500 employees provided eldercare referral services, 15% eldercare leave, 3% emergency eldercare, and 2% subsidized eldercare, while 1% paid for eldercare or had an on-site eldercare center.7 However, utilization of these services by employees hovers around 2%.
One missing but critical element in this literature is the potential impact of health care costs of employed caregivers. While lost productivity may be considered a hidden and difficult to confirm consequence of caregiving, employee health costs are a major concern for employers and also have remained undocumented.
The well-established stresses of caregiving may lead to greater risk of chronic disease, either from the direct effects of such stress, or from the impact of caregiving (evident in poorer sleep, greater fatigue, and depression), or from less attention to one’s own health (shown in lower use of preventive care, poorer diets, or less opportunity for exercise).
Businesses not only pay for health care services, but also provide and support preventive health programs for employees and thus have a clear interest in addressing risk factors for acute and chronic disease associated with caregiving for older relatives.
In this case study, one employer’s large database of health risk appraisal (HRA) information is examined to determine if family caregivers report health consequences of caregiving. The study also examines the company’s annual expenses related to chronic disease to determine the incremental medical care costs of caregivers relative to non-caregivers.
That is, if caregivers are more likely to suffer from acute or chronic illness, for example, how much extra medical care expense can a corporation expect to pay for its employed caregivers? Also, what can employers do to help reduce health issues and therefore their costs among these employees?
8
Methodology
Data used in this case study come from a single, large corporate employer headquartered in the northeast U.S. The company is a leading manufacturer with offices and affiliates worldwide. While the company has a global reach, this study is limited to the 17,097 U.S. employees who provided data in the company’s health risk appraisal (HRA) questionnaire.
This HRA is a voluntary, anonymous questionnaire that approximately 75% of employees completed on their corporate Web site. HRA data are managed by an independent company, which developed the appraisal for a number of large corporations worldwide, and uses data to establish benchmarks for health care and occupational safety. This study limited analyses to standard HRA indicators of disease status, health behaviors, and socio-demographic indicators.
HRA data used in this analysis were collected from 17,097 employees between 2000 and 2007. The bulk of the data was provided by 12,764 employees who completed the HRA between 2005 and 2007.
The proportion of caregivers before and after 2005 did not differ; also, the association between caregiving and the prevalence of chronic disease was similar across the two time periods. For this reason, the entire set of HRA reports was analyzed.
The HRA asks, “Are you responsible for taking care of an elderly relative or friend?” Employees answering “yes” to the item were considered caregivers in this study, with approximately 12% (1,983) of the company’s U.S. employees being in this category. In addition to elderly relatives/friends, people are also caregivers of spouses, adult children and other relatives, and children with special needs.
However, the HRA does not ask specifically about these other care situations, so there are no data on the impact of caregiving for these younger relatives on those employees.
Because those caregiving employees are not included in this analysis, this study is considered to be very conservative, especially in calculating costs for overall caregiving costs to employers.
The 17,097 employees are broadly representative of the company’s U.S. workforce, both blue collar and white collar. The employees reside in 20 states and also include a substantial proportion of sales and managerial staff that travel across and outside the country. The corporation offers its employees a corporate eldercare program consisting of information and referral under the Employee Assistance Program (EAP).
WORKING CAREGIVERS AND EMPLOYER HEALTH CARE COSTS 9
The first goal of this study was to examine potential differences in the health, medical care, and work experience of caregivers and non-caregivers. Thus, the basic approach was to compare the proportion of caregivers and non-caregivers who reported particular disease conditions or health behaviors in groups defined by age, gender, and blue- or white-collar status.
The HRA includes reports of medical conditions, but is not linked to health care claims or expenses that would allow direct determination of the incremental costs associated with caregiving.
For cost estimates, the company’s claims database was also accessed, and the average annual costs of the following six major medical conditions for employees in defined age and gender groups which have significant medical cost consequences for the employer were extracted:
• Depression• Depression with cardiovascular conditions
and/or diabetes• Hypertension• Severe cardiovascular conditions (hypertension
and/or coronary artery disease)• Diabetes• Other medical conditions
(These six conditions were selected to capture highly prevalent diseases across a spectrum of physical and mental health conditions.)
Thus, the study assessed the cost of depression alone as well as depression plus other diseases such as cardiovascular conditions and diabetes. Both a mild and a more severe level of cardiovascular disease were examined. The study included diabetes because of its growing importance and relationship to behavioral intervention factors, such as diet and exercise. Finally, health care costs among the rest of the employees with none of these conditions, but who incurred expenses for any other medical condition, were also examined.
The HRA also included measures of absenteeism and “presenteeism,” or the employee’s self-perceived less-than-optimal performance on the job. Presenteeism was assessed using the Work Limitations Questionnaire and its particular subscales.8 Average scores for the measures among caregivers and non-caregivers were examined.
In addition to the employee health data, confidential structured interviews were conducted among caregivers who voluntarily agreed to provide additional information, personal perspectives, and insights about their caregiving experiences and the resulting impact in their work setting.
Detailed methodology on the differential health care cost estimates for caregiving employees is presented in Appendix A.
10
Major Findings
Demographics of Employee Caregivers
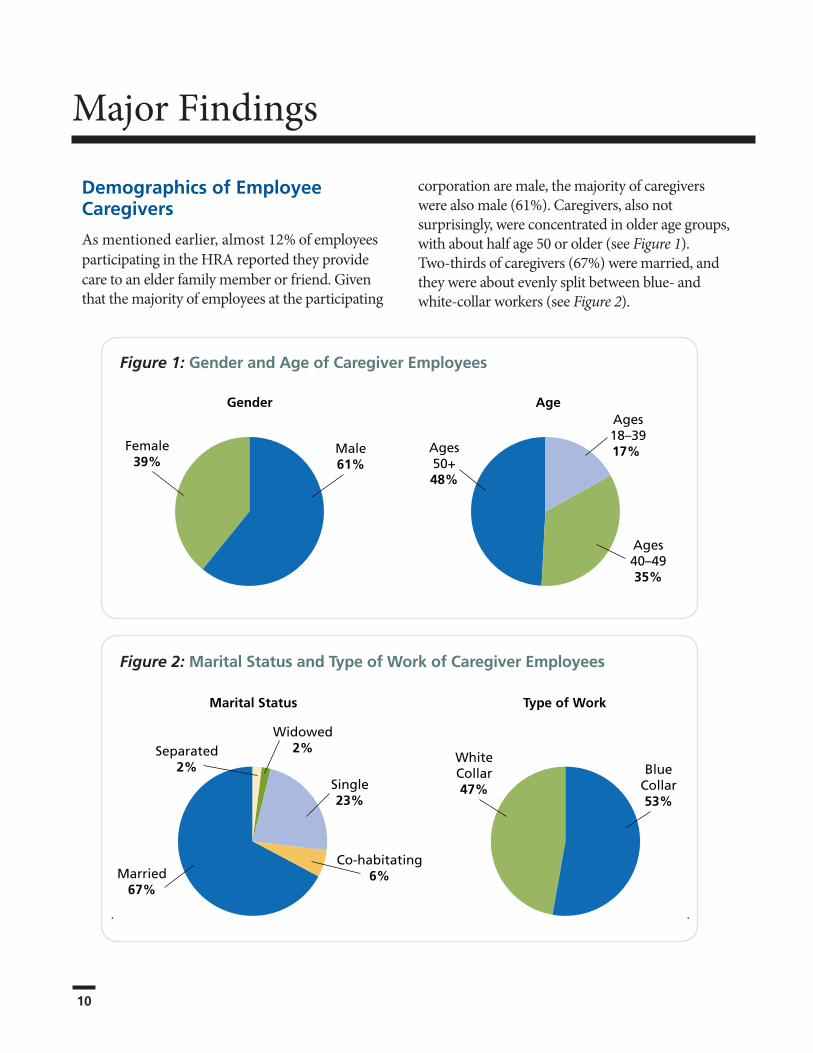
As mentioned earlier, almost 12% of employees participating in the HRA reported they provide care to an elder family member or friend. Given that the majority of employees at the participating
corporation are male, the majority of caregivers were also male (61%). Caregivers, also not surprisingly, were concentrated in older age groups, with about half age 50 or older (see Figure 1). Two-thirds of caregivers (67%) were married, and they were about evenly split between blue- and white-collar workers (see Figure 2).
Figure 2: Marital Status and Type of Work of Caregiver Employees
Figure 1: Gender and Age of Caregiver Employees
Gender AgeAges18–3917%
Ages40–4935%
Ages50+48%
Female39%
Male61%
Marital Status Type of Work
Married67%
Separated2%
Widowed2%
Single23%
Co-habitating6%
WhiteCollar47%
BlueCollar53%
11
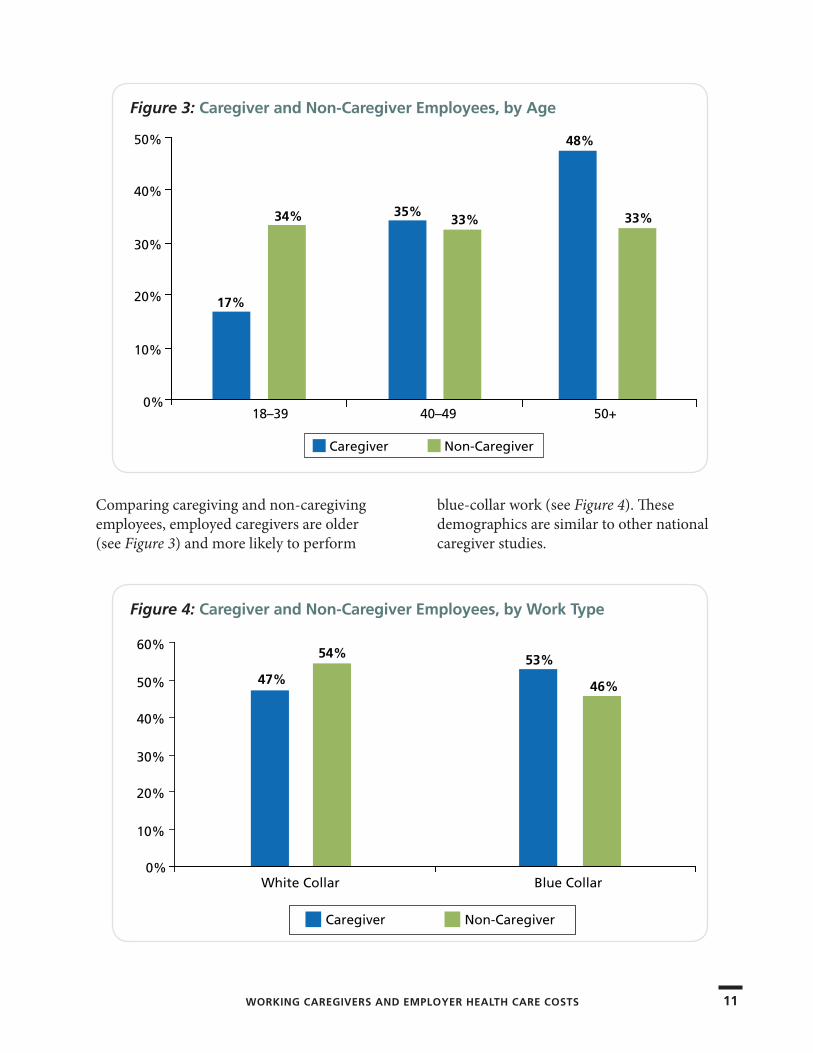
Comparing caregiving and non-caregiving employees, employed caregivers are older (see Figure 3) and more likely to perform
blue-collar work (see Figure 4). These demographics are similar to other national caregiver studies.
Figure 3: Caregiver and Non-Caregiver Employees, by Age
17%
34% 35%33%
48%
33%
18–39 40–49 50+
Caregiver Non-Caregiver
0%
10%
20%
30%
40%
50%
Figure 4: Caregiver and Non-Caregiver Employees, by Work Type
47%
54% 53%
46%
White Collar Blue Collar
Caregiver Non-Caregiver
0%
10%
20%
30%
40%
50%
60%
WORKING CAREGIVERS AND EMPLOYER HEALTH CARE COSTS
12
Major Findings
Health of Employed CaregiversSelf-Reported HealthOne important indicator of health is one’s own assessment of it: Is my health excellent, very good, good, fair, or poor? This measure is asked annually by the Centers for Disease Control (CDC) in its national survey of the U.S. population and has been shown to be a good predictor of the onset of illness and disability. In the CDC national survey, about 9% of the population reports health as only fair or poor. Employed caregivers in this study were more likely to rate their health as “fair or poor,” but this difference was significant only among white-collar workers, where 13% of caregivers said that their health was fair or poor versus 9% of non-caregivers.
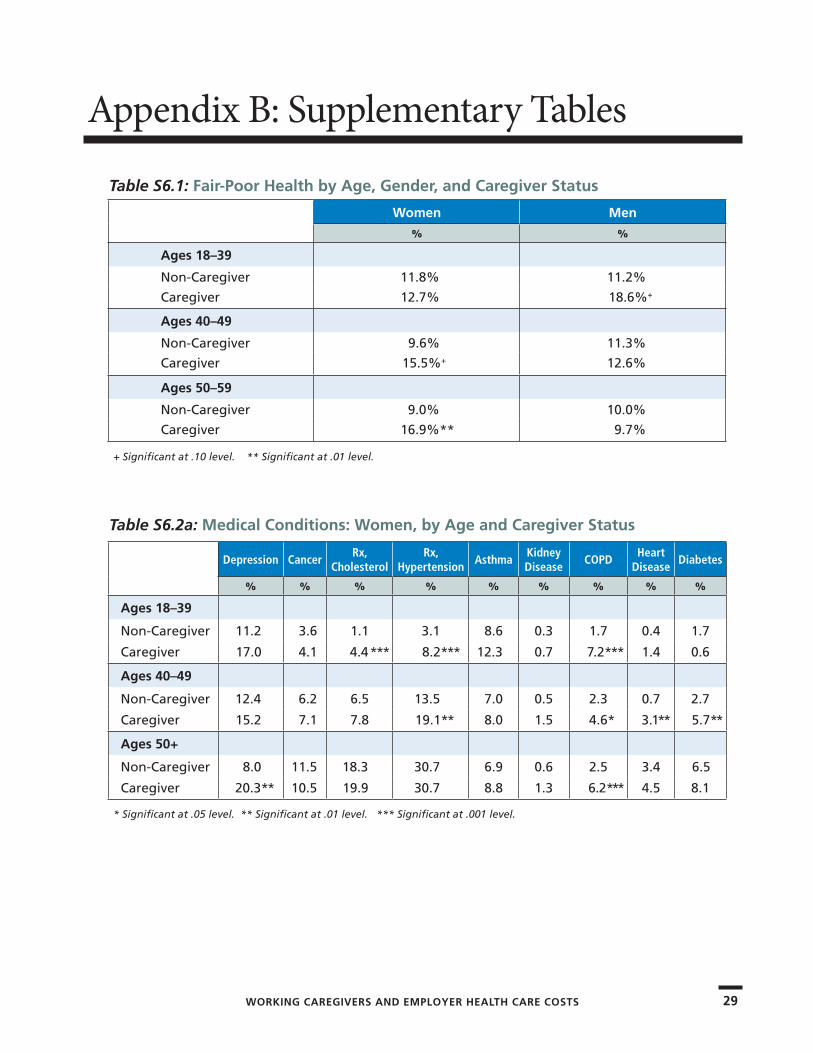
When age and gender were more closely examined, it was found that women have a greater risk of reporting “fair or poor health,” and particularly older women ages 50+ (see Table S6.1 in Appendix B). Among women ages 50+, 17% of caregivers reported fair or poor health compared to 9% among non-caregivers. Younger male employees and female employees ages 40 to 49 also reported lower health scores. These figures are precisely the same for this self-reported health question in
Caregiving in the U.S., the national caregiver survey conducted by the National Alliance for Caregiving in collaboration with AARP (funded by MetLife Foundation).
Key Medical ConditionsEmployees were asked in the HRA if a physician had ever told them they had any one of the following diseases: depression, cancer, high cholesterol that required prescription medication, hypertension requiring prescription medication, asthma, kidney disease, chronic bronchitis or emphysema (COPD), heart disease, or diabetes. The total number of respondents reporting on these conditions varies. The research team considered reports of moderate or severe symptoms to indicate possible depression. For depression, 3,311 employees also completed a full depression symptoms inventory. For the other conditions, all reports involved nearly 15,000 respondents or more. Supplementary tables in Appendix B provide detailed data about key medical conditions, incidence among employee subgroups, and excess medical costs.
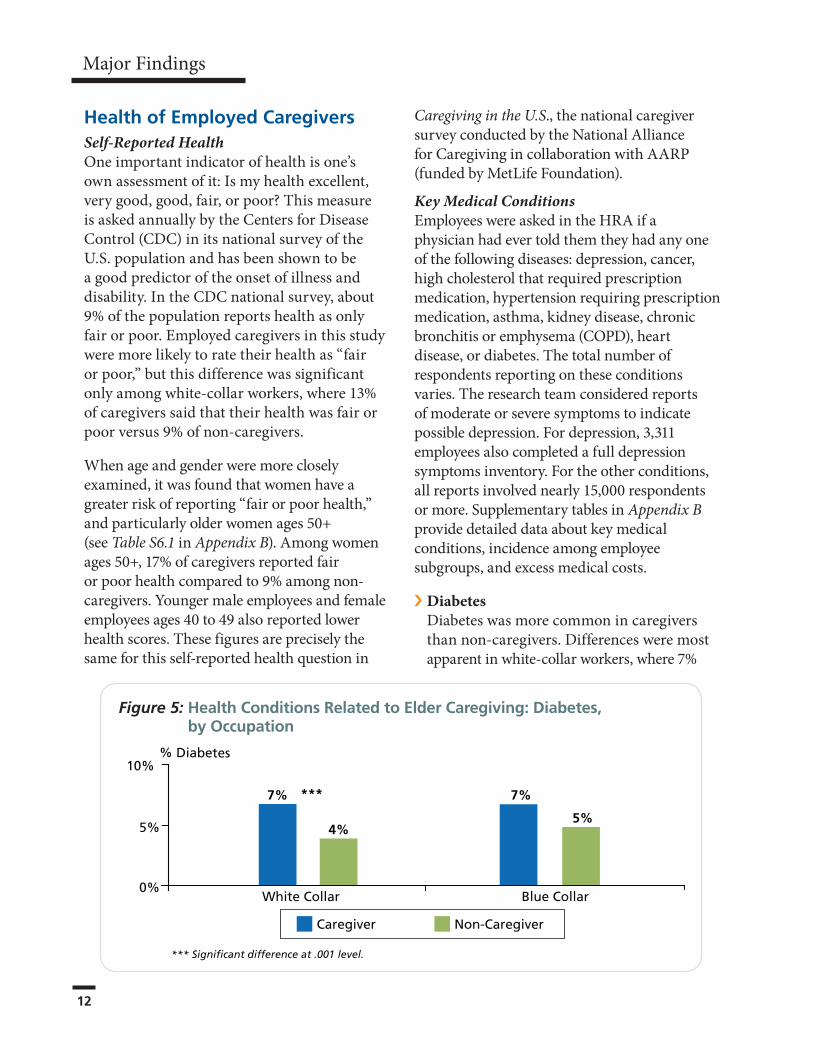
› �DiabetesDiabetes was more common in caregivers than non-caregivers. Differences were most apparent in white-collar workers, where 7%
Figure 5: Health Conditions Related to Elder Caregiving: Diabetes, by Occupation
% Diabetes
7%
4%
7%
5%
White Collar Blue Collar
***
*** Significant difference at .001 level.
0%
5%
10%
Caregiver Non-Caregiver
WORKING CAREGIVERS AND EMPLOYER HEALTH CARE COSTS 13
of caregivers reported diabetes compared to 4% of non-caregivers (see Figure 5 on the previous page). Both men and women caregiving employees ages 40 to 49 were more likely to have diabetes than non-caregivers in the same age group (see Figure 6). Among women in this age group, 6% of caregivers reported diabetes compared to 3% of non-caregivers. Among men, the prevalence was 7% versus 4%, respectively.
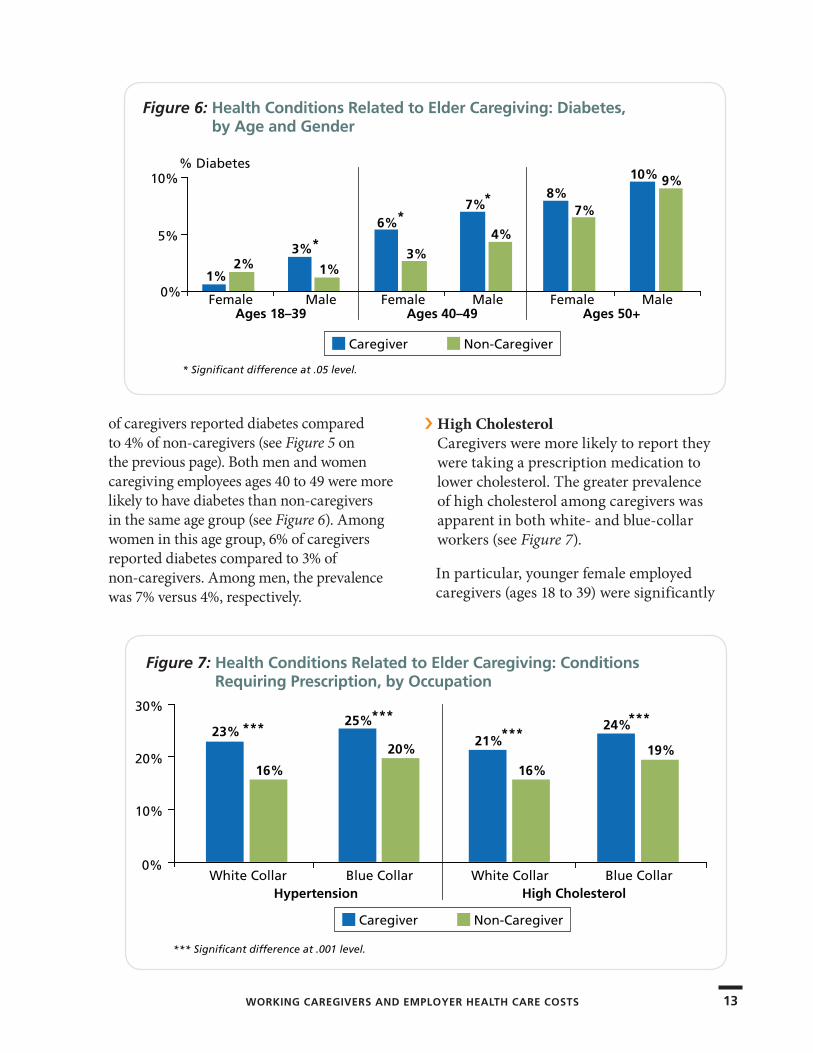
› High CholesterolCaregivers were more likely to report they were taking a prescription medication to lower cholesterol. The greater prevalence of high cholesterol among caregivers was apparent in both white- and blue-collar workers (see Figure 7).
In particular, younger female employed caregivers (ages 18 to 39) were significantly
Figure 6: Health Conditions Related to Elder Caregiving: Diabetes, by Age and Gender
* Significant difference at .05 level.
Ages 18–39 Ages 40–49 Ages 50+
1%2%
3%
1%
6%
3%
7%
4%
8%7%
10% 9%
Female Male Female Male Female Male
*
% Diabetes
Caregiver Non-Caregiver
0%
5%
10%
*
*
Figure 7: Health Conditions Related to Elder Caregiving: Conditions Requiring Prescription, by Occupation
23%
16%
25%
20%21%
16%
24%
19%
White Collar Blue Collar White Collar Blue CollarHypertension High Cholesterol
***
Caregiver Non-Caregiver
*** Significant difference at .001 level.
0%
10%
20%
30%***
******
14
Major Findings
more likely to be prescribed a cholesterol-lowering drug: 4% of caregivers were taking such a medication compared to only 1% in non-caregivers.
› Hypertension Figure 7 on the previous page shows that the same pattern holds true for prescription medication to control blood pressure, a proxy for diagnosed hypertension. Caregivers among men and women in the younger employee age groups were more likely to be taking anti-hypertensive medication. For example, among female employees ages 40 to 49, 19% of women caregivers were taking prescription medication for hypertension versus 14% in non-caregivers. For men, the proportions were 22% and 16%, respectively.
› Pulmonary Disease (COPD)Chronic bronchitis and emphysema are part of the group of diseases comprising chronic obstructive pulmonary disease (COPD). Among female employees, caregivers faced an increased risk of COPD in each age group: 7% versus 2% in employees ages 18 to 39, 5% versus 2% in employees ages 40 to 49, and 6% versus 3% in employees ages 50+. Among both blue- and white-collar workers, the risk of COPD was considerably higher
among caregivers (4% versus 1% in white collar, and 4% versus 2% in blue collar).
› Heart DiseaseHeart disease was more common in caregivers. Among male employees, for example, 6% of caregivers ages 40 to 49 reported the condition compared to 2% in non-caregivers. For women employees in the same age group, 3% of caregivers reported heart disease compared to 1% of non-caregivers.
› CancerCaregivers and non-caregivers did not differ in reports of cancer. As in the other medical conditions, the prevalence increased with increasing age, ranging from 3%-4% in people ages 18 to 39, to 10%-11% in people ages 50+.
› Kidney DiseaseMen who reported they were caregivers were more likely to report kidney disease: 1% versus less than 1% in the 18 to 39 age group, 1% versus less than 1% in the group ages 50+.
› DepressionSymptoms severe enough to indicate possible depression were more common in caregivers. The pattern differed among men and women. Caregiving among older women was strongly associated with risk of depression: among women ages 50+, 20% of caregivers reported moderate or worse symptoms compared to only 8% among non-caregivers. For male employees, the strongest effect was among younger men: among men ages 18 to 39, 26% of caregivers reported moderate or severe symptoms compared to 8% among non-caregivers. Symptoms of depression related to caregiving were more significant among white-collar workers (8% of caregivers versus 5% of non-caregivers).
15
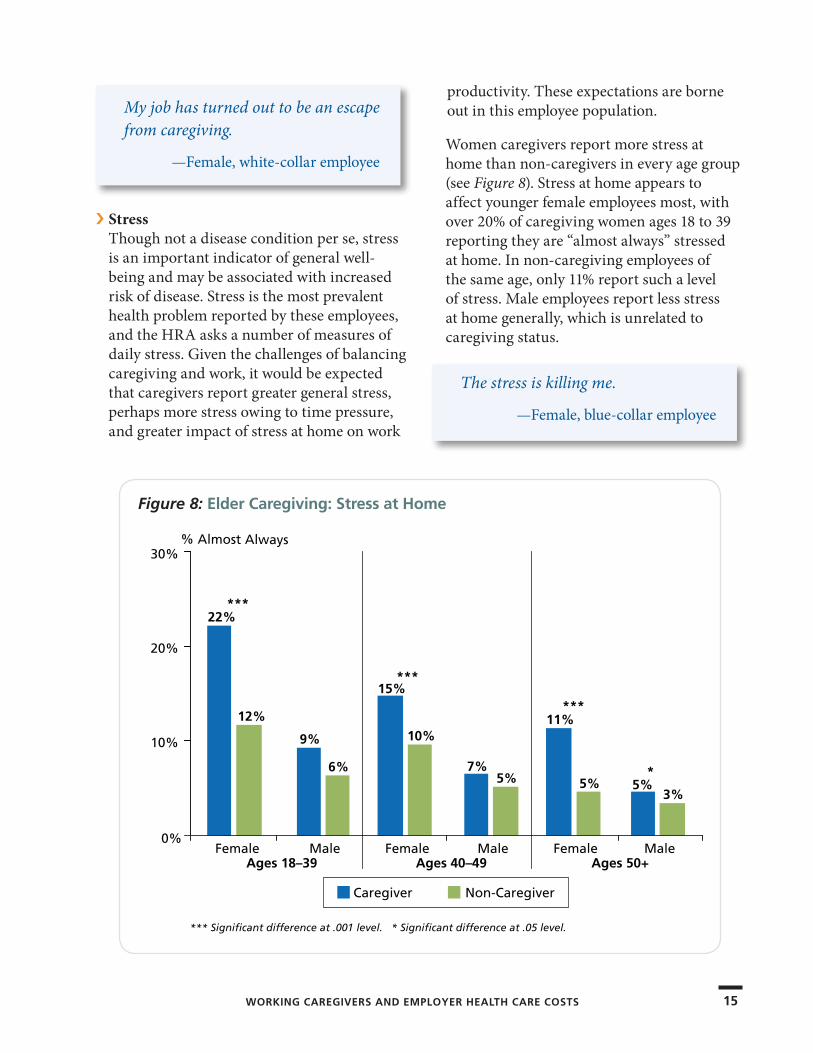
› StressThough not a disease condition per se, stress is an important indicator of general well-being and may be associated with increased risk of disease. Stress is the most prevalent health problem reported by these employees, and the HRA asks a number of measures of daily stress. Given the challenges of balancing caregiving and work, it would be expected that caregivers report greater general stress, perhaps more stress owing to time pressure, and greater impact of stress at home on work
productivity. These expectations are borne out in this employee population.
Women caregivers report more stress at home than non-caregivers in every age group (see Figure 8). Stress at home appears to affect younger female employees most, with over 20% of caregiving women ages 18 to 39 reporting they are “almost always” stressed at home. In non-caregiving employees of the same age, only 11% report such a level of stress. Male employees report less stress at home generally, which is unrelated to caregiving status.
My job has turned out to be an escape from caregiving.
—Female, white-collar employee
The stress is killing me.
—Female, blue-collar employee
Figure 8: Elder Caregiving: Stress at Home
22%
12%
9%
6%
15%
10%
7%5%
11%
5% 5%3%
Female Male Female Male Female MaleAges 18–39 Ages 40–49 Ages 50+
***
***
***
*** Significant difference at .001 level. * Significant difference at .05 level.
*
Caregiver Non-Caregiver
% Almost Always
0%
10%
20%
30%
WORKING CAREGIVERS AND EMPLOYER HEALTH CARE COSTS
16
Major Findings
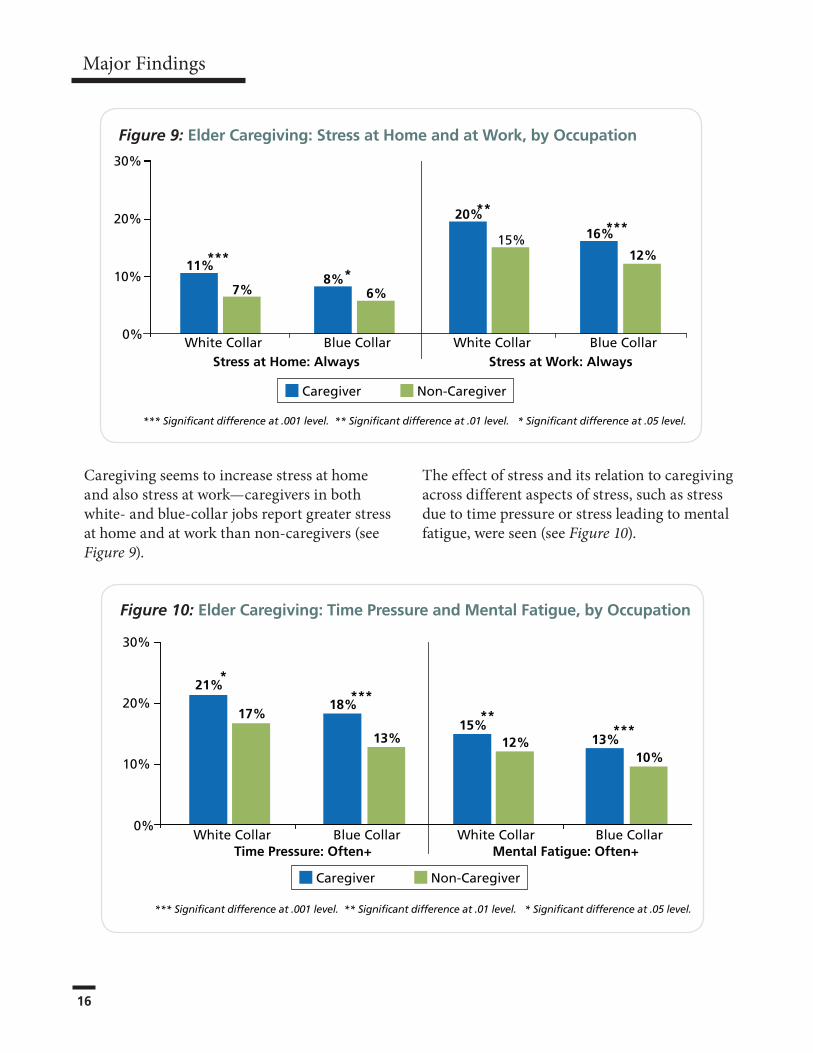
Caregiving seems to increase stress at home and also stress at work—caregivers in both white- and blue-collar jobs report greater stress at home and at work than non-caregivers (see Figure 9).
The effect of stress and its relation to caregiving across different aspects of stress, such as stress due to time pressure or stress leading to mental fatigue, were seen (see Figure 10).
Figure 10: Elder Caregiving: Time Pressure and Mental Fatigue, by Occupation
Caregiver Non-Caregiver
21%
17%18%
13%
White Collar Blue Collar
15%12% 13%
10%
White Collar Blue CollarTime Pressure: Often+ Mental Fatigue: Often+
*
*****
***
0%
10%
20%
30%
*** Significant difference at .001 level. ** Significant difference at .01 level. * Significant difference at .05 level.
Figure 9: Elder Caregiving: Stress at Home and at Work, by Occupation
Caregiver Non-Caregiver
11%
7%8%
6%
20%
15% 16%
12%
White Collar Blue Collar White Collar Blue CollarStress at Home: Always Stress at Work: Always
****
*****
*** Significant difference at .001 level. ** Significant difference at .01 level. * Significant difference at .05 level.
0%
10%
20%
30%
WORKING CAREGIVERS AND EMPLOYER HEALTH CARE COSTS 17
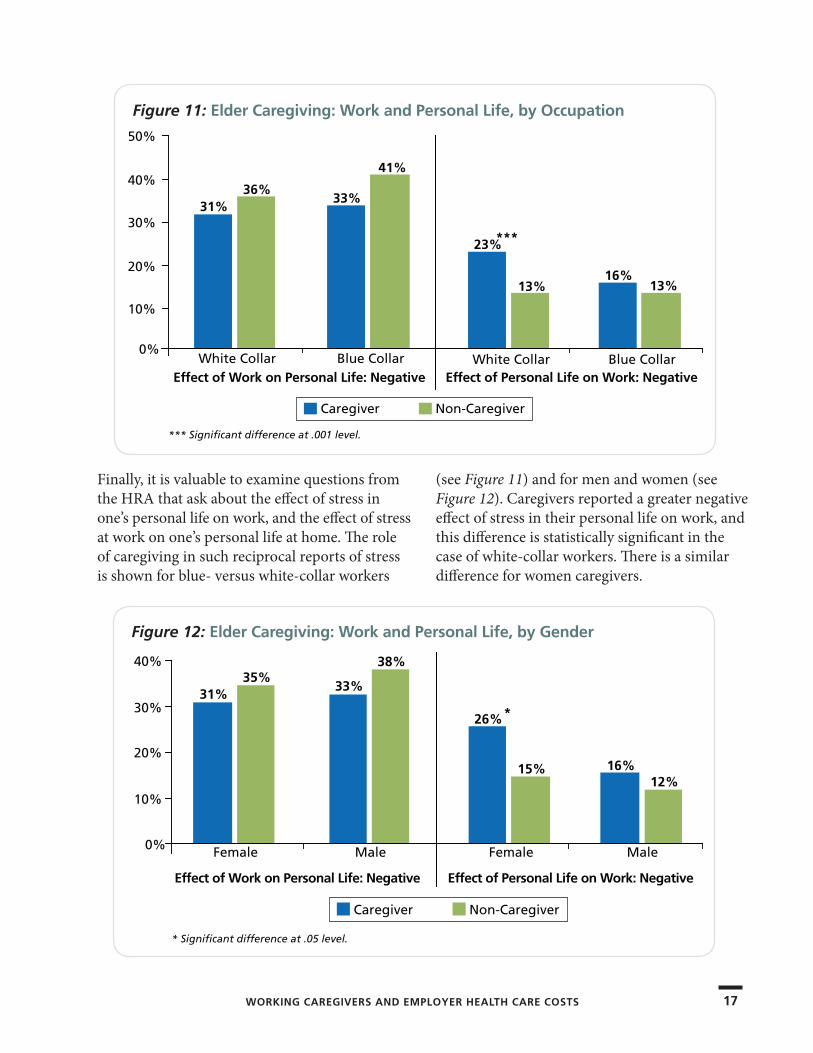
Finally, it is valuable to examine questions from the HRA that ask about the effect of stress in one’s personal life on work, and the effect of stress at work on one’s personal life at home. The role of caregiving in such reciprocal reports of stress is shown for blue- versus white-collar workers
(see Figure 11) and for men and women (see Figure 12). Caregivers reported a greater negative effect of stress in their personal life on work, and this difference is statistically significant in the case of white-collar workers. There is a similar difference for women caregivers.
Figure 12: Elder Caregiving: Work and Personal Life, by Gender
Caregiver Non-Caregiver
* Significant difference at .05 level.
31%35%
33%
38%
Female Male
26%
15% 16%12%
Female Male
Effect of Work on Personal Life: Negative Effect of Personal Life on Work: Negative
*
0%
10%
20%
30%
40%
Figure 11: Elder Caregiving: Work and Personal Life, by Occupation
Caregiver Non-Caregiver
*** Significant difference at .001 level.
31%36%
33%
41%
White Collar Blue Collar
23%
13%16%
13%
White Collar Blue CollarEffect of Work on Personal Life: Negative Effect of Personal Life on Work: Negative
***
0%
10%
20%
30%
40%
50%
18
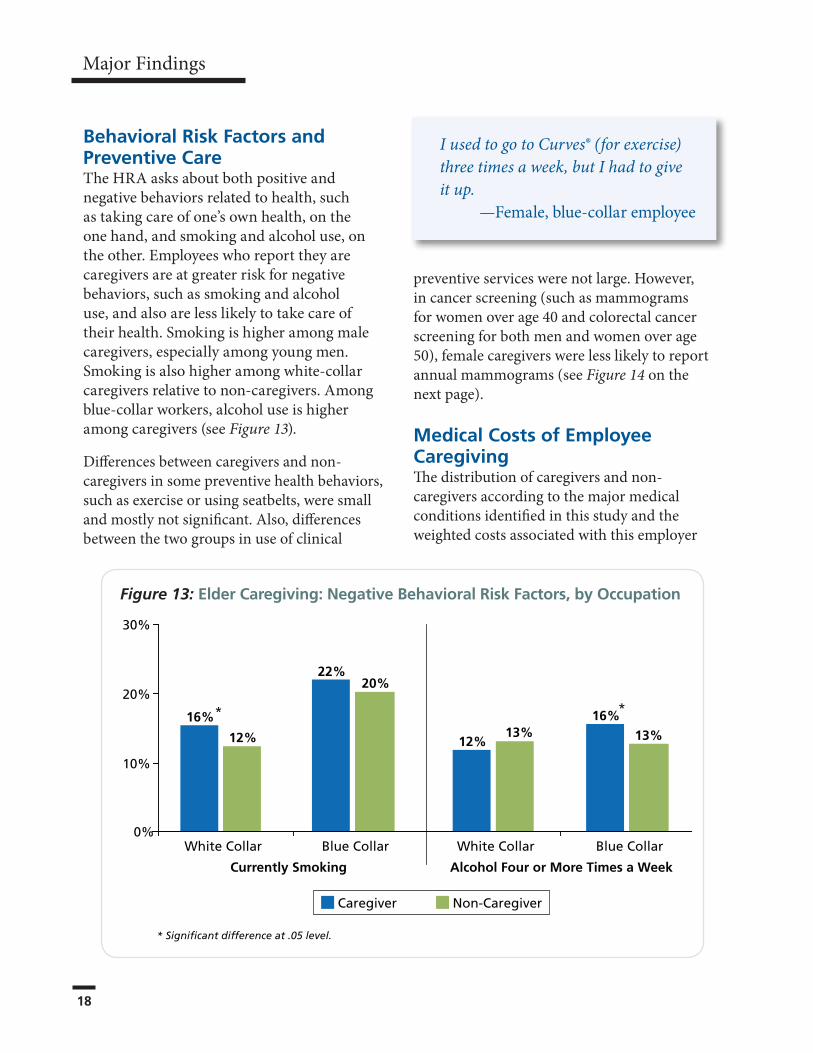
Behavioral Risk Factors and Preventive Care The HRA asks about both positive and negative behaviors related to health, such as taking care of one’s own health, on the one hand, and smoking and alcohol use, on the other. Employees who report they are caregivers are at greater risk for negative behaviors, such as smoking and alcohol use, and also are less likely to take care of their health. Smoking is higher among male caregivers, especially among young men. Smoking is also higher among white-collar caregivers relative to non-caregivers. Among blue-collar workers, alcohol use is higher among caregivers (see Figure 13).
Differences between caregivers and non-caregivers in some preventive health behaviors, such as exercise or using seatbelts, were small and mostly not significant. Also, differences between the two groups in use of clinical
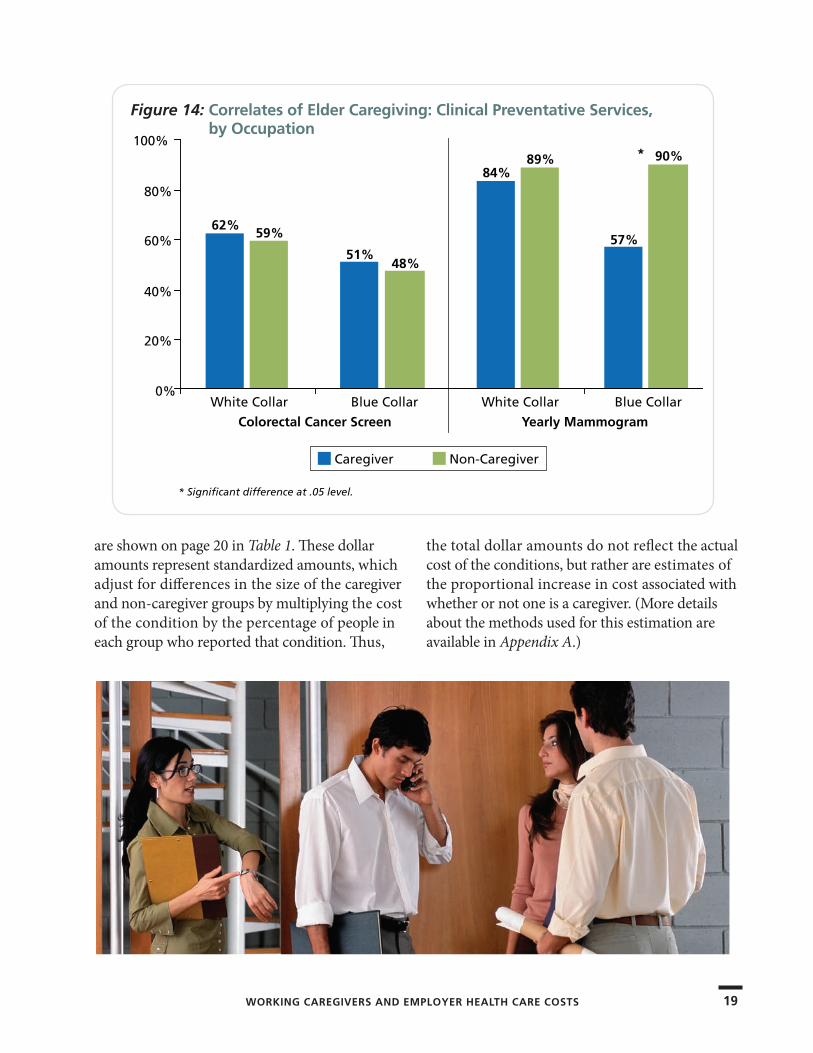
preventive services were not large. However, in cancer screening (such as mammograms for women over age 40 and colorectal cancer screening for both men and women over age 50), female caregivers were less likely to report annual mammograms (see Figure 14 on the next page).
Medical Costs of Employee CaregivingThe distribution of caregivers and non-caregivers according to the major medical conditions identified in this study and the weighted costs associated with this employer
Major Findings
Figure 13: Elder Caregiving: Negative Behavioral Risk Factors, by Occupation
12%13%
16%
13%
22%20%
16%
12%
Caregiver Non-Caregiver
* Significant difference at .05 level.
White Collar Blue Collar
Currently Smoking Alcohol Four or More Times a Week
White Collar Blue Collar
*
0%
10%
20%
30%
*
I used to go to Curves® (for exercise) three times a week, but I had to give it up.
—Female, blue-collar employee
WORKING CAREGIVERS AND EMPLOYER HEALTH CARE COSTS 19
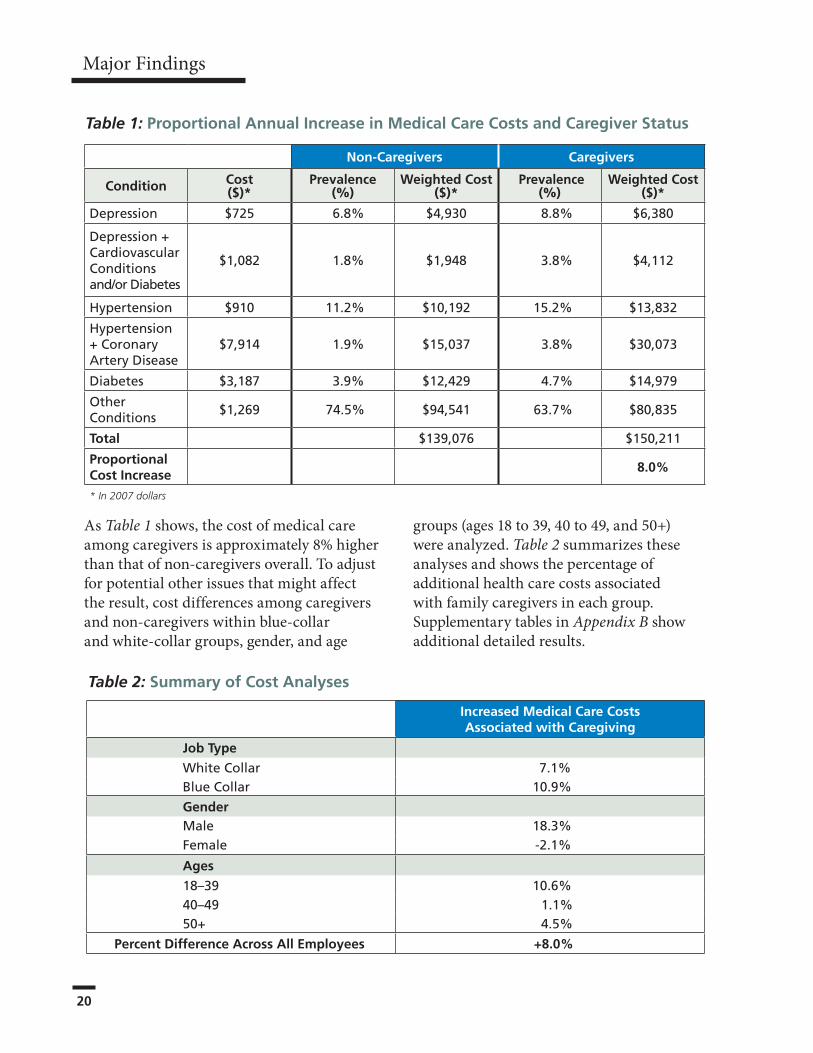
are shown on page 20 in Table 1. These dollar amounts represent standardized amounts, which adjust for differences in the size of the caregiver and non-caregiver groups by multiplying the cost of the condition by the percentage of people in each group who reported that condition. Thus,
the total dollar amounts do not reflect the actual cost of the conditions, but rather are estimates of the proportional increase in cost associated with whether or not one is a caregiver. (More details about the methods used for this estimation are available in Appendix A.)
Figure 14: Correlates of Elder Caregiving: Clinical Preventative Services, by Occupation
Caregiver Non-Caregiver
* Significant difference at .05 level.
62%59%
51%48%
White Collar Blue Collar
84%89%
57%
90%
White Collar Blue Collar
Colorectal Cancer Screen Yearly Mammogram
*
0%
20%
40%
60%
80%
100%
20
Major Findings
Table 1: Proportional Annual Increase in Medical Care Costs and Caregiver Status
Non-Caregivers Caregivers
Condition Cost ($)*
Prevalence (%)
Weighted Cost ($)*
Prevalence (%)
Weighted Cost ($)*
Depression $725 6.8% $4,930 8.8% $6,380
Depression+CardiovascularConditionsand/orDiabetes
$1,082 1.8% $1,948 3.8% $4,112
Hypertension $910 11.2% $10,192 15.2% $13,832
Hypertension+CoronaryArteryDisease
$7,914 1.9% $15,037 3.8% $30,073
Diabetes $3,187 3.9% $12,429 4.7% $14,979
OtherConditions
$1,269 74.5% $94,541 63.7% $80,835
Total $139,076 $150,211
Proportional Cost Increase
8.0%
* In 2007 dollars
As Table 1 shows, the cost of medical care among caregivers is approximately 8% higher than that of non-caregivers overall. To adjust for potential other issues that might affect the result, cost differences among caregivers and non-caregivers within blue-collar and white-collar groups, gender, and age
groups (ages 18 to 39, 40 to 49, and 50+) were analyzed. Table 2 summarizes these analyses and shows the percentage of additional health care costs associated with family caregivers in each group. Supplementary tables in Appendix B show additional detailed results.
Increased Medical Care Costs Associated with Caregiving
Job Type
WhiteCollar 7.1%BlueCollar 10.9%
GenderMale 18.3%Female -2.1%
Ages
18–39 10.6%40–49 1.1%50+ 4.5%
Percent Difference Across All Employees +8.0%
Table 2: Summary of Cost Analyses
WORKING CAREGIVERS AND EMPLOYER HEALTH CARE COSTS 21
As Table 2 shows, the increased medical care costs associated with caregiving are consistent across job type and age, and partly consistent across gender. Caregiving is associated with the greatest increase in medical care costs among male, blue-collar, and younger employees.
Among female employees, caregivers did not incur greater costs than non-caregivers; in fact, their costs were 2% lower. This difference may reflect the choice of medical conditions that were tracked (see Table S7.4 in Appendix B), or the possibility that women with health problems and caregiving responsibilities are more likely to leave the labor force.
Absenteeism and Work ProductivityThe HRA also contains measures of the ability to focus and perform while at work (presenteeism) and absenteeism. Employees report on work productivity by answering 25 questions from the Work Limitations Questionnaire (WLQ), such as:
› In the past two weeks, how much of the time did your physical health or emotional problems make it difficult for you to start on your job as soon as you arrived or do your work without stopping to take breaks or rest?
› In the past two weeks, how much of the time were you able to lift, carry, or move objects weighing more than 10 pounds, without difficulty caused by physical health or emotional problems?
› In the past two weeks, how much of the time were you able to sit, stand, or stay in one position longer than 15 minutes while working, without difficulty caused by physical health or emotional problems?
The research team examined responses to individual questions and an analysis in the WLQ that assessed employees’ perceptions of their efficiency in interpersonal relations, time management, and physical and output demands of work.
As part of the WLQ, employees also reported how many full- or part-time days of work they missed in the past two weeks as a result of “health conditions or medical care.”
Statistical models adjusted for differences in age, gender, and blue-collar and white-collar jobs, and then were used to compare caregivers versus non-caregivers. The results should be interpreted in light of the fact that the Work Limitations Index was optional in the HRA and only 1,675 to 1,741 employees completed these questions.
It’s sort of like “don’t ask, don’t tell.” My supervisor knows why I come in late (because of caregiving for my mother). But he doesn’t ask and I don’t tell.
—Female, white-collar employee
I use a lot of my vacation time and sick days caring for them, plus all the time for phone calls from the office.
—Female, white-collar employee
I don’t know where to cut back—on caregiving, on my job, or on the rest of my family?
—Male, blue-collar employee
22
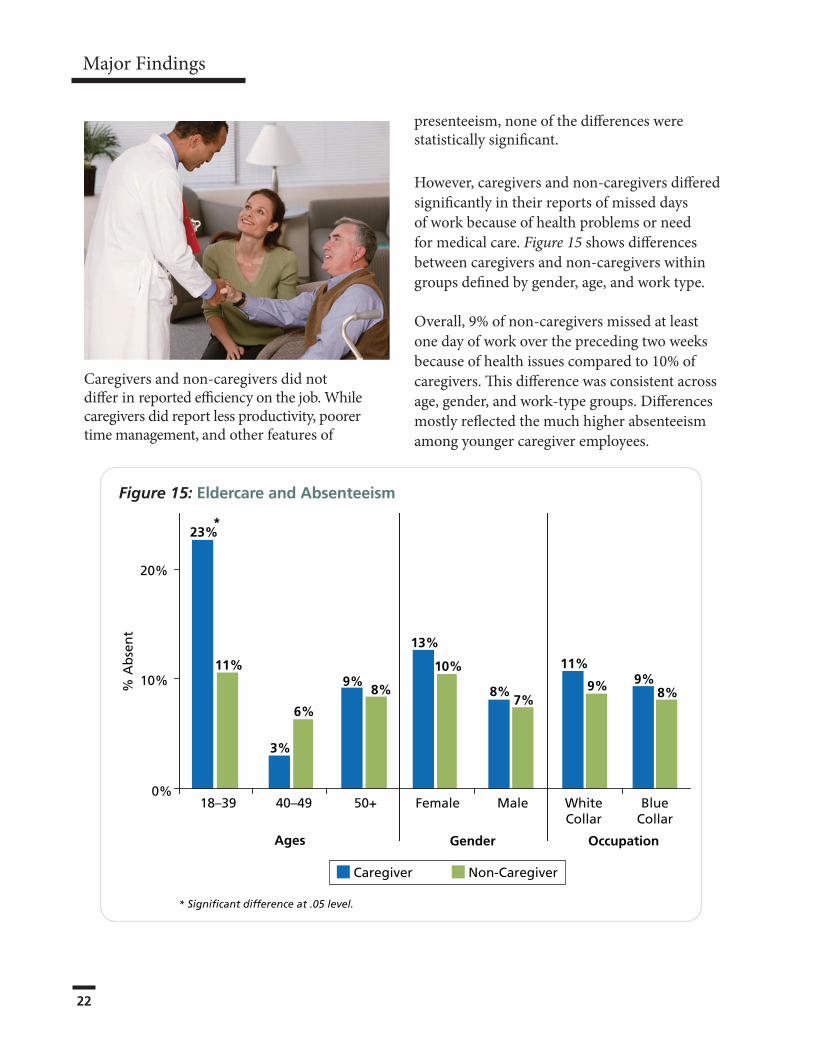
Caregivers and non-caregivers did not differ in reported efficiency on the job. While caregivers did report less productivity, poorer time management, and other features of
presenteeism, none of the differences were statistically significant.
However, caregivers and non-caregivers differed significantly in their reports of missed days of work because of health problems or need for medical care. Figure 15 shows differences between caregivers and non-caregivers within groups defined by gender, age, and work type.
Overall, 9% of non-caregivers missed at least one day of work over the preceding two weeks because of health issues compared to 10% of caregivers. This difference was consistent across age, gender, and work-type groups. Differences mostly reflected the much higher absenteeism among younger caregiver employees.
Major Findings
Figure 15: Eldercare and Absenteeism
Caregiver Non-Caregiver
* Significant difference at .05 level.
% A
bse
nt
23%
11%
3%
6%
9%8%
13%
10%
8%7%
11%
9% 9%8%
18–39 40–49 50+ Female Male WhiteCollar
BlueCollar
Ages Gender Occupation
*
0%
10%
20%
WORKING CAREGIVERS AND EMPLOYER HEALTH CARE COSTS 23WORKING CAREGIVERS AND EMPLOYER HEALTH CARE COSTS 23
The results of this study provide employers, especially large employers, with rather startling news about the health issues of caregivers to older relatives and family caregivers in general in their employ.
Traditionally, employers have focused only on corporate eldercare service benefits as their main response to the employee caregiver challenge. This study points out that an integration of eldercare services and wellness initiatives may open up new avenues of innovation to benefit both the employee and the employer.
In just the few major health conditions that were analyzed in this study—depression, diabetes, cholesterol, hypertension, COPD, heart disease, kidney disease, and stress—many family caregivers had significantly higher levels of risk. In addition, some caregivers had higher levels of risky behaviors, such as smoking, while others—perhaps because of the burden of work and family responsibilities and the lack
of time—tended to neglect their own health by not taking advantage of preventive measures, such as mammograms and other cancer screenings.
As a result, the study indicates that employers are conservatively paying 8% more for the health
care of employees throughout the spectrum of age, gender, and type of work who care for elderly relatives. The research, in combination with previous MetLife studies, also clearly expands the insights about the true—but often hidden—costs of caregiving, since there is now evidence of direct health care costs as well as indirect lost productivity implications.
Corporate Eldercare and Other BenefitsStarting in the mid-1980s, many large corporations began offering corporate eldercare programs to their employees to help them deal with working as well as caring for their aging parents or other relatives. The concept of these programs— adapted from childcare programs—was to answer questions and provide information to employees via 800-numbers or Employee Assistance Programs (EAPs) and then refer them to local eldercare resources in the community.
Conclusions and Implications for Employers
Many large
corporations offer
a geriatric care
management service
to their employees,
which is used mostly
by caregivers with
especially complex
caregiving situations,
such as long-distance
caregiving.
24
Conclusions and Implications for Employers
Corporations like IBM and AT&T were in the forefront of these programs. At the high point in 2006, 26% of corporations had an eldercare referral service, according to the Society for Human Resource Management
(SHRM).9 That percentage dropped to only 11% by 2009 (childcare programs experienced a similar decrease between 2008 and 2009).
Our case study company is one of the organizations that continues to offer information and referral to caregiving employees through its EAP.
Other eldercare programs include caregiver fairs, line supervisor training, lunchtime seminars, flextime and shared work, and dependent care accounts. About 1% of corporations offer the services of a geriatric care manager to conduct an in-home assessment, develop a care plan, and spend a small number of free professional hours (usually one to three hours) to put into place the services the older person needs.
After this, the employee usually can contract for more hours if needed, at a reduced rate. Approximately 1% of companies offer access to back-up eldercare services in case an arranged service does not show up and the employee has to go to work. GlaxoSmithKline is an example of one such company offering this service. In 1992, the Federal Family and Medical Leave Act was enacted requiring companies with more than 50 employees to offer 12 weeks of unpaid
leave to employees who need to care for sick children, parents, spouses, or themselves.
According to SHRM’s 2009 Employee Benefits Report, 25% of organizations also offer some paid family leave, and 11% offer eldercare unpaid leave above the 12 weeks the FMLA law requires. Thirty-one percent of companies also offer paid personal leave days separate from vacation and sick leave.
Other programs, identified in MetLife’s Employee Benefits Trends Study (EBTS),10 that can help employees achieve work/life balance and boost employee productivity include:
› Paid Time Off (PTO) Programs: A PTO program can replace traditionally distinct programs (i.e., vacation, sick, and personal days) with a single block of time that gives employees more control over their time. Additionally, PTO programs encourage responsible time management and give employees the flexibility to take time off when they need it—not because they need to “use it or lose it.”
› Telecommuting Arrangements: Helping employees successfully juggle between work and home can help address productivity, loyalty, and retention. Giving employees the flexibility to choose where they work can allow them to be fully engaged in their work without the pressure to leave the office at a certain time to fulfill their “life” duties.
› Flexible Schedules: In many industries, a 9-to-5 schedule is not necessary to keep the business running and customers happy. In these cases, allowing employees to work a schedule that is convenient for them, as long as the work is done on time, is a great way to help employees balance work and life.
To help employees
deal with their
caregiving situations,
companies like
Intel and Nike offer
a six-week skill-
building course called
“Powerful Tools for
Caregivers.”
WORKING CAREGIVERS AND EMPLOYER HEALTH CARE COSTS 25
Through their human resources departments, many small- to mid-sized companies refer employees to the Eldercare Locator, a federally funded toll-free number (1-800-677-1116) that connects caregivers with local resources (also check their Website at http://www.eldercare.gov/Eldercare.NET/Public/Home.aspx). Every county or multi-county area in the country has an Area Agency on Aging which receives federal funding to provide information and referral to family caregivers on aging and caregiving services. The area agency can be reached through the Eldercare Locator number.
Through the 1994 National Family Caregiver Support Program, the Area Agency on Aging (http://www.agingcarefl.org/caregiver/NationalSupport) provides respite services—to give caregivers a break, plus counseling, and other individualized services to help caregivers.
The Center for Medicare Services (CMS), the federal agency that oversees Medicare for those 65+, has published When Employees Become Caregivers, a guide for human resource managers of small- and mid-sized companies that offers no-cost to low-cost eldercare ideas.
For example, it includes an outline for a one-hour training program for line supervisors on the basic issues of working caregivers and how smaller employers can support them. The guide is available at www.Medicare.gov.
Linking Wellness to CaregivingWellness programs have risen in prominence as an employee benefit because they promise to help hold down health care costs. A Web survey reveals that the corporate wellness industry is itself split on whether such programs are meant primarily to save costs (40%) or to increase worker productivity (38%).11 But certainly, when used in sufficient numbers by employees, wellness programs can
improve general employee health and reduce health care costs.
Because this study shows a link between family caregiving and health care costs, corporate wellness programs should also be linked to
corporate eldercare. For example, where stress can clearly be an issue for caregivers trying to juggle work and family, wellness programs that offer stress-management seminars and stress-reduction programs, such as on-site yoga and exercise classes, and relaxation techniques, can be helpful. Online decision support systems to help
caregivers know which are the best services for themselves and their older relatives fit in with other health care decision support systems.
As shown in this study, working caregivers need to be encouraged to stop or reduce negative behaviors as well as to take full advantage of the preventive opportunities employers offer. Smoking cessation programs are a prime example, since there is a clear link between elder caregiving and smoking, especially among white-collar workers. Incentives can help drive utilization in wellness programs.
A recent article on incentives by Healthways’ Center for Health Research quoted Elizabeth Rula, Ph.D., Manager of Clinical Research, “Incentives help to overcome perceived barriers to participation.”12 Incentives can be used to encourage employees to enroll in a program or
Amway Corporation’s
Optimal You!
Wellness Program
has been successful
in showing employees
how to feel better,
live better, and reduce
stress levels. Amway
offers employees a
financial incentive and
insurance premium
discount.
26
take steps to improve their health; they can be small tokens, such as gift cards, T-shirts, or a spa treatment.
Another suggestion is to incorporate counseling into primary care medical visits. For example, where the same entity provides insurance and medical care, such as Kaiser Permanente, the physician doing a routine visit can ask if the patient is also a family caregiver and a social worker can then join in to ask if there are work/life balance issues.
Other types of corporate programs can be developed to address caregivers’ health issues. Since the data from this study again show that stress and prevention are major factors in health costs and potential reduction of these costs, ideas for the workplace include:
› Stress-reduction seminars, expanded to include on-site yoga and exercise classes, relaxation techniques, and massage therapy
› Decision-support systems to reduce stress among caregivers through better information about the best services for themselves and their family members
› Financial incentives to encourage employees to take advantage of preventive health benefits offered by employers (but which do not encourage pre-existing condition discrimination)—such as reductions on their premiums or deductibles if employees get annual physicals, mammograms, Pap tests, smoking cessation classes, and exercise
› Expanded on-site medical testing/screenings
› Stress reduction by providing mediation services for caregiving families in conflict
› A certain number of hours of free legal and financial advice, especially around Medicare, Medicaid, and insurance issues
› Online support groups for employees who prefer them to on-site groups
› Health coaching services and/or nurse hotline access
Employees are exhibiting a heightened interest in and appreciation of employee benefits. The Seventh Annual MetLife Employee Benefits Trends Study (EBTS)13 found that while the benefits that are offered generally meet employee needs, the communication about them is not as effective as it could be. According to the study, only 36% of employees strongly believe that current benefits communications educate employees effectively. Employers can raise the participation levels and get a better return on their benefits dollar by developing a program that raises the participation levels by improving communications with their employees.
It is useful to consider how employers can take benefits beyond simply a cost mitigation strategy to one which cultivates a work environment of health promotion and increased employee engagement, according to MetLife’s publication, The Benefits Edge—Honing the Competitive Value of Employee Benefits.14 Solution-oriented strategies and innovative health and well-being programs that tie together health and work make bottom-line sense along with all their other advantages.
The percentage of family caregivers in the workplace will only rise over time. All stakeholders need to recognize that supporting working caregivers can reduce their health and productivity burden, not just in their personal lives but in their corporate lives as well.
Conclusions and Implications for Employers
WORKING CAREGIVERS AND EMPLOYER HEALTH CARE COSTS 27
The goal of this study was to examine potential differences in the health, medical care, and work experience of employed caregivers and non-caregivers. These differences may not be entirely due to one factor, but may be confounded with other factors which can often be controlled statistically. For example, if caregivers are more likely to be women and if women are more likely to report health conditions, a higher prevalence of a medical condition among caregivers may be due to this gender difference rather than to caregiving per se.
Potential confounding factors were removed by conducting stratified analyses, in which caregivers and non-caregivers within groups defined by age, gender, and white- versus blue-collar status were compared. Another possible source of confounding involves questionnaire modules that were optional in the health risk appraisal (HRA), such as indicators of depression.
If caregivers were more likely to complete such questions and also more likely to endorse these symptoms, a higher prevalence of depression due to differential response, rather than a true difference, might be found. This selection bias was eliminated by making sure that the proportion of non-response to optional questions was equal in the two groups.
Thus, the basic approach was to compare the proportion of caregivers and non-caregivers who reported particular disease conditions or health behaviors in groups defined by age, gender, and blue- or white-collar status.
Statistical significance for proportions was established using the Chi-square test. For multivariable analyses, regression models were developed to assess the risk of reporting medical conditions that could be attributed to caregiving independently of age, gender, or work status. This incremental risk is described by the additional odds of reporting a medical condition.
For cost estimates, the investigators accessed the case study company’s separate claims database, which is managed by Medstat. Cost estimates were derived in the following way: Medstat prepared cost data for each of 190 medical conditions (“episode summary group”) for active employees in 2007. Costs are specified by episode rather than patient, and the key measure for the analyses is the “allowed amount per episode-total.”
This measure is the mean cost in 2007 dollars for someone with an episode of the condition in a given year and includes all medical care costs associated with that condition. For example, the mean cost of depression care by this measure is $725. Across the 190 conditions, the median cost of a condition was $1,269; the lowest quartile (25%) of conditions had a total cost of $589 or lower and the highest quartile $29,397 or higher.
To examine combinations of conditions, the allowed amount per episode-total for each component condition was added. This approach is analytically simple and, based on discussion with health economists, is reasonable given the way care for multiple conditions is billed.
Appendix A: Detailed Methodology
28
Using the mean costs of these sentinel disease conditions and their combinations (as well as costs in people not reporting the conditions), (1) a weighted cost per condition (mean $ x proportion with condition) for caregiver and non-caregiver groups was computed, (2) summed across conditions, and (3) then a ratio of caregiver to non-caregiver costs was computed.
This approach allowed a determination of the additional costs associated with caregiving, as represented by the greater proportion of medical conditions reported by caregivers. The full sample of active employees was used and 2007 costs, according to the distribution of chronic conditions reported by caregivers and non-caregivers, were applied.
Appendix A: Detailed Methodology
WORKING CAREGIVERS AND EMPLOYER HEALTH CARE COSTS 29
Appendix B: Supplementary Tables
Women Men
% %
Ages 18–39
Non-Caregiver 11.8% 11.2%
Caregiver 12.7% 18.6%+
Ages 40–49
Non-Caregiver 9.6% 11.3%
Caregiver 15.5%+ 12.6%
Ages 50–59
Non-Caregiver 9.0% 10.0%
Caregiver 16.9%** 9.7%
+ Significant at .10 level. ** Significant at .01 level.
Table S6.1: Fair-Poor Health by Age, Gender, and Caregiver Status
Depression CancerRx,
CholesterolRx,
HypertensionAsthma
Kidney Disease
COPDHeart
DiseaseDiabetes
% % % % % % % % %
Ages 18–39
Non-Caregiver 11.2 3.6 1.1 3.1 8.6 0.3 1.7 0.4 1.7
Caregiver 17.0 4.1 4.4*** 8.2*** 12.3 0.7 7.2*** 1.4 0.6
Ages 40–49
Non-Caregiver 12.4 6.2 6.5 13.5 7.0 0.5 2.3 0.7 2.7
Caregiver 15.2 7.1 7.8 19.1** 8.0 1.5 4.6* 3.1** 5.7**
Ages 50+
Non-Caregiver 8.0 11.5 18.3 30.7 6.9 0.6 2.5 3.4 6.5
Caregiver 20.3** 10.5 19.9 30.7 8.8 1.3 6.2*** 4.5 8.1
* Significant at .05 level. ** Significant at .01 level. *** Significant at .001 level.
Table S6.2a: Medical Conditions: Women, by Age and Caregiver Status
30
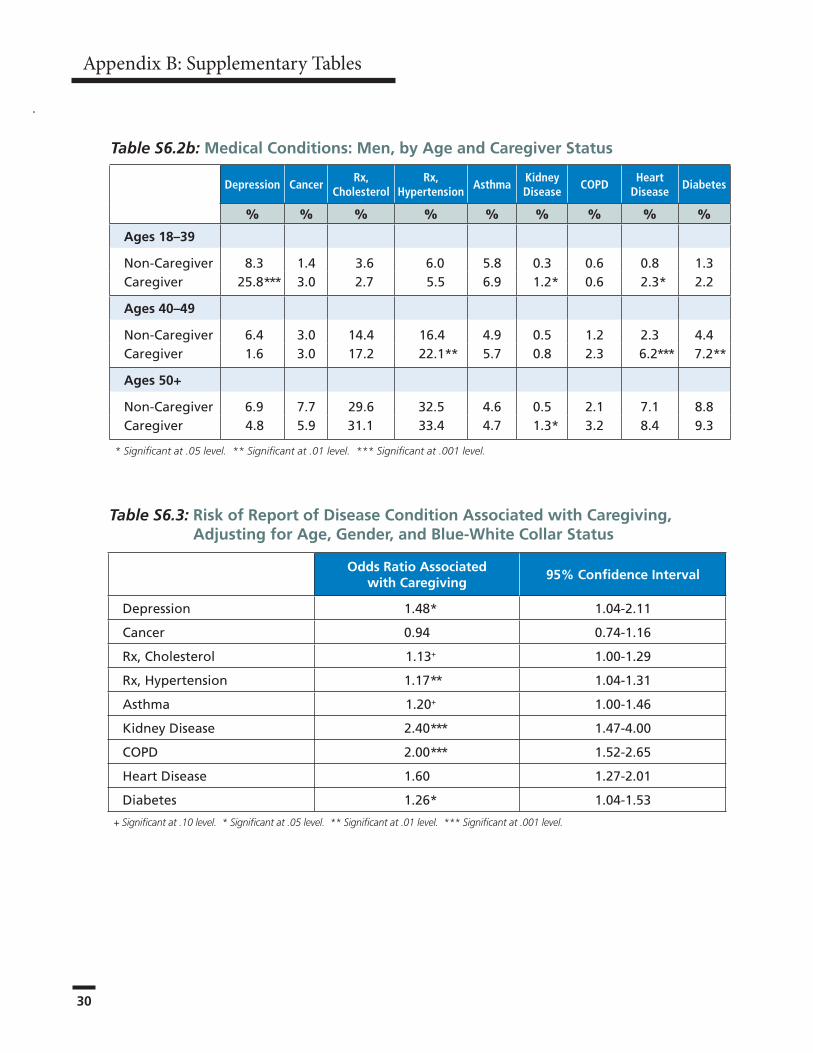
Odds Ratio Associated with Caregiving
95% Confidence Interval
Depression 1.48* 1.04-2.11
Cancer 0.94 0.74-1.16
Rx,Cholesterol 1.13+ 1.00-1.29
Rx,Hypertension 1.17** 1.04-1.31
Asthma 1.20+ 1.00-1.46
KidneyDisease 2.40*** 1.47-4.00
COPD 2.00*** 1.52-2.65
HeartDisease 1.60 1.27-2.01
Diabetes 1.26* 1.04-1.53
+ Significant at .10 level. * Significant at .05 level. ** Significant at .01 level. *** Significant at .001 level.
Table S6.3: Risk of Report of Disease Condition Associated with Caregiving, Adjusting for Age, Gender, and Blue-White Collar Status
Depression CancerRx,
CholesterolRx,
HypertensionAsthma
Kidney Disease
COPDHeart
DiseaseDiabetes
% % % % % % % % %
Ages 18–39
Non-Caregiver 8.3 1.4 3.6 6.0 5.8 0.3 0.6 0.8 1.3Caregiver 25.8*** 3.0 2.7 5.5 6.9 1.2* 0.6 2.3* 2.2
Ages 40–49
Non-Caregiver 6.4 3.0 14.4 16.4 4.9 0.5 1.2 2.3 4.4Caregiver 1.6 3.0 17.2 22.1** 5.7 0.8 2.3 6.2*** 7.2**
Ages 50+
Non-Caregiver 6.9 7.7 29.6 32.5 4.6 0.5 2.1 7.1 8.8Caregiver 4.8 5.9 31.1 33.4 4.7 1.3* 3.2 8.4 9.3
* Significant at .05 level. ** Significant at .01 level. *** Significant at .001 level.
Table S6.2b: Medical Conditions: Men, by Age and Caregiver Status
Appendix B: Supplementary Tables
WORKING CAREGIVERS AND EMPLOYER HEALTH CARE COSTS 31
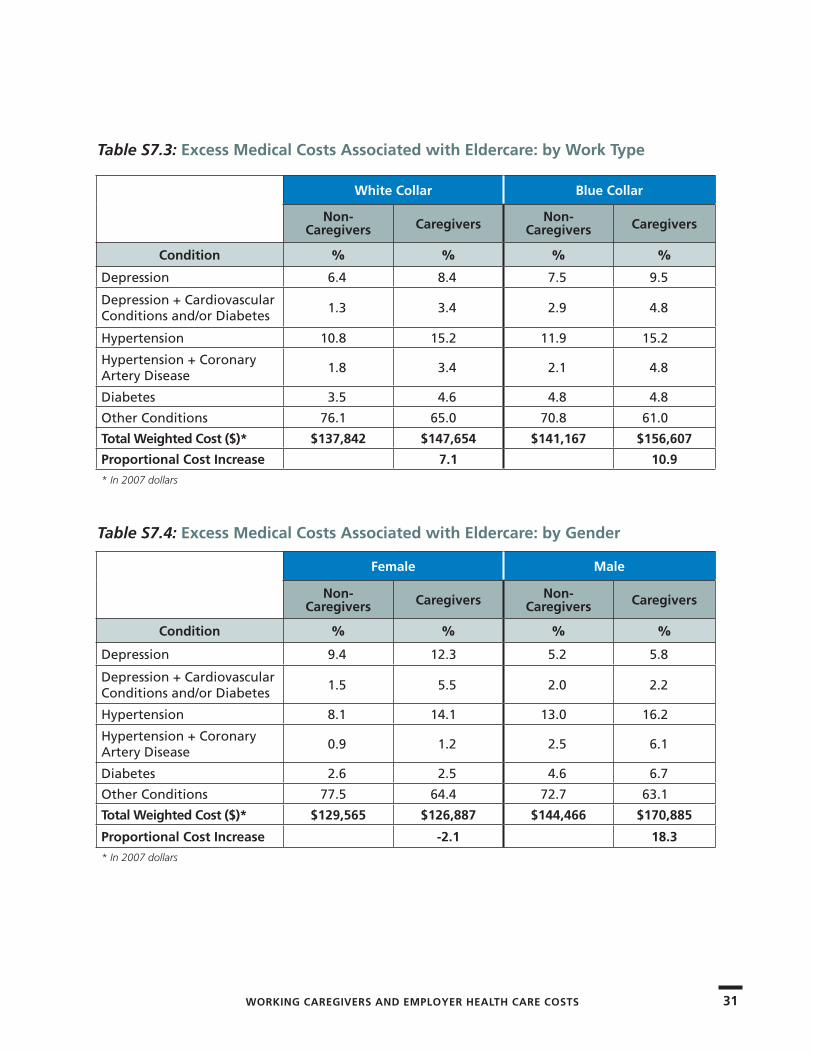
White Collar Blue Collar
Non- Caregivers Caregivers Non-
Caregivers Caregivers
Condition % % % %
Depression 6.4 8.4 7.5 9.5
Depression+CardiovascularConditionsand/orDiabetes
1.3 3.4 2.9 4.8
Hypertension 10.8 15.2 11.9 15.2
Hypertension+CoronaryArteryDisease
1.8 3.4 2.1 4.8
Diabetes 3.5 4.6 4.8 4.8
OtherConditions 76.1 65.0 70.8 61.0
Total Weighted Cost ($)* $137,842 $147,654 $141,167 $156,607
Proportional Cost Increase 7.1 10.9
* In 2007 dollars
Table S7.3: Excess Medical Costs Associated with Eldercare: by Work Type
Female Male
Non- Caregivers Caregivers Non-
Caregivers Caregivers
Condition % % % %
Depression 9.4 12.3 5.2 5.8
Depression+CardiovascularConditionsand/orDiabetes
1.5 5.5 2.0 2.2
Hypertension 8.1 14.1 13.0 16.2
Hypertension+CoronaryArteryDisease
0.9 1.2 2.5 6.1
Diabetes 2.6 2.5 4.6 6.7
OtherConditions 77.5 64.4 72.7 63.1
Total Weighted Cost ($)* $129,565 $126,887 $144,466 $170,885
Proportional Cost Increase -2.1 18.3
* In 2007 dollars
Table S7.4: Excess Medical Costs Associated with Eldercare: by Gender
32
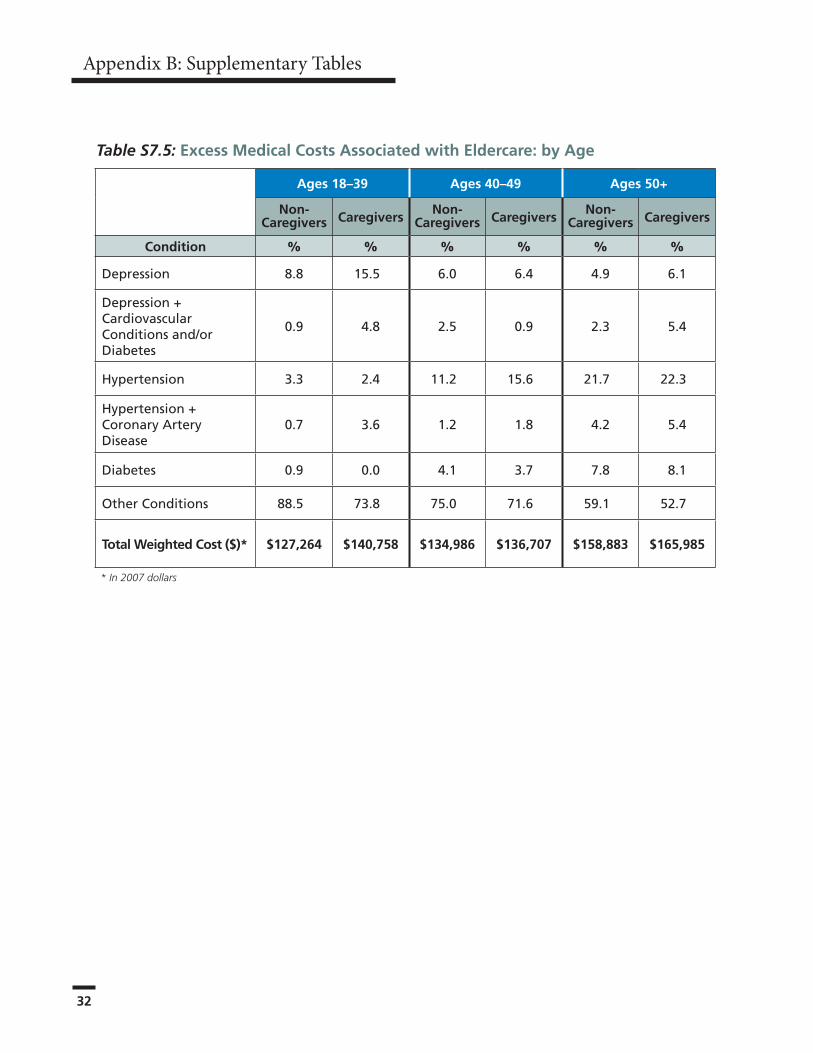
Ages 18–39 Ages 40–49 Ages 50+
Non- Caregivers Caregivers
Non- Caregivers Caregivers
Non- Caregivers Caregivers
Condition % % % % % %
Depression 8.8 15.5 6.0 6.4 4.9 6.1
Depression+CardiovascularConditionsand/orDiabetes
0.9 4.8 2.5 0.9 2.3 5.4
Hypertension 3.3 2.4 11.2 15.6 21.7 22.3
Hypertension+CoronaryArteryDisease
0.7 3.6 1.2 1.8 4.2 5.4
Diabetes 0.9 0.0 4.1 3.7 7.8 8.1
OtherConditions 88.5 73.8 75.0 71.6 59.1 52.7
Total Weighted Cost ($)* $127,264 $140,758 $134,986 $136,707 $158,883 $165,985
* In 2007 dollars
Table S7.5: Excess Medical Costs Associated with Eldercare: by Age
Appendix B: Supplementary Tables
WORKING CAREGIVERS AND EMPLOYER HEALTH CARE COSTS 33
1 National Alliance for Caregiving and AARP. (2009). Caregiving in the U.S. http://caregiving.org/pubs/data.htm.
2 Wolff, J.L. and Kasper, J.D. (2006). “Caregivers of Frail Elders: Updating a National Profile.” The Gerontologist 46 (3): 344-356.
3 Wakabayashi, C. and Donato, K.M. (2005). “The Consequences of Caregiving: Effects on Women’s Employment and Earnings.” Population Research and Policy Review 24: 467-488.
4 Pavalko, E.K. and Artis, J.E. (1997). “Women’sCaregiving and Paid Work: Causal Relationships in Late Midlife.” Journal of Gerontology: Social Sciences 52B (4): S170-S179.
5 Spiess, C.K. and Schneider, U. (2002). “Midlife Caregiving and Employment: An Analysis of Adjustments in Work Hours and Informal Care for Female Employees in Europe.” European Network of Economic Policy Research Institutes Working Paper 9: 1-36.
6 MetLife Mature Market Institute. (2006). The MetLife Caregiving Cost Study: Productivity Losses to U.S. Business. www.MatureMarketInstitute.com.
7 Neal, M.B. and Hammer, L.B. (2007). Working Couples Caring for Children and Aging Parents: Effects on Work and Well-Being. Lawrence Erlbaum Associates: Mahwah, NJ.
8 Lerner, D., Amick, B.C., Rogers, W.H., Malspeis, S., Bungay, K., and Cynn, D. (2001). “The Work Limitations Questionnaire.” Medical Care (39) 72-85.
9 SHRM (2009). “Examining Employee Benefits in a Fiscally Challenging Economy.” Society for Human Resource Management. Employee Benefits: 27-31.
10 The Seventh Annual MetLife Employee Benefits Trends Study. http://www.whymetlife.com/trends/.
11 Employee Benefit Adviser (2009). By the Numbers Web Survey, retrieved on July 7, 2009 at: http://eba.benefitnews.com/blog/bythenumbers/.
12 Employee Benefit News (2009). Industry Currents. Retrieved September 9, 2009 online at: www.benefitnews.com.
13 The Seventh Annual MetLife Employee Benefits Trends Study. http://www.whymetlife.com/trends/.
14 Leopold, R. The Benefits Edge —Honing the Competitive Value of Employee Benefits. New York: MetLife, 2009. http://www.whymetlife.com/benefitsedge/.
Endnotes
The MetLife Mature Market Institute® Established in 1997, the Mature Market Institute (MMI) is MetLife’s research organization and a recognized thought leader on the multi-dimensional and multi-generational issues of aging and longevity. MMI’s groundbreaking research, gerontology expertise, national partnerships, and educational materials work to expand the knowledge and choices for those in, approaching, or caring for those in the mature market.MMI supports MetLife’s long-standing commitment to identifying emerging issues and innovative solutions for the challenges of life. MetLife, Inc. (NYSE:MET), through its subsidiaries and affiliates, is a leading provider of insurance, employee benefits, and financial services with operations throughout the United States and the Latin America, Europe, and Asia Pacific regions.For more information about the MMI, please visit: www.MatureMarketInstitute.com.MetLife Mature Market Institute57 Greens Farms Road Westport, CT 06880(203) 221-6580 • Fax (203) 454-5339 [email protected]
National Alliance for CaregivingEstablished in 1996, the National Alliance for Caregiving is a non-profit coalition of national organizations focusing on issues of family caregiving. The Alliance was created to conduct research, do policy analysis, develop national programs, and increase public awareness of family caregiving issues. Recognizing that family caregivers make important societal and financial contributions toward maintaining the well-being of those for whom they care, the Alliance’s mission is to be the objective national resource on family caregiving with the goal of improving the quality of life for families and care recipients. National Alliance for Caregiving 4720 Montgomery Lane, Suite 205 Bethesda, MD 20814 www.caregiving.org
University of PittsburghThe University Center for Social & Urban Research (UCSUR) was established in 1972 to serve as a resource for social and behavioral science research. It focuses on regional economic analysis and forecasting, the psychosocial impacts of adult development and aging, intergenerational relations, and environmental resource management. www.ucsur.pitt.edu/index.phpThe Department of Behavioral and Community Health Sciences (BCHS) at the Graduate School of Public Health promotes understanding of social and behavioral factors that influence the health of populations, with a particular focus on evaluation of health programs and policies. www.bchs.pitt.edu/
MMI00216(0210) L1109070527[exp1012]
www.MatureMarketInstitute.com
CA
SE STU
DY
200ParkAvenue,NewYork,NY
©2010MetropolitanLifeInsuranceCompany