Embed Size (px)
Citation preview
8/6/2019 High Performance Cleanroom Air Design
http://slidepdf.com/reader/full/high-performance-cleanroom-air-design 1/48
HIGH PERFORMANCE
CLEANROOMS
A Design Guidelines Sourcebook
January 2006
8/6/2019 High Performance Cleanroom Air Design
http://slidepdf.com/reader/full/high-performance-cleanroom-air-design 2/48
TABLE OF CONTENTS
Introduction........................................................................................2
1. Air Change Rates ..........................................................................3
2. Demand Controlled Filtration ..........................................................8
3. Dual Temperature Chilled Water Loops ..........................................12
4. Exhaust Optimization....................................................................16
5. Fan-Filter Units ............................................................................20
6. Low Pressure Drop Air Systems ......................................................25
7. Minienvironments ........................................................................30
8. Recirculation Air System Types ......................................................35
9. Vacuum Pump Optimization ..........................................................40
10. Waterside Free Cooling ..............................................................43
1
8/6/2019 High Performance Cleanroom Air Design
http://slidepdf.com/reader/full/high-performance-cleanroom-air-design 3/48
INTRODUCTION
Cleanroom design is a challenging field dominated by the need for high reliability,maintenance of strict space cleanliness requirements, life safety, and narrow temperatureand humidity control bands. By necessity, efficiency is a lower priority in design. But thereare a number of design approaches that have been shown to meet all the requirements of a cleanroom facility robustly while minimizing power consumption and cost. The CleanroomDesign Guidelines describe a number of successful and efficient design practices specifically appropriate for cleanroom facilities.
Based on actual measurement of operating cleanroom facilities and input from cleanroom
designers, owners and operators, the Cleanroom Design Guidelines offer many successfuldesign approaches that apply to most cleanroom facilities. No single recommendation can beappropriate for every cleanroom facility, but baseline measurement has clearly shown largeefficiency differences between design solutions that support identical cleanroom conditions.The Design Guidelines are not universal rules, but offer recommendations to the cleanroomdesigner who has little time or budget to evaluate the wide range of efficiency options suitable
for and proven in cleanroom facilities.
While cleanroom design is a relatively mature industrial field, the low emphasis on energy efficiency and a conservative tendency on the part of designers to re-use proven designs
regardless of their efficiency (often their efficiency was never measured) still results inneedlessly inefficient designs. The Cleanroom Design Guidelines help identify more efficientdesign approaches, allowing at least a high level consideration of efficiency to be included in,and impact, a design process typically compressed by budget and schedule constraints.
2
8/6/2019 High Performance Cleanroom Air Design
http://slidepdf.com/reader/full/high-performance-cleanroom-air-design 4/48
3
1. AIR CHANGE RATES
Recirculation air change rates (ACRs) are animportant factor in contamination control ina cleanroom and are the single largest factor in determining fan and motor sizing for a recirculation air handling system. Air handler sizing and air path design directly impacts thecapital costs and configuration of a building.
Many air change rate recommendations weredeveloped decades ago with little scientific
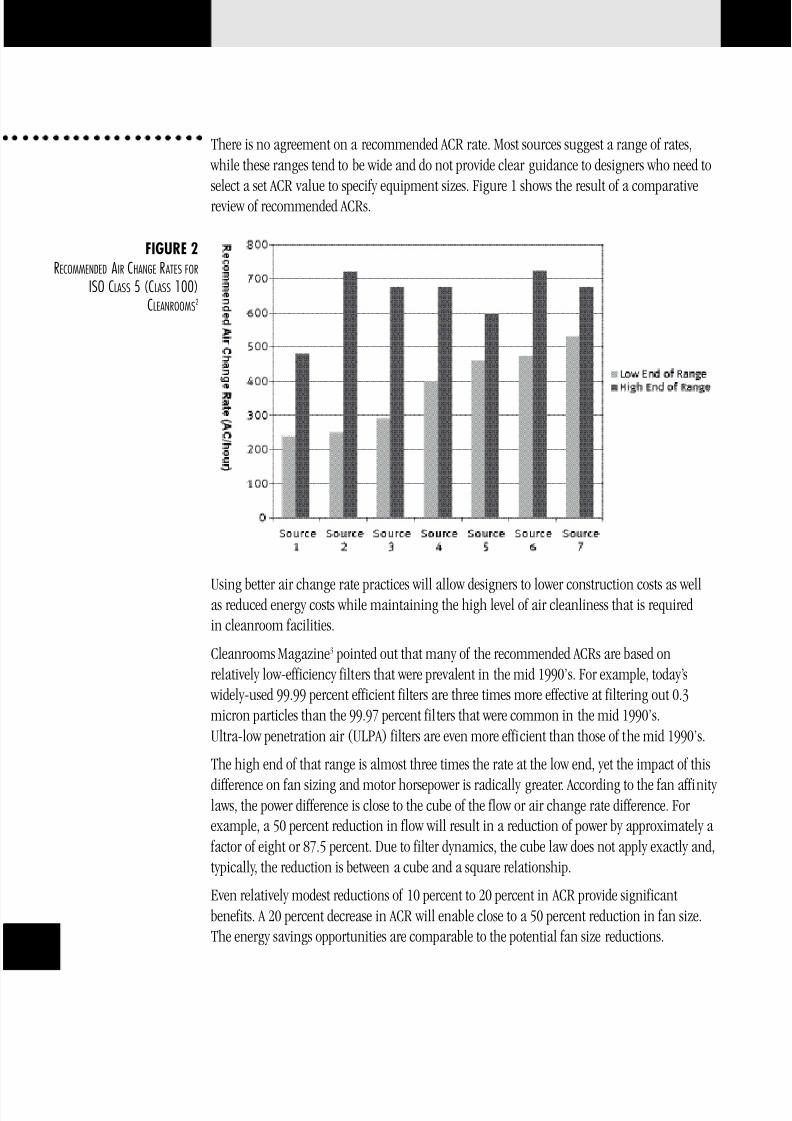
research to back them up. The recommended design ranges for ISO Class 5 (Class 100)cleanroom ACRs are from 250 to 700 air changes per hour (see Figure 2). Higher ACRs equateto higher airflows and more energy use, and don’t always achieve the desired cleanliness. Bothnew and existing systems can benefit from optimized air change rates. Frequently this equatesto lower air change rates.
Benchmarking has shown that most facilities are operated at or below the low range of recommended ACRs. A Sematech study has also verified that lowered air change rates incleanrooms are adequate in maintaining cleanliness. The actual operating ACRs documented
for ten ISO Class 5 cleanrooms was between 94 and 276 air changes per hour.
PRINCIPLES• Lower air change rates result in smaller fans, which reduce both the initial investment and
construction cost.
• Fan power is proportional to the cube of air change rates or airflow. A reduction in the air change rate by 30% results in a power reduction of approximately 66%.
• Lower airflow may improve the actual cleanliness by minimizing turbulence.
APPROACH
Designers and cleanroom operators have a variety of sources to choose from when looking
for ACR recommendations. Recommendations are not based on scientific findings andconsequently there is no clear consensus on an optimum ACR. For this reason, many of the established guidelines are outdated.
There are several conflicting sets of recommendations on cleanroom airflow. Articles inCleanrooms magazine1 have explored the different ways of measuring or describing airflow and have discussed the Institute of Environmental Sciences and Technology (IEST; RollingMeadows, Ill.) recommendations; however, few industry observers have examined actual
practices and the relationship on construction and energy costs.
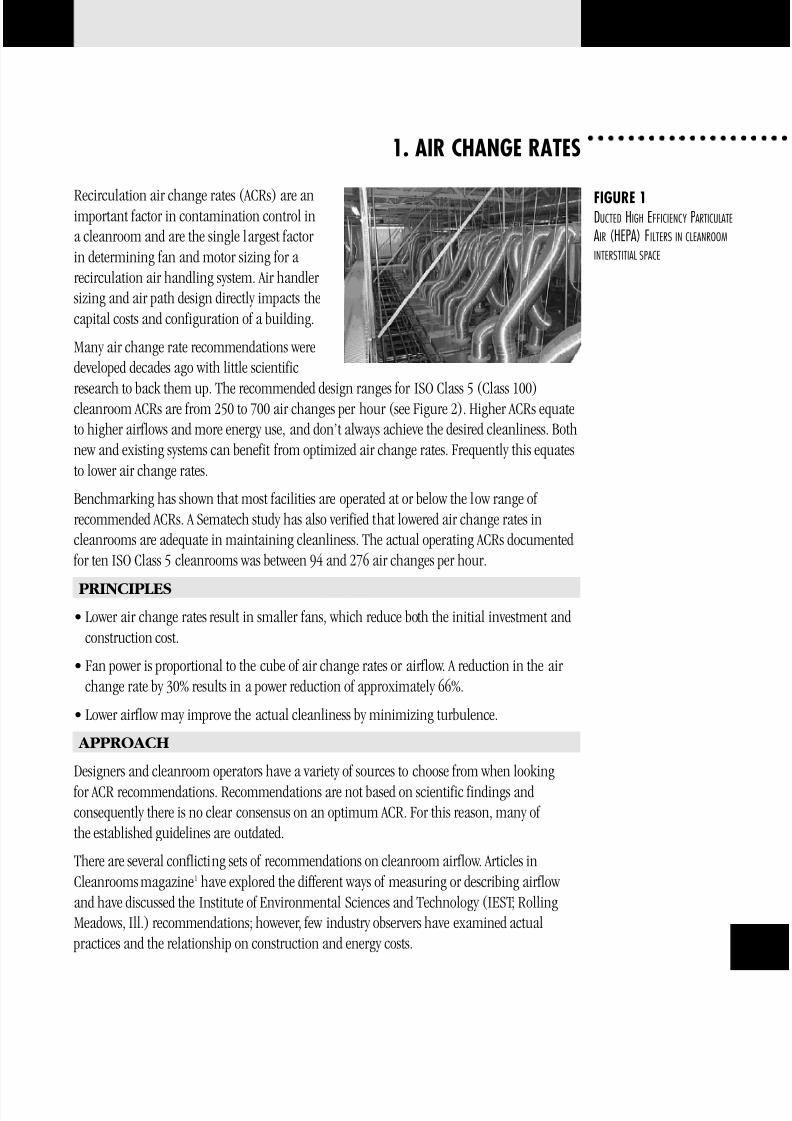
FIGURE 1DUCTED HIGH EFFICIENCY PARTICULATE
AIR (HEPA) FILTERS IN CLEANROOM
INTERSTITIAL SPACE
8/6/2019 High Performance Cleanroom Air Design
http://slidepdf.com/reader/full/high-performance-cleanroom-air-design 5/48
4
There is no agreement on a recommended ACR rate. Most sources suggest a range of rates, while these ranges tend to be wide and do not provide clear guidance to designers who need toselect a set ACR value to specify equipment sizes. Figure 1 shows the result of a comparativereview of recommended ACRs.
Using better air change rate practices will allow designers to lower construction costs as wellas reduced energy costs while maintaining the high level of air cleanliness that is requiredin cleanroom facilities.
Cleanrooms Magazine3 pointed out that many of the recommended ACRs are based onrelatively low-efficiency filters that were prevalent in the mid 1990’s. For example, today’s
widely-used 99.99 percent efficient filters are three times more effective at filtering out 0.3micron particles than the 99.97 percent filters that were common in the mid 1990’s.Ultra-low penetration air (ULPA) filters are even more efficient than those of the mid 1990’s.
The high end of that range is almost three times the rate at the low end, yet the impact of this
difference on fan sizing and motor horsepower is radically greater. According to the fan affinity laws, the power difference is close to the cube of the flow or air change rate difference. For example, a 50 percent reduction in flow will result in a reduction of power by approximately a
factor of eight or 87.5 percent. Due to filter dynamics, the cube law does not apply exactly and,typically, the reduction is between a cube and a square relationship.
Even relatively modest reductions of 10 percent to 20 percent in ACR provide significantbenefits. A 20 percent decrease in ACR will enable close to a 50 percent reduction in fan size.The energy savings opportunities are comparable to the potential fan size reductions.
FIGURE 2
RECOMMENDED AIR CHANGE RATES FOR
ISO CLASS 5 (CLASS 100)
CLEANROOMS2
8/6/2019 High Performance Cleanroom Air Design
http://slidepdf.com/reader/full/high-performance-cleanroom-air-design 6/48
5
ACR reductions may also be possible when cleanrooms are unoccupied for a length of time.In most cleanrooms, human occupants are the primary source of contamination. Once a cleanroom is vacated, lower air changes per hour to maintain cleanliness are possibleallowing for setback of the air handling systems. Setback of the air handling system fanscan be achieved by manual setback, timed setback, use of occupancy sensors, or by monitoring particle counts and controlling airflow based upon actual cleanliness levels.
It is a common misconception that making a cleanroom more efficient will drive upconstruction costs. However, well-planned ACR reductions can reduce both constructionand energy costs. This is a true win-win situation, which decreases the amount of work themechanical system has to perform and offers high leverage for downsizing equipment.
Biotechnology and pharmaceutical cleanrooms are designed to meet current Good
Manufacturing Practices (cGMPs). Traditionally, high air change rates were followed withoutchallenge because they had been previously accepted by regulators. As new informationbecomes available (such as case studies showing acceptable performance at lower airflows)the current Good Manufacturing Practice should be able to reflect use of lower airflow.
Best practice for ACRs is to design new facilities at the lower end of the recommended ACRrange. Once the facility is built, monitoring and controlling based upon particle countscan be used to further reduce ACRs. Variable speed drives (VSDs) should be used on allrecirculation air systems allowing for air flow adjustments to optimize airflow or account for
filter loading. Existing systems should be adjusted to run at the lower end of the recommend ACR range through careful monitoring of impact on the cleanroom process(es). Where VSDsare not already present, they can be added and provide excellent payback if coupled withmodest turndowns.
BENCHMARKING FINDINGS/CASE STUDIES
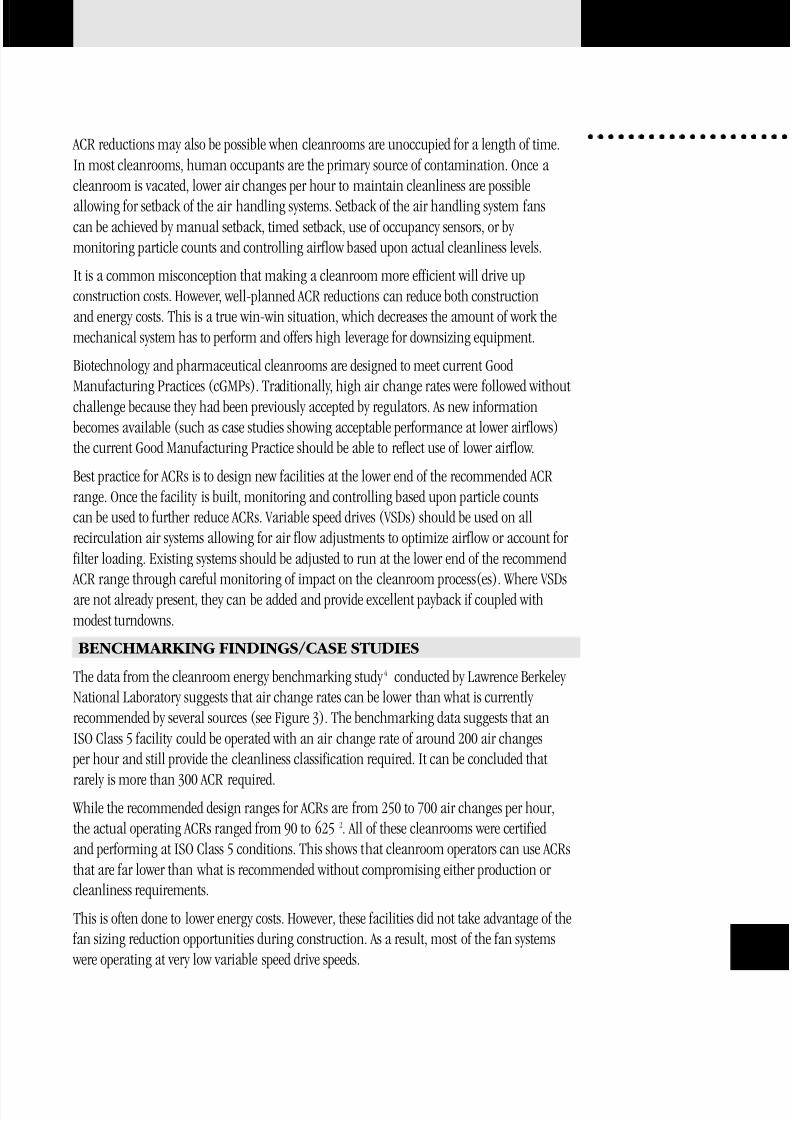
The data from the cleanroom energy benchmarking study 4 conducted by Lawrence Berkeley National Laboratory suggests that air change rates can be lower than what is currently recommended by several sources (see Figure 3). The benchmarking data suggests that anISO Class 5 facility could be operated with an air change rate of around 200 air changes
per hour and still provide the cleanliness classification required. It can be concluded that
rarely is more than 300 ACR required. While the recommended design ranges for ACRs are from 250 to 700 air changes per hour,the actual operating ACRs ranged from 90 to 625 2. All of these cleanrooms were certifiedand performing at ISO Class 5 conditions. This shows that cleanroom operators can use ACRsthat are far lower than what is recommended without compromising either production or cleanliness requirements.
This is often done to lower energy costs. However, these facilities did not take advantage of the fan sizing reduction opportunities during construction. As a result, most of the fan systems were operating at very low variable speed drive speeds.
8/6/2019 High Performance Cleanroom Air Design
http://slidepdf.com/reader/full/high-performance-cleanroom-air-design 7/48
6
Fortunately, a growing body of data, case studies and research are available that documentsuccess. In a study by International Sematech (Austin, Texas)5, no noticeable increase of
particle concentrations was found when air change rates were lowered by 20 percent in ISOClass 4 cleanrooms. Also, a study at the Massachusetts Institute of Technology (MIT;Cambridge, Mass.)6 found that in a raised-floor-type cleanroom “with a small decrease in air
velocity, such facilities will decrease particle deposition and maintain air uni-directionality.”Other success has been noted by cleanroom operators at Sandia National Laboratories
(Albuquerque, N.M.). Sandia National Laboratories has successfully reduced air change ratesin their state-of-the-art ISO Class 4 and 5 cleanrooms. This is especially significant sinceSandia pioneered laminar flow cleanrooms in the early 1960s.
RELATED CHAPTERS
• Low Pressure Drop Air Systems
• Demand Controlled Filtration
• Fan-filter Units
• Recirculation Air Handling Systems
• Minienvironments
REFERENCES
1) Fitzpatrick, Mike and Goldstein, Ken, Cleanroom Airflow Measurement: Velocity, Air Changes Per Hour Or Percent Filter Coverage? Cleanrooms Magazine, May 2002; andFitzpatrick and Goldstein, Cleanroom Airflows Part II: The Messy Details, CleanroomsMagazine, July 2002.
FIGURE 3
MEASURED AIR CHANGE
RATES FOR ISO CLASS 5(CLASS 100) CLEANROOMS

8/6/2019 High Performance Cleanroom Air Design
http://slidepdf.com/reader/full/high-performance-cleanroom-air-design 8/48
7
2) Sources:1. IEST Considerations in Cleanroom Design (IEST RP-CC012.1)2. Raymond Schneider, Practical Cleanroom Design3. Cleanrooms equipment supplier 4. Faulkner, Fisk and Walton, “Energy Management in Semiconductor
Cleanrooms”5. California-based designer and cleanrooms instructor 6. Federal Standard 209B (superceded by ISO/DIS 14644)7. National Environment Balancing Bureau, Procedural Standards for Certified
Testing of Cleanrooms, 1996
3) Jaisinghani, Raj, “New Ways of Thinking About Air Handling,” CleanroomsMagazine, January 2001.
4) http://ateam.lbl.gov/cleanroom/benchmarking/index.htm.
5) Huang, Tom, Tool and Fab Energy Reduction, Spring 2000 NorthwestMicroelectronics Workshop, Northwest Energy Efficiency Alliance.
6) Vazquez, Maribel and Glicksman, Leon, On the Study of Altering Air Velocities inOperational Cleanrooms, 1999 International Conference on Advanced Technologiesand Practices for Contamination Control.
RESOURCES• IEST-RP-CC012.1, Considerations in Cleanroom Design, The Institute of
Environmental Sciences and Technology (IEST), 1993.
• Rumsey Peter, An Examination of ACRs: An Opportunity to Reduce Energy andConstruction Costs, Cleanrooms Magazine, January 2003.
• Xu, Tim, Considerations for Efficient Airflow Design in Cleanrooms, Journal of theIEST, Volume 47, 2004.
• Xu, Tim, “Performance Evaluation of Cleanroom Environmental Systems,” Journal of the IEST, Volume 46, August 2003.
• Schneider, R., “Designing Cleanroom HVAC Systems,” ASHRAE Journal V.43, No. 8, pp. 39-46, August 2001.
• ISO/DIS 14644-1, “Cleanrooms and associated controlled environments. Part 1:Classification of air cleanliness,” International Organization for Standardization,1999.
• ISO/DIS 14644-2, “Cleanrooms and associated controlled environments. Part 2:Testing and monitoring to prove continued compliance to ISO/DIS 14644-1,”International Organization for Standardization, 2000.
• National Environment Balancing Bureau, “Procedural Standards for CertifiedTesting of Cleanrooms,” 1996.
8/6/2019 High Performance Cleanroom Air Design
http://slidepdf.com/reader/full/high-performance-cleanroom-air-design 9/48
8
2. DEMAND CONTROLLED FILTRATION
Recirculation air flow in cleanrooms has traditionally been determined through variousmethods. There are several published recommended ranges of airflow which present differingrecommendations including ASHRAE Applications Handbook chapter 16 (table 2), IESTRecommended Practice 012.1, and ISO 14644-4 Annex B, however, these and other sources
provide conflicting recommended ranges of air change rates and the range of values is very broad. Air change rates have been determined based upon historical rules of thumb, that
which was previously successful for similar contamination control situations, or pureguesswork.
Contamination control is the primary consideration in cleanroom design, however the
relationship between contamination control and airflow is not well understood. Contaminantssuch as particles or microbes are primarily introduced to cleanrooms by people although
processes in cleanrooms may also introduce contamination. During periods of inactivity or when people are not present, it is possible to reduce airflow and maintain cleanlinessconditions. Reducing airflow by use of variable speed fans which are normally a feature of recirculation systems is an energy efficiency measure that can save a lot of energy. Even smallreductions in airflow can save significant amounts of energy due to the approximately cuberelationship between airflow and fan energy. In some situations airflow reduction may belimited by the cooling that the airflow provides to a process, however in many cases airflowscan readily be reduced.
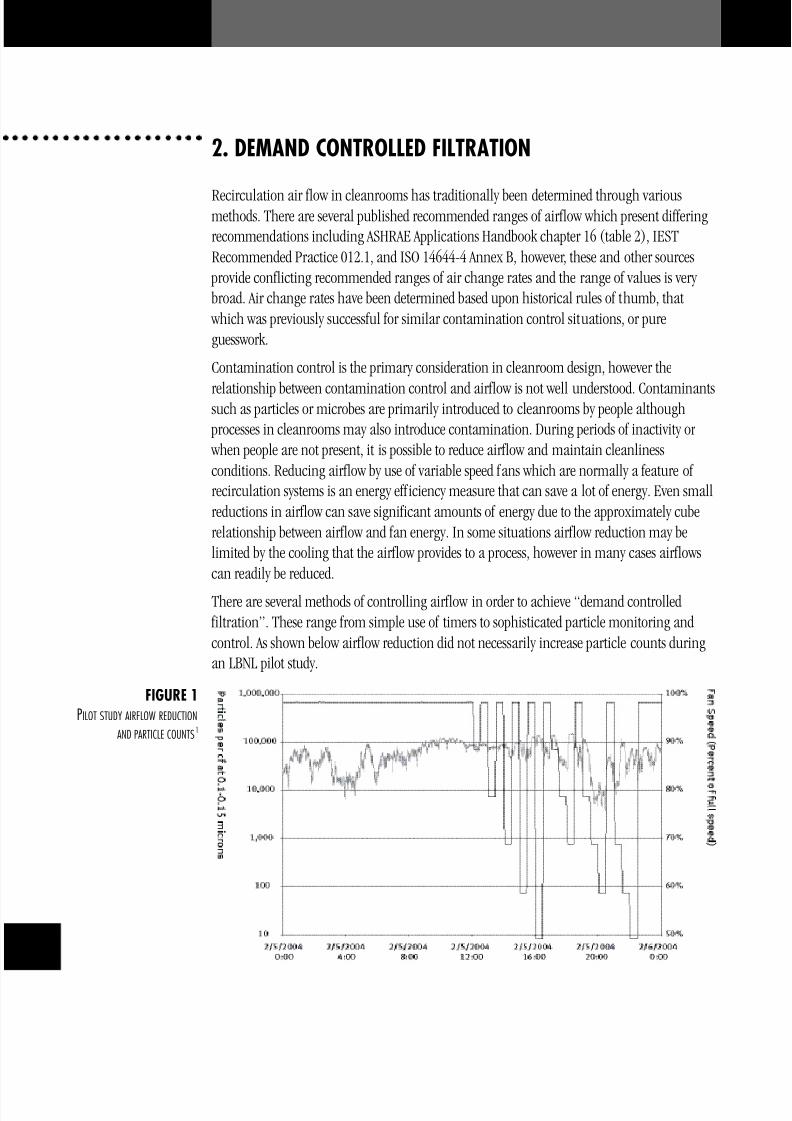
There are several methods of controlling airflow in order to achieve “demand controlled filtration”. These range from simple use of timers to sophisticated particle monitoring andcontrol. As shown below airflow reduction did not necessarily increase particle counts duringan LBNL pilot study.
FIGURE 1
PILOT STUDY AIRFLOW REDUCTION
AND PARTICLE COUNTS1
8/6/2019 High Performance Cleanroom Air Design
http://slidepdf.com/reader/full/high-performance-cleanroom-air-design 10/48
9
PRINCIPLES
• Reduce recirculated airflow in cleanroom when it is unlikely that particles will be generated
• Optimize airflow for best contamination control by real time particle monitoring andautomatic control of the recirculation system
APPROACH
Recirculation air flow can be determined based upon whatever criteria the cleanroom owner and designer are comfortable with. This may involve selecting design values from publishedrecommended values such as IEST Recommended Practice 012.1, or ISO- 14644-4 prior corporate recommendations, or other design guidance. Generally, airflow values from the low end of the recommended ranges will yield acceptable contamination control. Using this design
airflow, the recirculation system can be designed including sizing of fans, motors, ductwork,and return air paths. In addition, variable speed fans and a control mechanism must be provided. This design condition will consider the maximum airflow as a worst caserequirement for the cleanroom and will allow the airflow to be reduced when appropriate.
Recirculation airflow can be controlled in various ways:• Use of timers or scheduling software to lower airflow at certain times when the cleanroom is
unoccupied and with minimal process activity. This generally would be a step changereduction in airflow when the room is expected to be unoccupied and increased back tohigher airflow before room is reoccupied.
• Use of occupancy sensors to lower airflow whenever people are not present in the cleanroom.Placement and time delay of sensors needs to be such as to sense when people have exited or are about to enter the space.
• Use of particle counters to control airflow in the room based upon real-time cleanlinessmonitoring. In this scheme, particle counters will be deployed to monitor the various sizesof particles of concern for a given cleanroom’s contamination control problem. The number and placement of counters will need to be determined through interaction with processengineers and may involve some experimentation. An output signal from the particlecounters can directly control recirculation fan speed.
System pressurization is an important factor in implementing an airflow reduction strategy.
It’s important to note that the makeup air system and exhaust systems will continue to operateat their normal levels. This is usually necessary for safety considerations although there may be certain types of cleanrooms where these systems airflow could be reduced as well. A review of system effects should be performed to ensure that desired pressurization levels can beachieved with any reduction of cleanroom airflow.
Consideration of process equipment heat loads may limit the amount of airflow reduction. Airflow could be separately controlled to provide adequate airflow for heat removal, or simply set to always provide adequate airflow.
8/6/2019 High Performance Cleanroom Air Design
http://slidepdf.com/reader/full/high-performance-cleanroom-air-design 11/48
10
BENCHMARKING FINDINGS/CASE STUDIES
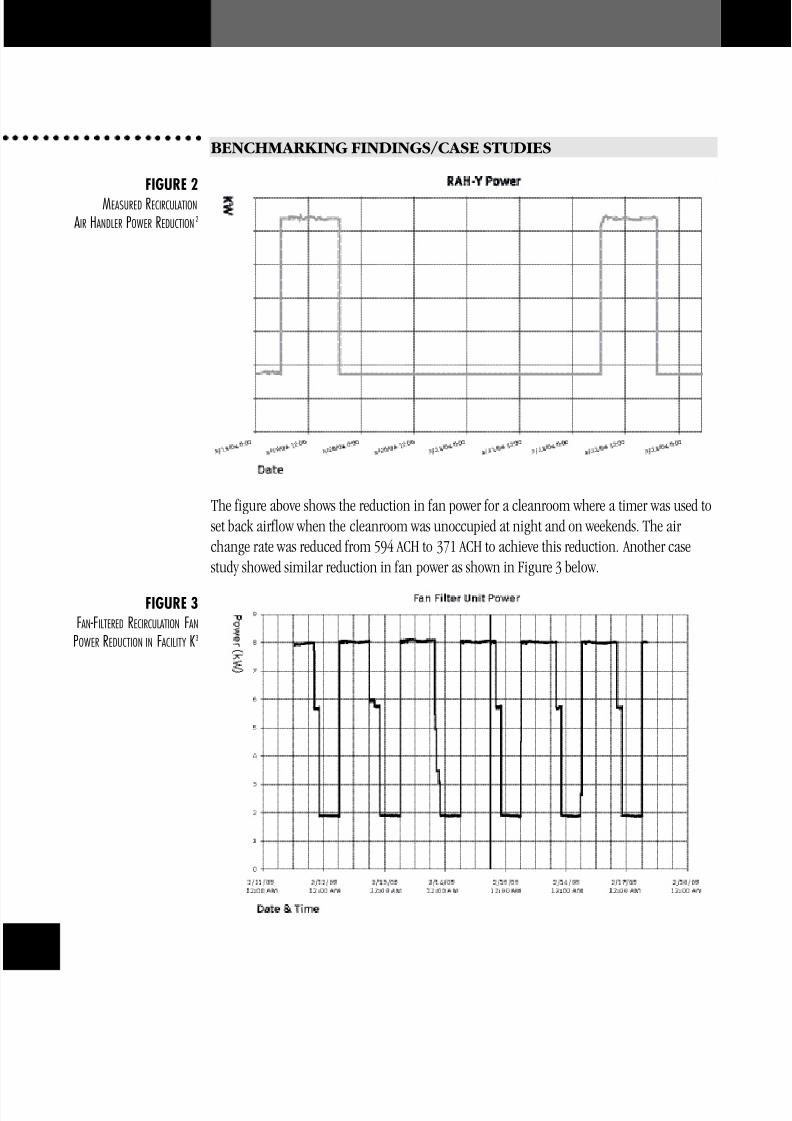
The figure above shows the reduction in fan power for a cleanroom where a timer was used toset back airflow when the cleanroom was unoccupied at night and on weekends. The air change rate was reduced from 594 ACH to 371 ACH to achieve this reduction. Another casestudy showed similar reduction in fan power as shown in Figure 3 below.
FIGURE 2
MEASURED RECIRCULATION
AIR HANDLER POWER REDUCTION2
FIGURE 3
FAN-FILTERED RECIRCULATION FAN
POWER REDUCTION IN FACILITY K3
8/6/2019 High Performance Cleanroom Air Design
http://slidepdf.com/reader/full/high-performance-cleanroom-air-design 12/48
1
RELATED CHAPTERS
• Recirculation Air System Types
• Fan-filter Units• Air Change Rates
REFERENCES
1) LBNL/Rumsey Engineers Cleanroom Benchmarking Study
2) ibid
3) ibid
RESOURCES• Tschudi, William; Faulkner, David; Hebert, Allan; “Energy Efficiency Strategies for
Cleanrooms Without Compromising Environmental Conditions” ASHRAE Symposium, June 2005.
• Xu, Tim, “Performance Evaluation of Cleanroom Environmental Systems,” Journal of theIEST, Volume 46, August 2003.
• Jaisinghani, Raj, “New ways of thinking about air handling,” Cleanrooms magazine, January 2001.
• Faulkner, D., Fisk, W. J., and Walton, T.. Energy Savings in Cleanrooms FromDemand-controlled Filtration. LBNL-38869.
8/6/2019 High Performance Cleanroom Air Design
http://slidepdf.com/reader/full/high-performance-cleanroom-air-design 13/48
12
3. DUAL TEMPERATURE CHILLED WATER LOOPS
Chiller energy can account for 10 to 20% of total cleanroomenergy use. The majority of annualchilled water use goes to mediumtemperature chilled water requirements – 55°F for sensiblecooling and 60 to 70°F for processcooling loads. When outside air temperatures are cool andhumidity is low (i.e., nolow-temperature water is needed
for dehumidification), 100% of the chilled water is for mediumtemperature loop uses.
Standard cleanroom chiller plant design provides chilled water at temperatures of 39 to 42°F. While this temperature is needed for dehumidification, the low setpoint imposes an efficiency penalty on the chillers. Typically, heat exchangers and/or mixing loops are used to convert thelow temperature, energy intensive chilled water into warmer chilled water temperatures for sensible or process cooling loads.
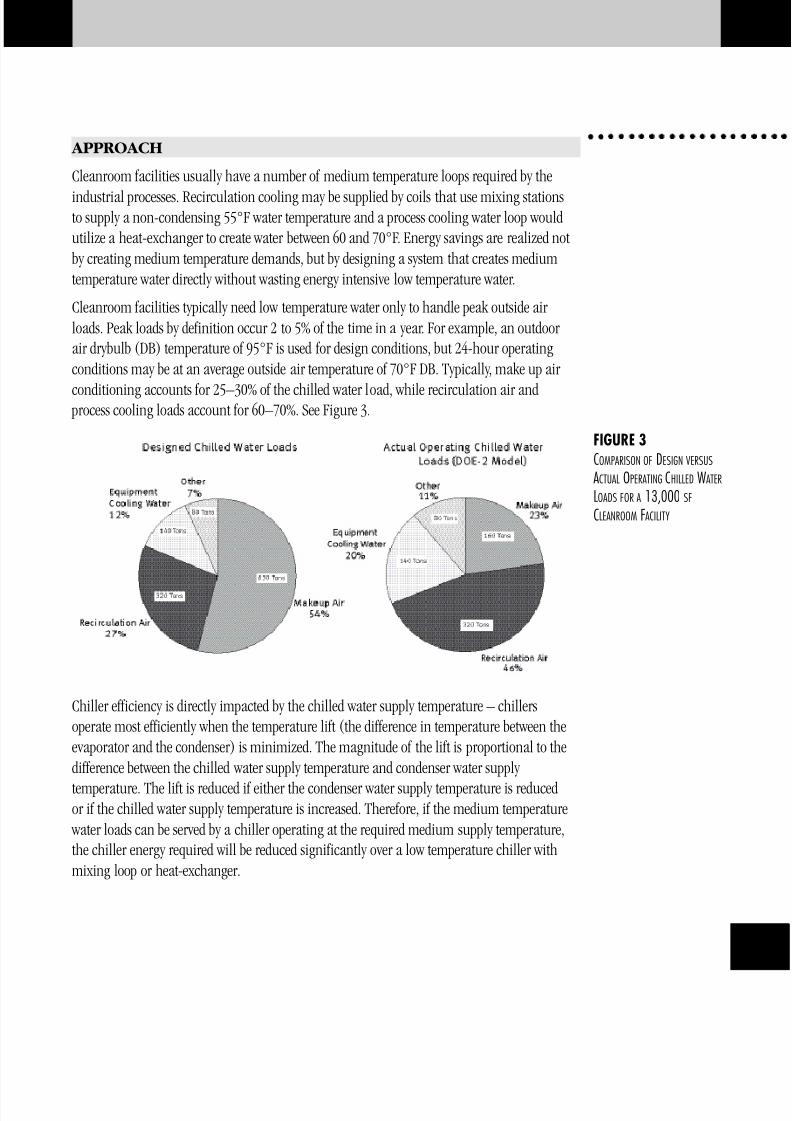
Chiller efficiency is a function of the chilled water supply temperature. All other things equal,higher chilled water temperatures result in improved chiller efficiency. For example, by dedicating a chiller in a dual chiller plant to provide chilled water at 55°F, 20 to 40% of chiller energy and peak power can be saved when compared to both chillers operating at 42°F.
PRINCIPLES
• Chiller work is proportional to the vapor pressure work of the compressor – this work islowered if chilled water temperatures are raised and/or condenser water temperatures arelowered.
• Because of less compressor work, medium temperature chillers have smaller compressorsand are thus lower in cost on a dollars per ton and electrical infrastructure basis as com-
pared to chillers delivering standard lower chilled water temperatures.
• The majority of cleanroom chilled water requirements are best served by medium tempera-ture, 55 to 70°F chilled water.
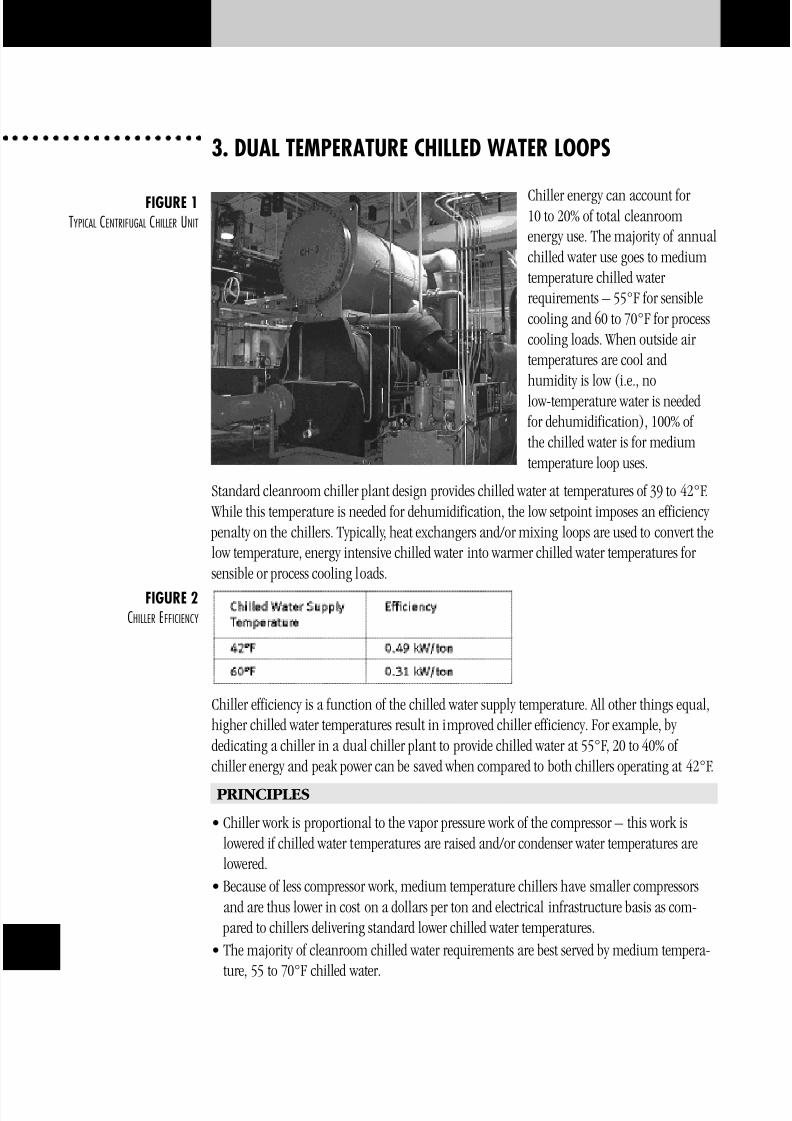
FIGURE 1
TYPICAL CENTRIFUGAL CHILLER UNIT
FIGURE 2
CHILLER EFFICIENCY
8/6/2019 High Performance Cleanroom Air Design
http://slidepdf.com/reader/full/high-performance-cleanroom-air-design 14/48
1
APPROACH
Cleanroom facilities usually have a number of medium temperature loops required by the
industrial processes. Recirculation cooling may be supplied by coils that use mixing stationsto supply a non-condensing 55°F water temperature and a process cooling water loop wouldutilize a heat-exchanger to create water between 60 and 70°F. Energy savings are realized notby creating medium temperature demands, but by designing a system that creates mediumtemperature water directly without wasting energy intensive low temperature water.
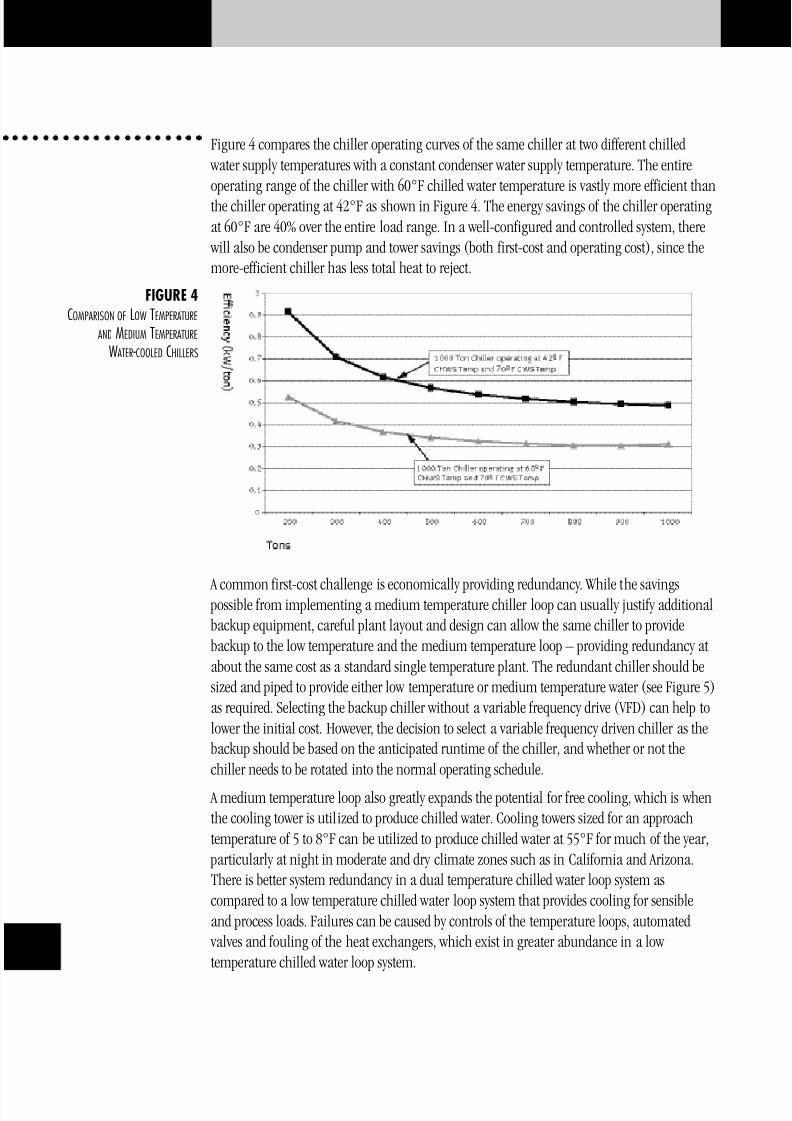
Cleanroom facilities typically need low temperature water only to handle peak outside air loads. Peak loads by definition occur 2 to 5% of the time in a year. For example, an outdoor air drybulb (DB) temperature of 95°F is used for design conditions, but 24-hour operatingconditions may be at an average outside air temperature of 70°F DB. Typically, make up air
conditioning accounts for 25–30% of the chilled water load, while recirculation air and process cooling loads account for 60–70%. See Figure 3.
Chiller efficiency is directly impacted by the chilled water supply temperature – chillersoperate most efficiently when the temperature lift (the difference in temperature between theevaporator and the condenser) is minimized. The magnitude of the lift is proportional to thedifference between the chilled water supply temperature and condenser water supply
temperature. The lift is reduced if either the condenser water supply temperature is reducedor if the chilled water supply temperature is increased. Therefore, if the medium temperature
water loads can be served by a chiller operating at the required medium supply temperature,the chiller energy required will be reduced significantly over a low temperature chiller withmixing loop or heat-exchanger.
FIGURE 3
COMPARISON OF DESIGN VERSUS
ACTUAL OPERATING CHILLED WATER
LOADS FOR A 13,000 SF
CLEANROOM FACILITY
8/6/2019 High Performance Cleanroom Air Design
http://slidepdf.com/reader/full/high-performance-cleanroom-air-design 15/48
14
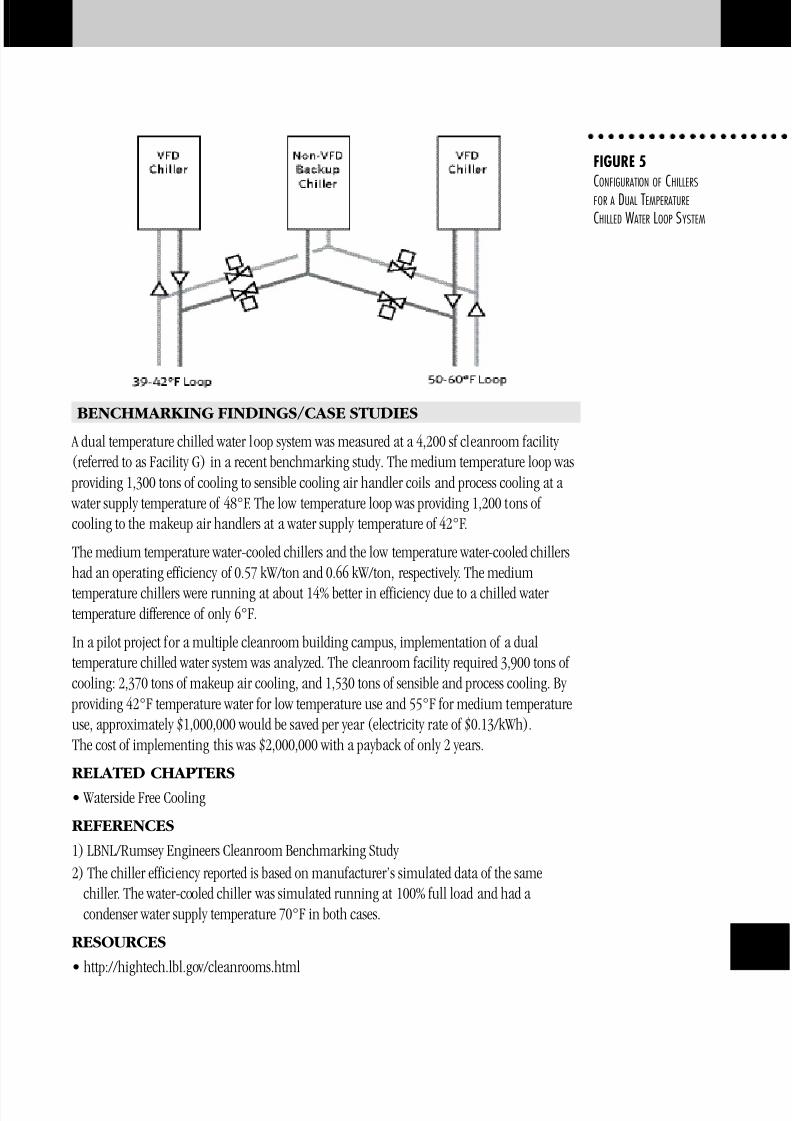
Figure 4 compares the chiller operating curves of the same chiller at two different chilled water supply temperatures with a constant condenser water supply temperature. The entireoperating range of the chiller with 60°F chilled water temperature is vastly more efficient thanthe chiller operating at 42°F as shown in Figure 4. The energy savings of the chiller operatingat 60°F are 40% over the entire load range. In a well-configured and controlled system, there
will also be condenser pump and tower savings (both first-cost and operating cost), since themore-efficient chiller has less total heat to reject.
A common first-cost challenge is economically providing redundancy. While the savings possible from implementing a medium temperature chiller loop can usually justify additionalbackup equipment, careful plant layout and design can allow the same chiller to providebackup to the low temperature and the medium temperature loop – providing redundancy atabout the same cost as a standard single temperature plant. The redundant chiller should besized and piped to provide either low temperature or medium temperature water (see Figure 5)as required. Selecting the backup chiller without a variable frequency drive (VFD) can help tolower the initial cost. However, the decision to select a variable frequency driven chiller as thebackup should be based on the anticipated runtime of the chiller, and whether or not thechiller needs to be rotated into the normal operating schedule.
A medium temperature loop also greatly expands the potential for free cooling, which is whenthe cooling tower is utilized to produce chilled water. Cooling towers sized for an approachtemperature of 5 to 8°F can be utilized to produce chilled water at 55°F for much of the year,
particularly at night in moderate and dry climate zones such as in California and Arizona.There is better system redundancy in a dual temperature chilled water loop system ascompared to a low temperature chilled water loop system that provides cooling for sensibleand process loads. Failures can be caused by controls of the temperature loops, automated
valves and fouling of the heat exchangers, which exist in greater abundance in a low temperature chilled water loop system.
FIGURE 4
COMPARISON OF LOW TEMPERATURE
AND MEDIUM TEMPERATURE
WATER-COOLED CHILLERS
8/6/2019 High Performance Cleanroom Air Design
http://slidepdf.com/reader/full/high-performance-cleanroom-air-design 16/48
1
BENCHMARKING FINDINGS/CASE STUDIES
A dual temperature chilled water loop system was measured at a 4,200 sf cleanroom facility (referred to as Facility G) in a recent benchmarking study. The medium temperature loop was
providing 1,300 tons of cooling to sensible cooling air handler coils and process cooling at a water supply temperature of 48°F. The low temperature loop was providing 1,200 tons of cooling to the makeup air handlers at a water supply temperature of 42°F.
The medium temperature water-cooled chillers and the low temperature water-cooled chillershad an operating efficiency of 0.57 kW/ton and 0.66 kW/ton, respectively. The medium
temperature chillers were running at about 14% better in efficiency due to a chilled water temperature difference of only 6°F.
In a pilot project for a multiple cleanroom building campus, implementation of a dualtemperature chilled water system was analyzed. The cleanroom facility required 3,900 tons of cooling: 2,370 tons of makeup air cooling, and 1,530 tons of sensible and process cooling. By
providing 42°F temperature water for low temperature use and 55°F for medium temperatureuse, approximately $1,000,000 would be saved per year (electricity rate of $0.13/kWh).The cost of implementing this was $2,000,000 with a payback of only 2 years.
RELATED CHAPTERS
• Waterside Free Cooling
REFERENCES
1) LBNL/Rumsey Engineers Cleanroom Benchmarking Study
2) The chiller efficiency reported is based on manufacturer’s simulated data of the samechiller. The water-cooled chiller was simulated running at 100% full load and had a condenser water supply temperature 70°F in both cases.
RESOURCES
• http://hightech.lbl.gov/cleanrooms.html
FIGURE 5
CONFIGURATION OF CHILLERS
FOR A DUAL TEMPERATURE
CHILLED WATER LOOP SYSTEM
8/6/2019 High Performance Cleanroom Air Design
http://slidepdf.com/reader/full/high-performance-cleanroom-air-design 17/48
16
4. EXHAUST OPTIMIZATION
Exhaust airflow rates are typically dictated by process equipment exhaustspecifications. Equipment manufacturers’suggested exhaust quantities have been
found to be overstated. For example, a recent study by International Sematech
found that exhaust airflows could bereduced in four devices typically found insemiconductor cleanrooms: wet benches,
gas cabinets, ion implanters and vertical furnaces. The results of the study reportedthat a reduction of total exhaust airflow by 28% exists among the four devicestested. The same study, which measured
fume capture and containmenteffectiveness, found one piece of equipment where an increasedexhaust rate was required to maintainsafe containment.
PRINCIPLES
• All air exhausted from a cleanroom has to be replaced by conditioned and filtered makeup air.
• For a cleanroom facility operating 24 hours a day, costs for exhaust air range from$3 to $5 per cubic feet per minute (cfm) annually.
• Building and fire codes require minimum amounts of exhaust for some types of cleanrooms.For example, the Uniform Building Code’s H6 classification, which covers many commonsemiconductor cleanroom spaces, requires a minimum of 1 cfm per square foot (sf) of
outside air. APPROACH
Exhaust systems are provided for a variety of reasons. In most industrial cleanrooms, exhaustdesign is driven by the need to protect occupants from hazardous fumes generated by or in
process equipment, or to remove heat generated by equipment located in the workspace.The first type of exhaust system usually involves the use of fume hoods, wet benches, or equipment-integrated process equipment fume capture systems. The fundamental approach toexhaust optimization must be to verify and improve the safety of workers in the cleanroom.
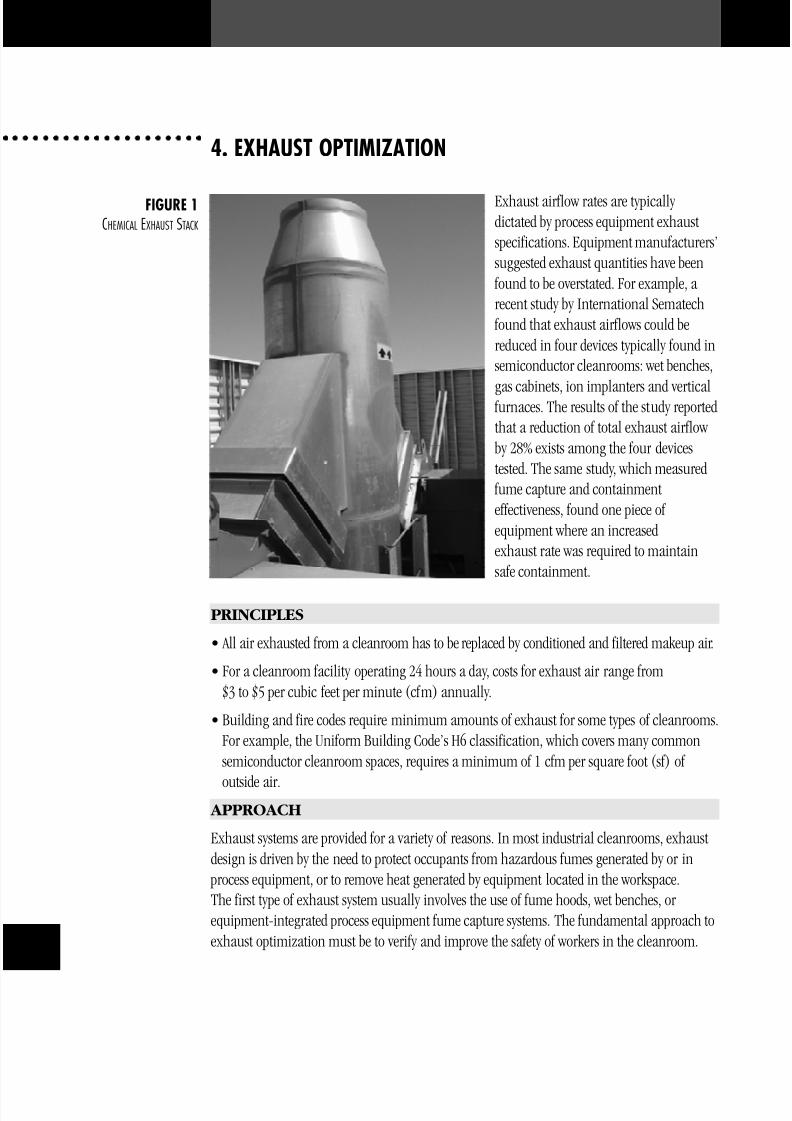
FIGURE 1
CHEMICAL EXHAUST STACK
8/6/2019 High Performance Cleanroom Air Design
http://slidepdf.com/reader/full/high-performance-cleanroom-air-design 18/48
1
Often, manufacturer recommendations for exhaust airflow rates are significantly overstatedand/or based on a crude face velocity approach to estimating exhaust rates required for containment. Good practice suggests using direct measurements of the containment to setthe exhaust rate. Methods such as tracer gas testing verify and document a safe operatingcondition, resulting in safer use. Studies indicate that proper optimization typically lowersoverall facility exhaust flow rates, resulting in energy savings in addition to the safety benefits.
Conditioning makeup air for a cleanroom is expensive. Makeup air goes through several processes before it can be delivered to a cleanroom. Dependent on the space setpoints and theoutside climate, the air has to be filtered, heated, cooled, pressurized by a fan, dehumidifiedand/or humidified. Each CFM of makeup air also results in a CFM of exhaust, which may require treatment before being released. The $3 to $5/cfm energy cost estimate for exhaust air takes into consideration energy for exhaust/scrubber fans and makeup air. Actual annual
energy costs vary depending on climate, utility costs, and the efficiency of the air handlingsystems.
Following are examples of devices found in a cleanroom that can be targeted to reduce theamount of energy-intensive make-up/exhaust air required. In these examples, most of therecommendations require operating the devices below the levels found in the Environmental,Health, and Safety (EHS) Guidelines for Semiconductor Manufacturing Equipment. In allcases, proper measurement of the equipment under its actual operating conditions is requiredto ensure and enhance operator safety. Case studies have shown that worker safety can typically be verified at rates of exhaust below manufacturer’s standard ratings. This highlights that
industry guidance and regulatory rules of thumb may be able to be relaxed provided there isadequate alternative scientific evaluation.
WET BENCHES
Wet benches are stations for wet etching and cleaning of wafers and devices. Products areautomatically processed by being dipped and agitated inside a bath. Exhaust air travels acrossthe surface of the bath to pull away toxic gases generated at the bench. Many wet benchmanufacturers use a general standard of 135–180 standard cfm (scfm) of exhaust per linear
foot of wet bench. The EHS guidelines recommend maintaining a wet bench face velocity between 40–100 feet per minute (fpm).
GAS CABINETSGas cabinets are designed to maintain a face velocity across the access window, similar tothat of a fume hood. A static pressure sensor typically maintains the face velocity to ensurea safe working environment. A baffled bypass that allows for a fixed amount of airflow to beexhausted is also a component of a gas cabinet.
A reduction in energy consumption of a gas cabinet can be achieved by eliminating the bypassairways and actively controlling the airflow via a damper based on a static pressure sensor.Once the door is opened on a gas cabinet, the exhaust flow would be increased to what wouldbe required to provide the adequate face velocity. Similarly, when the door on the cabinet is
8/6/2019 High Performance Cleanroom Air Design
http://slidepdf.com/reader/full/high-performance-cleanroom-air-design 19/48
19
closed the exhaust flow would be reduced to maintain a fixed volume of airflow correspondingto a static pressure setpoint via a volume damper.
ION IMPLANTERSIon implanters typically consist of enclosures for gas delivery systems and mechanicalequipment. Exhaust for the gas delivery systems is provided for safety. Exhaust is provided
for mechanical equipment, such as a vacuum pump, and electrical devices for heat removal.
VERTICAL FURNACE
A vertical furnace has multiple locations where exhaust is required. Typically, a vertical furnace consists of an oven chamber; gas distribution panel (gas “jungle”); liquid chemicaldistribution system; and a material handling chamber for automated wafer loading,
processing, and unloading.
FUME HOODSTy p i c a l l y, fume hoods use a variable volume and exhaust system, although low face velocity,constant volume hoods can offer the same benefits. A 25% reduction in average exhaust airflow (using a variable air volume system) results in about a 58% reduction in the fan power required. Significant additional energy savings are realized by a 25% reduction in the air that isconditioned. Savings from VAV fume hoods are heavily dependent on the fume hood operatorsunderstanding and respecting the benefits of closing the sash when the hood is not in use.
The Berkeley fume hood developed by LBNL also allows for a significant reduction in exhaustair. Tracer gas testing comparing the LBNL hood to a standard fume hood has shown that
improved containment can be achieved with a 50% reduction in exhaust airflow.BENCHMARKING FINDINGS/CASE STUDIES)
International Sematech evaluated exhaust flows for four semiconductor process tools – a gascabinet, an ion implant tool, a wet bench, and a vertical furnace – at Hewlett Packard’sCorvallis, Oregon site.1 The Sematech study focused on optimizing exhaust airflows for thesemiconductor process tools while documenting via tracer gas testing no change or animprovement in worker safety. The four tools combined resulted in an exhaust airflow reduction of 28%, from 2,994 scfm to 2,146 scfm. At an estimated $4/cfm of exhaust, over $3,300 of savings could be realized per year. Optimization of exhaust for these types of tools at
a typical semiconductor facility could amount to a savings of more than $33,000 per year.
The wet bench in the study had a width of 35 inches. The recommended exhaust flow based onmanufacturers’ standards would be 394–525 scfm. This particular bench was operating at 574scfm and 111 fpm. During optimization, the wet bench exhaust airflow was reduced by 54%.The corresponding face velocity was 66 sfpm, which was well above the face velocity recommended by the EHS guidelines. Most importantly, the wet bench was able to maintainthe concentration levels of the gases exhausted.
Testing on a gas cabinet showed that the cabinet was already safely operating at a closed accessdoor flow rate 60% below the manufacturer’s recommend airflow. The airflow and face velocity
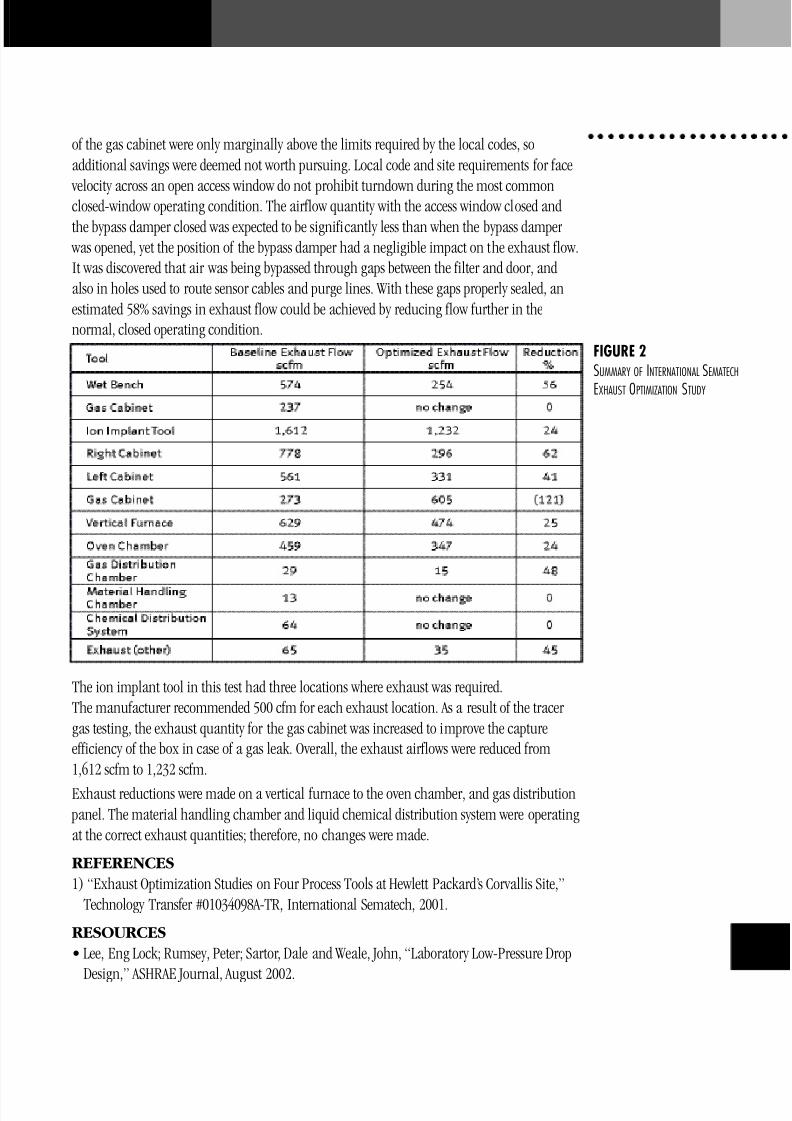
8/6/2019 High Performance Cleanroom Air Design
http://slidepdf.com/reader/full/high-performance-cleanroom-air-design 20/48
2
of the gas cabinet were only marginally above the limits required by the local codes, soadditional savings were deemed not worth pursuing. Local code and site requirements for face
velocity across an open access window do not prohibit turndown during the most commonclosed-window operating condition. The airflow quantity with the access window closed andthe bypass damper closed was expected to be significantly less than when the bypass damper
was opened, yet the position of the bypass damper had a negligible impact on the exhaust flow.It was discovered that air was being bypassed through gaps between the filter and door, andalso in holes used to route sensor cables and purge lines. With these gaps properly sealed, anestimated 58% savings in exhaust flow could be achieved by reducing flow further in thenormal, closed operating condition.
The ion implant tool in this test had three locations where exhaust was required.The manufacturer recommended 500 cfm for each exhaust location. As a result of the tracer gas testing, the exhaust quantity for the gas cabinet was increased to improve the captureefficiency of the box in case of a gas leak. Overall, the exhaust airflows were reduced from1,612 scfm to 1,232 scfm.
Exhaust reductions were made on a vertical furnace to the oven chamber, and gas distribution panel. The material handling chamber and liquid chemical distribution system were operatingat the correct exhaust quantities; therefore, no changes were made.
REFERENCES
1) “Exhaust Optimization Studies on Four Process Tools at Hewlett Packard’s Corvallis Site,”Technology Transfer #01034098A-TR, International Sematech, 2001.
RESOURCES
• Lee, Eng Lock; Rumsey, Peter; Sartor, Dale and Weale, John, “Laboratory Low-Pressure Drop
Design,” ASHRAE Journal, August 2002.
FIGURE 2
SUMMARY OF INTERNATIONAL SEMATECH
EXHAUST OPTIMIZATION STUDY
8/6/2019 High Performance Cleanroom Air Design
http://slidepdf.com/reader/full/high-performance-cleanroom-air-design 21/48
20
5. FAN-FILTER UNITS
The HVAC systems in cleanrooms may use 50 percent or more of the total cleanroom energy use. Fan energy use accounts for a significant portion (e.g., over 50%) of the HVAC energy use in cleanrooms such as ISO Classes 3, 4, or 5. Three types of air handling systems for recirculating airflows are commonly used in cleanrooms: 1) fan tower systems with pressurized
plenum, 2) ducted HEPA systems with distributed fans, and 3) systems with fan-filter units(FFUs). Because energy efficiency of the recirculation systems could vary significantly fromsystem type to system type, optimizing aerodynamic performance in air recirculation systemsappears to be a useful approach to improve energy efficiency in cleanrooms.
Providing optimal airflows through careful planning, design and operation, including air
change rate, airflow uniformity, and airflow speed, is important for controlling particlecontamination in cleanrooms. In practice, the use of FFUs in the air handling system isbecoming more and more popular because of this type of system may offer a number of advantages. Often more modular and portable than traditional recirculation airflow systems,FFUs are easier to install, and can be easily controlled and monitored to maintain filtration
performance. Energy efficiency of air handling systems using fan filter units can, however, belower than their counterparts and may vary significantly from system to system because of thedifference in energy performance, airflow paths, and the operating conditions of FFUs.
PRINCIPLES
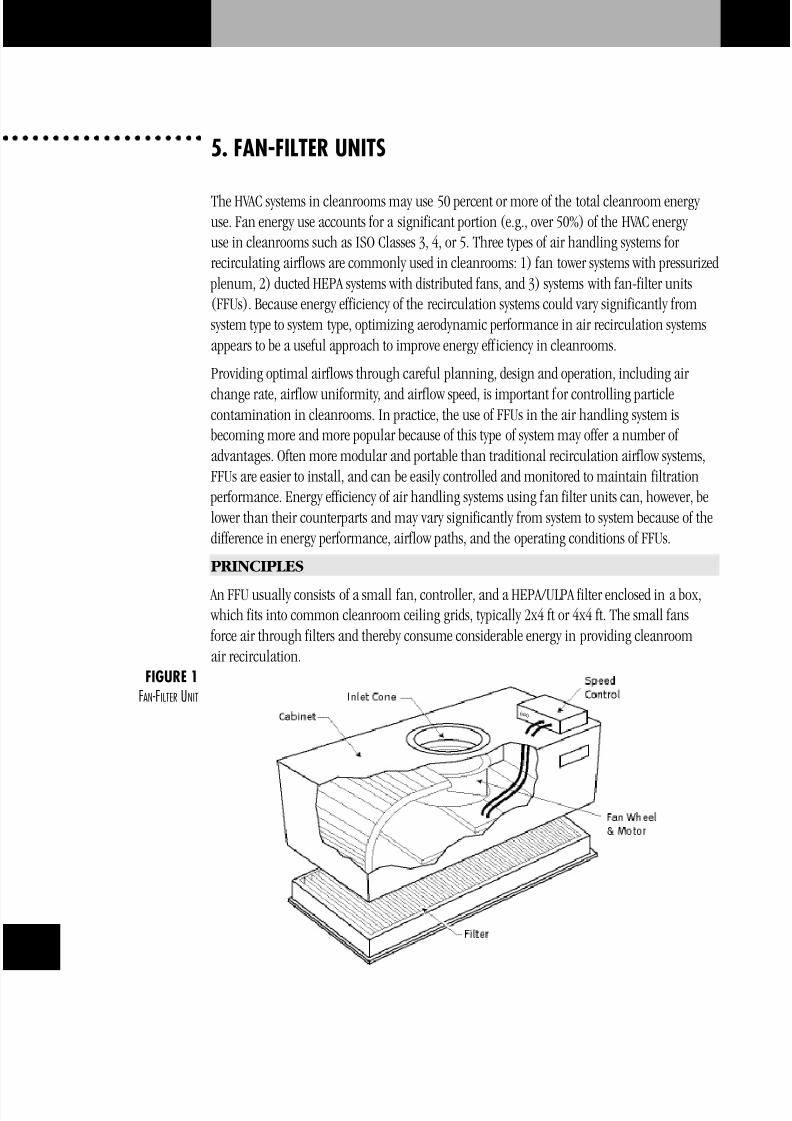
An FFU usually consists of a small fan, controller, and a HEPA/ULPA filter enclosed in a box, which fits into common cleanroom ceiling grids, typically 2x4 ft or 4x4 ft. The small fans force air through filters and thereby consume considerable energy in providing cleanroomair recirculation.
FIGURE 1
FAN-FILTER UNIT
8/6/2019 High Performance Cleanroom Air Design
http://slidepdf.com/reader/full/high-performance-cleanroom-air-design 22/48
2
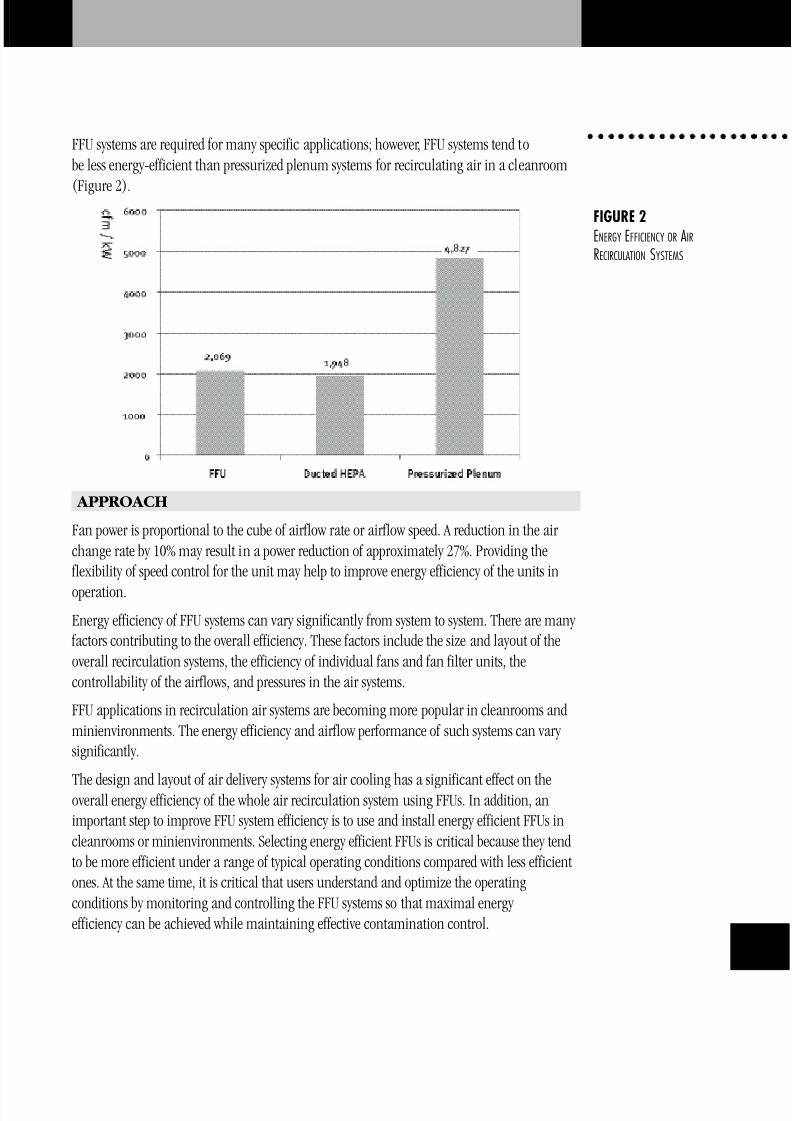
FFU systems are required for many specific applications; however, FFU systems tend tobe less energy-efficient than pressurized plenum systems for recirculating air in a cleanroom(Figure 2).
APPROACH
Fan power is proportional to the cube of airflow rate or airflow speed. A reduction in the air change rate by 10% may result in a power reduction of approximately 27%. Providing the
flexibility of speed control for the unit may help to improve energy efficiency of the units in
operation.
Energy efficiency of FFU systems can vary significantly from system to system. There are many factors contributing to the overall efficiency. These factors include the size and layout of theoverall recirculation systems, the efficiency of individual fans and fan filter units, thecontrollability of the airflows, and pressures in the air systems.
FFU applications in recirculation air systems are becoming more popular in cleanrooms andminienvironments. The energy efficiency and airflow performance of such systems can vary significantly.
The design and layout of air delivery systems for air cooling has a significant effect on theoverall energy efficiency of the whole air recirculation system using FFUs. In addition, animportant step to improve FFU system efficiency is to use and install energy efficient FFUs incleanrooms or minienvironments. Selecting energy efficient FFUs is critical because they tendto be more efficient under a range of typical operating conditions compared with less efficientones. At the same time, it is critical that users understand and optimize the operatingconditions by monitoring and controlling the FFU systems so that maximal energy efficiency can be achieved while maintaining effective contamination control.
FIGURE 2
ENERGY EFFICIENCY OR AIR
RECIRCULATION SYSTEMS
8/6/2019 High Performance Cleanroom Air Design
http://slidepdf.com/reader/full/high-performance-cleanroom-air-design 23/48
22
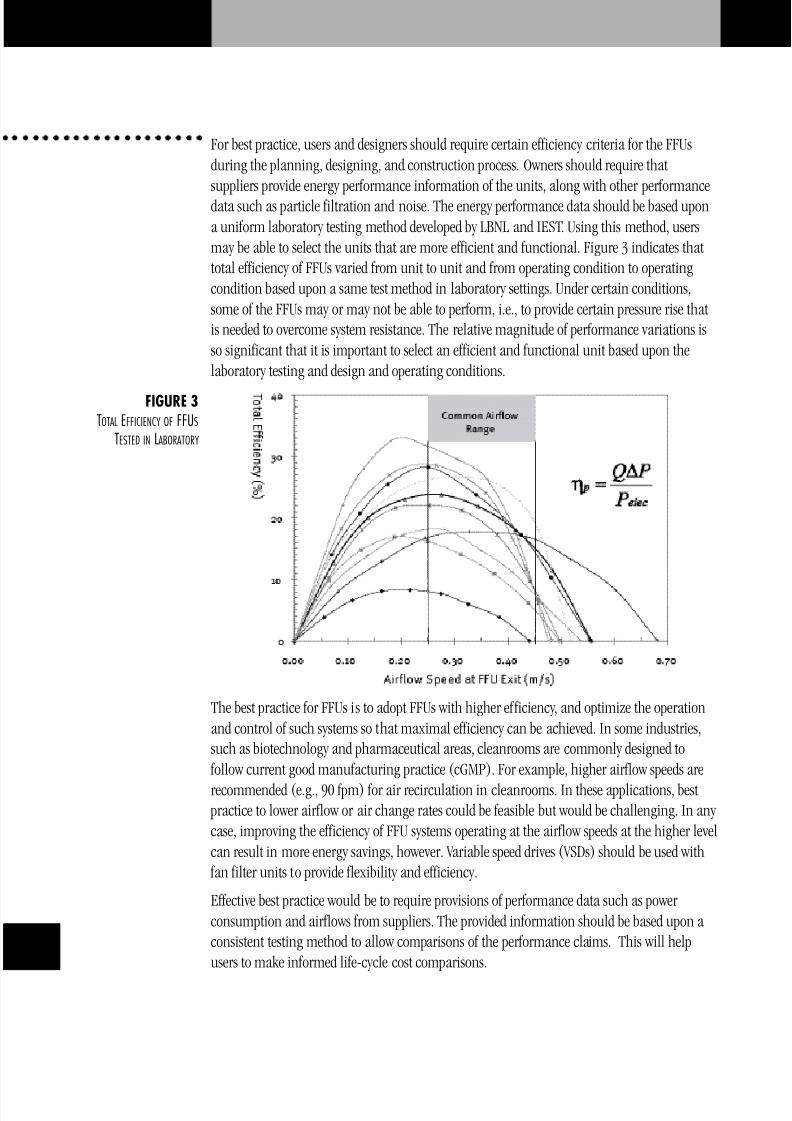
For best practice, users and designers should require certain efficiency criteria for the FFUsduring the planning, designing, and construction process. Owners should require thatsuppliers provide energy performance information of the units, along with other performancedata such as particle filtration and noise. The energy performance data should be based upona uniform laboratory testing method developed by LBNL and IEST. Using this method, usersmay be able to select the units that are more efficient and functional. Figure 3 indicates thattotal efficiency of FFUs varied from unit to unit and from operating condition to operatingcondition based upon a same test method in laboratory settings. Under certain conditions,some of the FFUs may or may not be able to perform, i.e., to provide certain pressure rise thatis needed to overcome system resistance. The relative magnitude of performance variations isso significant that it is important to select an efficient and functional unit based upon thelaboratory testing and design and operating conditions.
The best practice for FFUs is to adopt FFUs with higher efficiency, and optimize the operationand control of such systems so that maximal efficiency can be achieved. In some industries,such as biotechnology and pharmaceutical areas, cleanrooms are commonly designed to
follow current good manufacturing practice (cGMP). For example, higher airflow speeds are
recommended (e.g., 90 fpm) for air recirculation in cleanrooms. In these applications, best practice to lower airflow or air change rates could be feasible but would be challenging. In any case, improving the efficiency of FFU systems operating at the airflow speeds at the higher levelcan result in more energy savings, however. Variable speed drives (VSDs) should be used with
fan filter units to provide flexibility and efficiency.
Effective best practice would be to require provisions of performance data such as power consumption and airflows from suppliers. The provided information should be based upon a consistent testing method to allow comparisons of the performance claims. This will helpusers to make informed life-cycle cost comparisons.
FIGURE 3
TOTAL EFFICIENCY OF FFUS
TESTED IN LABORATORY
8/6/2019 High Performance Cleanroom Air Design
http://slidepdf.com/reader/full/high-performance-cleanroom-air-design 24/48
2
BENCHMARKING FINDINGS/CASE STUDIES
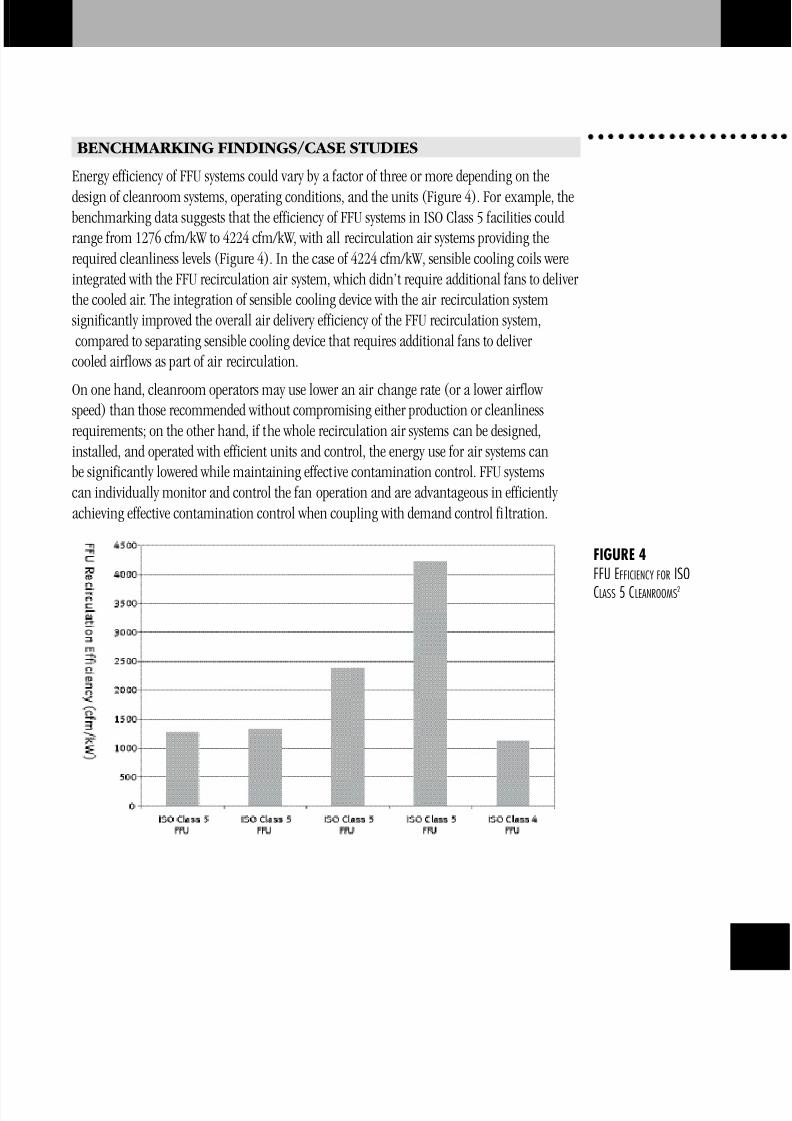
Energy efficiency of FFU systems could vary by a factor of three or more depending on the
design of cleanroom systems, operating conditions, and the units (Figure 4). For example, thebenchmarking data suggests that the efficiency of FFU systems in ISO Class 5 facilities couldrange from 1276 cfm/kW to 4224 cfm/kW, with all recirculation air systems providing therequired cleanliness levels (Figure 4). In the case of 4224 cfm/kW, sensible cooling coils wereintegrated with the FFU recirculation air system, which didn’t require additional fans to deliver the cooled air. The integration of sensible cooling device with the air recirculation systemsignificantly improved the overall air delivery efficiency of the FFU recirculation system,compared to separating sensible cooling device that requires additional fans to deliver
cooled airflows as part of air recirculation.
On one hand, cleanroom operators may use lower an air change rate (or a lower airflow speed) than those recommended without compromising either production or cleanlinessrequirements; on the other hand, if the whole recirculation air systems can be designed,installed, and operated with efficient units and control, the energy use for air systems canbe significantly lowered while maintaining effective contamination control. FFU systemscan individually monitor and control the fan operation and are advantageous in efficiently achieving effective contamination control when coupling with demand control filtration.
FIGURE 4
FFU EFFICIENCY FOR ISO
CLASS 5 CLEANROOMS2
8/6/2019 High Performance Cleanroom Air Design
http://slidepdf.com/reader/full/high-performance-cleanroom-air-design 25/48
24
RELATED CHAPTERS
• Air Change Rates
• Minienvironments• Demand Controlled Filtration
REFERENCES
1) LBNL/Rumsey Engineers Cleanroom Benchmarking Study
2) ibid
RESOURCES
• Xu, T. 2003. Performance Evaluation of Cleanroom Environmental Systems, Journal of the IEST, Vol 46: 66 73. The Institute of Environmental Sciences and Technology (IEST),
5005 Newport Drive, Rolling Meadows, Illinois 60008-3841, USA.• Xu, T. 2004. Efficient Airflow Design for Cleanrooms Improves Business Bottom Lines.
Journal of the IEST, Vol. 47 (1): 24 28, Institute of Environmental Sciences and Technology (IEST), Rolling Meadows, Illinois 60008-3841, USA.
• IEST. 1998. Considerations in Cleanroom Design (IEST RP-CC012.1), Institute of Environmental Sciences and Technology (IEST), Rolling Meadows, Illinois 60008-3841,USA.
• Xu, T. 2005. Laboratory Method of Testing Energy Performance of Fan-Filter Units, Version 1.3 (2005), LBNL 54626.
• IEST CC RP36.1 (Draft). Testing Fan Filter Units. Draft Recommended Practice.The Institute of Environmental Sciences and Technology (IEST), 5005 Newport Drive,Rolling Meadows, Illinois 60008-3841, USA.
• Xu, T., and M. Jeng. 2004. Laboratory Evaluation of Fan-Filter Units’ Aerodynamic andEnergy Performance. Journal of the IEST, Vol 47(1): 66 73. The Institute of EnvironmentalSciences and Technology (IEST), 5005 Newport Drive, Rolling Meadows, Illinois 60008-3841, USA.
• Gale, S. 2004. FFUs: Setting a course for energy efficiency, Special Report, Cleanroom
Magazine, September 2004,http://cr.pennnet.com/Articles/Article_Display.cfm?Section=Articles&Subsection=Display&Ar ticle_ID=211810
8/6/2019 High Performance Cleanroom Air Design
http://slidepdf.com/reader/full/high-performance-cleanroom-air-design 26/48
2
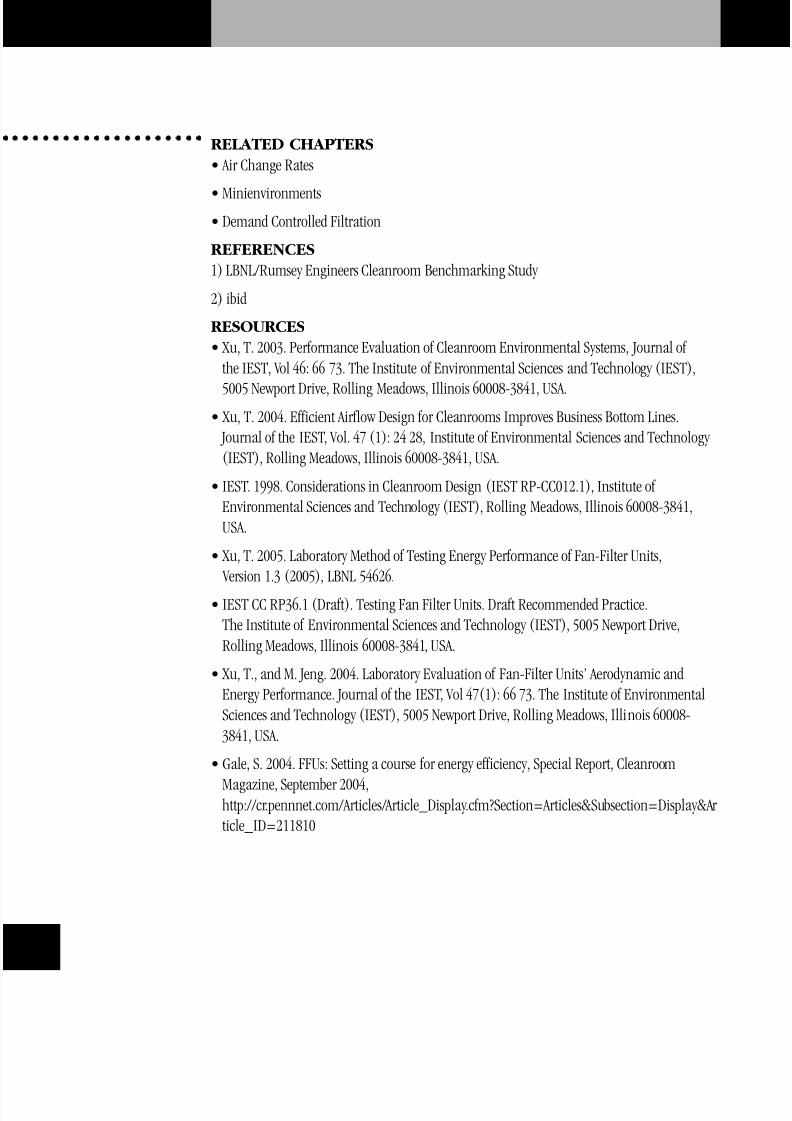
6. LOW PRESSURE DROP AIR SYSTEMS
Fan energy can account for 20 to 40% of total cleanroom energy use1. Fan energy use isdirectly proportional to the pressure drop that the fan is pushing air through. Thus, the morerestrictive the supply system, the higher the pressure drop, and the higher the fan energy use.Strategies for lowering the pressure drop include lower face velocity air handling units, low
pressure drop filters, optimized design of ducting and air paths, including open plenum andcentralized air handler types of configurations. Low pressure drop designs are applicable to
all fan systems from recirculation air handler systems to makeup air handlers. Other benefitsof low pressure drop systems are less noise, more effective dehumidification, better filter effectiveness, and in some cases lower total first cost (when avoided electrical and noiseabatement equipment is included in the cost analysis).
FIGURE 1
RECIRCULATION AIR HANDLING SYSTEM
DESIGN SCHEMATIC AT FACILITY C
FIGURE 2
PRESSURE DROP DESIGN TARGETS
8/6/2019 High Performance Cleanroom Air Design
http://slidepdf.com/reader/full/high-performance-cleanroom-air-design 27/48
26
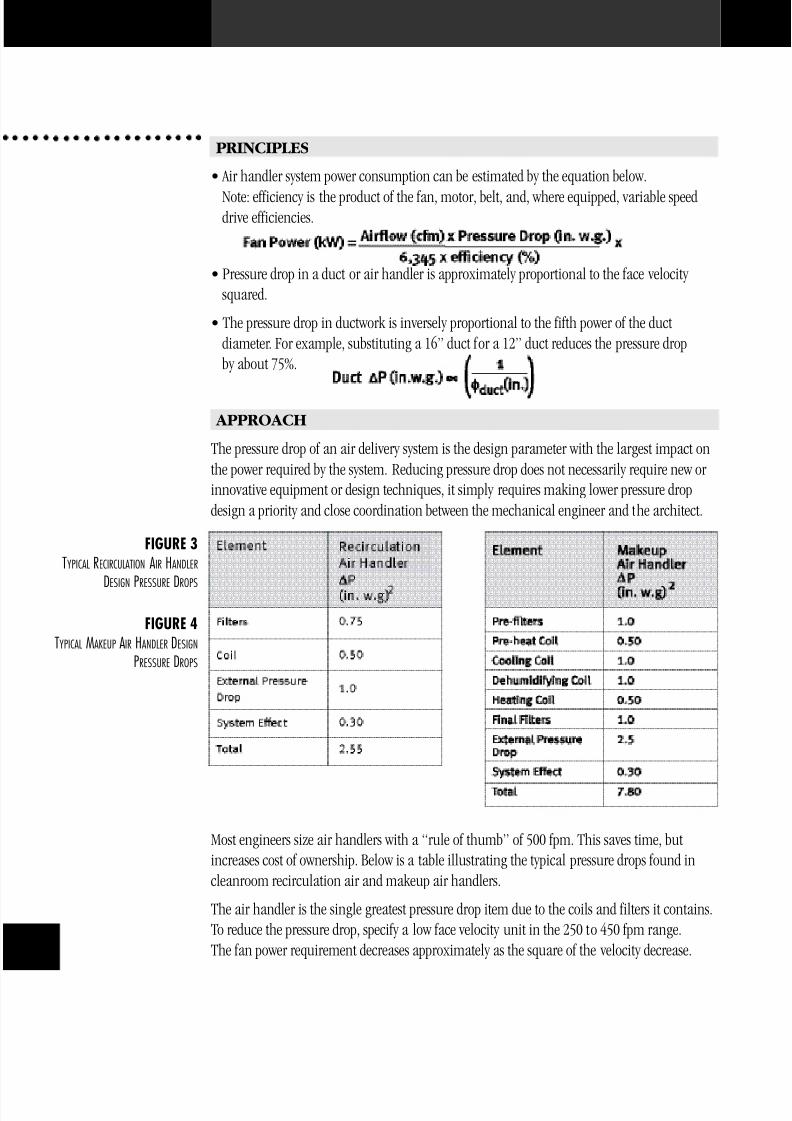
PRINCIPLES
• Air handler system power consumption can be estimated by the equation below.
Note: efficiency is the product of the fan, motor, belt, and, where equipped, variable speeddrive efficiencies.
• Pressure drop in a duct or air handler is approximately proportional to the face velocity squared.
• The pressure drop in ductwork is inversely proportional to the fifth power of the ductdiameter. For example, substituting a 16” duct for a 12” duct reduces the pressure dropby about 75%.
APPROACH
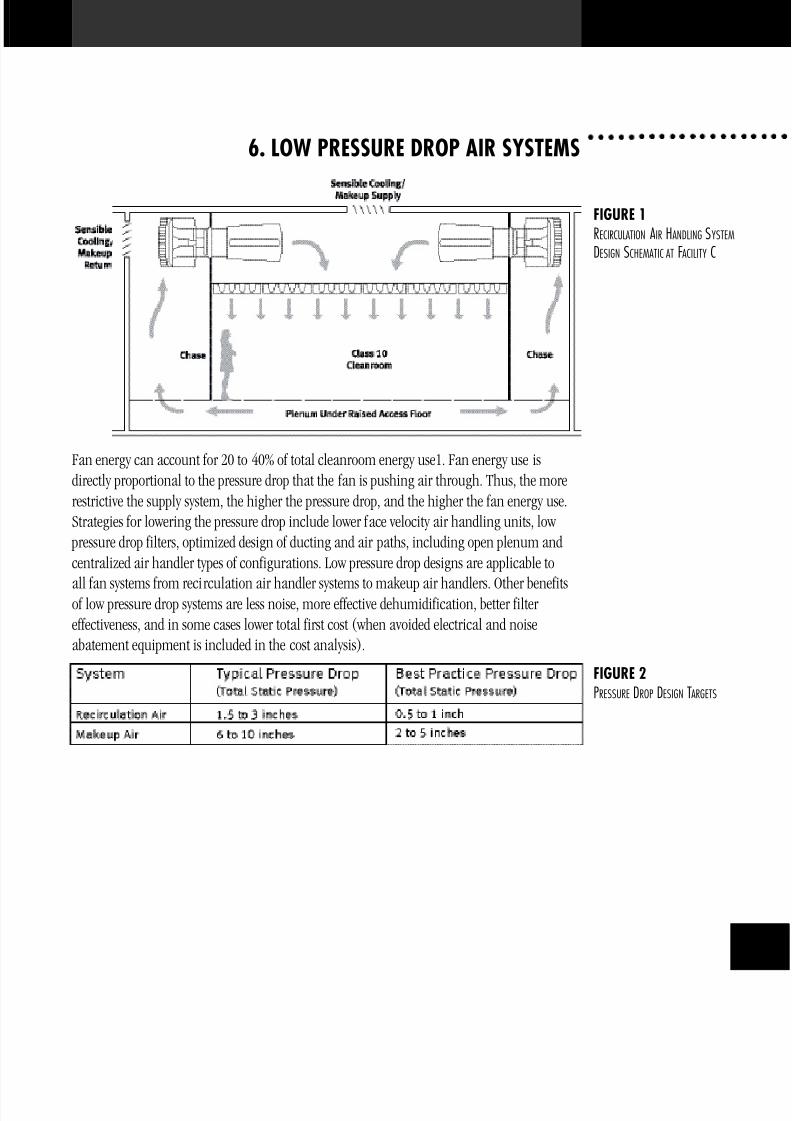
The pressure drop of an air delivery system is the design parameter with the largest impact onthe power required by the system. Reducing pressure drop does not necessarily require new or innovative equipment or design techniques, it simply requires making lower pressure dropdesign a priority and close coordination between the mechanical engineer and the architect.
Most engineers size air handlers with a “rule of thumb” of 500 fpm. This saves time, butincreases cost of ownership. Below is a table illustrating the typical pressure drops found incleanroom recirculation air and makeup air handlers.
The air handler is the single greatest pressure drop item due to the coils and filters it contains.To reduce the pressure drop, specify a low face velocity unit in the 250 to 450 fpm range.The fan power requirement decreases approximately as the square of the velocity decrease.
FIGURE 3
TYPICAL RECIRCULATION AIR HANDLER
DESIGN
PRESSURE
DROPS
FIGURE 4
TYPICAL MAKEUP AIR HANDLER DESIGN
PRESSURE DROPS
8/6/2019 High Performance Cleanroom Air Design
http://slidepdf.com/reader/full/high-performance-cleanroom-air-design 28/48
2
The standard arguments against reducing the face velocity are usually refuted by a lifecyclecost analysis that includes the high energy costs of a cleanroom system, the continuousoperation, and the additional first costs associated with supplying electrical, fans, motors,drives, and silencers to higher pressure drop systems. The need for additional floor spaceis a non-issue when rooftop units are used and can be mitigated through close designcoordination with the architect in most cases.
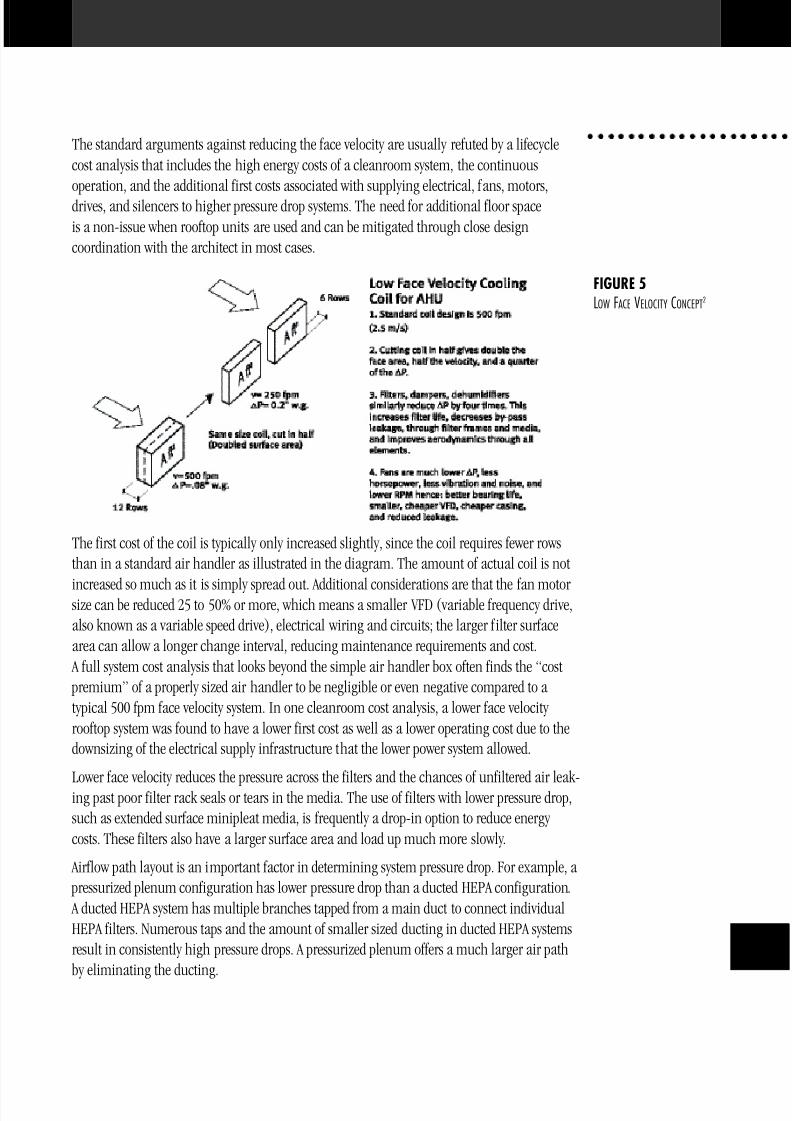
The first cost of the coil is typically only increased slightly, since the coil requires fewer rowsthan in a standard air handler as illustrated in the diagram. The amount of actual coil is not
increased so much as it is simply spread out. Additional considerations are that the fan motor size can be reduced 25 to 50% or more, which means a smaller VFD (variable frequency drive,also known as a variable speed drive), electrical wiring and circuits; the larger filter surfacearea can allow a longer change interval, reducing maintenance requirements and cost.
A full system cost analysis that looks beyond the simple air handler box often finds the “cost premium” of a properly sized air handler to be negligible or even negative compared to a typical 500 fpm face velocity system. In one cleanroom cost analysis, a lower face velocity rooftop system was found to have a lower first cost as well as a lower operating cost due to thedownsizing of the electrical supply infrastructure that the lower power system allowed.
Lower face velocity reduces the pressure across the filters and the chances of unfiltered air leak-ing past poor filter rack seals or tears in the media. The use of filters with lower pressure drop,such as extended surface minipleat media, is frequently a drop-in option to reduce energy costs. These filters also have a larger surface area and load up much more slowly.
Airflow path layout is an important factor in determining system pressure drop. For example, a pressurized plenum configuration has lower pressure drop than a ducted HEPA configuration. A ducted HEPA system has multiple branches tapped from a main duct to connect individualHEPA filters. Numerous taps and the amount of smaller sized ducting in ducted HEPA systemsresult in consistently high pressure drops. A pressurized plenum offers a much larger air pathby eliminating the ducting.
FIGURE 5
LOW FACE VELOCITY CONCEPT2
8/6/2019 High Performance Cleanroom Air Design
http://slidepdf.com/reader/full/high-performance-cleanroom-air-design 29/48
28
BENCHMARKING FINDINGS/CASE STUDIES
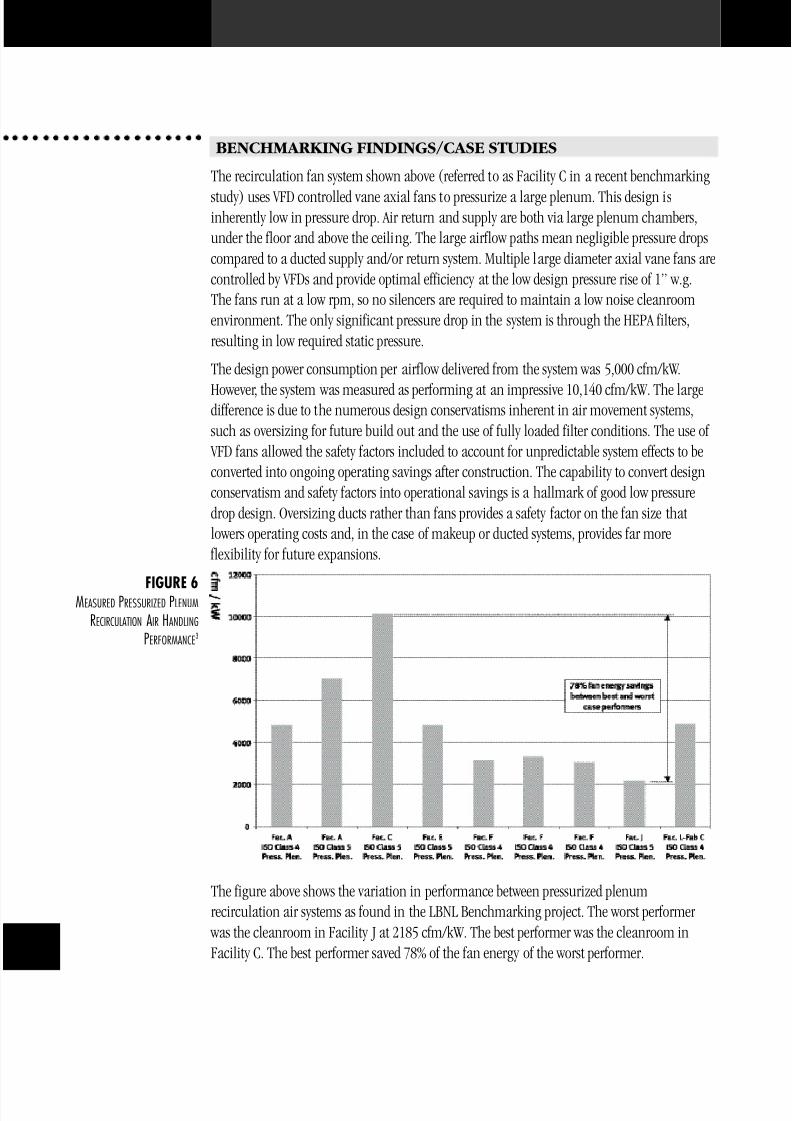
The recirculation fan system shown above (referred to as Facility C in a recent benchmarking
study) uses VFD controlled vane axial fans to pressurize a large plenum. This design isinherently low in pressure drop. Air return and supply are both via large plenum chambers,under the floor and above the ceiling. The large airflow paths mean negligible pressure dropscompared to a ducted supply and/or return system. Multiple large diameter axial vane fans arecontrolled by VFDs and provide optimal efficiency at the low design pressure rise of 1” w.g.The fans run at a low rpm, so no silencers are required to maintain a low noise cleanroomenvironment. The only significant pressure drop in the system is through the HEPA filters,resulting in low required static pressure.
The design power consumption per airflow delivered from the system was 5,000 cfm/kW.
However, the system was measured as performing at an impressive 10,140 cfm/kW. The largedifference is due to the numerous design conservatisms inherent in air movement systems,such as oversizing for future build out and the use of fully loaded filter conditions. The use of
VFD fans allowed the safety factors included to account for unpredictable system effects to beconverted into ongoing operating savings after construction. The capability to convert designconservatism and safety factors into operational savings is a hallmark of good low pressuredrop design. Oversizing ducts rather than fans provides a safety factor on the fan size thatlowers operating costs and, in the case of makeup or ducted systems, provides far more
flexibility for future expansions.
The figure above shows the variation in performance between pressurized plenumrecirculation air systems as found in the LBNL Benchmarking project. The worst performer
was the cleanroom in Facility J at 2185 cfm/kW. The best performer was the cleanroom inFacility C. The best performer saved 78% of the fan energy of the worst performer.
FIGURE 6
MEASURED PRESSURIZED PLENUM
RECIRCULATION AIR HANDLING
PERFORMANCE3

8/6/2019 High Performance Cleanroom Air Design
http://slidepdf.com/reader/full/high-performance-cleanroom-air-design 30/48
2
The significant difference is due to the air pressure drop of the recirculation air handlingsystem. The total operating pressure drop for the recirculation fan system at Facility J was1.9 inches w.g. as compared to 0.45 inches w.g. for Facility C.
RELATED CHAPTERS
• Air Change Rates
• Demand Controlled Filtration
• Fan-filter Units
• Recirculation Air System Types
REFERENCES
1) LBNL/Rumsey Engineers Cleanroom Benchmarking Study
2) Drawing courtesy of Lee Eng Lock, E-Cube, Pte. LTD. (www.eco-web.com)
3) LBNL/Rumsey Engineers Cleanroom Benchmarking Study
RESOURCES
• Xu, Tengfang, “Considerations for Efficient Airflow Design in Cleanrooms,” Journal of theIEST, Volume 47, 2004.
• Xu, Tengfang, “Performance Evaluation of Cleanroom Environmental Systems,” Journal of the IEST, Volume 46, August 2003.
• Jaisinghani, Raj, “New ways of thinking about air handling,” Cleanrooms magazine,
January 2001.
• http://hightech.lbl.gov/
• Clean Spaces, Chapter 16, ASHRAE HVAC Applications handbook, 2003.
8/6/2019 High Performance Cleanroom Air Design
http://slidepdf.com/reader/full/high-performance-cleanroom-air-design 31/48
30
7. MINIENVIROMENTS
Cleanroom air recirculation systems typically account for a significant portion of the HVACenergy use in cleanrooms. High electric power density is normally required for fans to deliver large volume of airflows that were designed, supplied, recirculated, and exhausted within a given time. With the increasing demand for specific contamination control, it is important tooptimize design of clean spaces. Best practice in cleanroom air system design includes rightsizing the systems in cleanrooms and adopting minienvironments. Implementing andintegrating minienvironments in cleanrooms can improve contamination control and savesignificant energy.
PRINCIPLES
A minienvironment is a localized environment created by an enclosure to isolate a product or process from the surrounding environment. The advantages in using minienvironmentsinclude the following:
• Minienvironments may create better contamination control and process integration.
• Minienvironments may maintain better contamination control by better control of pressuredifference or through use of unidirectional airflows, e.g., cleanliness class upgrade required
for certain process.
• Minienvironments may potentially reduce energy costs.
The use of fan filter units (FFU) in minienvironments is common. The energy efficiency of such air delivery systems can vary significantly because of the difference in energy
performance, airflow paths, and operating conditions. Simply adding minienvironments with fan filter units in an existing cleanroom will increase power density and energy intensity for delivering airflow in the space served, if everything else is unchanged. However, by consideringcontamination control requirements in the various spaces minienvironments can be integrated
with the surrounding cleanroom to optimize the overall electric power demand for the facility and to achieve specific cleanliness in each area. In addition, selecting energy efficientminienvironment systems will further improve the overall energy efficiency of the clean spaces.
APPROACH
Although minienvironments are becoming more popular, their energy and airflow performance can vary significantly. Owners, designers, suppliers and operators need tobest use resources to determine the adoption of minienvironments, their integration withsurrounding cleanroom spaces, and optimize the design, control, and installation of theminienvironments. Best practice with regard to improving energy efficient cleanrooms andminienvironments includes the following:
• Determine the cleanliness requirements for contamination control for both
8/6/2019 High Performance Cleanroom Air Design
http://slidepdf.com/reader/full/high-performance-cleanroom-air-design 32/48
3
minienvironments and the surrounding cleanroom. For example, cleanliness levels do notneed to be more stringent than the process occurring in the cleanroom requires.
• Use computation fluid dynamics (CFD) modeling and particle count monitoring or experiment to assist in the design process.
• Determine the airflow velocities as well as air change rates. Using optimal air changerates will allow designers to lower construction costs as well as to reduce energy costs whilemaintaining the high level of air cleanliness that is required in cleanroom facilities. Oftenin minievironements, what is needed is a positive pressure relative to the surrounding spacesand high airflows through the minienvironment are not necessarily required.
• Improve efficiency of the minienvironment systems and design, including usingenergy-efficient fan filter units and better controls.
• Optimize airflow rates of the surrounding cleanroom areas and where possible, reduceairflow rates whenever feasible.
BENCHMARKING FINDINGS/CASE STUDIES
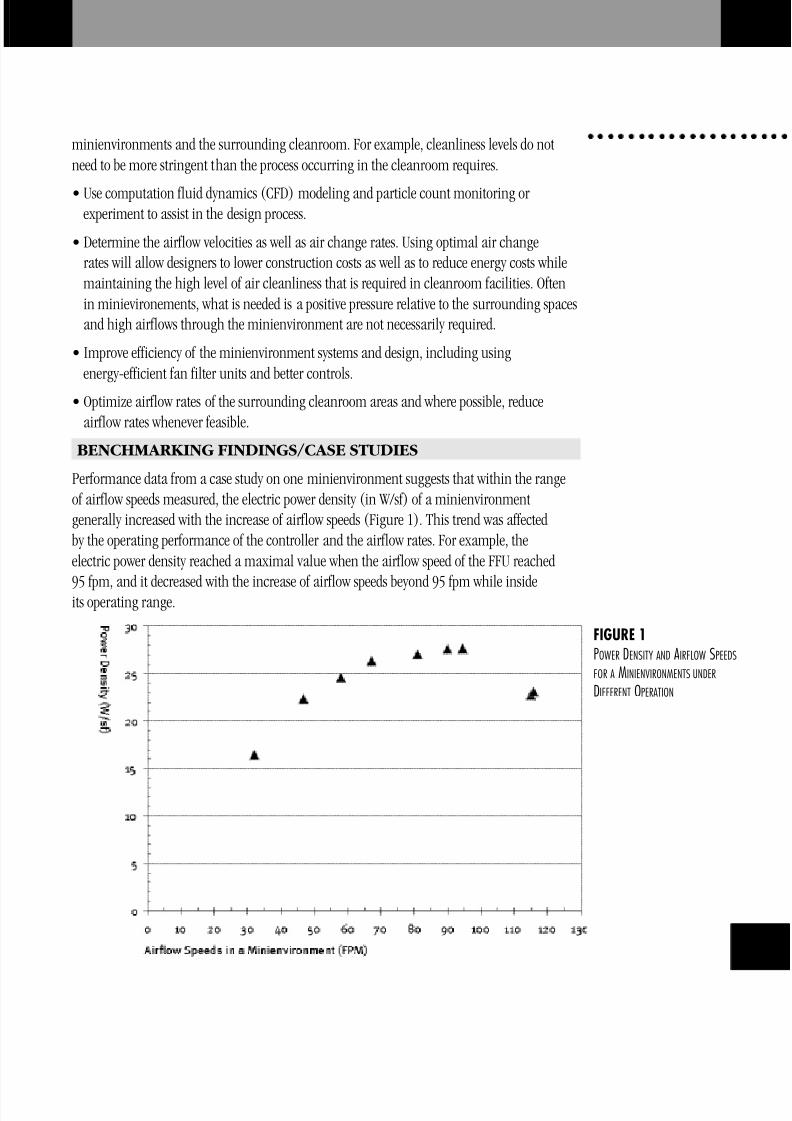
Performance data from a case study on one minienvironment suggests that within the rangeof airflow speeds measured, the electric power density (in W/sf) of a minienvironmentgenerally increased with the increase of airflow speeds (Figure 1). This trend was affectedby the operating performance of the controller and the airflow rates. For example, theelectric power density reached a maximal value when the airflow speed of the FFU reached
95 fpm, and it decreased with the increase of airflow speeds beyond 95 fpm while insideits operating range.
FIGURE 1
POWER DENSITY AND AIRFLOW SPEEDS
FOR A MINIENVIRONMENTS UNDER
DIFFERENT OPERATION
8/6/2019 High Performance Cleanroom Air Design
http://slidepdf.com/reader/full/high-performance-cleanroom-air-design 33/48
32
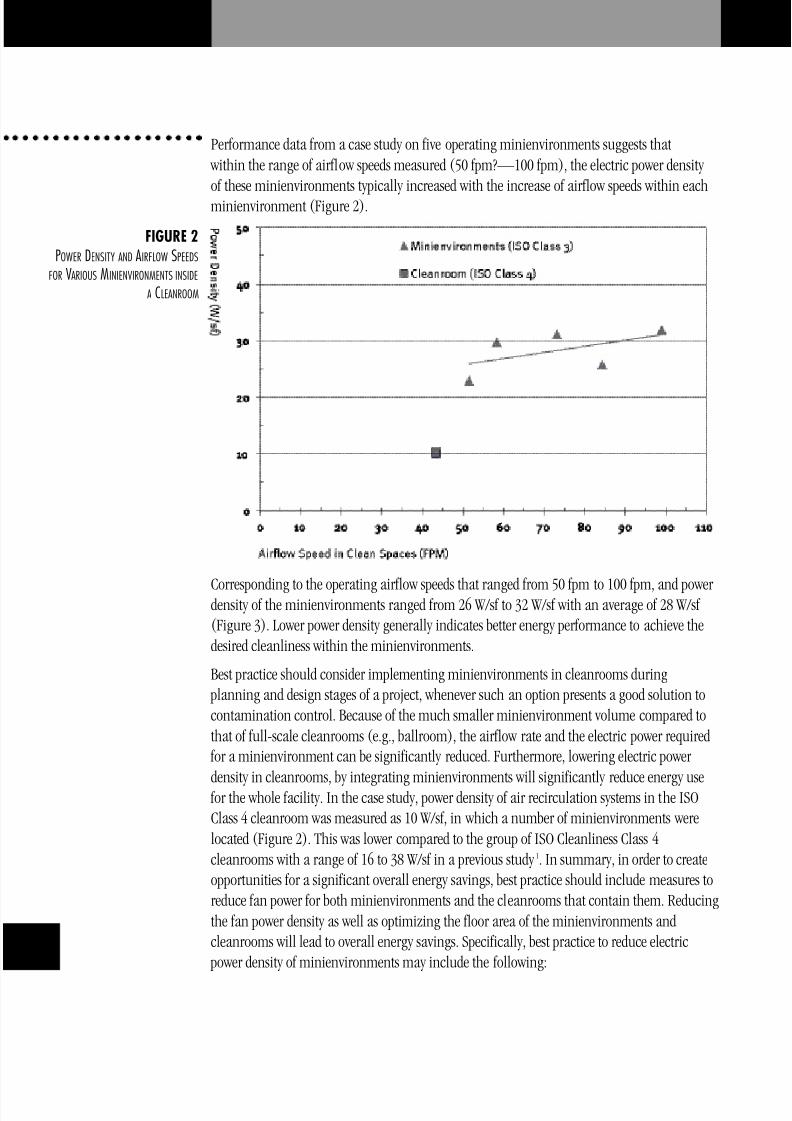
Performance data from a case study on five operating minienvironments suggests that within the range of airflow speeds measured (50 fpm?—100 fpm), the electric power density of these minienvironments typically increased with the increase of airflow speeds within eachminienvironment (Figure 2).
Corresponding to the operating airflow speeds that ranged from 50 fpm to 100 fpm, and power density of the minienvironments ranged from 26 W/sf to 32 W/sf with an average of 28 W/sf (Figure 3). Lower power density generally indicates better energy performance to achieve thedesired cleanliness within the minienvironments.
Best practice should consider implementing minienvironments in cleanrooms during planning and design stages of a project, whenever such an option presents a good solution tocontamination control. Because of the much smaller minienvironment volume compared tothat of full-scale cleanrooms (e.g., ballroom), the airflow rate and the electric power required
for a minienvironment can be significantly reduced. Furthermore, lowering electric power
density in cleanrooms, by integrating minienvironments will significantly reduce energy use for the whole facility. In the case study, power density of air recirculation systems in the ISOClass 4 cleanroom was measured as 10 W/sf, in which a number of minienvironments werelocated (Figure 2). This was lower compared to the group of ISO Cleanliness Class 4cleanrooms with a range of 16 to 38 W/sf in a previous study 1. In summary, in order to createopportunities for a significant overall energy savings, best practice should include measures toreduce fan power for both minienvironments and the cleanrooms that contain them. Reducingthe fan power density as well as optimizing the floor area of the minienvironments andcleanrooms will lead to overall energy savings. Specifically, best practice to reduce electric
power density of minienvironments may include the following:
FIGURE 2
POWER DENSITY AND AIRFLOW SPEEDS
FOR VARIOUS MINIENVIRONMENTS INSIDE
A CLEANROOM
8/6/2019 High Performance Cleanroom Air Design
http://slidepdf.com/reader/full/high-performance-cleanroom-air-design 34/48
3
• Optimize (e.g., reduce) the airflow speeds and/or pressure inside the minienvironment.
• Improve the energy efficiency of the air systems, e.g., choose an efficient FFU, for the
minienvironment.In addition, as part of integrating minienvironments to cleanroom spaces, best practice toreduce overall electric power density is to reduce power density of the primary cleanroomsurrounding the minienvironments. The following enlist some of the best practice approaches:
• Optimize airflow rates and air change rates, e.g., reduce airflow speeds in the cleanroom.
• Select the right type and size of air handling unit for recirculation.
• Optimize exhaust and make up air systems.
• Adopt variable speed drive motors in air systems.
• Minimize system pressure drop.
RELATED CHAPTERS• Air Change Rates
• Demand Controlled Filtration
• Fan Filter Units
REFERENCES
1) Xu, T., and M. Jeng. 2004. Laboratory Evaluation of Fan filter Units’ Aerodynamic andEnergy Performance. Journal of the IEST, Vol 47(1): 66 73. The Institute of EnvironmentalSciences and Technology (IEST), Rolling Meadows, Illinois 60008-3841, USA.
RESOURCES• Tannous, G. 1996. Air Flow Simulation in a Minienvironment, Solid State Technology, July
1996, pp. 201-207.
• Tannous, G. 1997. Optimization of a minienvironment design using computational fluiddynamics. Journal of the IEST, Vol. 40 (1): 29 34.
• Rothman, L., R. Miller, R. Wang, T. Baechle, S. Silverman; and D. Cooper. 1995. SEMATECHminienvironment benchmarking project. Journal of the IEST, May/Jun 1995, Vol. 38 (3): 36 41.
• Xu, T. 2005. Investigating the Performance of a Minienvironment System. Proceedings of 51st ESTECH Conference, Schaumburg, Illinois, The Institute of Environmental Sciencesand Technology (IEST). LBNL Report, LBNL 56767.
• Xu, T. 2005. Opportunities for Sustainable Design and Operation of Clean Spaces: A CaseStudy on Minienvironment System Performance. Final Report to California Energy Commission, LBNL 56312. May 2005.

8/6/2019 High Performance Cleanroom Air Design
http://slidepdf.com/reader/full/high-performance-cleanroom-air-design 35/48
34
• Xu, T. 2005. Energy Implications of Minienvironments in Clean Spaces: A Case Study onMinienvironment Energy End use and Performance. Final Report to California Energy Commission, LBNL 57503 (draft).
• Xu, T. 2004. Efficient Airflow Design for Cleanrooms Improves Business Bottom Lines. Journal of the IEST, Vol. 47 (1): 24 28, Institute of Environmental Sciences and Technology (IEST), Rolling Meadows, Illinois 60008-3841, USA.
• Gale, S. 2004. FFUs: Setting a course for energy efficiency, Special Report, CleanroomMagazine, September 2004,http://cr.pennnet.com/Articles/Article_Display.cfm?Section=Articles&Subsection=Display&Ar ticle_ID=211810
• The Institute of Environmental Sciences and Technology (IEST). 1998. IEST RP CC012.1:
Considerations for Cleanroom Design. Handbook of Recommended Practices,Contamination Control Division. Rolling Meadows, IL 60008-3841, USA.
• The Institute of Environmental Sciences and Technology (IEST). 2002. IEST RP CC028.1:Minienvironments. Handbook of Recommended Practices, Contamination Control Division.Rolling Meadows, IL 60008-3841, USA.
• International Organization for Standardization (ISO). 2004. ISO 14644 7, Cleanrooms andassociate controlled environments - Part 7: Separative Devices (clean air hoods, gloveboxes,isolators and minienvironments). The Institute of Environmental Sciences and Technology (IEST). Rolling Meadows, IL 60008-3841, USA.
8/6/2019 High Performance Cleanroom Air Design
http://slidepdf.com/reader/full/high-performance-cleanroom-air-design 36/48
3
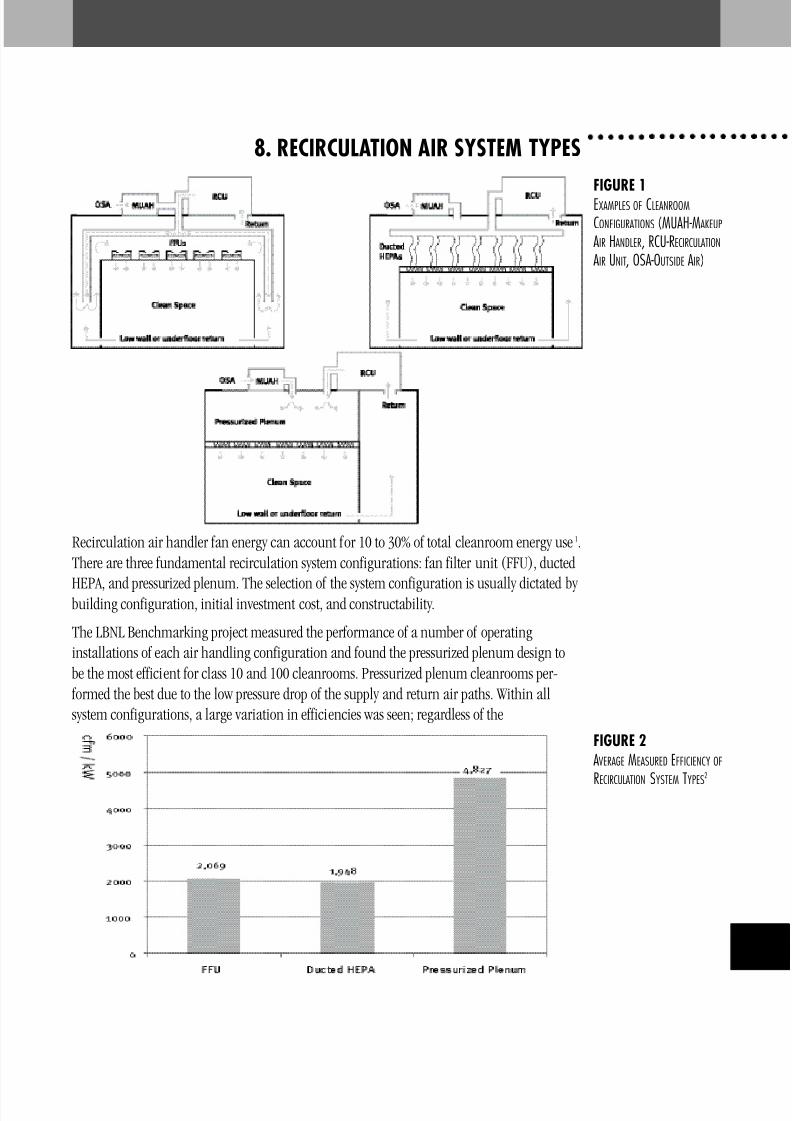
8. RECIRCULATION AIR SYSTEM TYPES
Recirculation air handler fan energy can account for 10 to 30% of total cleanroom energy use1.There are three fundamental recirculation system configurations: fan filter unit (FFU), ducted
HEPA, and pressurized plenum. The selection of the system configuration is usually dictated by building configuration, initial investment cost, and constructability.
The LBNL Benchmarking project measured the performance of a number of operatinginstallations of each air handling configuration and found the pressurized plenum design tobe the most efficient for class 10 and 100 cleanrooms. Pressurized plenum cleanrooms per-
formed the best due to the low pressure drop of the supply and return air paths. Within allsystem configurations, a large variation in efficiencies was seen; regardless of the
FIGURE 1
EXAMPLES OF CLEANROOM
CONFIGURATIONS (MUAH-MAKEUP
AIR HANDLER, RCU-RECIRCULATION
AIR UNIT, OSA-OUTSIDE AIR)
FIGURE 2
AVERAGE MEASURED EFFICIENCY OF
RECIRCULATION SYSTEM TYPES
2
8/6/2019 High Performance Cleanroom Air Design
http://slidepdf.com/reader/full/high-performance-cleanroom-air-design 37/48
36
configuration selected, there are many opportunities to reduce the energy usage by over 50% compared to the average for that system configuration. When determining theefficiency of a recirculation air system, the fan energy used to provide sensible coolingalso must be considered.
PRINCIPLES
The recirculation system efficiency equation is:
• Low fan power consumption is predominantly influenced by low pressure drop(see Low Pressure Drop Air Systems chapter). All system configurations have been seen torealize large energy savings from low pressure drop design.
• Fan and motor efficiency becomes important only when taken to the extreme of smallmotors and fans, such as used in 2’ x 4’ FFU modules.
APPROACH
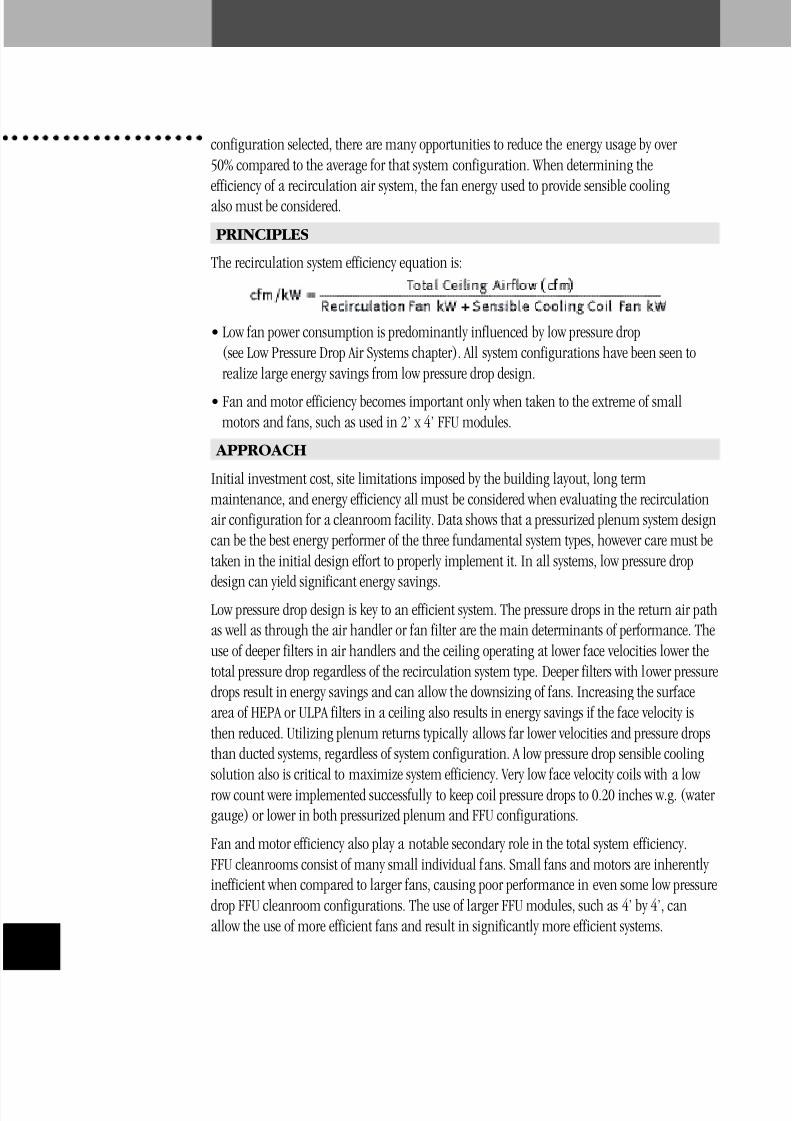
Initial investment cost, site limitations imposed by the building layout, long termmaintenance, and energy efficiency all must be considered when evaluating the recirculationair configuration for a cleanroom facility. Data shows that a pressurized plenum system designcan be the best energy performer of the three fundamental system types, however care must betaken in the initial design effort to properly implement it. In all systems, low pressure drop
design can yield significant energy savings.Low pressure drop design is key to an efficient system. The pressure drops in the return air pathas well as through the air handler or fan filter are the main determinants of performance. Theuse of deeper filters in air handlers and the ceiling operating at lower face velocities lower thetotal pressure drop regardless of the recirculation system type. Deeper filters with lower pressuredrops result in energy savings and can allow the downsizing of fans. Increasing the surfacearea of HEPA or ULPA filters in a ceiling also results in energy savings if the face velocity isthen reduced. Utilizing plenum returns typically allows far lower velocities and pressure dropsthan ducted systems, regardless of system configuration. A low pressure drop sensible coolingsolution also is critical to maximize system efficiency. Very low face velocity coils with a low row count were implemented successfully to keep coil pressure drops to 0.20 inches w.g. (water gauge) or lower in both pressurized plenum and FFU configurations.
Fan and motor efficiency also play a notable secondary role in the total system efficiency.FFU cleanrooms consist of many small individual fans. Small fans and motors are inherently inefficient when compared to larger fans, causing poor performance in even some low pressuredrop FFU cleanroom configurations. The use of larger FFU modules, such as 4’ by 4’, canallow the use of more efficient fans and result in significantly more efficient systems.
8/6/2019 High Performance Cleanroom Air Design
http://slidepdf.com/reader/full/high-performance-cleanroom-air-design 38/48
3
Variable flow capability is highly recommended to allow for implementation of active flow control and/or off hours setback if the space is ever unoccupied (without people in the space,airflow rates can often be reduced without impacting the cleanliness of the space). Speedcontrolled recirculation fans or FFUs can operate the cleanroom at lower HEPA face velocities,lowering pressure drop and therefore lowering the power cost per cfm. (See Demand ControlledFiltration chapter).
Another key consideration is cleanroom flexibility. The ability to target specific cleanroomareas for higher levels of HEPA flow is often desired. For example, providing higher coveragenear the access doors of minienviroments or over aisles. FFUs tend to be favored for their
flexibility, but ducted HEPA systems and pressurized plenums can also provide flexibility,requiring only the rearrangement of the non-powered filter and blank off panels in theceiling grid. FFUs do tend to be able to operate with lower plenum height requirements than
a pressurized plenum or ducted HEPA system, although in bay and chase systems the heightrequirements can be equivalent.
FFU and pressurized plenum cleanrooms require sensible cooling to be either provided by cooling coils located in the recirculation air path, or by air handlers. In many benchmarkedsites, the FFUs were found to be efficient, but the sensible air handler was inefficient, thuscompromising the efficiency of the whole system. The most efficient FFU systems were incleanrooms where the coils were large and were in the return air path, providing low pressuredrop cooling that utilized only the FFUs’ built in fans.
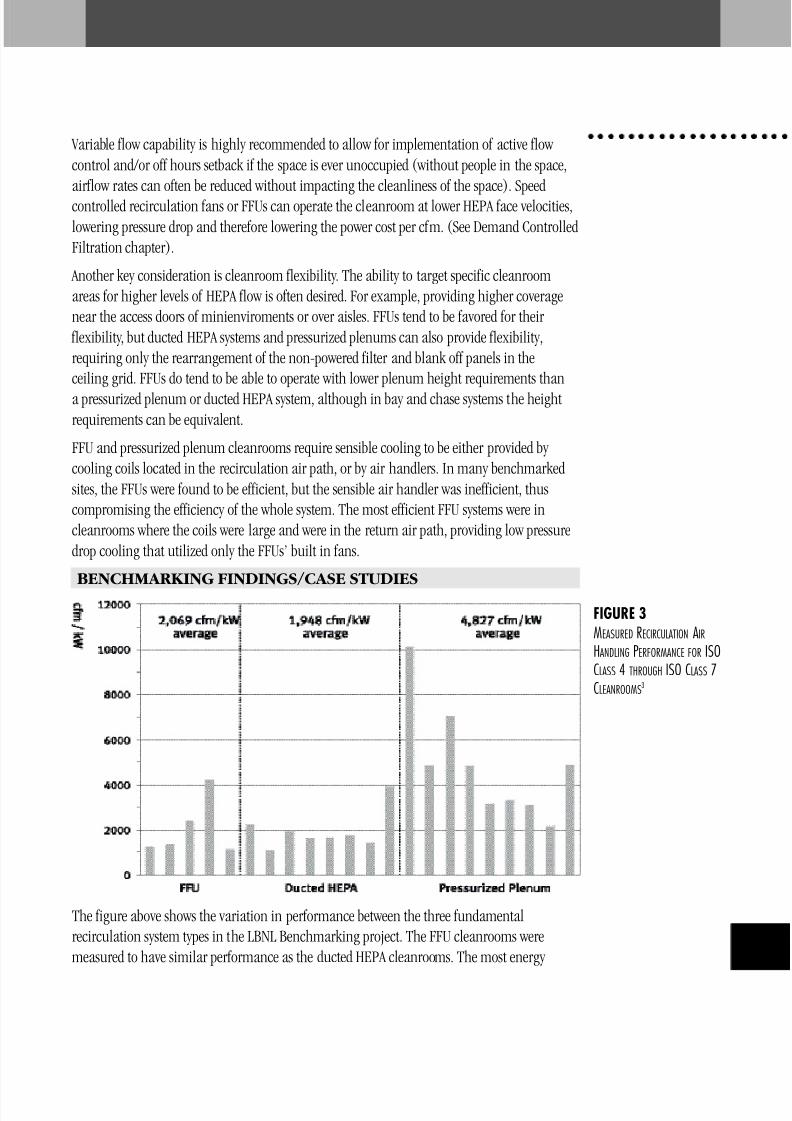
BENCHMARKING FINDINGS/CASE STUDIES
The figure above shows the variation in performance between the three fundamentalrecirculation system types in the LBNL Benchmarking project. The FFU cleanrooms weremeasured to have similar performance as the ducted HEPA cleanrooms. The most energy
FIGURE 3
MEASURED RECIRCULATION AIR
HANDLING PERFORMANCE FOR ISO
CLASS 4 THROUGH ISO CLASS 7
CLEANROOMS3
8/6/2019 High Performance Cleanroom Air Design
http://slidepdf.com/reader/full/high-performance-cleanroom-air-design 39/48
38
efficient systems were the pressurized plenum configured cleanrooms, which had an averageefficiency more than double of the FFU and ducted HEPA cleanrooms. However, the bestFFU arrangement, which utilized plenum return with integrated low face velocity sensiblecooling coils, performed better than some of the pressurized plenum cleanrooms. If a FFUconfiguration is dictated by other design factors, careful design can result in a system that istwo to four times more efficient than a typical FFU system.
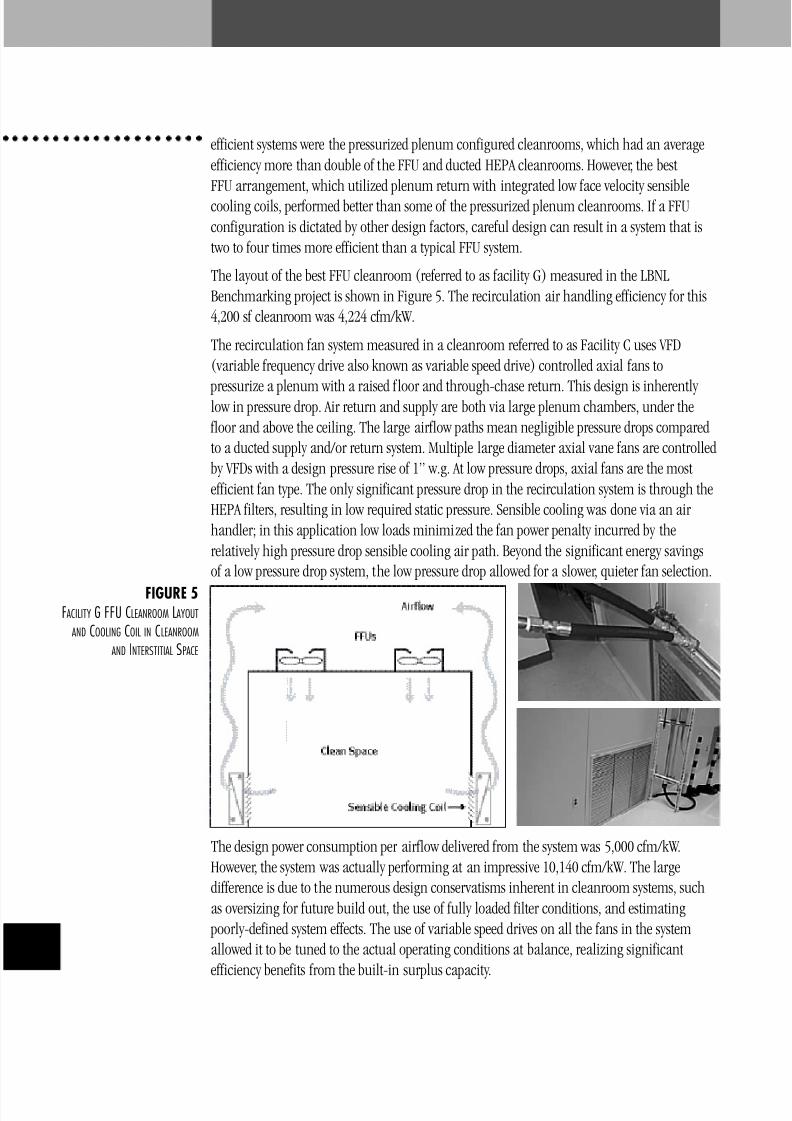
The layout of the best FFU cleanroom (referred to as facility G) measured in the LBNLBenchmarking project is shown in Figure 5. The recirculation air handling efficiency for this4,200 sf cleanroom was 4,224 cfm/kW.
The recirculation fan system measured in a cleanroom referred to as Facility C uses VFD(variable frequency drive also known as variable speed drive) controlled axial fans to
pressurize a plenum with a raised floor and through-chase return. This design is inherently low in pressure drop. Air return and supply are both via large plenum chambers, under the floor and above the ceiling. The large airflow paths mean negligible pressure drops comparedto a ducted supply and/or return system. Multiple large diameter axial vane fans are controlledby VFDs with a design pressure rise of 1” w.g. At low pressure drops, axial fans are the mostefficient fan type. The only significant pressure drop in the recirculation system is through theHEPA filters, resulting in low required static pressure. Sensible cooling was done via an air handler; in this application low loads minimized the fan power penalty incurred by therelatively high pressure drop sensible cooling air path. Beyond the significant energy savingsof a low pressure drop system, the low pressure drop allowed for a slower, quieter fan selection.
The design power consumption per airflow delivered from the system was 5,000 cfm/kW.However, the system was actually performing at an impressive 10,140 cfm/kW. The largedifference is due to the numerous design conservatisms inherent in cleanroom systems, suchas oversizing for future build out, the use of fully loaded filter conditions, and estimating
poorly-defined system effects. The use of variable speed drives on all the fans in the systemallowed it to be tuned to the actual operating conditions at balance, realizing significantefficiency benefits from the built-in surplus capacity.
FIGURE 5
FACILITY G FFU CLEANROOM LAYOUT
AND COOLING COIL IN CLEANROOM
AND INTERSTITIAL SPACE
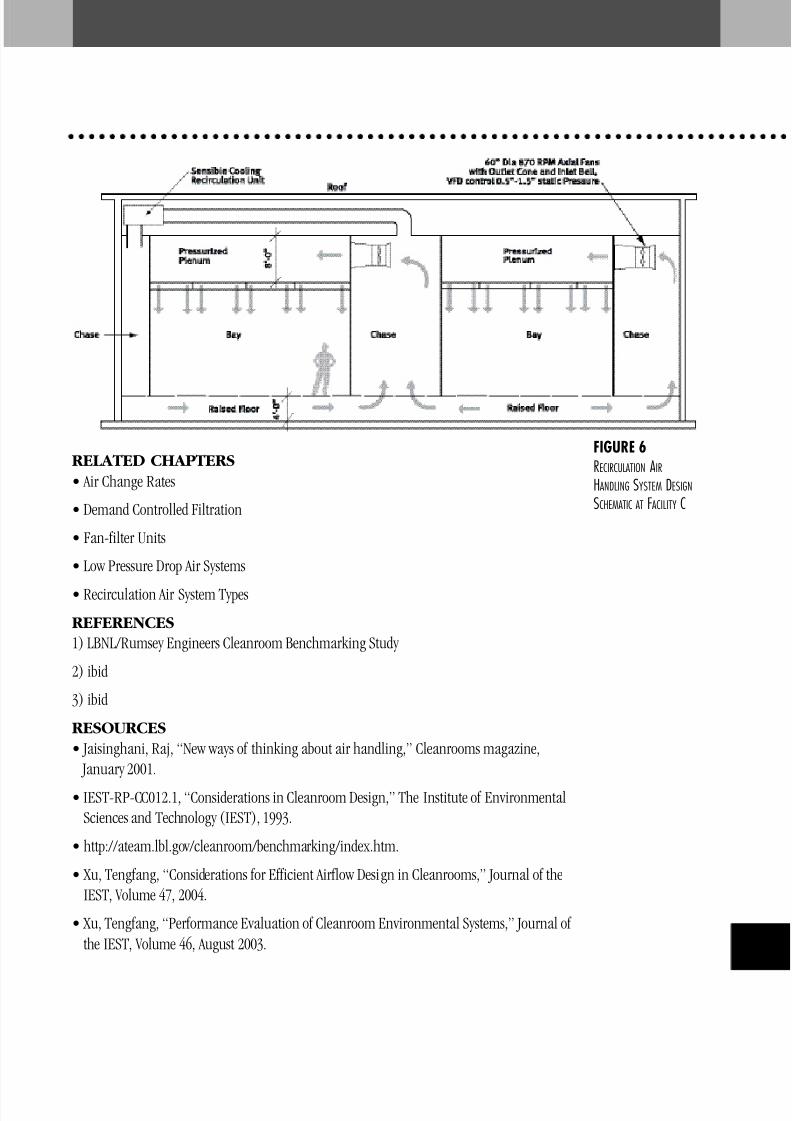
8/6/2019 High Performance Cleanroom Air Design
http://slidepdf.com/reader/full/high-performance-cleanroom-air-design 40/48
3
RELATED CHAPTERS
• Air Change Rates
• Demand Controlled Filtration
• Fan-filter Units
• Low Pressure Drop Air Systems
• Recirculation Air System Types
REFERENCES1) LBNL/Rumsey Engineers Cleanroom Benchmarking Study
2) ibid
3) ibid
RESOURCES
• Jaisinghani, Raj, “New ways of thinking about air handling,” Cleanrooms magazine, January 2001.
• IEST-RP-CC012.1, “Considerations in Cleanroom Design,” The Institute of EnvironmentalSciences and Technology (IEST), 1993.
• http://ateam.lbl.gov/cleanroom/benchmarking/index.htm.
• Xu, Tengfang, “Considerations for Efficient Airflow Design in Cleanrooms,” Journal of theIEST, Volume 47, 2004.
• Xu, Tengfang, “Performance Evaluation of Cleanroom Environmental Systems,” Journal of the IEST, Volume 46, August 2003.
FIGURE 6
RECIRCULATION AIR
HANDLING SYSTEM DESIGN
SCHEMATIC AT FACILITY C
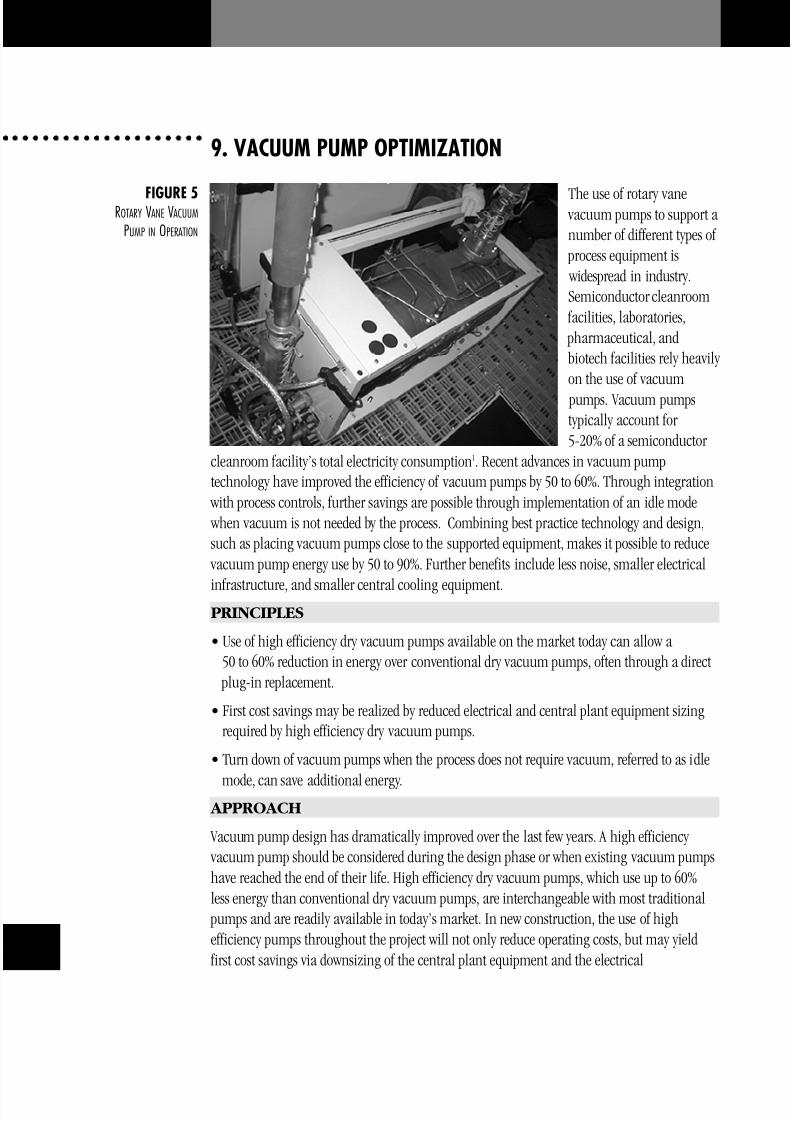
8/6/2019 High Performance Cleanroom Air Design
http://slidepdf.com/reader/full/high-performance-cleanroom-air-design 41/48
40
9. VACUUM PUMP OPTIMIZATION
The use of rotary vane vacuum pumps to support a number of different types of
process equipment is widespread in industry.Semiconductor cleanroom
facilities, laboratories, pharmaceutical, andbiotech facilities rely heavily on the use of vacuum
pumps. Vacuum pumpstypically account for 5-20% of a semiconductor
cleanroom facility’s total electricity consumption1. Recent advances in vacuum pumptechnology have improved the efficiency of vacuum pumps by 50 to 60%. Through integration
with process controls, further savings are possible through implementation of an idle mode when vacuum is not needed by the process. Combining best practice technology and design,such as placing vacuum pumps close to the supported equipment, makes it possible to reduce
vacuum pump energy use by 50 to 90%. Further benefits include less noise, smaller electrical
infrastructure, and smaller central cooling equipment.PRINCIPLES
• Use of high efficiency dry vacuum pumps available on the market today can allow a 50 to 60% reduction in energy over conventional dry vacuum pumps, often through a direct
plug-in replacement.
• First cost savings may be realized by reduced electrical and central plant equipment sizingrequired by high efficiency dry vacuum pumps.
• Turn down of vacuum pumps when the process does not require vacuum, referred to as idle
mode, can save additional energy. APPROACH
Vacuum pump design has dramatically improved over the last few years. A high efficiency vacuum pump should be considered during the design phase or when existing vacuum pumpshave reached the end of their life. High efficiency dry vacuum pumps, which use up to 60%less energy than conventional dry vacuum pumps, are interchangeable with most traditional
pumps and are readily available in today’s market. In new construction, the use of highefficiency pumps throughout the project will not only reduce operating costs, but may yield
first cost savings via downsizing of the central plant equipment and the electrical
FIGURE 5ROTARY VANE VACUUM
PUMP IN OPERATION
8/6/2019 High Performance Cleanroom Air Design
http://slidepdf.com/reader/full/high-performance-cleanroom-air-design 42/48
4
infrastructure. In a retrofit situation, the reduction on plant utilities may be able to forestallcostly central plant expansion during minor buildouts.
Variable speed capability in stand-by mode is being integrated into the design of some highefficiency dry vacuum pumps. To implement idle mode operation, process equipment is beingsupplied with the ability to send an idle signal to the vacuum pump.
High efficiency vacuum pumps also offer lower noise and vibration. Vibration is reduced dueto the lower average rotational speeds required of a high efficiency vacuum pump. Noiselevels in high efficiency vacuum pumps have been reduced by up to 65% when comparedto conventional vacuum pumps. Where low noise levels are required in the operator environment, the lower noise operation combined with a reduced footprint design can allow the vacuum pump to be located very close to the process, realizing additional energy savings.
Depending on the cleanroom layout, placing the pump closer to the process can require less piping. A minimal amount of piping both upstream and downstream of the pump results in a lower amount of work that the pump has to do since there is a lower amount of pressure dropthrough the pipe. In addition, the potential for leakage and, in some cases, the total evacuated
volume is reduced.
A high efficiency vacuum pump produces less waste heat than a conventional vacuum pumpdue to the reduced power consumption, requiring a lower amount of air cooling or processcooling water (PCW). PCW removes the heat generated by a vacuum pump so that heat isnot introduced into the surrounding environment while maintaining the pump within its
operating temperature range. Whether air or PCW cooled, a reduction in waste heat reducesthe total load on the central cooling system.
Research is currently in progress on process equipment idle mode vacuum setback. Turningthe pump speed down when a particular portion of the process equipment is idle offers a largeopportunity for energy savings. Developing this capability is a joint effort between processequipment and vacuum pump manufacturers. A robust communication link between the
process equipment and vacuum pump is necessary so that the pump can respondinstantaneously to the demand of the equipment, providing transparent operation.
BENCHMARKING FINDINGS/CASE STUDIES
The LBNL Benchmarking study included power measurements of six dry vacuum pumpsserving a semiconductor wafer etch process tool in operation. The vacuum pumps were theconventional dry type and were being used as chamber, load lock and transfer pumps.
The data collected showed that the chambers in the process equipment tool oscillated betweenbeing in use (“on”) and not being in use (“off”). During this time, the six vacuum pumpscontinued to draw a constant amount of power. The particular chamber shown in the graphbelow (chamber C) oscillated between “on” and “off” approximately every two minutes. A high efficiency, variable-speed driven pump with idle mode capability would be well tailored tothis application. During the times when the chamber is not in use, the vacuum pump would
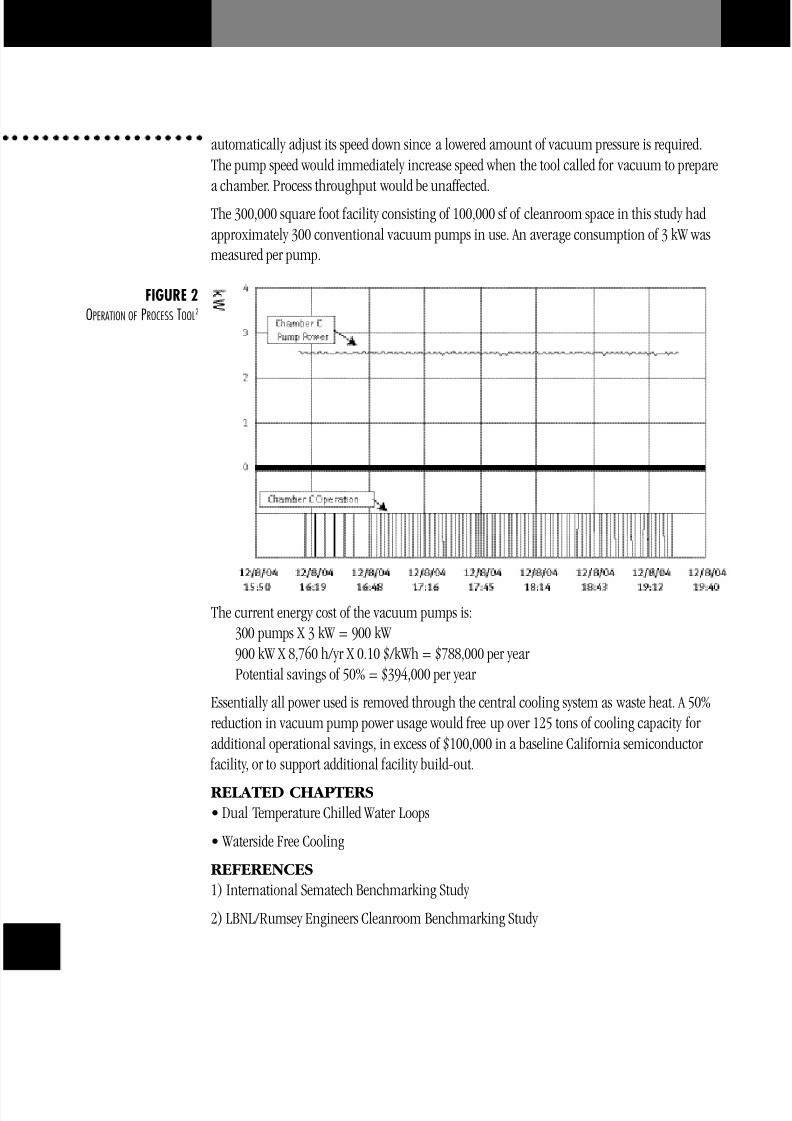
8/6/2019 High Performance Cleanroom Air Design
http://slidepdf.com/reader/full/high-performance-cleanroom-air-design 43/48
42
automatically adjust its speed down since a lowered amount of vacuum pressure is required.The pump speed would immediately increase speed when the tool called for vacuum to preparea chamber. Process throughput would be unaffected.
The 300,000 square foot facility consisting of 100,000 sf of cleanroom space in this study hadapproximately 300 conventional vacuum pumps in use. An average consumption of 3 kW wasmeasured per pump.
The current energy cost of the vacuum pumps is:300 pumps X 3 kW = 900 kW 900 kW X 8,760 h/yr X 0.10 $/kWh = $788,000 per year Potential savings of 50% = $394,000 per year
Essentially all power used is removed through the central cooling system as waste heat. A 50%reduction in vacuum pump power usage would free up over 125 tons of cooling capacity for additional operational savings, in excess of $100,000 in a baseline California semiconductor
facility, or to support additional facility build-out.
RELATED CHAPTERS• Dual Temperature Chilled Water Loops
• Waterside Free Cooling
REFERENCES1) International Sematech Benchmarking Study
2) LBNL/Rumsey Engineers Cleanroom Benchmarking Study
FIGURE 2
OPERATION OF PROCESS TOOL2
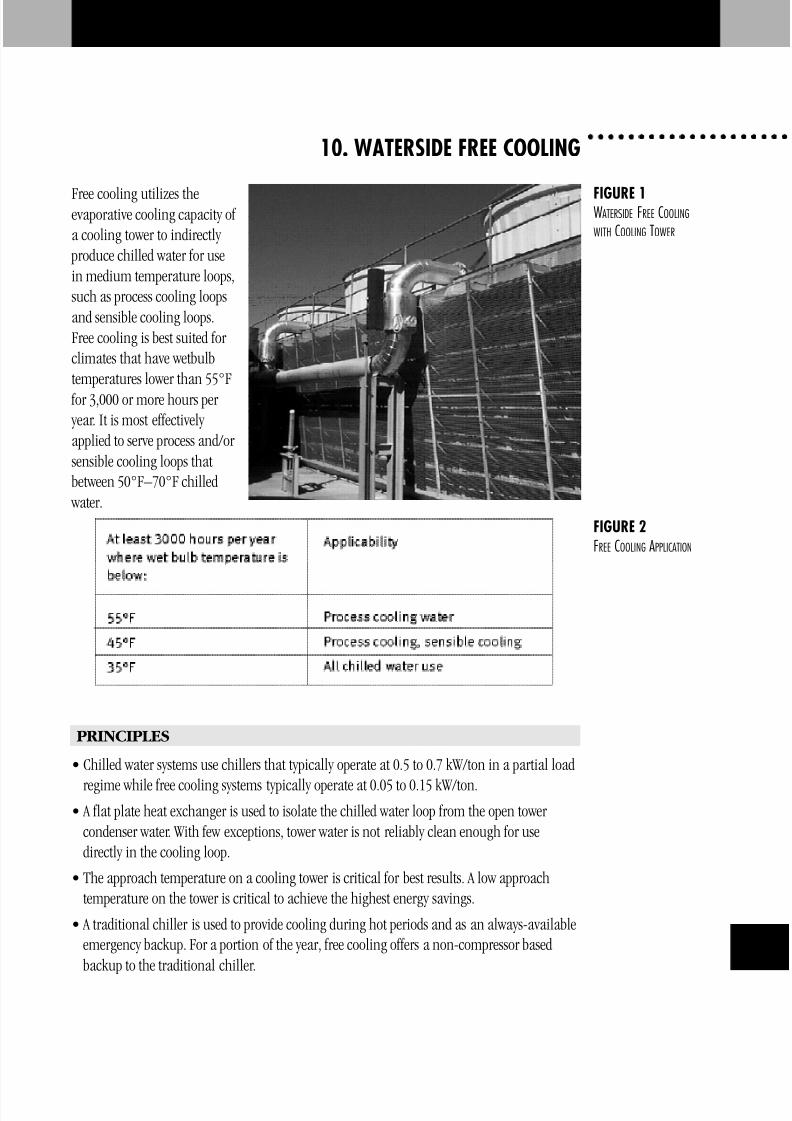
8/6/2019 High Performance Cleanroom Air Design
http://slidepdf.com/reader/full/high-performance-cleanroom-air-design 44/48
4
10. WATERSIDE FREE COOLING
Free cooling utilizes theevaporative cooling capacity of a cooling tower to indirectly
produce chilled water for usein medium temperature loops,such as process cooling loopsand sensible cooling loops.Free cooling is best suited for climates that have wetbulbtemperatures lower than 55°F
for 3,000 or more hours per year. It is most effectively applied to serve process and/or sensible cooling loops thatbetween 50°F–70°F chilled
water.
PRINCIPLES
• Chilled water systems use chillers that typically operate at 0.5 to 0.7 kW/ton in a partial load
regime while free cooling systems typically operate at 0.05 to 0.15 kW/ton.• A flat plate heat exchanger is used to isolate the chilled water loop from the open tower
condenser water. With few exceptions, tower water is not reliably clean enough for usedirectly in the cooling loop.
• The approach temperature on a cooling tower is critical for best results. A low approachtemperature on the tower is critical to achieve the highest energy savings.
• A traditional chiller is used to provide cooling during hot periods and as an always-availableemergency backup. For a portion of the year, free cooling offers a non-compressor basedbackup to the traditional chiller.
FIGURE 1WATERSIDE FREE COOLING
WITH COOLING TOWER
FIGURE 2
FREE COOLING APPLICATION
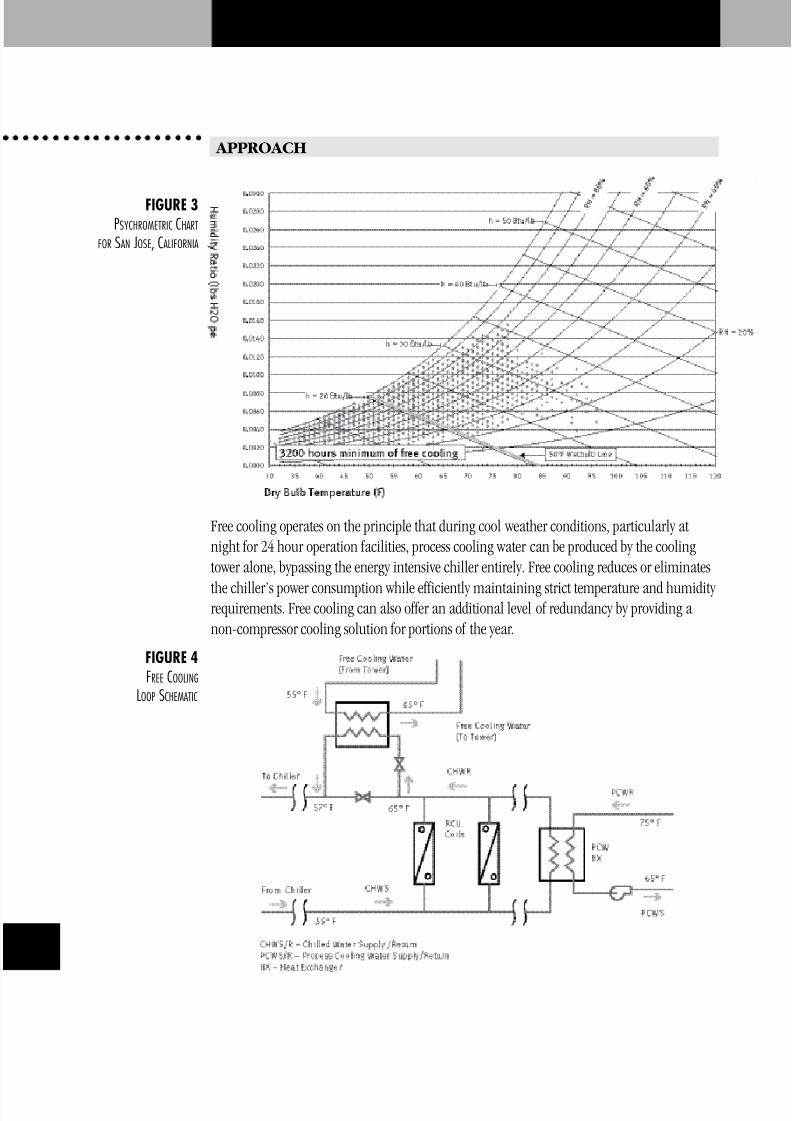
8/6/2019 High Performance Cleanroom Air Design
http://slidepdf.com/reader/full/high-performance-cleanroom-air-design 45/48
44
APPROACH
Free cooling operates on the principle that during cool weather conditions, particularly atnight for 24 hour operation facilities, process cooling water can be produced by the coolingtower alone, bypassing the energy intensive chiller entirely. Free cooling reduces or eliminates
the chiller’s power consumption while efficiently maintaining strict temperature and humidity requirements. Free cooling can also offer an additional level of redundancy by providing a non-compressor cooling solution for portions of the year.
FIGURE 3
PSYCHROMETRIC CHART
FOR SAN JOSE, CALIFORNIA
FIGURE 4
FREE COOLING
LOOP SCHEMATIC
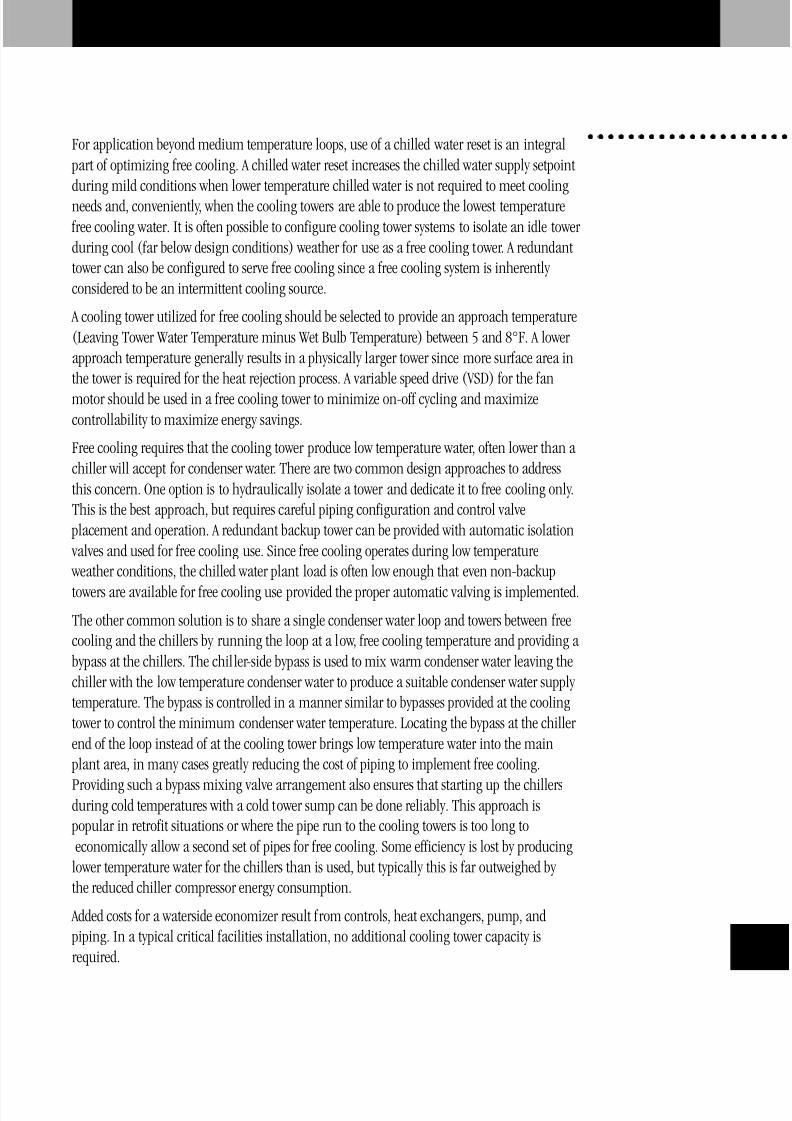
8/6/2019 High Performance Cleanroom Air Design
http://slidepdf.com/reader/full/high-performance-cleanroom-air-design 46/48
4
For application beyond medium temperature loops, use of a chilled water reset is an integral part of optimizing free cooling. A chilled water reset increases the chilled water supply setpointduring mild conditions when lower temperature chilled water is not required to meet coolingneeds and, conveniently, when the cooling towers are able to produce the lowest temperature
free cooling water. It is often possible to configure cooling tower systems to isolate an idle tower during cool (far below design conditions) weather for use as a free cooling tower. A redundanttower can also be configured to serve free cooling since a free cooling system is inherently considered to be an intermittent cooling source.
A cooling tower utilized for free cooling should be selected to provide an approach temperature(Leaving Tower Water Temperature minus Wet Bulb Temperature) between 5 and 8°F. A lower approach temperature generally results in a physically larger tower since more surface area inthe tower is required for the heat rejection process. A variable speed drive (VSD) for the fan
motor should be used in a free cooling tower to minimize on-off cycling and maximizecontrollability to maximize energy savings.
Free cooling requires that the cooling tower produce low temperature water, often lower than a chiller will accept for condenser water. There are two common design approaches to addressthis concern. One option is to hydraulically isolate a tower and dedicate it to free cooling only.This is the best approach, but requires careful piping configuration and control valve
placement and operation. A redundant backup tower can be provided with automatic isolation valves and used for free cooling use. Since free cooling operates during low temperature weather conditions, the chilled water plant load is often low enough that even non-backup
towers are available for free cooling use provided the proper automatic valving is implemented.
The other common solution is to share a single condenser water loop and towers between freecooling and the chillers by running the loop at a low, free cooling temperature and providing a bypass at the chillers. The chiller-side bypass is used to mix warm condenser water leaving thechiller with the low temperature condenser water to produce a suitable condenser water supply temperature. The bypass is controlled in a manner similar to bypasses provided at the coolingtower to control the minimum condenser water temperature. Locating the bypass at the chiller end of the loop instead of at the cooling tower brings low temperature water into the main
plant area, in many cases greatly reducing the cost of piping to implement free cooling.
Providing such a bypass mixing valve arrangement also ensures that starting up the chillersduring cold temperatures with a cold tower sump can be done reliably. This approach is
popular in retrofit situations or where the pipe run to the cooling towers is too long toeconomically allow a second set of pipes for free cooling. Some efficiency is lost by producing
lower temperature water for the chillers than is used, but typically this is far outweighed by the reduced chiller compressor energy consumption.
Added costs for a waterside economizer result from controls, heat exchangers, pump, and piping. In a typical critical facilities installation, no additional cooling tower capacity isrequired.
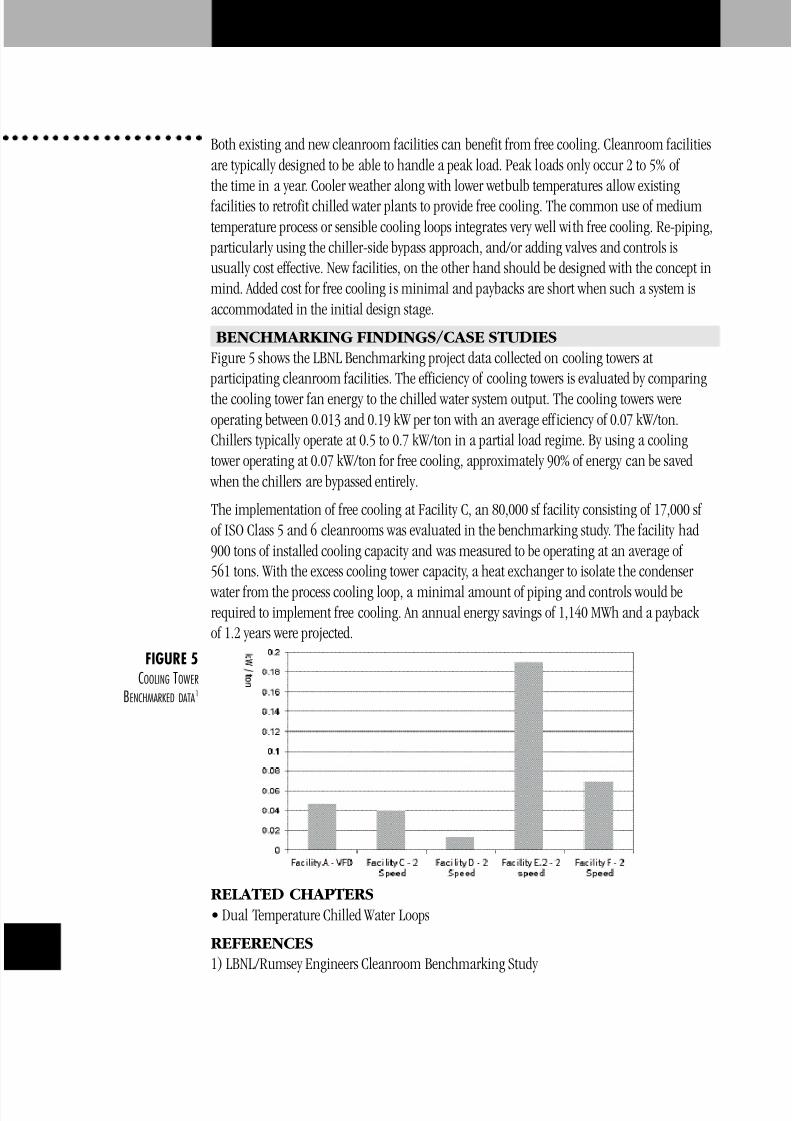
8/6/2019 High Performance Cleanroom Air Design
http://slidepdf.com/reader/full/high-performance-cleanroom-air-design 47/48
46
Both existing and new cleanroom facilities can benefit from free cooling. Cleanroom facilitiesare typically designed to be able to handle a peak load. Peak loads only occur 2 to 5% of the time in a year. Cooler weather along with lower wetbulb temperatures allow existing
facilities to retrofit chilled water plants to provide free cooling. The common use of mediumtemperature process or sensible cooling loops integrates very well with free cooling. Re-piping,
particularly using the chiller-side bypass approach, and/or adding valves and controls isusually cost effective. New facilities, on the other hand should be designed with the concept inmind. Added cost for free cooling is minimal and paybacks are short when such a system isaccommodated in the initial design stage.
BENCHMARKING FINDINGS/CASE STUDIES
Figure 5 shows the LBNL Benchmarking project data collected on cooling towers at participating cleanroom facilities. The efficiency of cooling towers is evaluated by comparing
the cooling tower fan energy to the chilled water system output. The cooling towers wereoperating between 0.013 and 0.19 kW per ton with an average efficiency of 0.07 kW/ton.Chillers typically operate at 0.5 to 0.7 kW/ton in a partial load regime. By using a coolingtower operating at 0.07 kW/ton for free cooling, approximately 90% of energy can be saved
when the chillers are bypassed entirely.
The implementation of free cooling at Facility C, an 80,000 sf facility consisting of 17,000 sf of ISO Class 5 and 6 cleanrooms was evaluated in the benchmarking study. The facility had900 tons of installed cooling capacity and was measured to be operating at an average of 561 tons. With the excess cooling tower capacity, a heat exchanger to isolate the condenser
water from the process cooling loop, a minimal amount of piping and controls would berequired to implement free cooling. An annual energy savings of 1,140 MWh and a payback of 1.2 years were projected.
RELATED CHAPTERS
• Dual Temperature Chilled Water Loops
REFERENCES1) LBNL/Rumsey Engineers Cleanroom Benchmarking Study
FIGURE 5
COOLING TOWER
BENCHMARKED DATA1
8/6/2019 High Performance Cleanroom Air Design
http://slidepdf.com/reader/full/high-performance-cleanroom-air-design 48/48
This education product was developed utilizing Energy Design Resources funding. Energy Design Resources provides information and design tools toarchitects, enginers, lighting designers, and building owners and developers.Energy Design Resources is funded by California utility customers and
administered by Pacific Gas and Electric Company, San Diego Gas and Electric,Southern California Edison, and Southern California Gas Company, under theauspices of the California Public Utilities Commission. To learn more aboutEnergy Design Resources, visit www.energydesignresources.com.
This Design Guidelines Sourcebook was developed by Rumsey Engineers, in part,based upon work by Lawrence Berkeley National Laboratory supported by theCalifornia Energy Commission's Public Interest Energy Research program.
The following authors participated in the development of the guide. Rumsey Engineers: Larry Chu, John Weale, Peter RumseyLawrence Berkeley National
Lab: Bill Tschudi, Steve Greenberg, David Faulkner, Tim Xu, and Dale Sartor.