Embed Size (px)
Citation preview
High Jump: Beyond the Basics – Anatomy of Elite Performance and Elite Testing Data
Cliff Rovelto Head Track & Field Coach
Kansas State University
Introduction
• What is elite? • What does it take to rank among world top ten? • What are these athletes capable of doing?
o In competition? o In training?
• How do I use this information? Athlete Bios Ed Broxterman
Fall 1992 – Spring 1999 Baileyville, Kansas
Birth date: 11/28/73 Height: 1.96 / 6’ 5”
Weight: 165 Personal Best: 2.30 / 7’ 6 ½” Highlights: 1996 Olympian, 1995 NCAA Outdoor Runner-Up Two Time USA Top Ten Ranked
Matt Hemingway Fall 2003 – Summer 2005
Buena Vista, Colorado Birth date: 10/24/72 Height: 2.00 / 6’ 6 ¾”
Weight: 185 Personal Best: ID 2.38 / 7’ 9 ¾” OD 2.34 / 7’ 8” Top Ten Average: 2.327 / 7’ 7 ¼”
Highlights: 2004 Olympic Silver Medalist, 2005 USA Outdoor Champion
Kyle Lancaster Fall 2002 – Spring 2008 Fort Scott, Kansas
Birth date: 8/15/83 Height: 1.96 / 6’ 5”
Weight: 178 Personal Best: 2.31 / 7’ 7” Top Ten Average: 2.266 / 7’ 5” Highlights: 2005 World Outdoor Team, Seven Time NCAA All American Four Time USA Top Ten Ranked
Nathan Leeper Fall 1997 – Spring 2004 Protection, Kansas Birth date: 6/13/77 Height: 1.88 / 6’ 2” Weight: 178 Personal Best: 2.35 / 7’ 8 ½” Top Ten Average: 2.315 / 7’ 7” Highlights: 2000 Olympic Finalist, 2001 World Indoor– 4th place 1998 NCAA Outdoor Champion Four Time USA National Champion Five Time USA Top Ten Ranked Jamie Nieto Fall 2000 – Summer 2008 Sacramento, California Birth date: 11/2/76 Height: 1.93 / 6’ 4” Weight: 182 Personal Best: 2.34 / 7’ 8” Top Ten Average: 2.31 / 7’ 7” Highlights: 2004 Olympic 4th Place, 2004World Indoor Team 2003, 2007World Outdoor Team 2003 Pan Am Silver Medalist, Three Time USA National Champion Eleven Time USA Top Ten Ranked Scott Sellers Fall 2006 – Present Katy, Texas Birth date: 8/16/86 Height: 1.90 / 6’ 2 ¾” Weight: 160 Personal Best: 2.33 / 7’ 7 ¾” Top Ten Average: 2.285 / 7’ 5 ¾” Highlights: Three Time NCAA Champion, Eight Time NCAA All American Jesse Williams Fall 2007 – Present Raleigh, North Carolina Birth date: 12/27/83 Height: 1.83 / 6’ Weight: 155 Personal Best: 2.36 / 7’ 8 ¾” Top Ten Average: 2.329 / 7’ 7 ¼”
Highlights: 2008 Olympian, 2008 Olympic Trials Champion 2008 World Indoor team
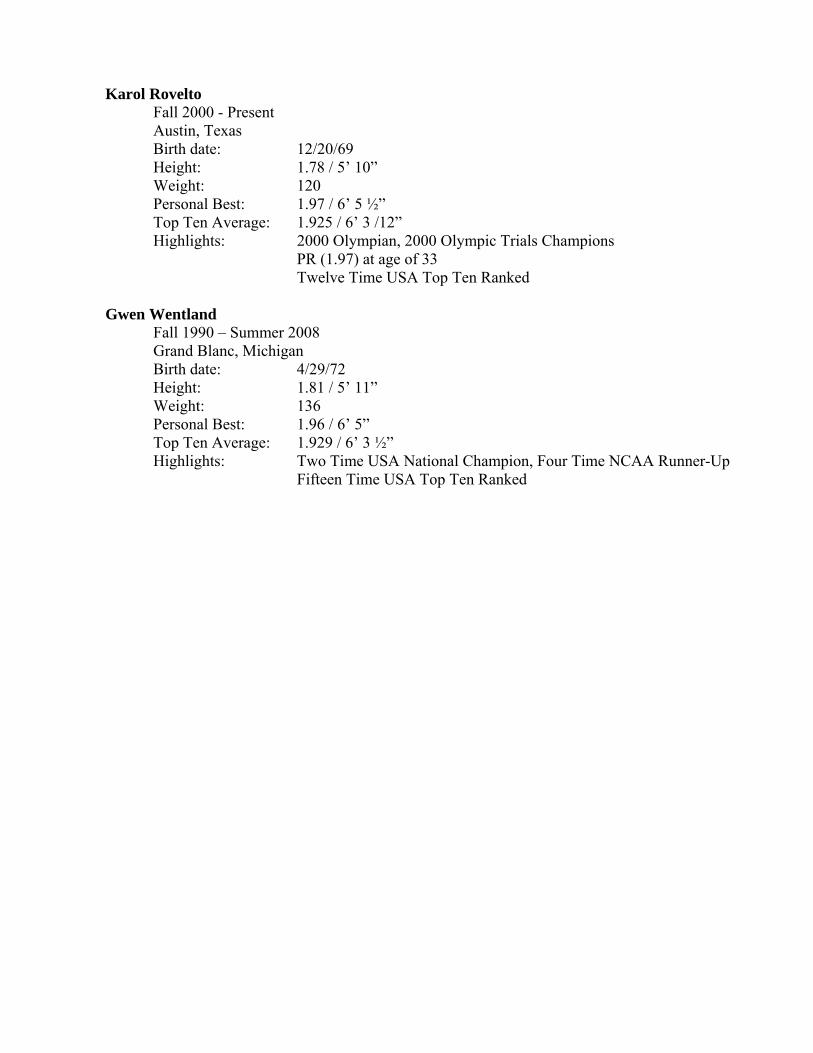
Karol Rovelto Fall 2000 - Present
Austin, Texas Birth date: 12/20/69 Height: 1.78 / 5’ 10” Weight: 120 Personal Best: 1.97 / 6’ 5 ½” Top Ten Average: 1.925 / 6’ 3 /12” Highlights: 2000 Olympian, 2000 Olympic Trials Champions
PR (1.97) at age of 33 Twelve Time USA Top Ten Ranked Gwen Wentland Fall 1990 – Summer 2008 Grand Blanc, Michigan Birth date: 4/29/72 Height: 1.81 / 5’ 11” Weight: 136 Personal Best: 1.96 / 6’ 5” Top Ten Average: 1.929 / 6’ 3 ½” Highlights: Two Time USA National Champion, Four Time NCAA Runner-Up Fifteen Time USA Top Ten Ranked
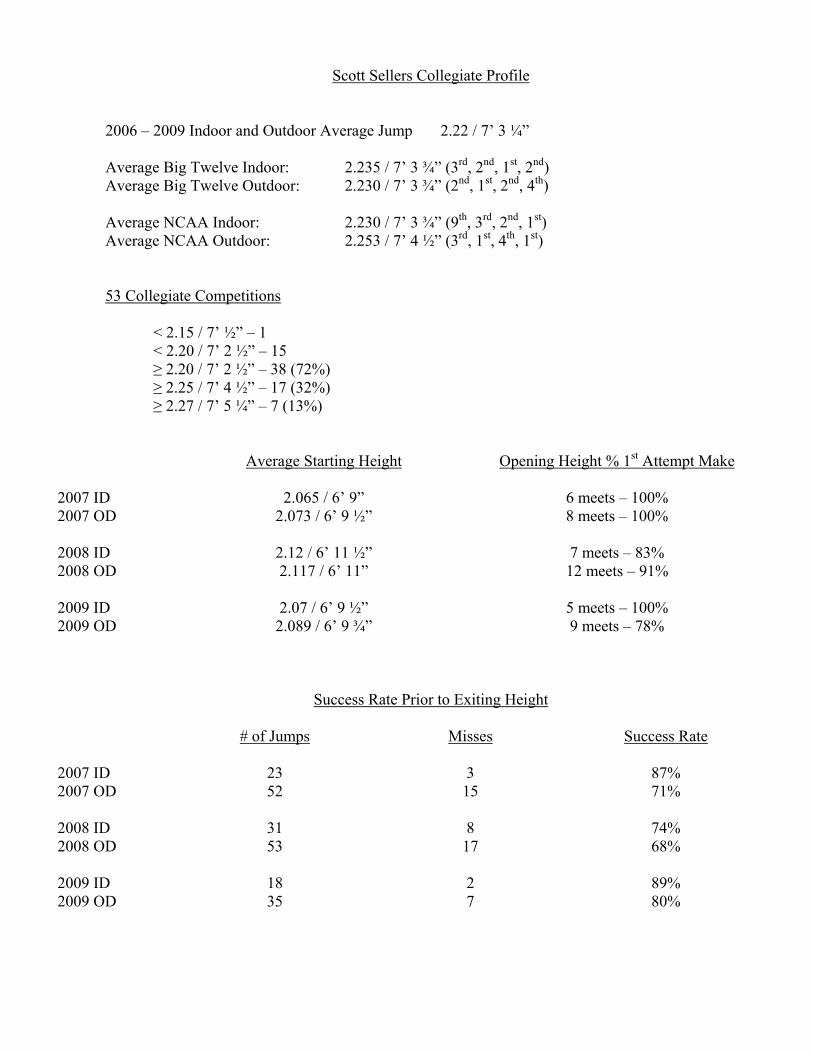
Scott Sellers Collegiate Profile
2006 – 2009 Indoor and Outdoor Average Jump 2.22 / 7’ 3 ¼” Average Big Twelve Indoor: 2.235 / 7’ 3 ¾” (3rd, 2nd, 1st, 2nd) Average Big Twelve Outdoor: 2.230 / 7’ 3 ¾” (2nd, 1st, 2nd, 4th) Average NCAA Indoor: 2.230 / 7’ 3 ¾” (9th, 3rd, 2nd, 1st) Average NCAA Outdoor: 2.253 / 7’ 4 ½” (3rd, 1st, 4th, 1st) 53 Collegiate Competitions < 2.15 / 7’ ½” – 1 < 2.20 / 7’ 2 ½” – 15 ≥ 2.20 / 7’ 2 ½” – 38 (72%) ≥ 2.25 / 7’ 4 ½” – 17 (32%) ≥ 2.27 / 7’ 5 ¼” – 7 (13%)
Average Starting Height Opening Height % 1st Attempt Make 2007 ID 2.065 / 6’ 9” 6 meets – 100% 2007 OD 2.073 / 6’ 9 ½” 8 meets – 100% 2008 ID 2.12 / 6’ 11 ½” 7 meets – 83% 2008 OD 2.117 / 6’ 11” 12 meets – 91% 2009 ID 2.07 / 6’ 9 ½” 5 meets – 100% 2009 OD 2.089 / 6’ 9 ¾” 9 meets – 78%
Success Rate Prior to Exiting Height
# of Jumps Misses Success Rate 2007 ID 23 3 87% 2007 OD 52 15 71% 2008 ID 31 8 74% 2008 OD 53 17 68% 2009 ID 18 2 89% 2009 OD 35 7 80%
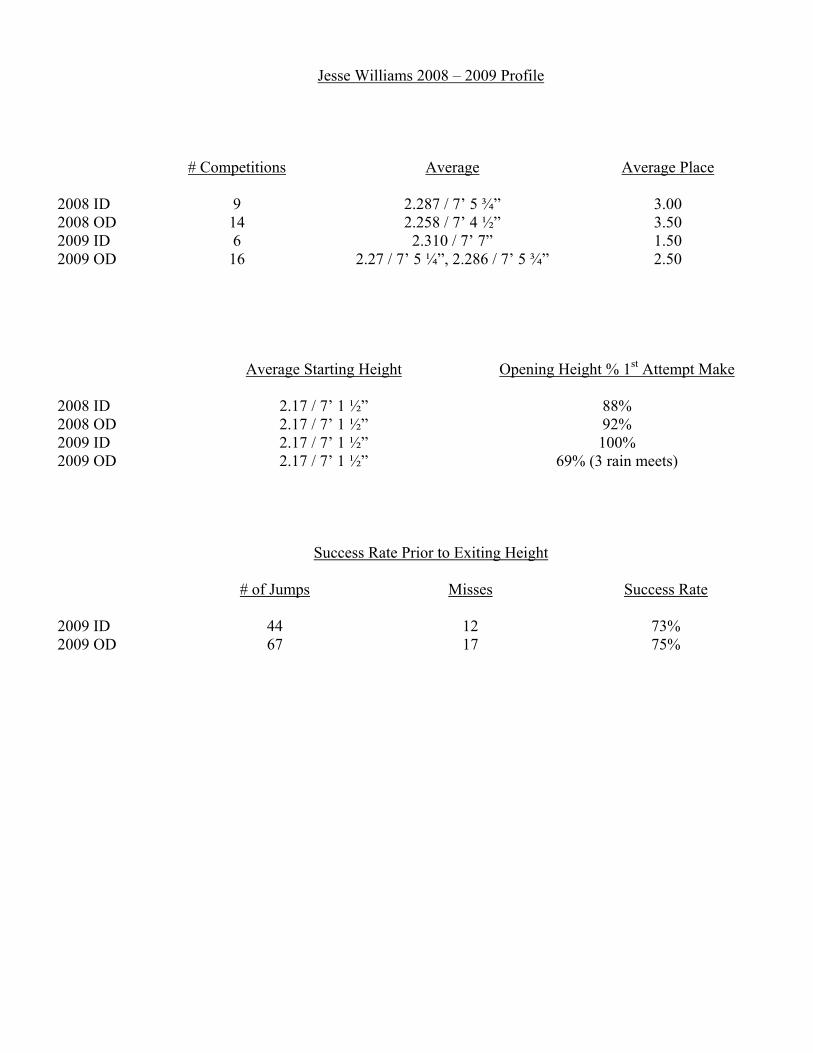
Jesse Williams 2008 – 2009 Profile
# Competitions Average Average Place 2008 ID 9 2.287 / 7’ 5 ¾” 3.00 2008 OD 14 2.258 / 7’ 4 ½” 3.50 2009 ID 6 2.310 / 7’ 7” 1.50 2009 OD 16 2.27 / 7’ 5 ¼”, 2.286 / 7’ 5 ¾” 2.50
Average Starting Height Opening Height % 1st Attempt Make 2008 ID 2.17 / 7’ 1 ½” 88% 2008 OD 2.17 / 7’ 1 ½” 92% 2009 ID 2.17 / 7’ 1 ½” 100% 2009 OD 2.17 / 7’ 1 ½” 69% (3 rain meets)
Success Rate Prior to Exiting Height
# of Jumps Misses Success Rate 2009 ID 44 12 73% 2009 OD 67 17 75%
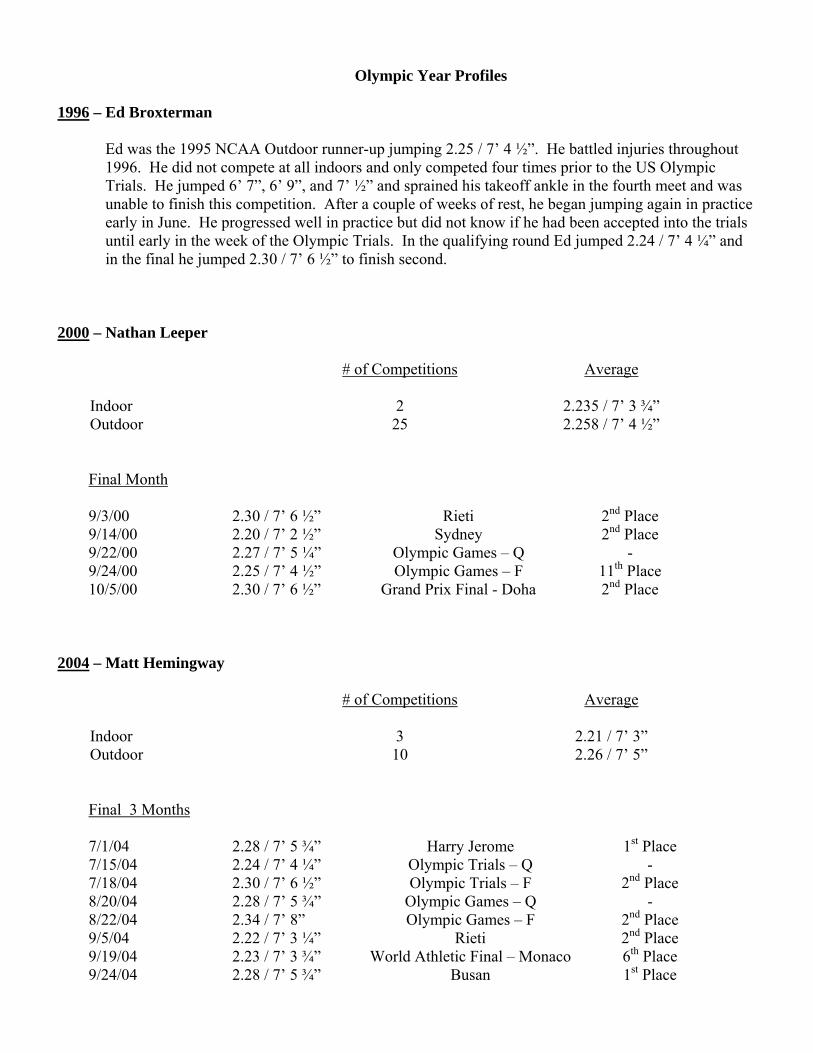
Olympic Year Profiles
1996 – Ed Broxterman
Ed was the 1995 NCAA Outdoor runner-up jumping 2.25 / 7’ 4 ½”. He battled injuries throughout 1996. He did not compete at all indoors and only competed four times prior to the US Olympic Trials. He jumped 6’ 7”, 6’ 9”, and 7’ ½” and sprained his takeoff ankle in the fourth meet and was unable to finish this competition. After a couple of weeks of rest, he began jumping again in practice early in June. He progressed well in practice but did not know if he had been accepted into the trials until early in the week of the Olympic Trials. In the qualifying round Ed jumped 2.24 / 7’ 4 ¼” and in the final he jumped 2.30 / 7’ 6 ½” to finish second.
2000 – Nathan Leeper
# of Competitions Average Indoor 2 2.235 / 7’ 3 ¾” Outdoor 25 2.258 / 7’ 4 ½”
Final Month 9/3/00 2.30 / 7’ 6 ½” Rieti 2nd Place 9/14/00 2.20 / 7’ 2 ½” Sydney 2nd Place 9/22/00 2.27 / 7’ 5 ¼” Olympic Games – Q - 9/24/00 2.25 / 7’ 4 ½” Olympic Games – F 11th Place 10/5/00 2.30 / 7’ 6 ½” Grand Prix Final - Doha 2nd Place
2004 – Matt Hemingway
# of Competitions Average Indoor 3 2.21 / 7’ 3” Outdoor 10 2.26 / 7’ 5”
Final 3 Months 7/1/04 2.28 / 7’ 5 ¾” Harry Jerome 1st Place 7/15/04 2.24 / 7’ 4 ¼” Olympic Trials – Q - 7/18/04 2.30 / 7’ 6 ½” Olympic Trials – F 2nd Place 8/20/04 2.28 / 7’ 5 ¾” Olympic Games – Q - 8/22/04 2.34 / 7’ 8” Olympic Games – F 2nd Place 9/5/04 2.22 / 7’ 3 ¼” Rieti 2nd Place 9/19/04 2.23 / 7’ 3 ¾” World Athletic Final – Monaco 6th Place 9/24/04 2.28 / 7’ 5 ¾” Busan 1st Place
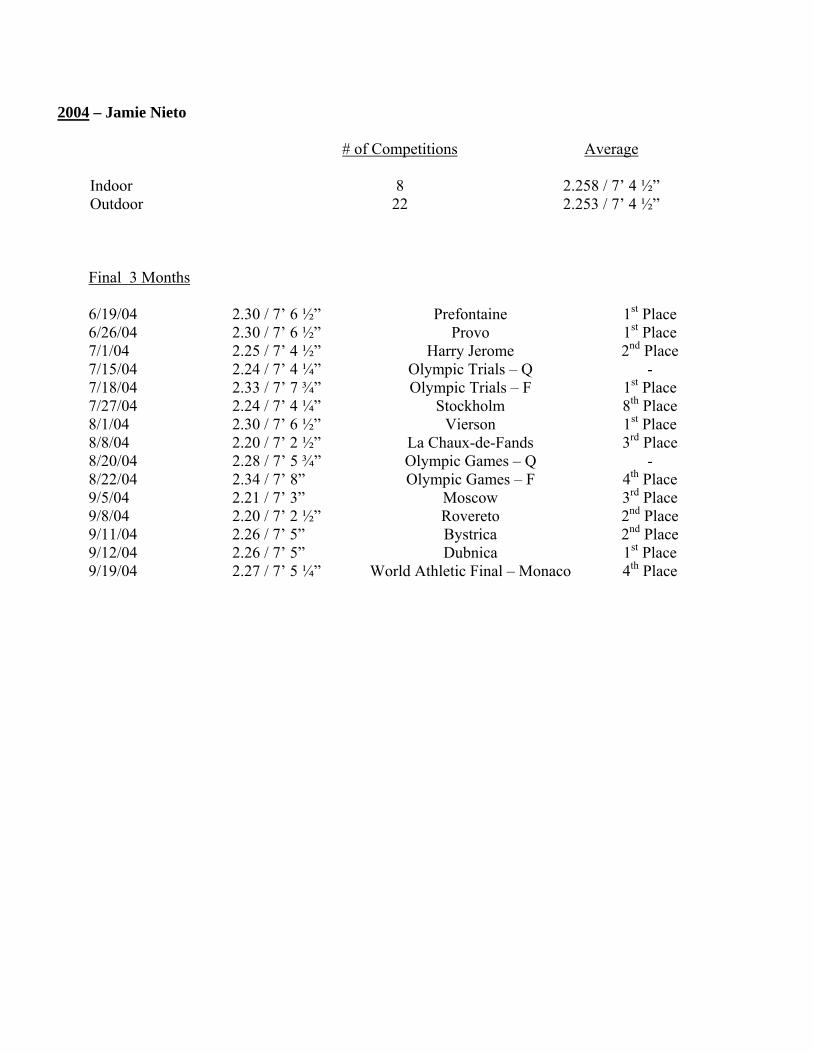
2004 – Jamie Nieto
# of Competitions Average Indoor 8 2.258 / 7’ 4 ½” Outdoor 22 2.253 / 7’ 4 ½”
Final 3 Months 6/19/04 2.30 / 7’ 6 ½” Prefontaine 1st Place 6/26/04 2.30 / 7’ 6 ½” Provo 1st Place 7/1/04 2.25 / 7’ 4 ½” Harry Jerome 2nd Place 7/15/04 2.24 / 7’ 4 ¼” Olympic Trials – Q - 7/18/04 2.33 / 7’ 7 ¾” Olympic Trials – F 1st Place 7/27/04 2.24 / 7’ 4 ¼” Stockholm 8th Place 8/1/04 2.30 / 7’ 6 ½” Vierson 1st Place 8/8/04 2.20 / 7’ 2 ½” La Chaux-de-Fands 3rd Place 8/20/04 2.28 / 7’ 5 ¾” Olympic Games – Q - 8/22/04 2.34 / 7’ 8” Olympic Games – F 4th Place 9/5/04 2.21 / 7’ 3” Moscow 3rd Place 9/8/04 2.20 / 7’ 2 ½” Rovereto 2nd Place 9/11/04 2.26 / 7’ 5” Bystrica 2nd Place 9/12/04 2.26 / 7’ 5” Dubnica 1st Place 9/19/04 2.27 / 7’ 5 ¼” World Athletic Final – Monaco 4th Place
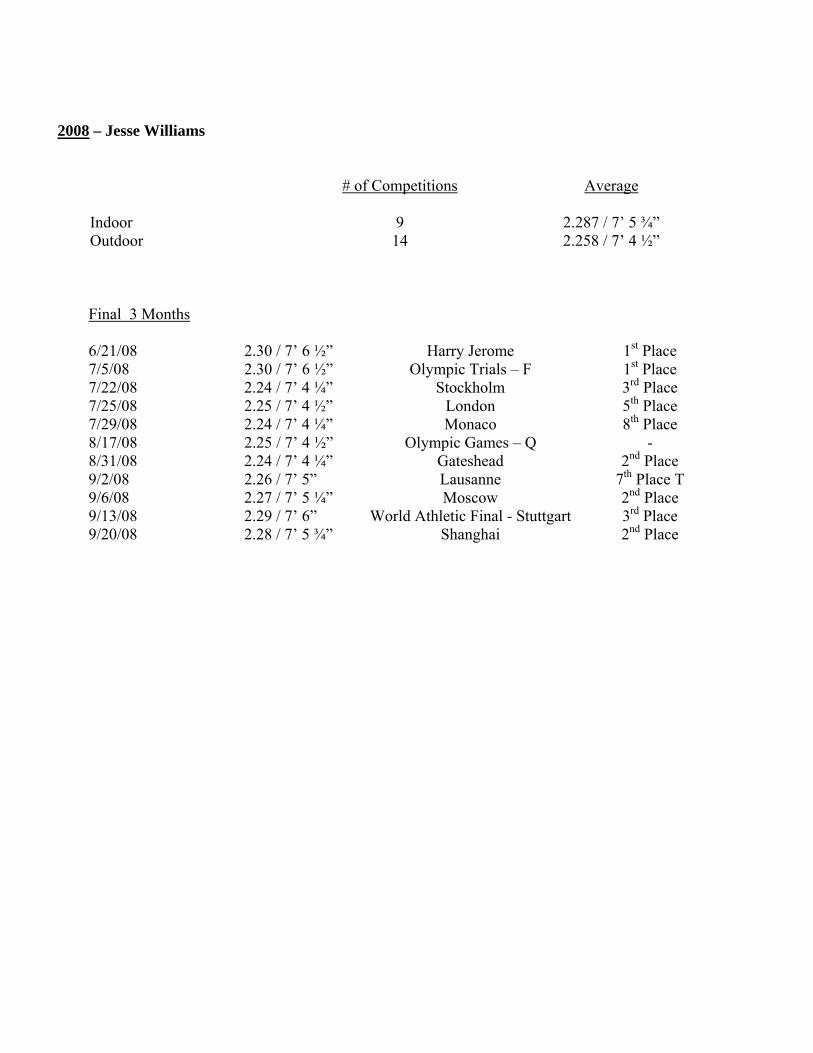
2008 – Jesse Williams
# of Competitions Average Indoor 9 2.287 / 7’ 5 ¾” Outdoor 14 2.258 / 7’ 4 ½”
Final 3 Months 6/21/08 2.30 / 7’ 6 ½” Harry Jerome 1st Place 7/5/08 2.30 / 7’ 6 ½” Olympic Trials – F 1st Place 7/22/08 2.24 / 7’ 4 ¼” Stockholm 3rd Place 7/25/08 2.25 / 7’ 4 ½” London 5th Place 7/29/08 2.24 / 7’ 4 ¼” Monaco 8th Place 8/17/08 2.25 / 7’ 4 ½” Olympic Games – Q - 8/31/08 2.24 / 7’ 4 ¼” Gateshead 2nd Place 9/2/08 2.26 / 7’ 5” Lausanne 7th Place T 9/6/08 2.27 / 7’ 5 ¼” Moscow 2nd Place 9/13/08 2.29 / 7’ 6” World Athletic Final - Stuttgart 3rd Place 9/20/08 2.28 / 7’ 5 ¾” Shanghai 2nd Place
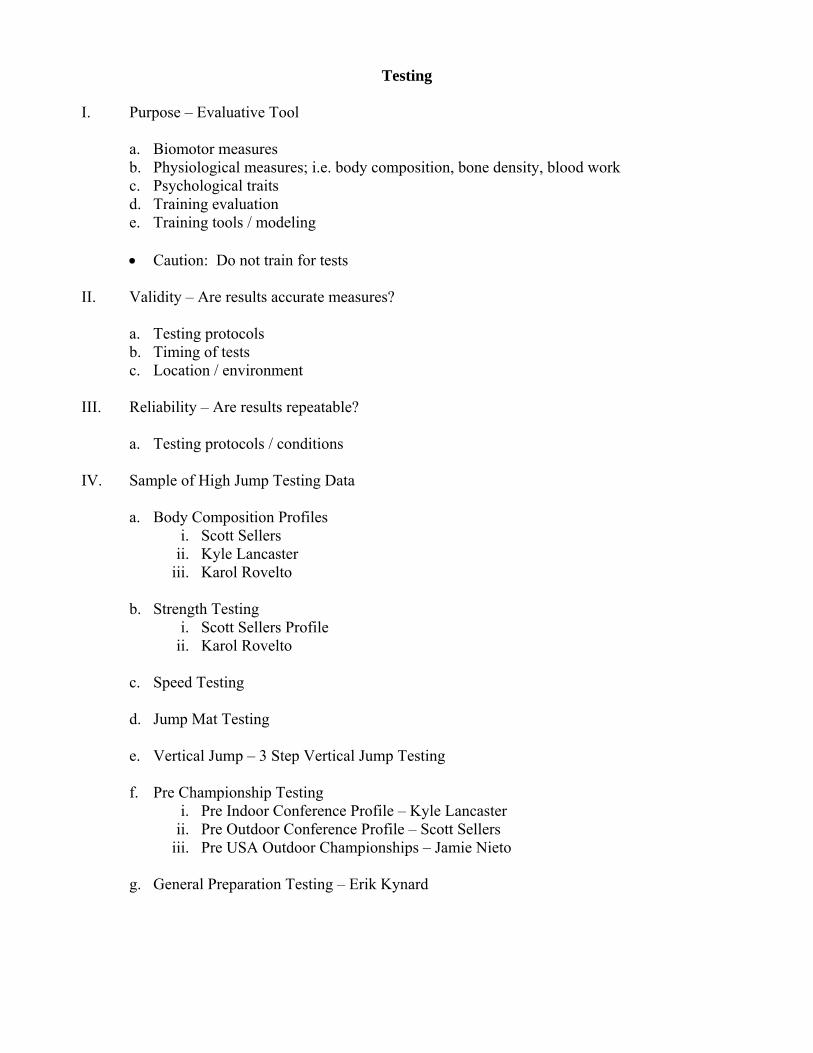
Testing
I. Purpose – Evaluative Tool
a. Biomotor measures b. Physiological measures; i.e. body composition, bone density, blood work c. Psychological traits d. Training evaluation e. Training tools / modeling
• Caution: Do not train for tests
II. Validity – Are results accurate measures?
a. Testing protocols b. Timing of tests c. Location / environment
III. Reliability – Are results repeatable?
a. Testing protocols / conditions
IV. Sample of High Jump Testing Data
a. Body Composition Profiles
i. Scott Sellers ii. Kyle Lancaster
iii. Karol Rovelto
b. Strength Testing i. Scott Sellers Profile
ii. Karol Rovelto
c. Speed Testing
d. Jump Mat Testing
e. Vertical Jump – 3 Step Vertical Jump Testing
f. Pre Championship Testing i. Pre Indoor Conference Profile – Kyle Lancaster
ii. Pre Outdoor Conference Profile – Scott Sellers iii. Pre USA Outdoor Championships – Jamie Nieto
g. General Preparation Testing – Erik Kynard
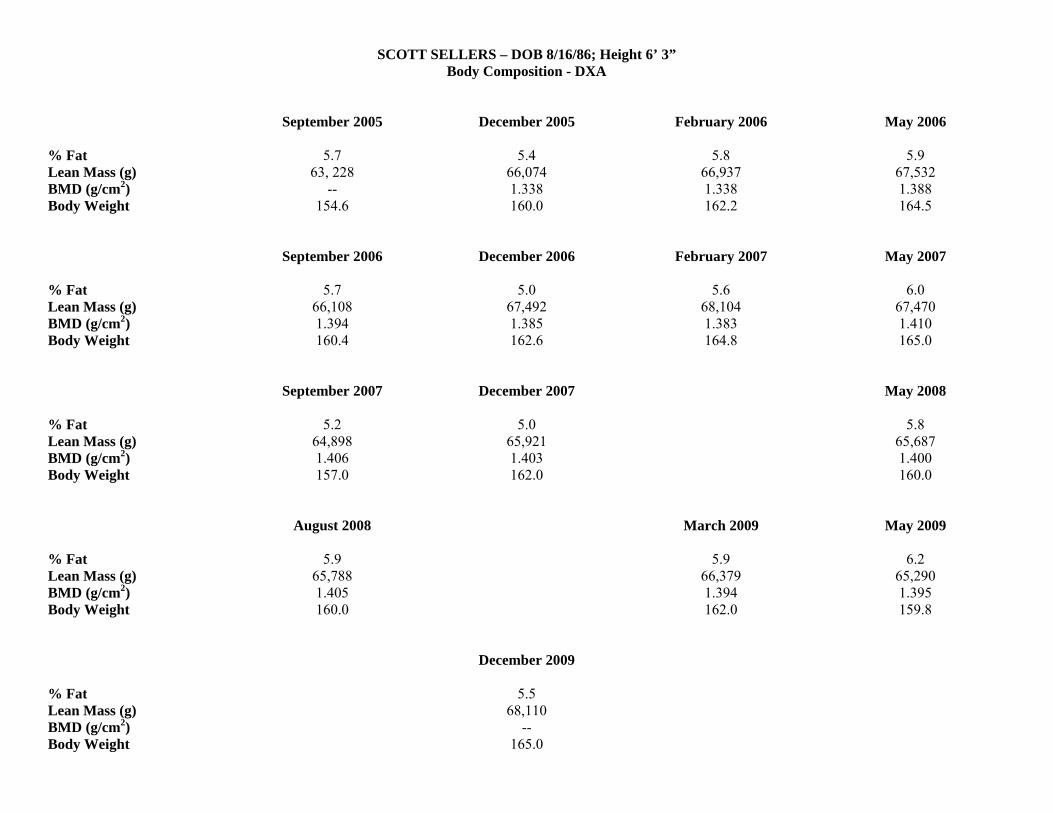
SCOTT SELLERS – DOB 8/16/86; Height 6’ 3”
Body Composition - DXA September 2005 December 2005 February 2006 May 2006 % Fat 5.7 5.4 5.8 5.9 Lean Mass (g) 63, 228 66,074 66,937 67,532 BMD (g/cm2) -- 1.338 1.338 1.388 Body Weight 154.6 160.0 162.2 164.5 September 2006 December 2006 February 2007 May 2007 % Fat 5.7 5.0 5.6 6.0 Lean Mass (g) 66,108 67,492 68,104 67,470 BMD (g/cm2) 1.394 1.385 1.383 1.410 Body Weight 160.4 162.6 164.8 165.0 September 2007 December 2007 May 2008 % Fat 5.2 5.0 5.8 Lean Mass (g) 64,898 65,921 65,687 BMD (g/cm2) 1.406 1.403 1.400 Body Weight 157.0 162.0 160.0 August 2008 March 2009 May 2009 % Fat 5.9 5.9 6.2 Lean Mass (g) 65,788 66,379 65,290 BMD (g/cm2) 1.405 1.394 1.395 Body Weight 160.0 162.0 159.8 December 2009 % Fat 5.5 Lean Mass (g) 68,110 BMD (g/cm2) -- Body Weight 165.0
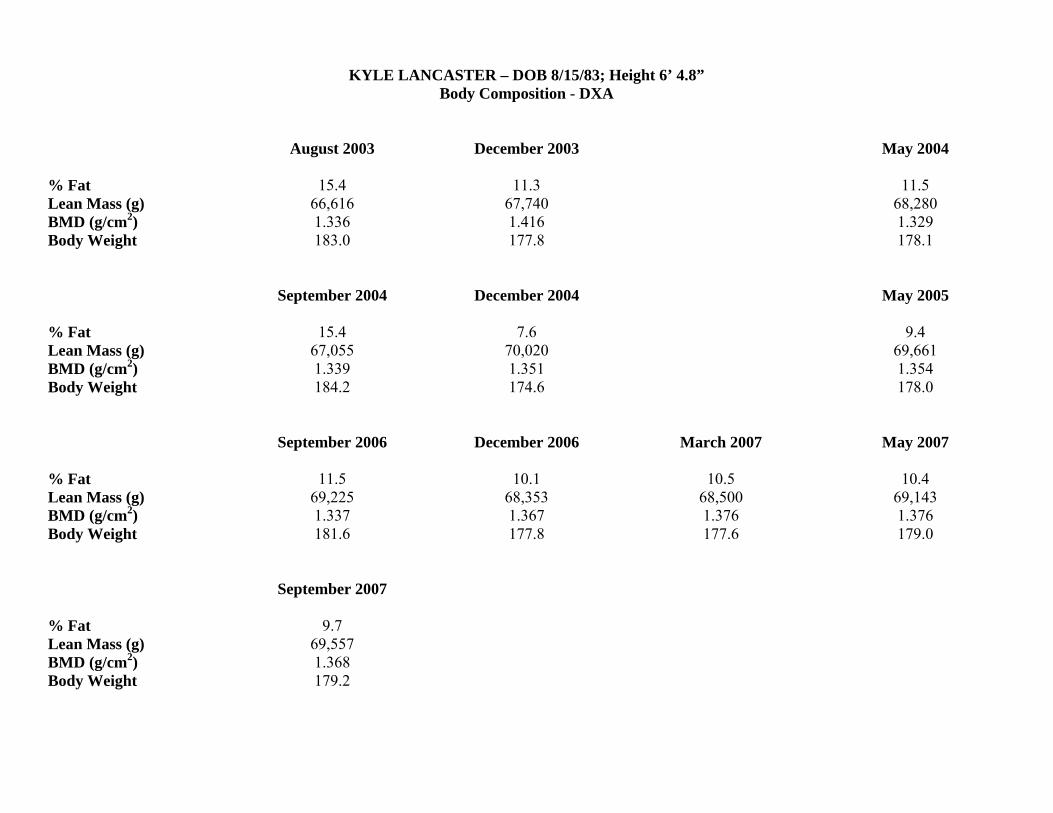
KYLE LANCASTER – DOB 8/15/83; Height 6’ 4.8” Body Composition - DXA
August 2003 December 2003 May 2004 % Fat 15.4 11.3 11.5 Lean Mass (g) 66,616 67,740 68,280 BMD (g/cm2) 1.336 1.416 1.329 Body Weight 183.0 177.8 178.1 September 2004 December 2004 May 2005 % Fat 15.4 7.6 9.4 Lean Mass (g) 67,055 70,020 69,661 BMD (g/cm2) 1.339 1.351 1.354 Body Weight 184.2 174.6 178.0 September 2006 December 2006 March 2007 May 2007 % Fat 11.5 10.1 10.5 10.4 Lean Mass (g) 69,225 68,353 68,500 69,143 BMD (g/cm2) 1.337 1.367 1.376 1.376 Body Weight 181.6 177.8 177.6 179.0 September 2007 % Fat 9.7 Lean Mass (g) 69,557 BMD (g/cm2) 1.368 Body Weight 179.2
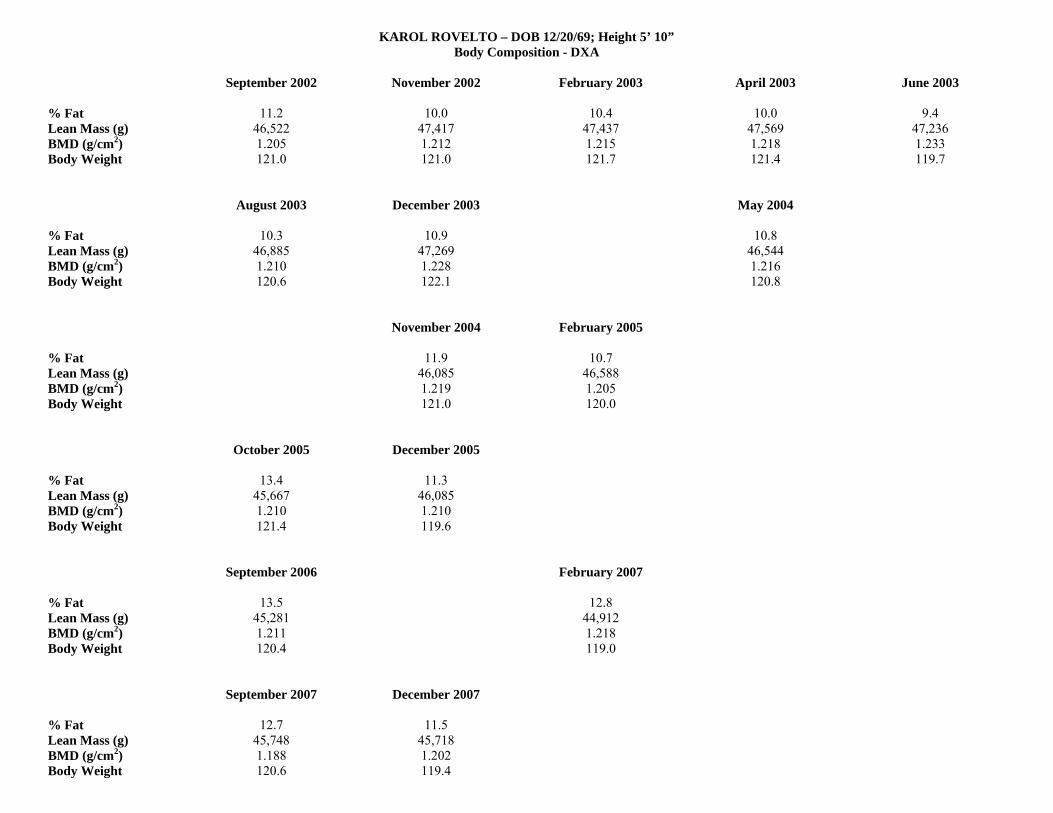
KAROL ROVELTO – DOB 12/20/69; Height 5’ 10” Body Composition - DXA
September 2002 November 2002 February 2003 April 2003 June 2003 % Fat 11.2 10.0 10.4 10.0 9.4 Lean Mass (g) 46,522 47,417 47,437 47,569 47,236 BMD (g/cm2) 1.205 1.212 1.215 1.218 1.233 Body Weight 121.0 121.0 121.7 121.4 119.7 August 2003 December 2003 May 2004 % Fat 10.3 10.9 10.8 Lean Mass (g) 46,885 47,269 46,544 BMD (g/cm2) 1.210 1.228 1.216 Body Weight 120.6 122.1 120.8 November 2004 February 2005 % Fat 11.9 10.7 Lean Mass (g) 46,085 46,588 BMD (g/cm2) 1.219 1.205 Body Weight 121.0 120.0 October 2005 December 2005 % Fat 13.4 11.3 Lean Mass (g) 45,667 46,085 BMD (g/cm2) 1.210 1.210 Body Weight 121.4 119.6 September 2006 February 2007 % Fat 13.5 12.8 Lean Mass (g) 45,281 44,912 BMD (g/cm2) 1.211 1.218 Body Weight 120.4 119.0 September 2007 December 2007 % Fat 12.7 11.5 Lean Mass (g) 45,748 45,718 BMD (g/cm2) 1.188 1.202 Body Weight 120.6 119.4
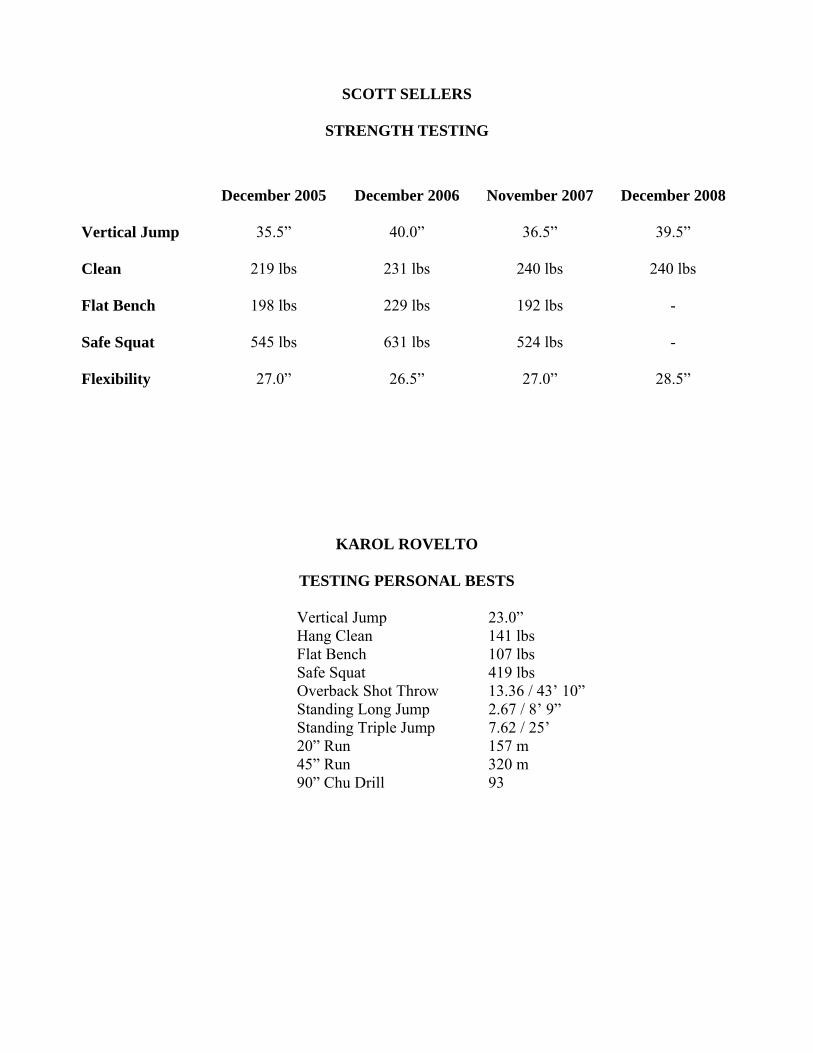
SCOTT SELLERS
STRENGTH TESTING
KAROL ROVELTO
TESTING PERSONAL BESTS Vertical Jump 23.0” Hang Clean 141 lbs Flat Bench 107 lbs Safe Squat 419 lbs Overback Shot Throw 13.36 / 43’ 10” Standing Long Jump 2.67 / 8’ 9” Standing Triple Jump 7.62 / 25’ 20” Run 157 m 45” Run 320 m 90” Chu Drill 93
December 2005 December 2006 November 2007 December 2008 Vertical Jump 35.5” 40.0” 36.5” 39.5” Clean 219 lbs 231 lbs 240 lbs 240 lbs Flat Bench 198 lbs 229 lbs 192 lbs - Safe Squat 545 lbs 631 lbs 524 lbs - Flexibility 27.0” 26.5” 27.0” 28.5”
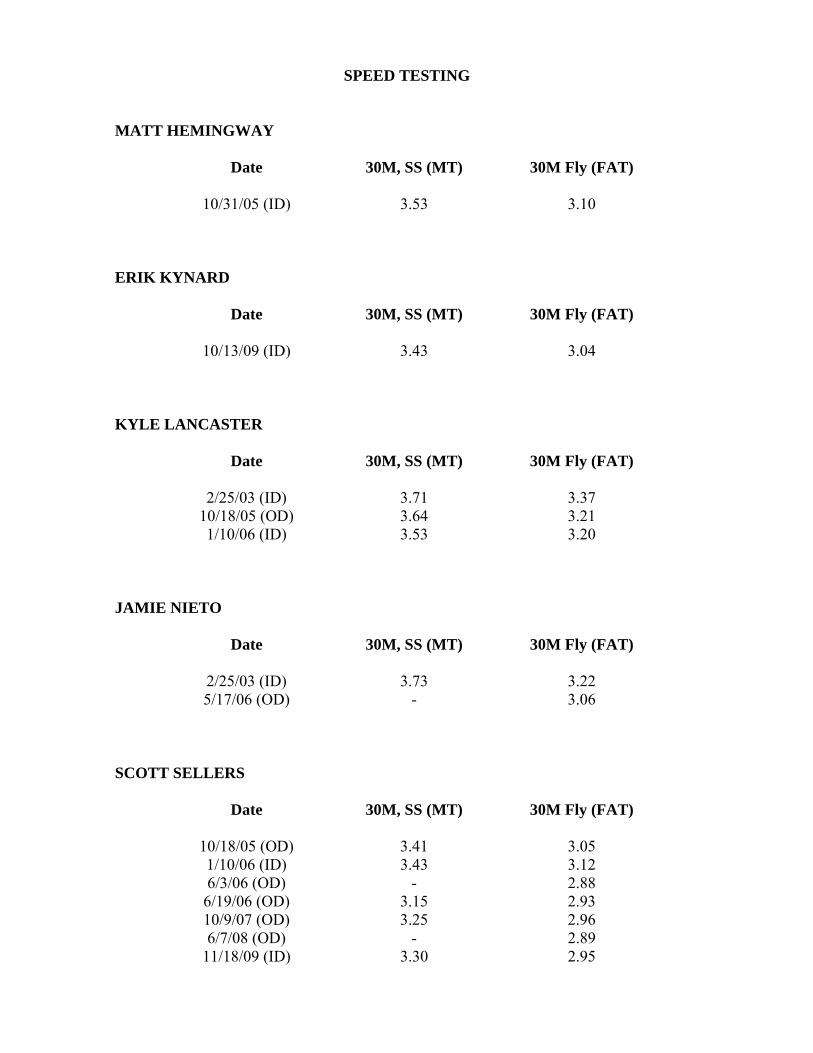
SPEED TESTING
MATT HEMINGWAY
Date 30M, SS (MT) 30M Fly (FAT)
10/31/05 (ID) 3.53 3.10
ERIK KYNARD
Date 30M, SS (MT) 30M Fly (FAT)
10/13/09 (ID) 3.43 3.04
KYLE LANCASTER
Date 30M, SS (MT) 30M Fly (FAT)
2/25/03 (ID) 3.71 3.37 10/18/05 (OD) 3.64 3.21 1/10/06 (ID) 3.53 3.20
JAMIE NIETO
Date 30M, SS (MT) 30M Fly (FAT)
2/25/03 (ID) 3.73 3.22 5/17/06 (OD) - 3.06
SCOTT SELLERS
Date 30M, SS (MT) 30M Fly (FAT)
10/18/05 (OD) 3.41 3.05 1/10/06 (ID) 3.43 3.12 6/3/06 (OD) - 2.88 6/19/06 (OD) 3.15 2.93 10/9/07 (OD) 3.25 2.96 6/7/08 (OD) - 2.89
11/18/09 (ID) 3.30 2.95
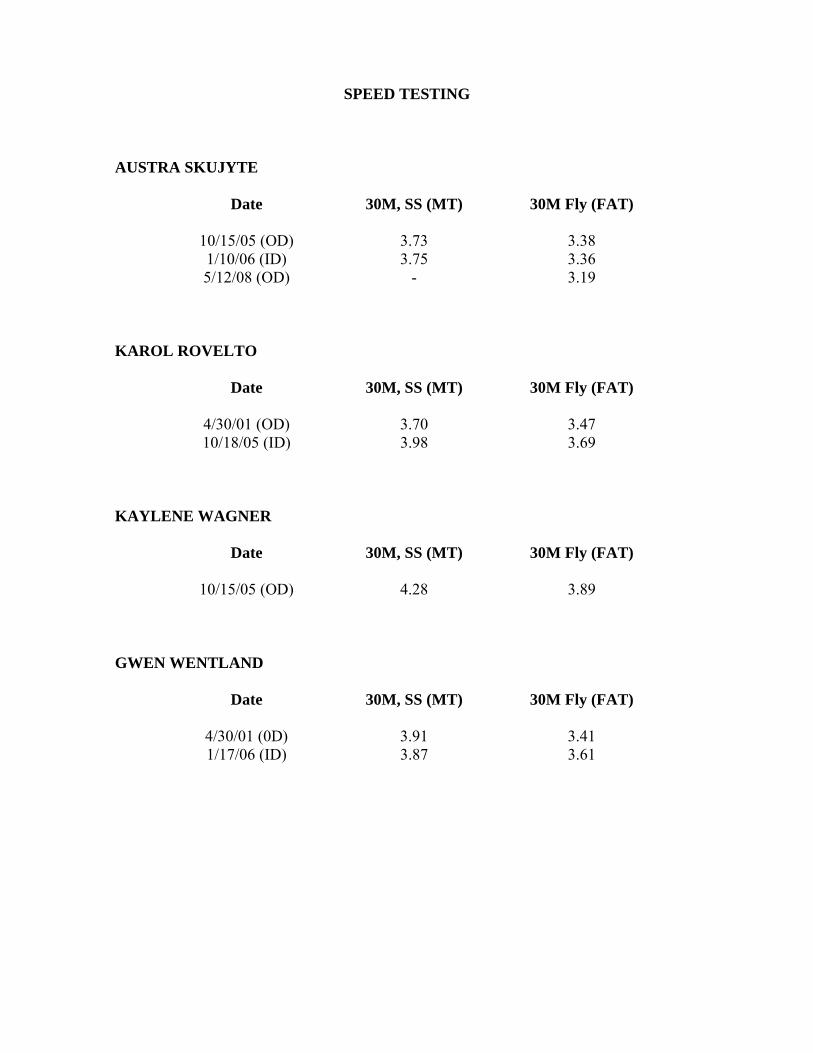
SPEED TESTING AUSTRA SKUJYTE
Date 30M, SS (MT) 30M Fly (FAT)
10/15/05 (OD) 3.73 3.38 1/10/06 (ID) 3.75 3.36 5/12/08 (OD) - 3.19
KAROL ROVELTO
Date 30M, SS (MT) 30M Fly (FAT)
4/30/01 (OD) 3.70 3.47 10/18/05 (ID) 3.98 3.69
KAYLENE WAGNER
Date 30M, SS (MT) 30M Fly (FAT)
10/15/05 (OD) 4.28 3.89
GWEN WENTLAND
Date 30M, SS (MT) 30M Fly (FAT)
4/30/01 (0D) 3.91 3.41 1/17/06 (ID) 3.87 3.61
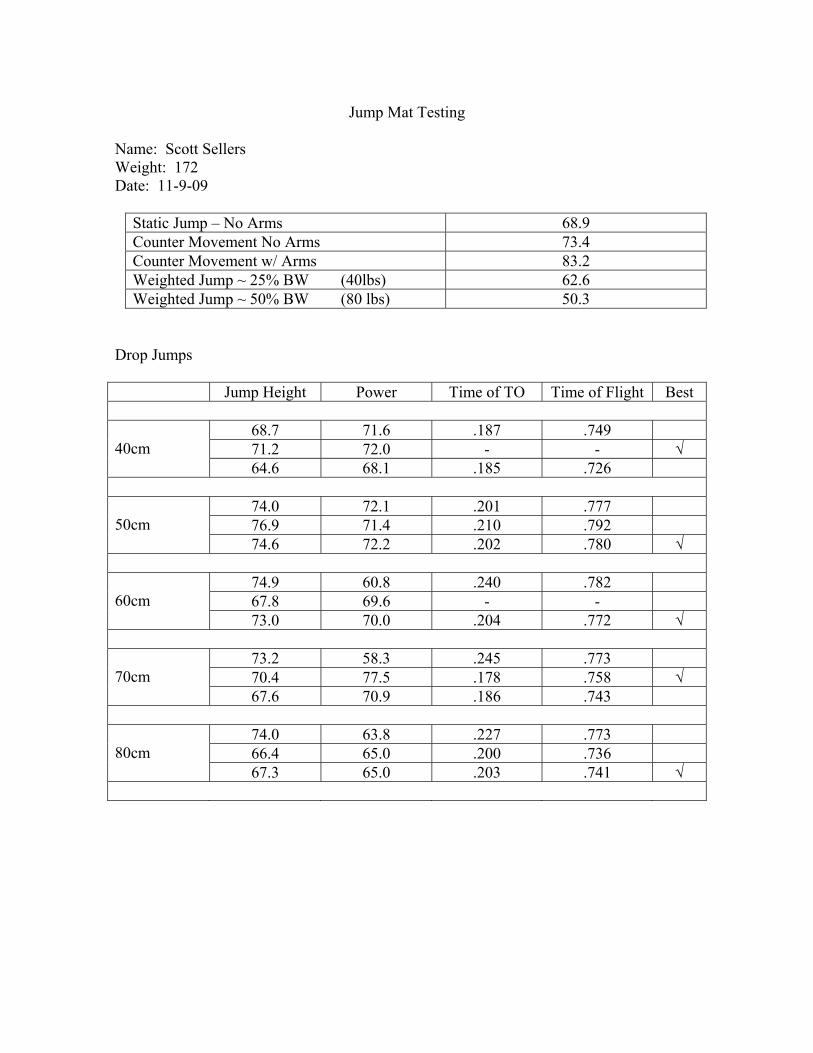
Jump Mat Testing Name: Scott Sellers Weight: 172 Date: 11-9-09
Static Jump – No Arms 68.9 Counter Movement No Arms 73.4 Counter Movement w/ Arms 83.2 Weighted Jump ~ 25% BW (40lbs) 62.6 Weighted Jump ~ 50% BW (80 lbs) 50.3
Drop Jumps Jump Height Power Time of TO Time of Flight Best 40cm
68.7 71.6 .187 .749 71.2 72.0 - - √ 64.6 68.1 .185 .726
50cm
74.0 72.1 .201 .777 76.9 71.4 .210 .792 74.6 72.2 .202 .780 √
60cm
74.9 60.8 .240 .782 67.8 69.6 - - 73.0 70.0 .204 .772 √
70cm
73.2 58.3 .245 .773 70.4 77.5 .178 .758 √ 67.6 70.9 .186 .743
80cm
74.0 63.8 .227 .773 66.4 65.0 .200 .736 67.3 65.0 .203 .741 √
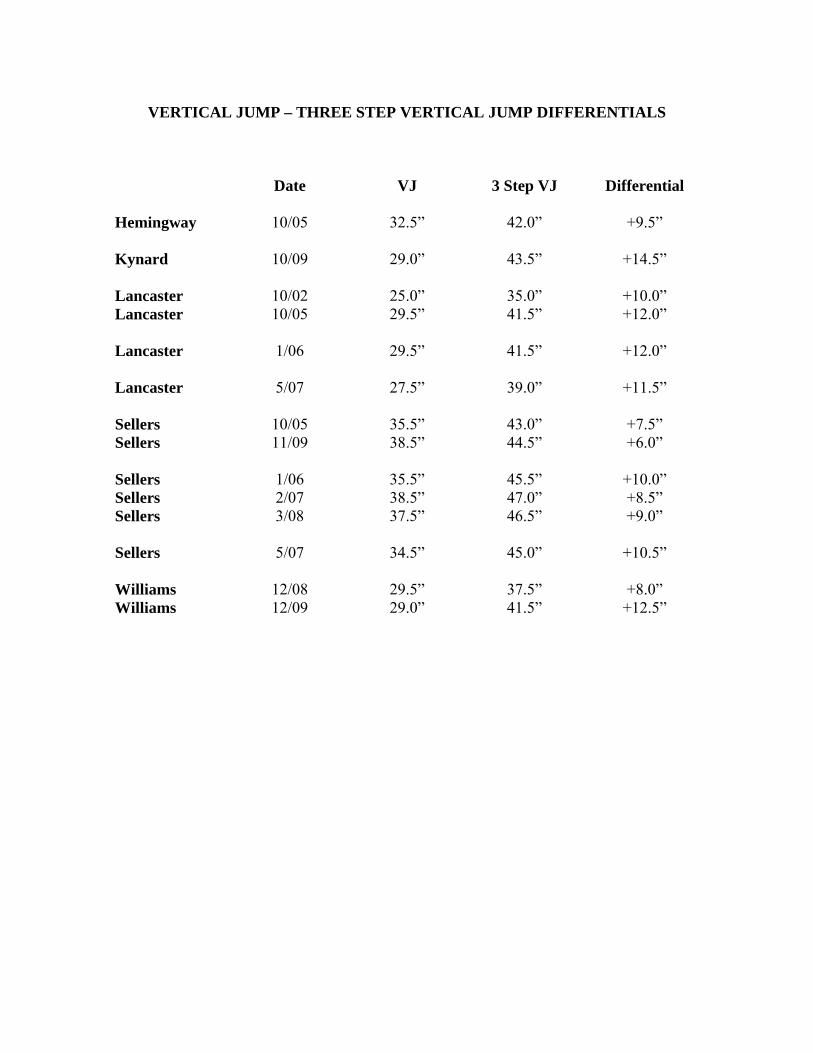
VERTICAL JUMP – THREE STEP VERTICAL JUMP DIFFERENTIALS
Date VJ 3 Step VJ Differential Hemingway 10/05 32.5” 42.0” +9.5” Kynard 10/09 29.0” 43.5” +14.5” Lancaster 10/02 25.0” 35.0” +10.0” Lancaster 10/05 29.5” 41.5” +12.0” Lancaster 1/06 29.5” 41.5” +12.0” Lancaster 5/07 27.5” 39.0” +11.5” Sellers 10/05 35.5” 43.0” +7.5” Sellers 11/09 38.5” 44.5” +6.0” Sellers 1/06 35.5” 45.5” +10.0” Sellers 2/07 38.5” 47.0” +8.5” Sellers 3/08 37.5” 46.5” +9.0” Sellers 5/07 34.5” 45.0” +10.5” Williams 12/08 29.5” 37.5” +8.0” Williams 12/09 29.0” 41.5” +12.5”
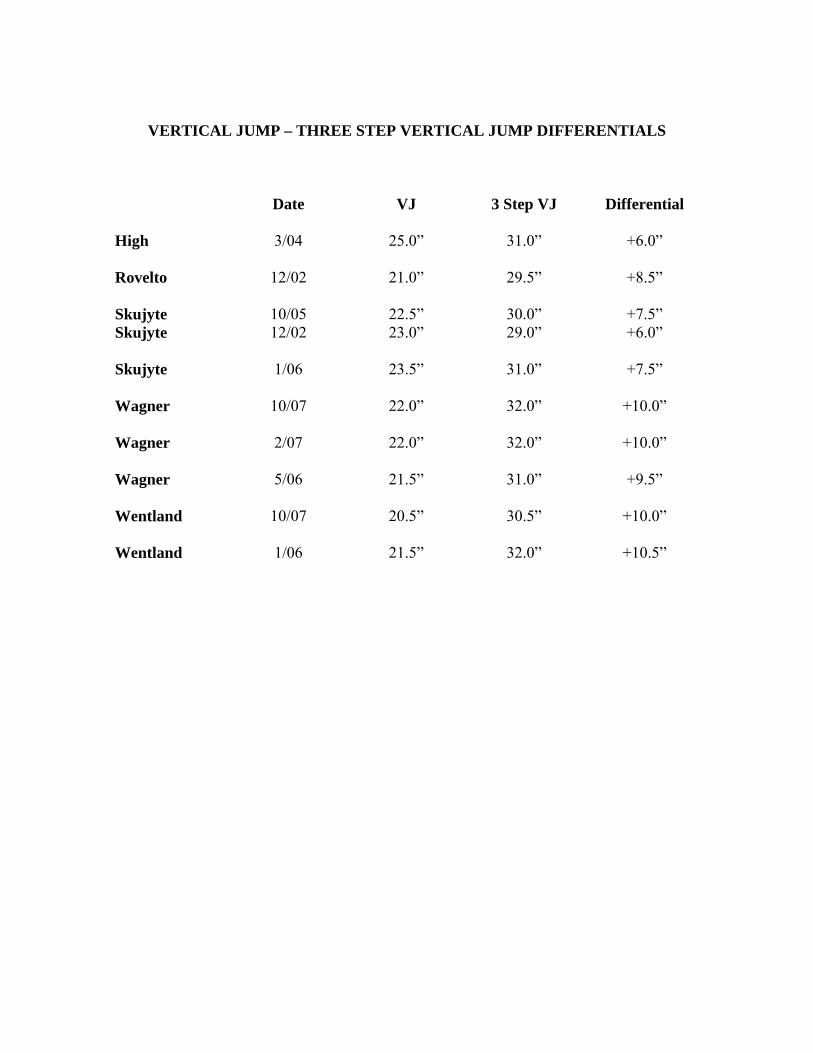
VERTICAL JUMP – THREE STEP VERTICAL JUMP DIFFERENTIALS
Date VJ 3 Step VJ Differential High 3/04 25.0” 31.0” +6.0” Rovelto 12/02 21.0” 29.5” +8.5” Skujyte 10/05 22.5” 30.0” +7.5” Skujyte 12/02 23.0” 29.0” +6.0” Skujyte 1/06 23.5” 31.0” +7.5” Wagner 10/07 22.0” 32.0” +10.0” Wagner 2/07 22.0” 32.0” +10.0” Wagner 5/06 21.5” 31.0” +9.5” Wentland 10/07 20.5” 30.5” +10.0” Wentland 1/06 21.5” 32.0” +10.5”
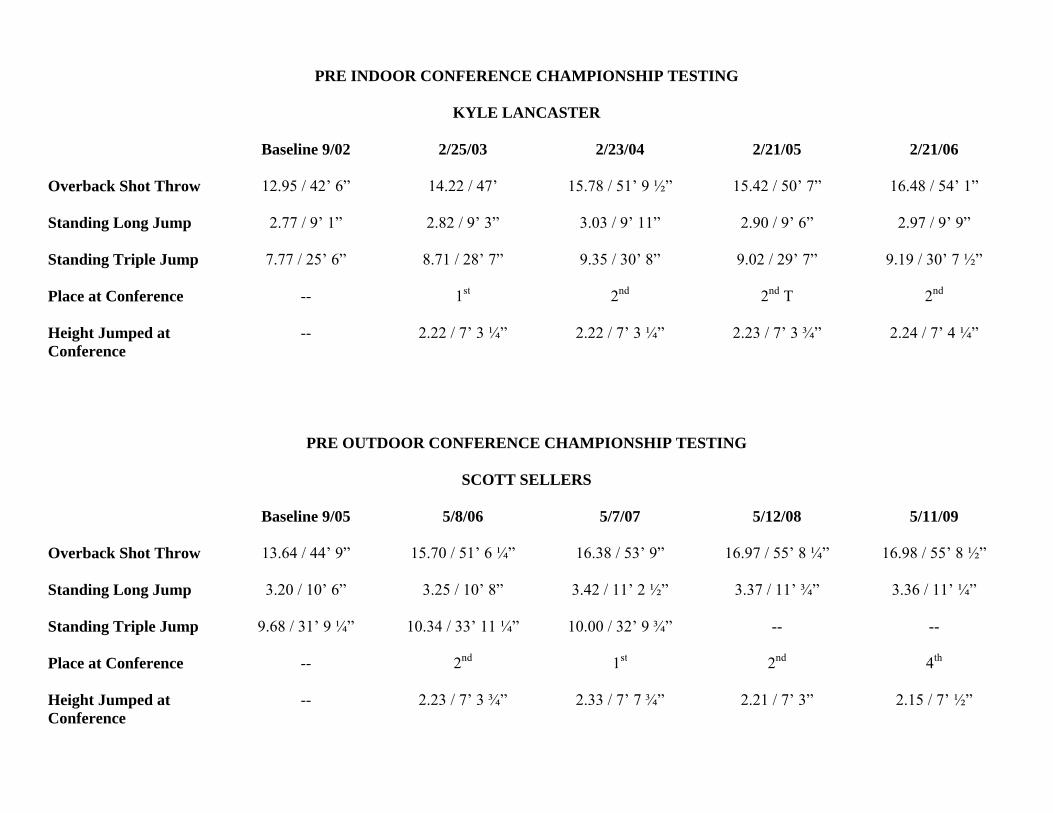
PRE INDOOR CONFERENCE CHAMPIONSHIP TESTING
KYLE LANCASTER
Baseline 9/02 2/25/03 2/23/04 2/21/05 2/21/06 Overback Shot Throw 12.95 / 42’ 6” 14.22 / 47’ 15.78 / 51’ 9 ½” 15.42 / 50’ 7” 16.48 / 54’ 1” Standing Long Jump 2.77 / 9’ 1” 2.82 / 9’ 3” 3.03 / 9’ 11” 2.90 / 9’ 6” 2.97 / 9’ 9” Standing Triple Jump 7.77 / 25’ 6” 8.71 / 28’ 7” 9.35 / 30’ 8” 9.02 / 29’ 7” 9.19 / 30’ 7 ½” Place at Conference -- 1st 2nd 2nd T 2nd Height Jumped at Conference
-- 2.22 / 7’ 3 ¼” 2.22 / 7’ 3 ¼” 2.23 / 7’ 3 ¾” 2.24 / 7’ 4 ¼”
PRE OUTDOOR CONFERENCE CHAMPIONSHIP TESTING
SCOTT SELLERS
Baseline 9/05 5/8/06 5/7/07 5/12/08 5/11/09 Overback Shot Throw 13.64 / 44’ 9” 15.70 / 51’ 6 ¼” 16.38 / 53’ 9” 16.97 / 55’ 8 ¼” 16.98 / 55’ 8 ½” Standing Long Jump 3.20 / 10’ 6” 3.25 / 10’ 8” 3.42 / 11’ 2 ½” 3.37 / 11’ ¾” 3.36 / 11’ ¼” Standing Triple Jump 9.68 / 31’ 9 ¼” 10.34 / 33’ 11 ¼” 10.00 / 32’ 9 ¾” -- -- Place at Conference -- 2nd 1st 2nd 4th Height Jumped at Conference
-- 2.23 / 7’ 3 ¾” 2.33 / 7’ 7 ¾” 2.21 / 7’ 3” 2.15 / 7’ ½”
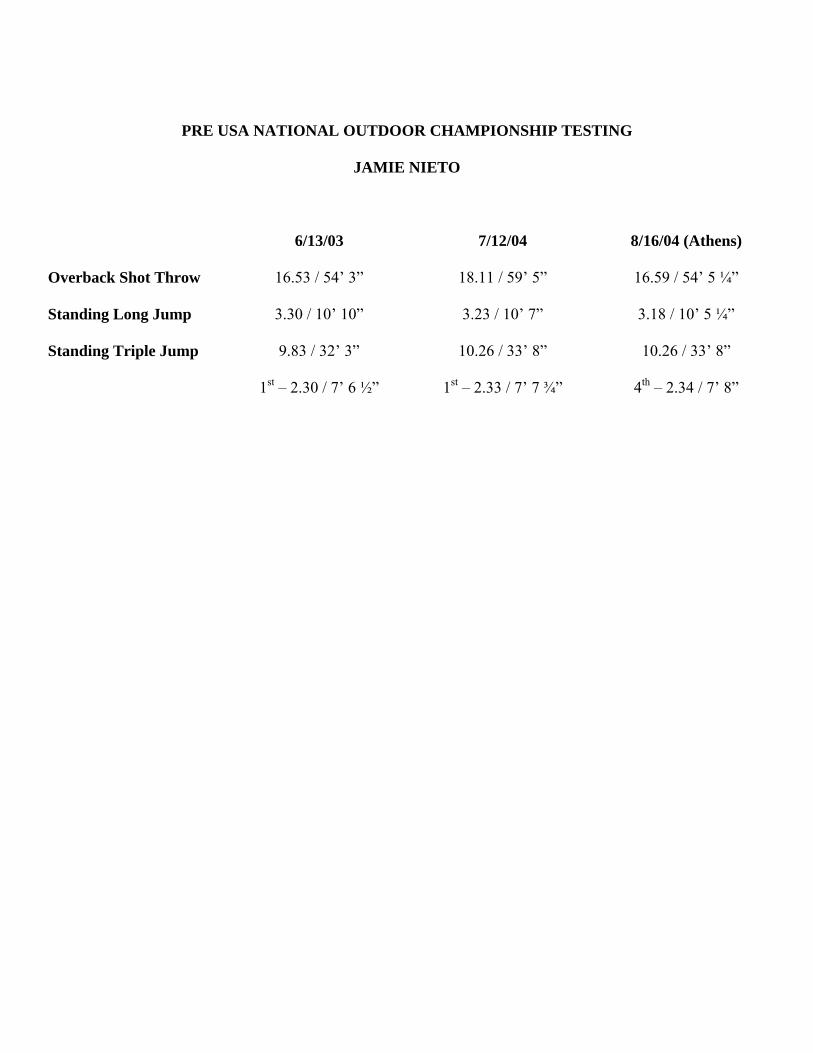
PRE USA NATIONAL OUTDOOR CHAMPIONSHIP TESTING
JAMIE NIETO
6/13/03 7/12/04 8/16/04 (Athens) Overback Shot Throw 16.53 / 54’ 3” 18.11 / 59’ 5” 16.59 / 54’ 5 ¼” Standing Long Jump 3.30 / 10’ 10” 3.23 / 10’ 7” 3.18 / 10’ 5 ¼” Standing Triple Jump 9.83 / 32’ 3” 10.26 / 33’ 8” 10.26 / 33’ 8” 1st – 2.30 / 7’ 6 ½” 1st – 2.33 / 7’ 7 ¾” 4th – 2.34 / 7’ 8”
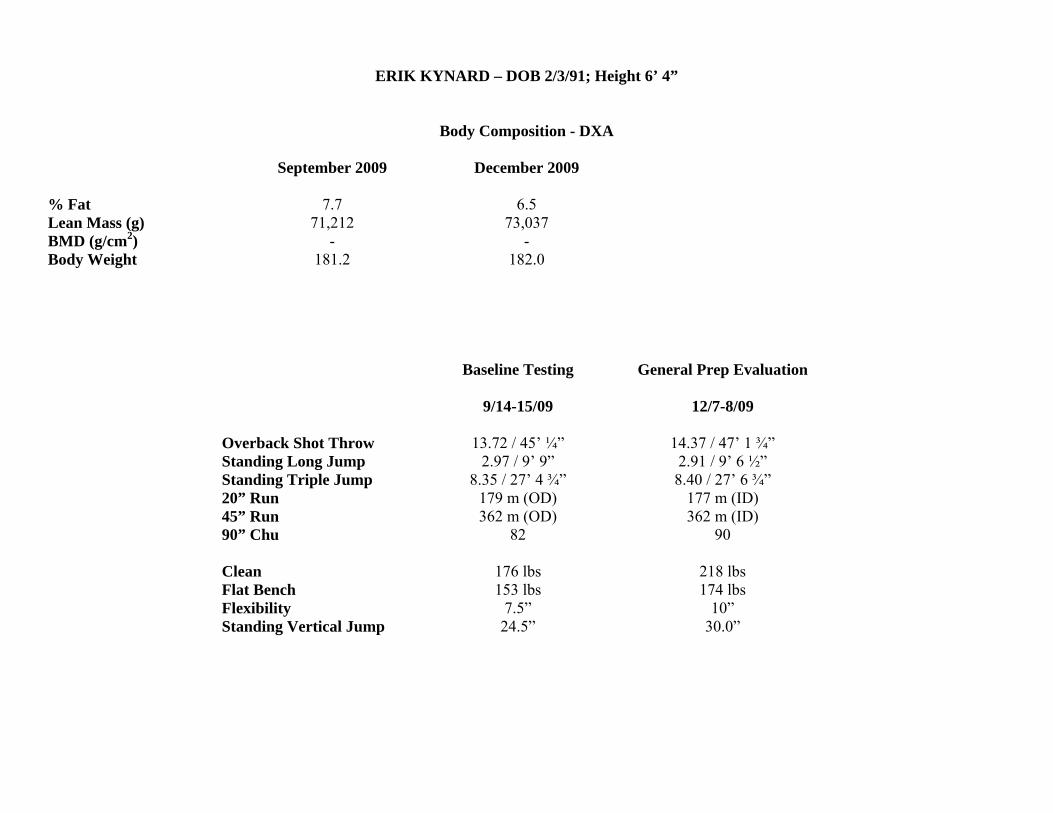
ERIK KYNARD – DOB 2/3/91; Height 6’ 4”
Body Composition - DXA
September 2009 December 2009 % Fat 7.7 6.5 Lean Mass (g) 71,212 73,037 BMD (g/cm2) - - Body Weight 181.2 182.0
Baseline Testing General Prep Evaluation 9/14-15/09 12/7-8/09 Overback Shot Throw 13.72 / 45’ ¼” 14.37 / 47’ 1 ¾” Standing Long Jump 2.97 / 9’ 9” 2.91 / 9’ 6 ½” Standing Triple Jump 8.35 / 27’ 4 ¾” 8.40 / 27’ 6 ¾” 20” Run 179 m (OD) 177 m (ID) 45” Run 362 m (OD) 362 m (ID) 90” Chu 82 90 Clean 176 lbs 218 lbs Flat Bench 153 lbs 174 lbs Flexibility 7.5” 10” Standing Vertical Jump 24.5” 30.0”


![[moves] - Neo-Arcadianeo-arcadia.com/neoencyclopedia/garou_mark_of_the_wolves_moves.pdf · close Tai-otoshi jump close Tai-hineri Command Moves then quickly jump Super Jump jump on](https://img.pdfslide.us/doc/110x75/5c11acf309d3f2b60f8c601d/moves-neo-arcadianeo-close-tai-otoshi-jump-close-tai-hineri-command-moves.jpg)