Embed Size (px)
Citation preview
1
HIGH-GROWTH ENTERPRISES AND GAZELLES – PRELIMINARY AND
SUMMARY SENSITIVITY ANALYSIS
Ditte Rude Petersen and Nadim Ahmad
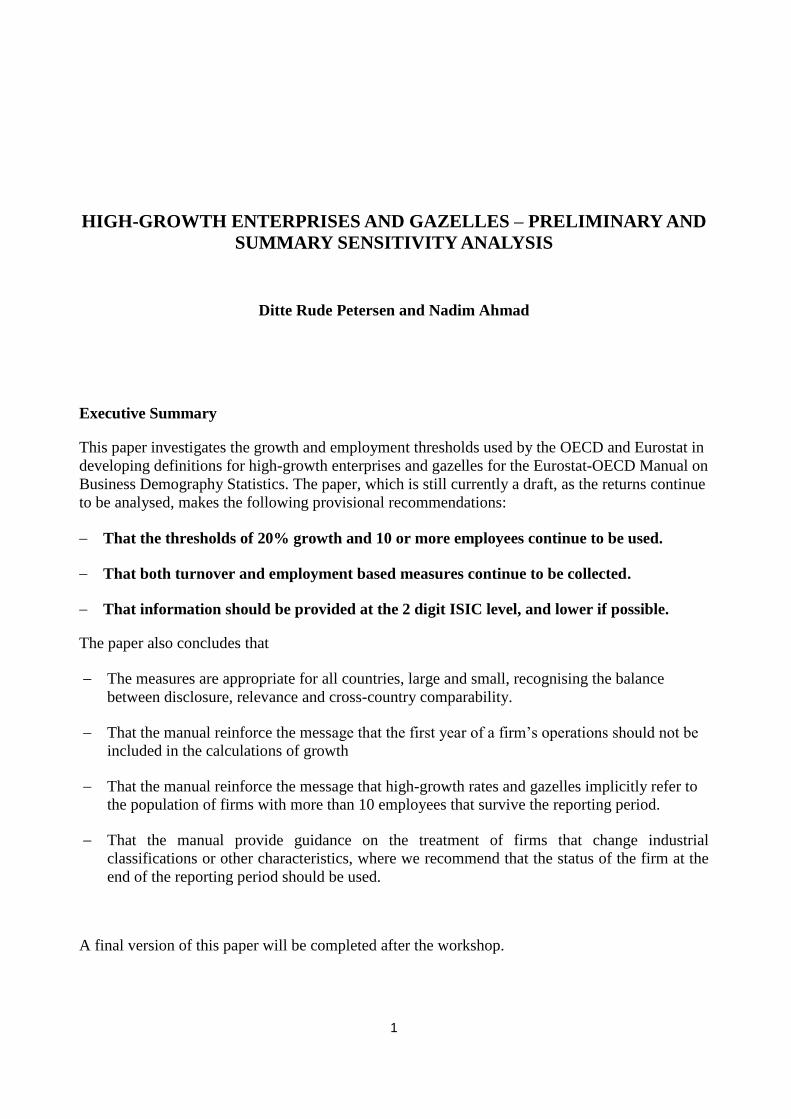
Executive Summary
This paper investigates the growth and employment thresholds used by the OECD and Eurostat in
developing definitions for high-growth enterprises and gazelles for the Eurostat-OECD Manual on
Business Demography Statistics. The paper, which is still currently a draft, as the returns continue
to be analysed, makes the following provisional recommendations:
That the thresholds of 20% growth and 10 or more employees continue to be used.
That both turnover and employment based measures continue to be collected.
That information should be provided at the 2 digit ISIC level, and lower if possible.
The paper also concludes that
The measures are appropriate for all countries, large and small, recognising the balance
between disclosure, relevance and cross-country comparability.
That the manual reinforce the message that the first year of a firm’s operations should not be
included in the calculations of growth
That the manual reinforce the message that high-growth rates and gazelles implicitly refer to
the population of firms with more than 10 employees that survive the reporting period.
That the manual provide guidance on the treatment of firms that change industrial
classifications or other characteristics, where we recommend that the status of the firm at the
end of the reporting period should be used.
A final version of this paper will be completed after the workshop.
2
HIGH-GROWTH ENTERPRISES AND GAZELLES – PRELIMINARY AND
SUMMARY SENSITIVITY ANALYSIS
Ditte Rude Petersen and Nadim Ahmad
Background
The OECD, as part of its Entrepreneurship Indicators Programme (EIP), and Eurostat, together
with experts from national statistics offices have worked together to produce a manual that
identifies, and provides practical advice on the measurement of, business demography indicators
(Eurostat-OECD Manual on Business Demography Statistics, forthcoming). One of the most
important areas in this manual concerns the measurement of high-growth enterprises and gazelles,
where there is considerable policy interest and currently little in the way of internationally
comparable data. The manual therefore, provides definitions of high-growth enterprises and
young high-growth enterprises (gazelles) as described in the summarised extract below:
Eurostat-OECD Definitions
A variety of approaches can be considered as providing the basis for defining high-growth
enterprises. Many studies, for example, have focused on indicators that define high-growth
enterprises as the top Y% of companies, for example Birch type measures, which marry absolute
and relative changes in growth as a way of overcoming the small enterprise bias inherent in
measuring enterprise growth rates:
0
1
01)(
t
t
ttx
xxxGrowth
,
where, xt is either employment, turnover or some other indicator of size in year t. Or the “Davis,
Haltiwanger, Schuh’ measure used by US statistical agencies for example, which measures
growth on the following basis (a second order approximation to rates measured in logs):
2/)/()(0101 tttt xxxxGrowth
Perhaps the simplest type of indicator however, and moreover one that has clearer interpretability,
is one that defines high-growth enterprises as those that satisfy some predetermined threshold that
distinguishes them as high-growth, with a secondary qualification that enterprises have to be
3
above a certain size, to mitigate any small enterprise growth bias. Like the measures above,
thresholds are selected by convention based largely on individual country studies/experiences1.
Of course, a number of different variables can be considered as providing the basis for growth but,
typically, for a variety of reasons, including availability and comparability, employment and
turnover are the preferred concepts in practice2
With these considerations in mind therefore the Manual provides the following definitions for
high-growth enterprises and gazelles:
The definition of high-growth enterprises recommended is as follows:
All enterprises with average annualised growth greater than 20% per annum, over a three
year period should be considered as high-growth enterprises. Growth can be measured by
the number of employees or by turnover.
And the definition for gazelles is given as: Gazelles are the subset of high-growth enterprises
which are up to five years old. The definition is
All enterprises up to 5 years old with average annualised growth greater than 20% per
annum, over a three year period, should be considered as gazelles.
To avoid the small size class bias that such definitions inevitably contain, the definitions include
the further qualification that enterprises should have at least 10 employees at the start of any
observation period (and this threshold applies to both the employment and turnover based
measures).
The manual itself provides further clarification on (a) the ways in which continuity of businesses
should be preserved (treatment of mergers, acquisitions, break-ups for example) and (b) practical
measurement issues relating to activity in the first year of a firm’s operations (where the manual
recommends that the calculation of growth rates start from no earlier than the second year of
activity (year t+1 for firms born in year t), reflecting the fact that estimates of turnover in a birth
year do not reflect a full year of activity.
Sensitivity Analysis
As stated above the definitions are to a large part based on conventions. In this sense it is
legitimate to consider whether the thresholds of 10 or more employees, 20% per annum, three
year period, and 5 years or younger, are optimal. Where the optimisation typically needs to
balance two competing criteria – the first is to provide as detailed and as meaningful information
as possible and the second is to maximise information that is disclosive, that is, satisfies
confidentiality rules: noting that the indicators above have been requested at, as detailed an
industry level as possible, and by standard (employment) size classes.
1 Hoffmann, A. and Junge M, 2006, Comparing the Number of High-Growth Entrepreneurs across 17 Countries, FORA Working
Paper. 2 Ahmad, Nadim and Gonnard, Eric, High Growth Enterprises and Gazelles, Paper prepared for The International Consortium on
Entrepreneurship (ICE), February 2007 Copenhagen, Denmark.
4
Setting the employment thresholds too low, for example, will reduce disclosure problems but at
the same time result in disproportionate numbers of small enterprises appearing in the statistics.
Too high, however, and disclosure problems increase, particularly for smaller economies, with
significantly less (and also, usually, proportionately) large companies than larger economies.
Although of course the upside is that the indicators reflect companies that have made a more
significant contribution to employment and economic growth. But even then one can go too far as
the fewer the companies the less replicable their success.
The same conundrum arises for the growth threshold of 20% per annum. For the other thresholds
however, namely the 3 year reference period and 5 years or younger, additional considerations
come into play. The larger the reference period the fewer the companies and also, arguably, the
lower the meaningfulness, since companies with rapid bursts of growth before reaching some
optimal size might be excluded.
In an attempt to analyse the suitability of these thresholds and indeed the conceptual basis of the
indicators themselves, the OECD, together with Eurostat, initiated a study to test the sensitivity of
the optimising criteria (relevance and confidentiality) to changes in the thresholds; a study that
would also be able to provide an important insight more generally into the actual feasibility of
producing these statistics across OECD countries. Additionally the OECD has organised a
workshop on the measurement of high-growth enterprises where these analyses will be discussed
with a view to establishing the best way forward for the future3.
A number of countries have volunteered to conduct sensitivity analyses around the thresholds
specified in the Business Demography Manual and this note provides a synthesis of their results,
based on the following guidelines.
Sensitivity Analysis Guidelines
The guidance note circulated to volunteering countries recommended that variants of growth and
size thresholds were applied as shown below:
Growth Thresholds
In addition to the 20% threshold, test 15% 25%, 30% and 40% growth thresholds, again over a
3 year period.
Size Thresholds
The guidelines suggested presenting indicators by the following size classes 1, 2-4, 5-9, 10-14,
15-19 and 20+) where a business is defined, in each case, on the basis of its size at the beginning
of the three year period. Recognising that this would magnify the disclosure problem a secondary
approach was to consider measures using the following thresholds, in addition to the 10+
threshold: 1+, 2+, 5+, 15+ and 20+.
3 The OECD Entrepreneurship Indicators Programme: Workshop on the Measurement of High-Growth Enterprises,
19 November 2007, Paris: http://oecd.org/document/31/0,3343,en_2825_293564_39151327_1_1_1_1,00.html
5
Alternative Bases for Measurement
The guidelines also encouraged countries to test the feasibility of alternative measures. But,
unfortunately, very few countries conducted these analyses. However this in itself, and in part,
says something about their feasibility, as a number of countries stipulated that their inability to
provide such measures reflected additional complications and particularly for value-added/profit
measures, data availability.
Composite Indicators and Birch Indices
The first being an indicator that combined turnover and employment, the genesis of which can be
found in http://ice.foranet.dk/upload/highgrowth.pdf , as shown below:
t
nt
t
nt
Trn
Trn
Emp
Emp
And, the second being the typical Birch measure
0
1
01)(
t
t
ttx
xxxm .
Value-added and Profits rather than Turnover
Another important consideration concerned the relationship between value-added and turnover.
In formulating the definitions on turnover based measures the OECD Entrepreneurship Indicators
Steering Group recognised the inherent difficulties (current price valuations, inflation, exchange
rates, gross nature) that presented difficulties for international comparability and interpretability,
particularly as it mainly reflected the most readily available proxy for the more meaningful
‘value-added’. It was preferred to value-added however as the basis for calculation on purely
practical grounds however, in recognition of the fact that comparable value-added statistics at the
firm level were rare (where comparability was an issue both at the national – comparing size
classes - and international level – comparing countries). On the basis of the returns, these
difficulties appear to have been confirmed.
Foreign/Domestic Ownership
Another characteristic that was requested but where little information has been forthcoming was
‘ownership’, especially as it provided a mechanism to understand better country-size biases (see
Ahmad and Gonnard, 2007).
Growth by Acquisition
Some countries have however been able to provide estimates of high-growth rates differentiated
between organic growth and growth through acquisition, such as via mergers/takeovers.
6
Issues
To facilitate the synthesis this section provides a summary of the key issues relevant to the
investigation.
Which thresholds provide for the optimum percentage of enterprises identified as high-growth
and gazelles that are sufficient for analytical purposes given confidentiality constraints and the
need for detailed enterprise characteristics such as industry detail?
Are these thresholds appropriate for both large and smaller economies?
Should the thresholds be the same for both high-growth enterprises and gazelles?
Is it necessary to have both turnover and employment based measures? Is there a strong
correlation between the two measures? What are the differences in coverage?
Are other measures better at defining high-growth enterprises and gazelles in a comparable
way across countries?
Are concerns related to turnover, such as its current price basis, its relationship to value-
added, cross-country inflation differences, significant and justified?
How closely is turnover related to value-added? Are there differences at the industry level?
A number of other issues are however also relevant to this analysis, even if they’re indirectly
related. For example:
Is continuity measurement a practical issue? Can countries fully differentiate between organic
and exogenous (merger, take-over) growth?
Is it difficult to identify when an enterprise was born? Are all countries defining the birth of an
enterprise as the first date when it recruited employees (employer-enterprise birth) or when it
first appeared on the statistical register (usually an enterprise birth)? Can countries
differentiate between reactivations and births, and how much of an impact do these make?
What types of other indicators related to high-growth enterprises and gazelles could be readily
produced?
Finally another issue become apparent during the preparation of this synthesis, highlighting the
need to tighten up the definition used for gazelles in the manual. The first concerns the age of
gazelles. Some countries have interpreted gazelles as being no more than 5 years old at the
beginning of the reporting period but others have interpreted them as being no more than 5 years
old at the end of the reporting period. This unintentional ambiguity has however had a positive
spin-off as it has allowed us to investigate an issue (age of gazelles) that was not intended to be an
aspect of the sensitivity analysis.
7
Summary Results
The following countries participated in the sensitivity analysis to varying degrees: Canada,
Denmark, Finland, Italy, Latvia, Spain, Sweden and the US (Census and Bureau of Labor
Statistics). Unless otherwise specified the data for each country refers to the following reporting
periods respectively: 2001-2004; 2000-03; 2002-2005; 2002-2005; 2002-2005; 2002-2005; 2002-
2005, 2003-2006.
Countries provided a variety of data, including, in the case of Denmark and Sweden, links to other
data sets such as average wages and salaries of employees and educational attainment. In addition
the following countries provided information relating to the average turnover and employment
growth in HG firms compared to non HG firms. These results will not be analysed in this
particular paper, since they are outside of its core scope, but will form the basis of a follow-up
paper which takes a closer look at the nature of HG firms and gazelles and how they compare
across countries.
The graphs below provide a summary of the picture across countries. They clearly demonstrate
the feasibility of the measures across a wide range of countries, large and small, but they also
reveal areas where ambiguities need to be removed and or areas where more detailed guidance
would be beneficial. One area where this is necessary is in the definition of gazelles, where it
would be helpful to clarify, explicitly, whether the age of gazelles should be 5 or less at the
beginning or the end of the 3 year reporting period. An issue that the workshop is designed to
resolve. The second concerns the need to reinforce the message that the first year of any firm’s
operations should not be included in the calculations, which partly explains the relatively high
turnover figures seen for Finland and Latvia.
Very few countries provided gazelle rates, defined as the number of gazelles as a percentage of all
enterprises with 10 or more employees and less than 5 years of age (whether at the end or
beginning of the reporting period). As such, to improve the comparability of the data shown
below we show gazelle rates as a percentage of all enterprises with 10 or more employees.
A few additional comments are also worth making here. The denominator for Canadian data
reflects all enterprises with 10 or more employees but less than 250, meaning that the Canadian
rates will have a slight upward bias when compared with other countries. Moreover the
denominator for Italy reflects all enterprises with 10 or more employees at the start of the
reporting period (2002) that survived to the end of the reporting period (2005), so, again there will
be a small upward bias in Italian rates. Finally, the data for Canada at the 15% growth threshold
reflects the average of high-growth enterprises and gazelles at the 14% and 16% growth
thresholds, which Canada provided.
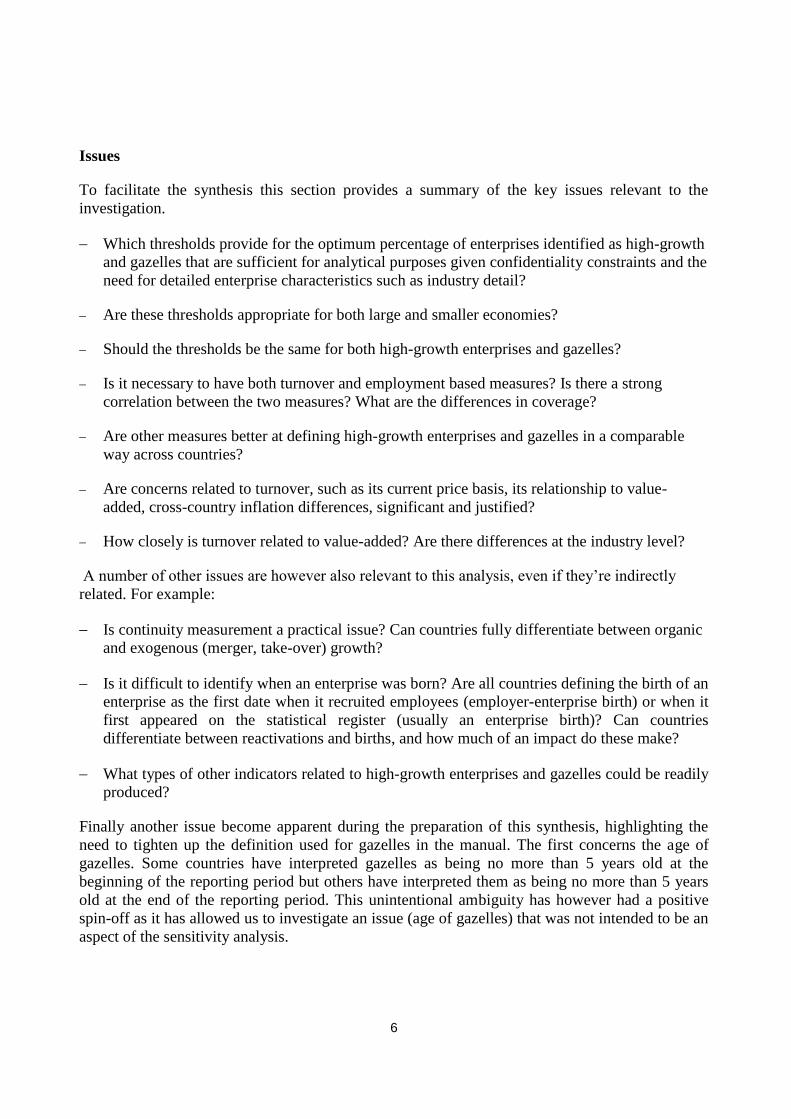
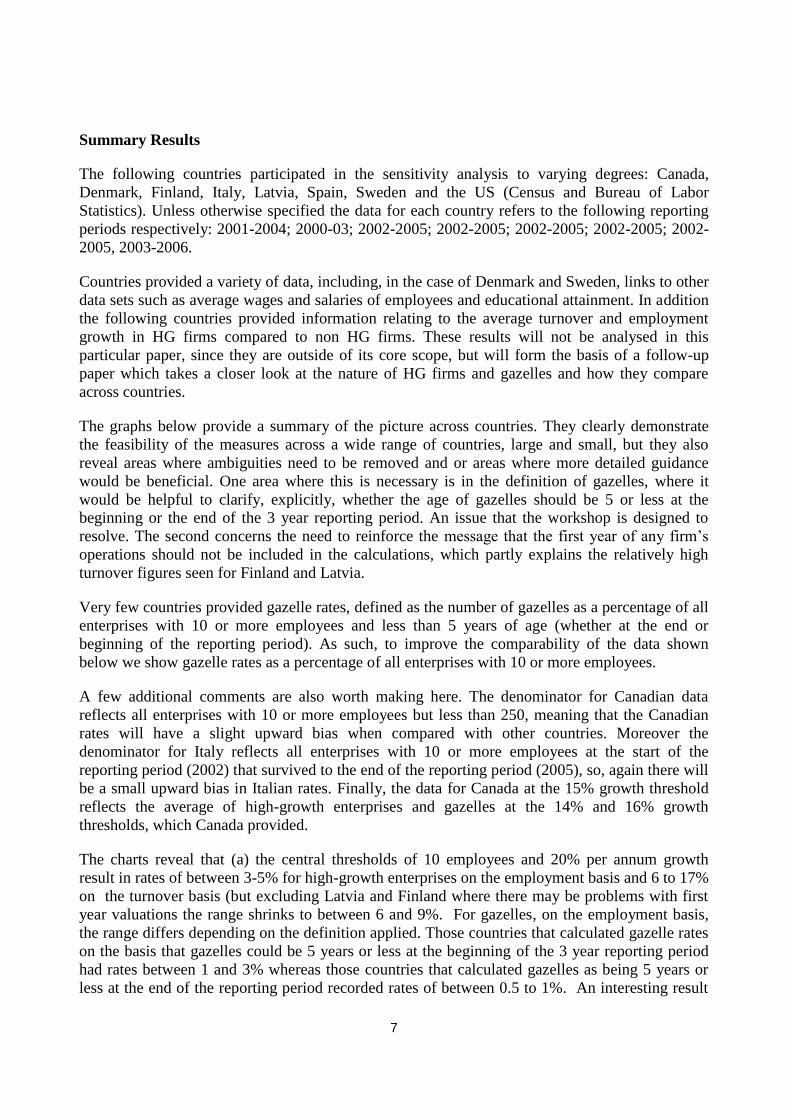
The charts reveal that (a) the central thresholds of 10 employees and 20% per annum growth
result in rates of between 3-5% for high-growth enterprises on the employment basis and 6 to 17%
on the turnover basis (but excluding Latvia and Finland where there may be problems with first
year valuations the range shrinks to between 6 and 9%. For gazelles, on the employment basis,
the range differs depending on the definition applied. Those countries that calculated gazelle rates
on the basis that gazelles could be 5 years or less at the beginning of the 3 year reporting period
had rates between 1 and 3% whereas those countries that calculated gazelles as being 5 years or
less at the end of the reporting period recorded rates of between 0.5 to 1%. An interesting result
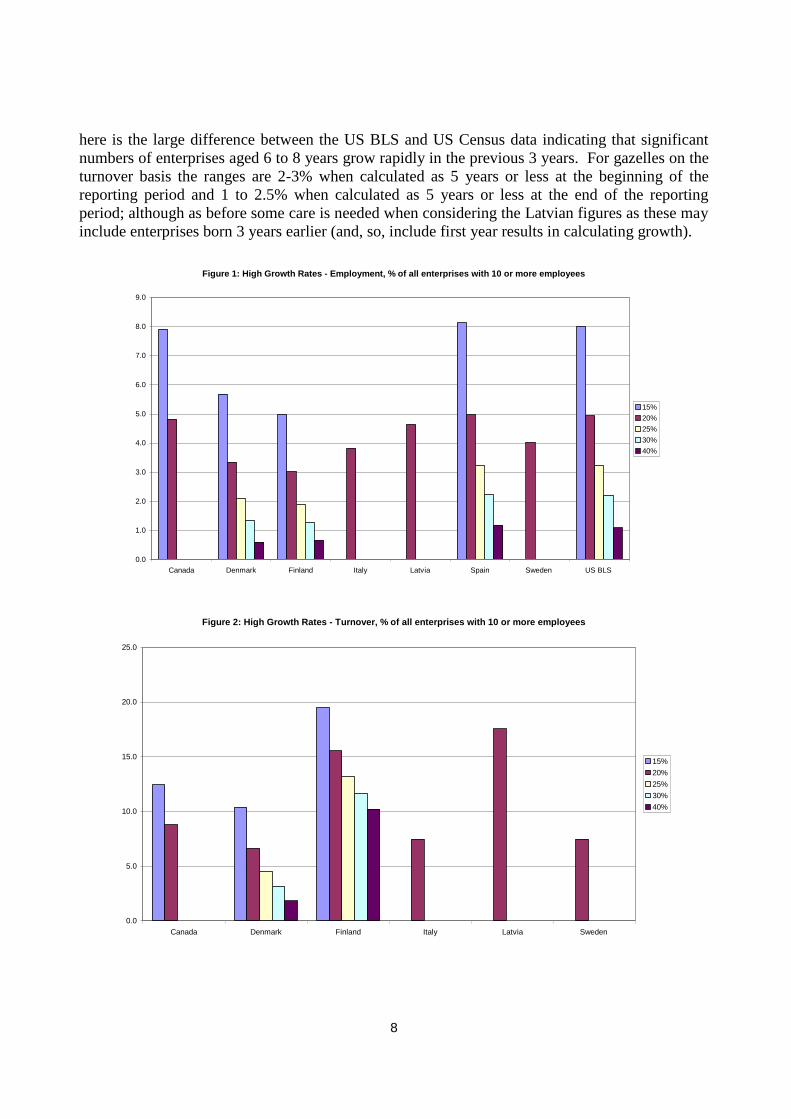
8
here is the large difference between the US BLS and US Census data indicating that significant
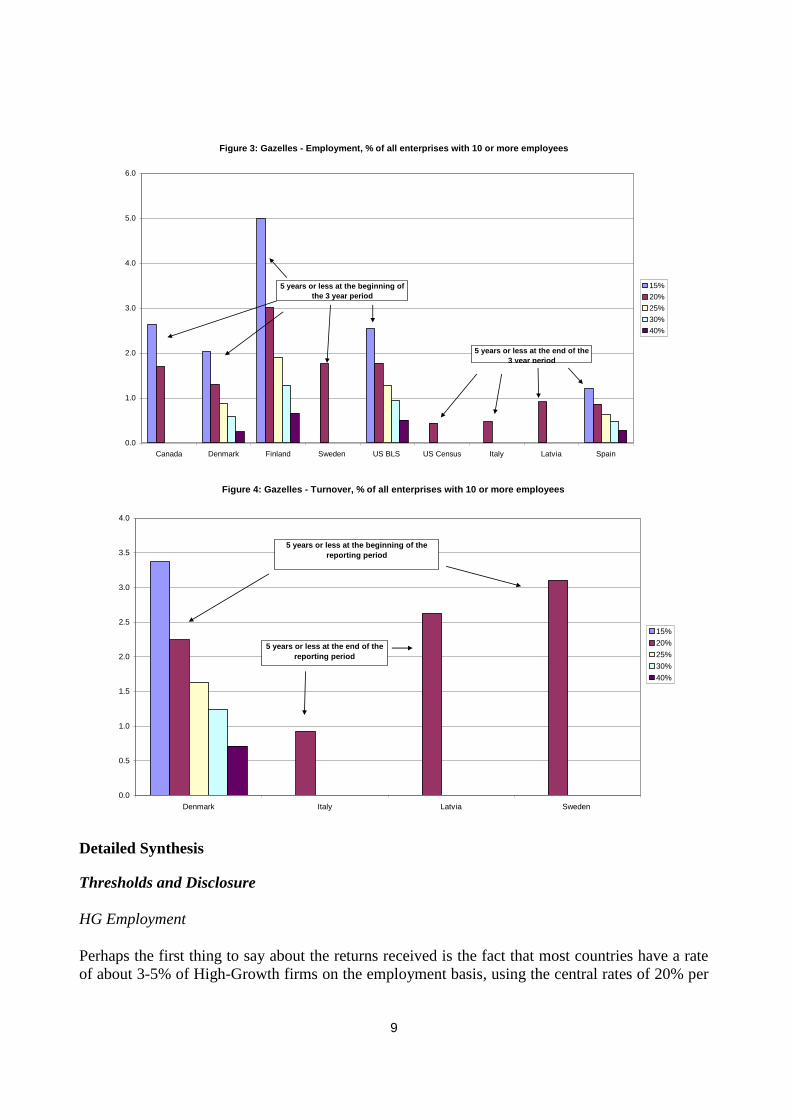
numbers of enterprises aged 6 to 8 years grow rapidly in the previous 3 years. For gazelles on the
turnover basis the ranges are 2-3% when calculated as 5 years or less at the beginning of the
reporting period and 1 to 2.5% when calculated as 5 years or less at the end of the reporting
period; although as before some care is needed when considering the Latvian figures as these may
include enterprises born 3 years earlier (and, so, include first year results in calculating growth).
Figure 1: High Growth Rates - Employment, % of all enterprises with 10 or more employees
0.0
1.0
2.0
3.0
4.0
5.0
6.0
7.0
8.0
9.0
Canada Denmark Finland Italy Latvia Spain Sweden US BLS
15%
20%
25%
30%
40%
Figure 2: High Growth Rates - Turnover, % of all enterprises with 10 or more employees
0.0
5.0
10.0
15.0
20.0
25.0
Canada Denmark Finland Italy Latvia Sweden
15%
20%
25%
30%
40%
9
Figure 3: Gazelles - Employment, % of all enterprises with 10 or more employees
0.0
1.0
2.0
3.0
4.0
5.0
6.0
Canada Denmark Finland Sweden US BLS US Census Italy Latvia Spain
15%
20%
25%
30%
40%
5 years or less at the beginning of
the 3 year period
5 years or less at the end of the
3 year period
Figure 4: Gazelles - Turnover, % of all enterprises with 10 or more employees
0.0
0.5
1.0
1.5
2.0
2.5
3.0
3.5
4.0
Denmark Italy Latvia Sweden
15%
20%
25%
30%
40%
5 years or less at the beginning of the
reporting period
5 years or less at the end of the
reporting period
Detailed Synthesis
Thresholds and Disclosure
HG Employment
Perhaps the first thing to say about the returns received is the fact that most countries have a rate
of about 3-5% of High-Growth firms on the employment basis, using the central rates of 20% per
10
annum growth and 10 or more employees. Given that most national studies of high growth
enterprises typically focus on the top 5% of firms (usually using Birch measures) this is a
reassuring outcome and adds weight to the use of these thresholds. Clearly the higher the
thresholds, the lower the percentage of enterprises identified as high-growth.
Perhaps surprisingly, but reassuringly, the percentages of high-growth enterprises on the
employment basis are about the same for all countries, whatever the growth threshold, and there
appears to be little sign of significantly fewer percentages of high-growth enterprises in smaller
economies. Thresholds of 15% result in between 5-8% of HG enterprises, 20%: 3-5%; 25%: 2-
3%; 30%:1-2% and 40%: 0.25% to 0.5%.
This seems to indicate that the thresholds of 10 employees and 20% growth provide for good
comparability and a small percentage of HG enterprises (5%) but not too small such that
significant disclosure problems arise.
But this looks only at the whole economy picture. Analysts and policy makers are equally
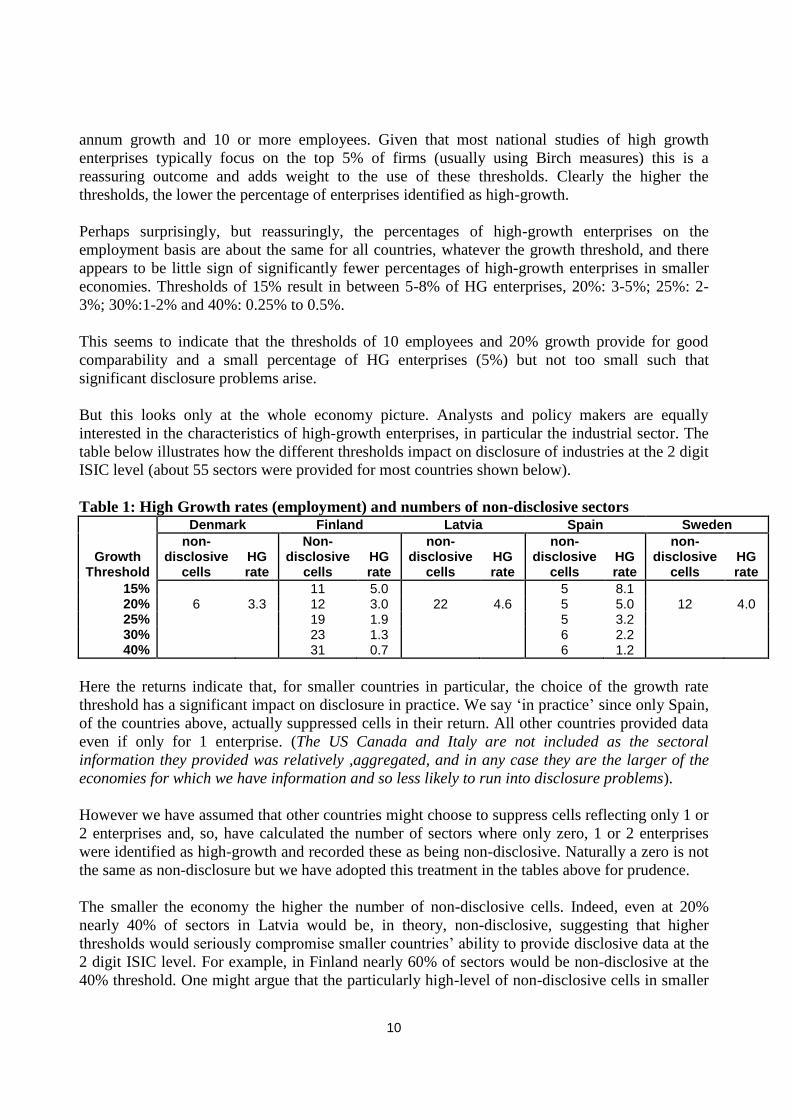
interested in the characteristics of high-growth enterprises, in particular the industrial sector. The
table below illustrates how the different thresholds impact on disclosure of industries at the 2 digit
ISIC level (about 55 sectors were provided for most countries shown below).
Table 1: High Growth rates (employment) and numbers of non-disclosive sectors Denmark Finland Latvia Spain Sweden
Growth Threshold
non-disclosive
cells HG rate
Non-disclosive
cells HG rate
non-disclosive
cells HG rate
non-disclosive
cells HG rate
non-disclosive
cells HG rate
15% 11 5.0 5 8.1 20% 6 3.3 12 3.0 22 4.6 5 5.0 12 4.0 25% 19 1.9 5 3.2 30% 23 1.3 6 2.2 40% 31 0.7 6 1.2
Here the returns indicate that, for smaller countries in particular, the choice of the growth rate
threshold has a significant impact on disclosure in practice. We say ‘in practice’ since only Spain,
of the countries above, actually suppressed cells in their return. All other countries provided data
even if only for 1 enterprise. (The US Canada and Italy are not included as the sectoral
information they provided was relatively ,aggregated, and in any case they are the larger of the
economies for which we have information and so less likely to run into disclosure problems).
However we have assumed that other countries might choose to suppress cells reflecting only 1 or
2 enterprises and, so, have calculated the number of sectors where only zero, 1 or 2 enterprises
were identified as high-growth and recorded these as being non-disclosive. Naturally a zero is not
the same as non-disclosure but we have adopted this treatment in the tables above for prudence.
The smaller the economy the higher the number of non-disclosive cells. Indeed, even at 20%
nearly 40% of sectors in Latvia would be, in theory, non-disclosive, suggesting that higher
thresholds would seriously compromise smaller countries’ ability to provide disclosive data at the
2 digit ISIC level. For example, in Finland nearly 60% of sectors would be non-disclosive at the
40% threshold. One might argue that the particularly high-level of non-disclosive cells in smaller
11
countries suggests that the thresholds should be reduced to 15% but this would dilute the meaning
of high-growth, recalling that the range of high-growth enterprises at this level are between 5-8%
(1 in 12 companies).
Moreover one needs to recall that the 15% threshold for turnover based measures results in
between 10 and 20% of HG enterprises.
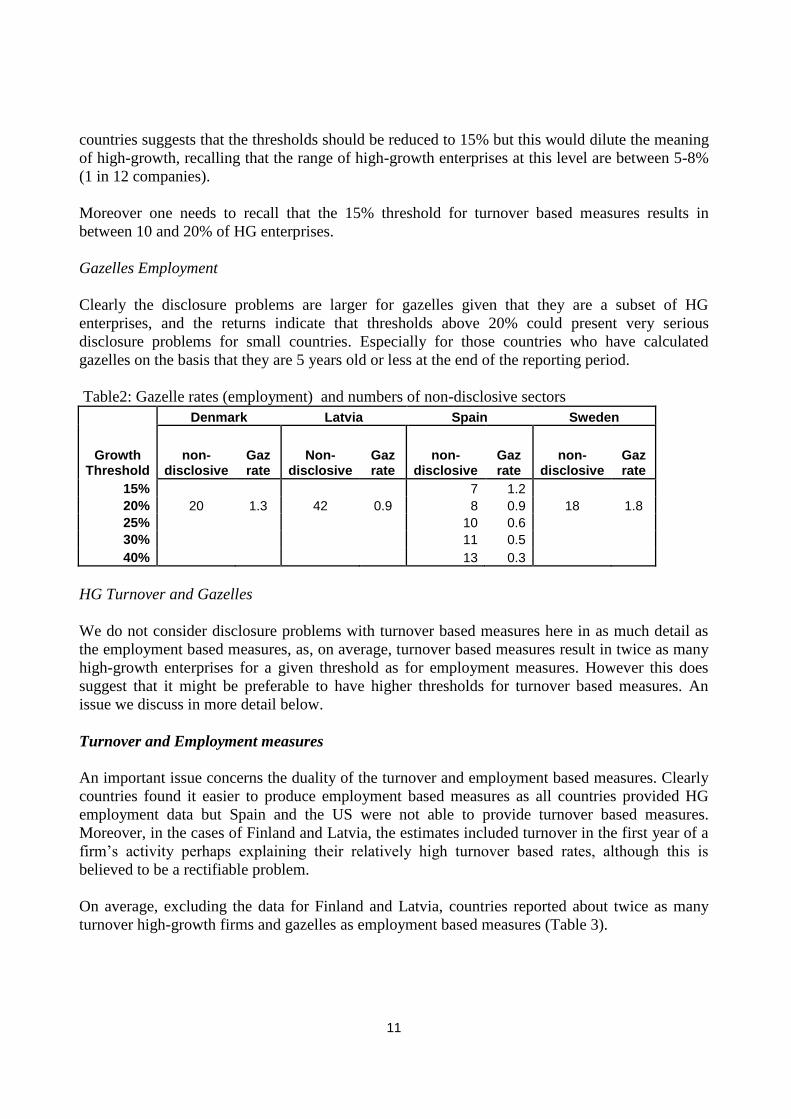
Gazelles Employment
Clearly the disclosure problems are larger for gazelles given that they are a subset of HG
enterprises, and the returns indicate that thresholds above 20% could present very serious
disclosure problems for small countries. Especially for those countries who have calculated
gazelles on the basis that they are 5 years old or less at the end of the reporting period.
Table2: Gazelle rates (employment) and numbers of non-disclosive sectors
Denmark Latvia Spain Sweden
Growth Threshold
non-disclosive
Gaz rate
Non-disclosive
Gaz rate
non-disclosive
Gaz rate
non-disclosive
Gaz rate
15% 7 1.2
20% 20 1.3 42 0.9 8 0.9 18 1.8
25% 10 0.6
30% 11 0.5
40% 13 0.3
HG Turnover and Gazelles
We do not consider disclosure problems with turnover based measures here in as much detail as
the employment based measures, as, on average, turnover based measures result in twice as many
high-growth enterprises for a given threshold as for employment measures. However this does
suggest that it might be preferable to have higher thresholds for turnover based measures. An
issue we discuss in more detail below.
Turnover and Employment measures
An important issue concerns the duality of the turnover and employment based measures. Clearly
countries found it easier to produce employment based measures as all countries provided HG
employment data but Spain and the US were not able to provide turnover based measures.
Moreover, in the cases of Finland and Latvia, the estimates included turnover in the first year of a
firm’s activity perhaps explaining their relatively high turnover based rates, although this is
believed to be a rectifiable problem.
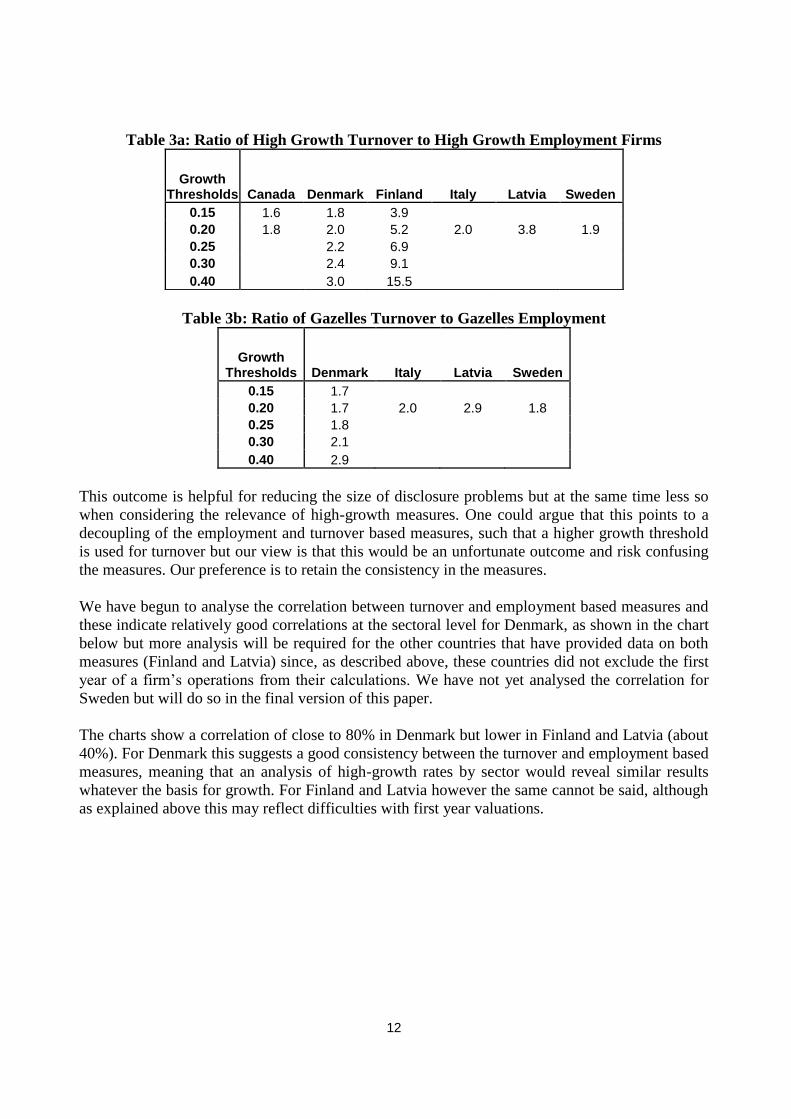
On average, excluding the data for Finland and Latvia, countries reported about twice as many
turnover high-growth firms and gazelles as employment based measures (Table 3).
12
Table 3a: Ratio of High Growth Turnover to High Growth Employment Firms
Table 3b: Ratio of Gazelles Turnover to Gazelles Employment
Growth Thresholds Denmark Italy Latvia Sweden
0.15 1.7
0.20 1.7 2.0 2.9 1.8
0.25 1.8
0.30 2.1
0.40 2.9
This outcome is helpful for reducing the size of disclosure problems but at the same time less so
when considering the relevance of high-growth measures. One could argue that this points to a
decoupling of the employment and turnover based measures, such that a higher growth threshold
is used for turnover but our view is that this would be an unfortunate outcome and risk confusing
the measures. Our preference is to retain the consistency in the measures.
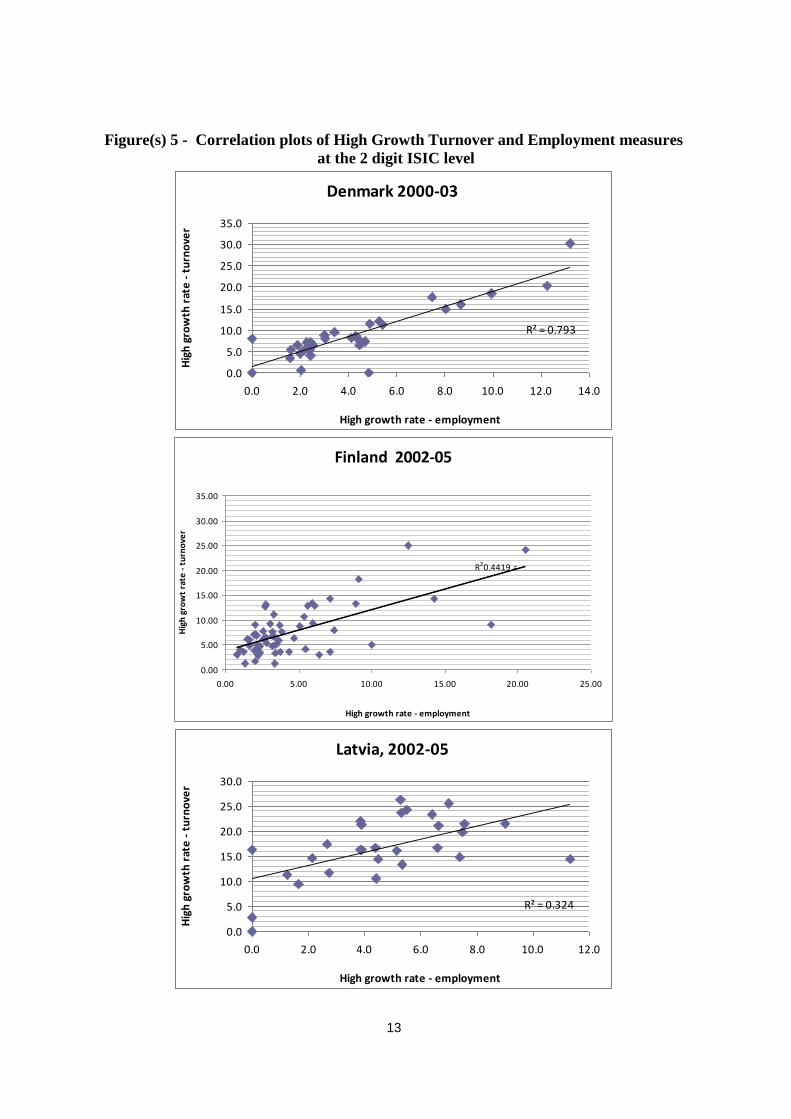
We have begun to analyse the correlation between turnover and employment based measures and
these indicate relatively good correlations at the sectoral level for Denmark, as shown in the chart
below but more analysis will be required for the other countries that have provided data on both
measures (Finland and Latvia) since, as described above, these countries did not exclude the first
year of a firm’s operations from their calculations. We have not yet analysed the correlation for
Sweden but will do so in the final version of this paper.
The charts show a correlation of close to 80% in Denmark but lower in Finland and Latvia (about
40%). For Denmark this suggests a good consistency between the turnover and employment based
measures, meaning that an analysis of high-growth rates by sector would reveal similar results
whatever the basis for growth. For Finland and Latvia however the same cannot be said, although
as explained above this may reflect difficulties with first year valuations.
Growth Thresholds Canada Denmark Finland Italy Latvia Sweden
0.15 1.6 1.8 3.9
0.20 1.8 2.0 5.2 2.0 3.8 1.9
0.25 2.2 6.9
0.30 2.4 9.1
0.40 3.0 15.5
13
Figure(s) 5 - Correlation plots of High Growth Turnover and Employment measures
at the 2 digit ISIC level
Denmark 2000-03
R² = 0.793
0.0
5.0
10.0
15.0
20.0
25.0
30.0
35.0
0.0 2.0 4.0 6.0 8.0 10.0 12.0 14.0
High growth rate - employment
Hig
h g
row
th r
ate
- t
urn
ove
r
Finland 2002-05
R20.4419 =
0.00
5.00
10.00
15.00
20.00
25.00
30.00
35.00
0.00 5.00 10.00 15.00 20.00 25.00
High growth rate - employment
Hig
h g
row
t ra
te -
tu
rno
ver
Latvia, 2002-05
R² = 0.324
0.0
5.0
10.0
15.0
20.0
25.0
30.0
0.0 2.0 4.0 6.0 8.0 10.0 12.0
High growth rate - employment
Hig
h g
row
th r
ate
- t
urn
ove
r
14
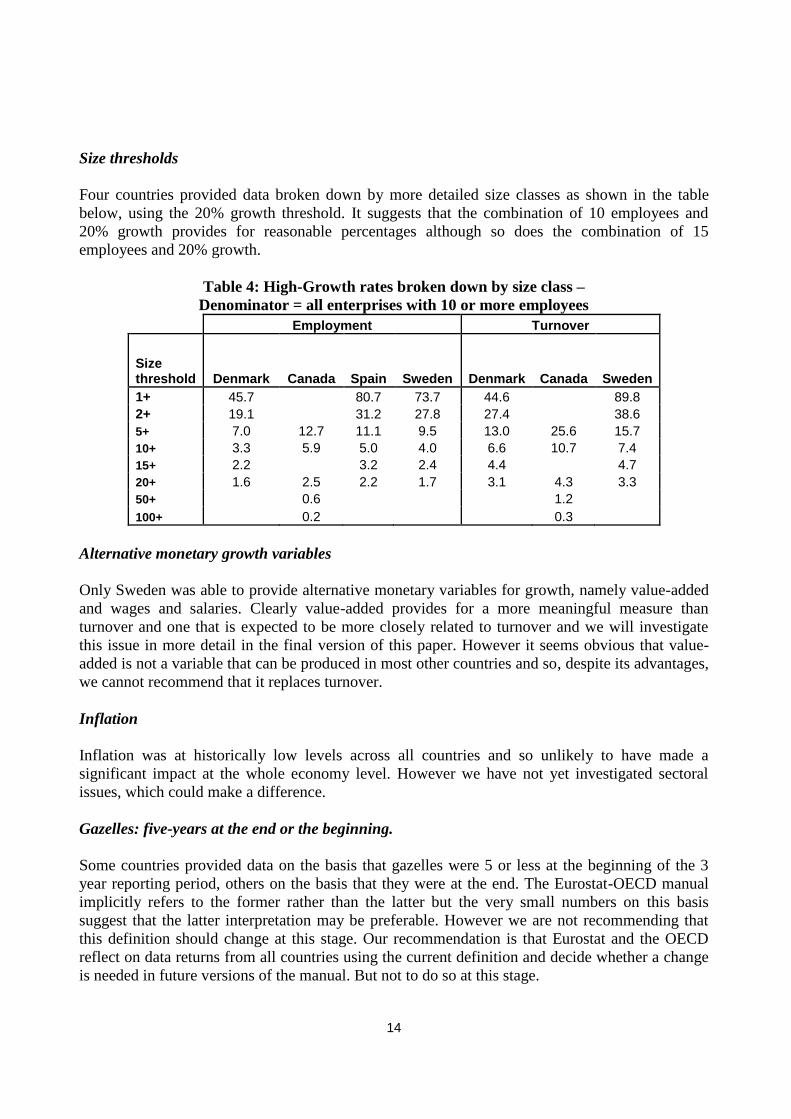
Size thresholds
Four countries provided data broken down by more detailed size classes as shown in the table
below, using the 20% growth threshold. It suggests that the combination of 10 employees and
20% growth provides for reasonable percentages although so does the combination of 15
employees and 20% growth.
Table 4: High-Growth rates broken down by size class –
Denominator = all enterprises with 10 or more employees
Employment Turnover
Size threshold Denmark Canada Spain Sweden Denmark Canada Sweden
1+ 45.7 80.7 73.7 44.6 89.8
2+ 19.1 31.2 27.8 27.4 38.6
5+ 7.0 12.7 11.1 9.5 13.0 25.6 15.7
10+ 3.3 5.9 5.0 4.0 6.6 10.7 7.4
15+ 2.2 3.2 2.4 4.4 4.7
20+ 1.6 2.5 2.2 1.7 3.1 4.3 3.3
50+ 0.6 1.2
100+ 0.2 0.3
Alternative monetary growth variables
Only Sweden was able to provide alternative monetary variables for growth, namely value-added
and wages and salaries. Clearly value-added provides for a more meaningful measure than
turnover and one that is expected to be more closely related to turnover and we will investigate
this issue in more detail in the final version of this paper. However it seems obvious that value-
added is not a variable that can be produced in most other countries and so, despite its advantages,
we cannot recommend that it replaces turnover.
Inflation
Inflation was at historically low levels across all countries and so unlikely to have made a
significant impact at the whole economy level. However we have not yet investigated sectoral
issues, which could make a difference.
Gazelles: five-years at the end or the beginning.
Some countries provided data on the basis that gazelles were 5 or less at the beginning of the 3
year reporting period, others on the basis that they were at the end. The Eurostat-OECD manual
implicitly refers to the former rather than the latter but the very small numbers on this basis
suggest that the latter interpretation may be preferable. However we are not recommending that
this definition should change at this stage. Our recommendation is that Eurostat and the OECD
reflect on data returns from all countries using the current definition and decide whether a change
is needed in future versions of the manual. But not to do so at this stage.
15
Another measure could be considered, that any enterprise less than 5 years old with more than 17
employees should be considered as a gazelle. This definition includes those enterprises that
‘grow’ rapidly at birth and which are not currently captured in the current definition and includes
all gazelles on the current Eurostat-OECD definition. However the downside of this measure is
that there is not a turnover equivalent. We do however recommend that countries provide this
measure as a complement to gazelles.
Denominators
The manual describes in detail the denominators that should be used to calculate rates. Some
clarification is needed however in relation to the year that should be used, the start or end of the 3
year reporting period. Our preference for simplicity is to take the population at the beginning of
the reporting period. This is implicit in the definition for gazelle rates, since it refers to the
population of enterprises born 4 or 5 years ago. But the definition in the manual is slightly
different since it refers, again implicitly, to the population of enterprises born 4 or 5 years ago that
survive throughout the reporting period. Removing firms that shrink (to less than 10 employees)
or die during this period could have counter intuitive effects on the rates – countries with a high
percentage of failing firms for example would have, all other things equal, higher high growth
rates than countries with lower percentages of failing firms. That said, taking the population of
enterprises at the beginning of the three year period, causes other problems, specifically when an
enterprise changes it sector.
The manual will articulate this issue in more detail but discussions within Eurostat revealed a
preference to record the sector of a high-growth company or gazelle to its sector at the end of the
reporting period. For consistency therefore the denominator for rates at the sectoral level should
reflect the population of enterprises at the end of the reporting period, which is our
recommendation.
Enterprise (Gazelle age)
An issue worth commenting on, although not explicitly related to the issue at hand (the definition
of high-growth enterprises and gazelles) concerns the determination of the age of a gazelle. Some
countries have used the enterprise birth definition and others the employer enterprise birth
definition. For maximum comparability across OECD countries the latter definition should be
used and this will need to be articulated in the manual to avoid ambiguities.
Extending the reporting period
Canada provided estimates of high-growth rates also using a 5 year reporting period. This had the
effect of reducing by half the number of high-growth enterprises. Given the impact this is likely to
have on smaller economies we recommend that the 3 year reporting period is retained.
Excluding Mergers

16
Finland provided data with mergers included and excluded. The figures shown above reflect the
data with mergers excluded. Including mergers increases rates by about 20%, reflecting the
importance in removing, or showing separately, these firms.