Embed Size (px)
Citation preview

University of Texas at El PasoDigitalCommons@UTEP
Open Access Theses & Dissertations
2016-01-01
High Fidelity Localization and Sensing for CattleAnalyticsLuis Carlos Bañuelos ChaconUniversity of Texas at El Paso, [email protected]
Follow this and additional works at: https://digitalcommons.utep.edu/open_etdPart of the Agriculture Commons, and the Bioresource and Agricultural Engineering Commons
This is brought to you for free and open access by DigitalCommons@UTEP. It has been accepted for inclusion in Open Access Theses & Dissertationsby an authorized administrator of DigitalCommons@UTEP. For more information, please contact [email protected].
Recommended CitationBañuelos Chacon, Luis Carlos, "High Fidelity Localization and Sensing for Cattle Analytics" (2016). Open Access Theses &Dissertations. 810.https://digitalcommons.utep.edu/open_etd/810

HIGH FIDELITY LOCALIZATION AND SENSING
FOR CATTLE ANALYTICS
LUIS CARLOS BAÑUELOS CHACÓN
Master’s Program in Computer Engineering
APPROVED:
Eric W MacDonald, Ph.D., Chair
Michael McGarry, Ph.D.
Rodrigo Romero, Ph.D.
David Roberson, Ph.D.
Charles Ambler, Ph.D.
Dean of the Graduate School

Copyright ©
by
Luis Carlos Bañuelos Chacón
2016

Dedication
I would like to dedicate this thesis to all the people that have helped me through my career
to achieve this goal. Firstly, my parents, who gave me everything I needed, supported me the entire
way and pushed me to always try for the best and never settle with less than what I am capable.
To my grandfather, who set me on this path from early on and made everything easy by making
me enjoy learning. To my girlfriend, who helped me stay focused, supported me on all the long
nights and made me happy even through the hardest times. To Dr. Eric MacDonald, who helped
me develop academically and professionally. And finally, to all my friends and people along the
way that helped me in one way or another through this long journey.

HIGH FIDELITY LOCALIZATION AND SENSING
FOR CATTLE ANALYTICS
by
LUIS CARLOS BAÑUELOS CHACÓN, B.S.E.E
THESIS
Presented to the Faculty of the Graduate School of
The University of Texas at El Paso
in Partial Fulfillment
of the Requirements
for the Degree of
MASTER OF SCIENCE
Department of Computer Engineering
THE UNIVERSITY OF TEXAS AT EL PASO
May 2016

v
Acknowledgements
I would like to thank Rancho El 17 cattle ranch in Hermosillo, Sonora for the guidance in
the industrial aspects of this research (http://www.ranchoel17.com). The research presented here
was performed as a result of funding in part from CONACYT México in the Programa de
Estímulos a la Innovación, Desarrollo Tecnológico e Innovación 2015 with grant ID 221285 and
entitled “Sistema inteligente comerciable para engorda y monitoreo de ganado bovino vía Internet
de las Cosas”. All statements of fact, opinion, or analysis expressed are those of the authors and
do not reflect the official positions or views of the funding agency.
I would also like to thank the W.M. Keck Center for 3D Innovation for providing
machinery and advise on the 3D printing of our prototype enclosures.
vi
Abstract
Global beef production is projected to reach approximately 60 million tons in 2015 and
opportunities to increase efficiencies are significant with recent advancements in remote sensing.
By economically monitoring the location and conditions of a herd such as feeding patterns, body
temperature, heart rate, and other biometric information, the herd performance can now be
enhanced through data-driven optimization. Next generation sensors provide high fidelity data on
a wide range of measurable properties, and simultaneously, the wide adoption of these sensor
systems in many consumer applications is leading to commoditization and reduced cost due to the
associated economies of scale. Deploying sensors in feedlots requires overcoming many
challenges including harsh environments (temperature, UV exposure, wind, rain), the presence of
substantial cattle mass (affecting wireless communications), battery lifetime, and destructive
animal behavior (potentially damaging instruments). This paper describes a framework for
economically collecting high volume, high quality data on a wide range of conditions of individual
head that can be leveraged to draw inferences about the dynamic behavior of the herd. A
ruggedized Bluetooth cattle halter platform has been implemented the Radio Signal Strength
Indicator (RSSI) of which was used for triangulation. Implementation of a proprietary antenna
was required in order to provide high fidelity distance measurements as required for precise
triangulation. The antennas were durable, held in position reliably on the halter and provided an
isotropic radiation pattern as required to measure distances accurately from all directions. A
correlation coefficient of r2 = 0.82 has been measured between signal strength and distance in all
directions as required for high resolution cattle location. The Bluetooth SPI interface can be
leveraged to wirelessly relay a wide variety of additional sensor measurements to a central
computer from a number of feedlots the number of which can easily scale. Access to
unprecedented quantities and qualities of herd data can be leveraged to dramatically improve
operational efficiencies and realize precision agriculture.

vii
Table of Contents
Acknowledgements ..........................................................................................................................v
Abstract .......................................................................................................................................... vi
List of Tables ................................................................................................................................. ix
List of Figures ..................................................................................................................................x
Chapter 1: Introduction ....................................................................................................................1
Chapter 2: Previous Work ................................................................................................................3
2.1 Low Cost, High Fidelity Localization ..............................................................................3
2.1.1 Global Positioning System (GPS) .........................................................................4
2.1.2 Radio-Frequency Identification (RFID) ...............................................................4
2.1.3 Ultra-Wide Band (UWB) ......................................................................................5
2.1.4 WLAN (IEEE 802.11) ..........................................................................................5
2.1.5 Bluetooth Low Energy ..........................................................................................6
2.2 Isotropic Antennas ............................................................................................................6
2.3 Distance Calculation from RSSI .......................................................................................9
2.4 Triangulation Method .....................................................................................................10
2.6 Accelerometer and Other Sensor Data for Inferring Cattle Behavior .............................12
Chapter 3: Design of the Data Collection and Localization Framework .......................................13
3.1 System Requirements......................................................................................................13
3.2 System Design ................................................................................................................14
3.3 System Implementation ..................................................................................................17
3.3.1 Tag ......................................................................................................................17
3.3.1.1 System-on-a-Chip (SoC) .........................................................................17
3.3.1.2 Accelerometer .........................................................................................19
3.3.1.3 Power Regulation ....................................................................................20
3.3.1.4 Mechanical Design..................................................................................21
Chapter 4: Experimental Results ...................................................................................................23
4.1 Localization Accuracy ....................................................................................................23
4.2 Triangulation Testing ......................................................................................................27

viii
Chapter 5: Conclusions ..................................................................................................................31
References ......................................................................................................................................32
Vita ..............................................................................................................................................35

ix
List of Tables
Table 2-1: Estimated position calculated from the obtained weights ........................................... 11 Table 4-1: Advertisement packet loss with each antenna ............................................................. 26 Table 4-2: Transmitter positioning average error (in meters) depending on percentage of data
used for regression. The table shows that the exponential attenuation with barycentric
coordinates methods achieves the lowest average error at 1.1753 meters. ................................... 29
Table 4-3: Table showing the positioning error at the five tested positions with the selected best
case from the previous table (5% data discarded) ........................................................................ 30

x
List of Figures
Figure 2-1: Radiation pattern for Inverted F Antenna (Freescale 2015) ........................................ 7 Figure 2-2: Horizontal and vertical radiation patterns of the Cloverleaf antenna (Greve, 2015) ... 8 Figure 2-3: Triangulation principle and signal propagation example ........................................... 10 Figure 2-4: Barycentric triangulation example with weighting .................................................... 11 Figure 2-5: Graphical representation of positioning according to the centroid ............................ 12
Figure 3-1: Sensor beacon board in 3D printed casing ................................................................. 15 Figure 3-2: Block diagram of the tag/beacon architecture ............................................................ 16 Figure 3-3: Block diagram of the receiver .................................................................................... 16 Figure 3-4: Schematic of System-on-a-Chip implementation ...................................................... 18 Figure 3-5: Schematic of Accelerometer implementation ............................................................ 19
Figure 3-6: Schematic of Power Regulator implementation ......................................................... 20
Figure 3-7: Tag CAD Design and Final Assembly ....................................................................... 21
Figure 3-8: Pre-fabricated enclosure and circuit board mounting ................................................ 22 Figure 4-1: Cloverleaf with (right) / without (left) polymer guide ............................................... 24
Figure 4-2: FXP73 (Left) WRL11320 (Center) Half-Wave Dipole (Right)................................. 25 Figure 4-3: Logarithmic comparison of RSSI versus distance ..................................................... 26
Figure 4-4: Position of receivers and transmitter .......................................................................... 27 Figure 4-5: The red line represents the actual distance. The box plot shows the distance
calculated from each receiver. Exponential attenuation provided less dispersion and was
generally more precise. ................................................................................................................. 28 Figure 4-6: A similar relationship between signal strength and distance is obtained on all
receivers. This behavior improves triangulation. .......................................................................... 28
1
Chapter 1: Introduction
The beef industry is one of the largest purveyors of food world-wide and is growing
annually [USDA 2015]. With recent advances in sensors and inexpensive wireless
communications, many environmental properties are now measureable and accessible at low cost.
Operational efficiencies of the feedlot industry can be significantly improved through optimization
with advanced analytic techniques given the recent access to high fidelity sensor information
(Foulkes et. al., 2015); however, there are many challenges in the collection of data including the
expense per cow, the overhead expense per lot, the harsh environment, battery lifetime, animal
behavior as well as the amount and fidelity of the measured information. This work focuses on
addressing all of these challenges specifically in the context of the cattle feedlot industry and
proposes an effective framework for data collection, which has been demonstrated with
experimental results.
The proposed platform leverages commodity electronics that are inexpensive but that must
be enhanced for the unique requirements of feedlot application. The proposed enhancement
increases the quality of the measured distance data in order to be applicable for precise localization
necessary in cattle analytics. Bluetooth is a radio protocol originally developed for Personal Area
Networks (PAN) in which devices can be inexpensively interconnected such as headsets and
keyboards (Bluetooth 2004). The signal strength of Bluetooth can be used to infer the distance
between two radios and the protocol also provides significant data bandwidth for short distance
point-to-point communication required to transfer other sensor measurements. Through
triangulation calculations, the location of individual cattle in a reasonably sized lot can be
determined with sub-meter accuracy along with other sensor data from the halter, all of which can
be transmitted to a central location for analysis. Collectively, many feedlots can be monitored
separately and a second overarching communication protocol – ZigBee – was required to provide
the necessary bandwidth and reliability to deliver the large volume of aggregate data. ZigBee is a
less popular consumer standard for PANs but provides both longer transmission distances as well
2
as improved reliability based on the use of self-configuring mesh networks – where data can be
relayed from node to node until arrival at the final destination even if some nodes become
temporarily non-functional.
The cattle industry stands to be revolutionized by leveraging data analytics in conjunction
with the collection of previously unavailable data about individual head of cattle across a herd in
large ranching operations. The identification of broad trends such as sources of feedstock that
provide better herd performance as well as determining the individual health and well-being of
any specific head of cattle in a proactive manner will lead to unprecedented levels of efficiency in
the beef industry (Nadimi et. al, 2008) (Owen-Smith et. al, 2013) (Gaillard et. al, 2010) (González
et. al, 2008) (Anderson et. al, 2013) (Anderson et. al, 2012).
3
Chapter 2: Previous Work
Previous research was reviewed that focused on high-fidelity localization systems
specifically for areas no larger than 10 by 30 meters (with eight receivers) and in the context of
two important additional requirements: (1) maintaining a total cost of no more than $5 USD per
cow while (2) delivering sub-meter accuracy. Given the recent availability of inexpensive
electronics capable of measuring the required data, the previous work is limited but research
interest is expected to increase exponentially.
Low cost commodity Bluetooth systems generally are equipped with small, inexpensive
antennas implemented either as inverted “F” patterns fabricated as plated trace in the printed circuit
board or as a chip. These antennas do not provide isotropic propagation patterns (equal radiation
strength in all directions) and thus are limited in terms of localization applications as the distance
measured between a receiver and transceiver in these anisotropic cases in directionally dependent
(Zhoa et. al. 2005). Consequently, a review was completed of low cost, small durable antennas –
well suited for the feedlot environment, which also provide even radiation patterns. Finally, the
communications architecture beyond localization capabilities also provides significant bandwidth
to transfer additional sensor data as well. Consequently, previous work of inferring animal
behavior based on acceleration data is also included with the understanding that other types of
sensors could be integrated into the proposed framework in future work.
2.1 LOW COST, HIGH FIDELITY LOCALIZATION
A review of contemporary localization techniques was completed to identify an approach
that satisfied all project requirements. Localization includes two steps: (1) collecting distance
measurements of the tag/beacon from a collection of fixed receiver locations or landmarks and (2)
numerically solving the estimated position of the tag/beacon in a fixed coordinate system.
Although a wide range of sensory information can be used to measure distance between two
elements, the cost ceiling of $5 USD per head and required accuracy limited the possibilities to
wireless approaches, which include Global Positioning Systems (GPS), Radio Frequency

4
Identification (RFID), Radio Signal Strength Indicator (RSSI), Angle of Arrival (AoA) and Time
of Arrival (ToA) techniques (Van et. al, 2007) (Vorst et. al, 2008) (Hoene et. al, 2008). The
selection was driven by identifying which technique was best suited to leverage commodity-based
consumer electronics yet still provide sufficient spatial resolution for utility in cattle informatics.
The following sections describe methods for determining distance between two objects,
one of which is a landmark. With distances to three known landmarks location can be determined
through triangulation, the method of which it is described later in this section.
2.1.1 Global Positioning System (GPS)
The Global Positioning System uses a network of 24 satellites orbiting the Earth where
each broadcasts a signal that includes the satellite’s current time and position (Gezici et. al, 2005).
A receiver listens for these signals and compares the time of arrival and the time of transmission
to calculate the time of flight. Time of flight data from a collection of satellites can then be used
to calculate a three dimensional position. A standard GPS implementation without enhancements
achieves a 15-meter accuracy and by implementing a network of fixed, ground-based reference
stations, differences between the reported position of the satellite and actual position of the satellite
can be calculated. This correction factor is then broadcasted to receivers, which can correct their
calculation in order to achieve 3 – 5 meter accuracy (Hofmann-Wellenhof et. al, 2013). Moreover,
GPS systems, while considered generally low power electronics, are not suitable for applications
that must operate for nine months on a single battery cycle as synchronization and long range
communication with satellites is required and consequently, GPS was not considered applicable to
cattle analytics based on the spatial resolution and battery lifetime specifications.
2.1.2 Radio-Frequency Identification (RFID)
An RFID system consists of an RFID tag with a unique identifier that can be wirelessly
read and two types of tags exist: (A) passive tags harnessing energy from the field produced by
the reader and activating only during the read operation, and (B) active tags with a local power
source that can operate more sophisticated electronics continuously at a larger range. Passive tags
5
do not require a battery, can operate for a virtually unlimited duration and have a range of typically
two meters. While active tags have the advantage of increased range, passive RFID systems with
an array of relatively expensive readers can identify object location by reading the inexpensive
tags and exploiting the short range to determine if the object is adjacent to one or more readers in
the array (Sanpechuda et. al, 2008). The resolution given by such a system is limited to mapping
the visibility of the tag to the readers at predefined location, as there is no signal strength indication.
The system also lacks two-way communication, required for configuration and additional sensory
data collection. The restricted range of measurement, the expense of the large number of readers
and the lack of auxiliary data transmission eliminated the use of RFID for cattle analytics.
2.1.3 Ultra-Wide Band (UWB)
A UWB system works by sending short pulses (< 1 ns) with a low duty cycle (1;1000)
where the signal is transmitted over multiple bands simultaneously at frequencies from 3.1 to 10.6
GHz (Gezici et. al, 2005). A set of fixed receivers calculates the Time of Flight (TOF) from the
received pulses or alternatively the Angle of Arrival (AoA) by observing the TOF difference
between multiple antennas. The short duration of the pulses allows for easy filtering of duplicate
multipath signals generated from reflections and the typical accuracy of UWB systems approaches
20 cm while operating without interference in proximity of other RF systems; however, in contrast
with other RF technologies, UWB is not prominent in consumer electronics, requires both local
synchronization (McCrady et. al, 2000) and custom designed circuits to measure location for a
given application. Consequently, UWB was considered too expensive for cattle analytics due to
the custom design and requirement for precise synchronization.
2.1.4 WLAN (IEEE 802.11)
The IEEE 802.11 standard implements mid-range wireless local area network with the 2.4
GHz Industrial, Scientific and Medical (ISM) band. 802.11 Wi-Fi is the most prominently
implemented in wireless networks around the world and the capability of which is included in most
personal computers and mobile devices. The wide adoption of this standard for communication
6
provides economies of scale for localization applications. The RSSI (Received Signal Strength
Indication) can be used to measure the distance from an object to the access point. White multiple
access points, the position can be calculated (Honkavirta et. al, 2009). However, multipath
propagation from reflections, signal absorption by obstructing solid bodies and anisotropic
antennas induces errors in the RSSI and resolution hast only been optimized to 2-3 meters using
fingerprinting as demonstrated by Microsoft RADAR (Bahl et. al, 2000). Furthermore, although
low power, the power required in 802.11 is in excess of the energy budget for the proposed
application.
2.1.5 Bluetooth Low Energy
Bluetooth is a wireless standard for short-range communication of mobile devices running
in the 2.4 GHz ISM band such as headsets or keyboards. A low energy subset of Bluetooth version
4.0 was introduced for applications requiring sparse communication and long battery life, which
implements a (1) lightweight link layer providing low power idle mode operation, (2) simple
device discovery by broadcasting short packets periodically, and (3) simple point to point data
transfer. As in the case with WLAN, the RSSI measured on broadcast packets can be used to
calculate the distance between a receiver and an object (Kotanen et. al, 2003) (Bahl et. al, 2000)
(Bandara et. al, 2004) (Rodas et. al, 2007) (Castaño et. al, 2004). Previous work has demonstrated
down to two-meter accuracy with a positioning delay of 15 – 30 s using commodity systems with
traditional antennas (Wang et. al, 2013). Bluetooth was selected with enhancement of a custom
isotropic antennas to maintain low cost while providing the required spatial resolution. To improve
upon previous work, special attention was paid to minimizing antenna directionality and
optimizing the accuracy of the mathematical algorithms for calculating distance in the context of
a feedlot.
2.2 ISOTROPIC ANTENNAS
In typical use cases such as mobile devices, keychain and other commodity systems,
Bluetooth antenna design focuses on minimizing the size and cost while maximizing the average
7
range that can be obtained with the lowest possible power. There are two primary antenna designs
that dominate the market, monopole and chip antennas – both of which are not optimized to
provide repeatable distance measurements between radios but instead to improve the average
communication range. (1) Monopole antennas are a version of the standard reference dipole
antenna with only a single element. A ¼ wavelength element perpendicular to a theoretically
infinite ground plane is used. In practical application the element is traced along the ground plane,
and the ground plane is provided by the rest of the PCB. For more compact applications, the
antenna element can be traced in an inverted F-shape parallel to the ground plane (Whip Antenna)
or as an inverted F-shape with the wire folded back and forth on resonant points (Meander
Antenna). Folding the antenna reduces the efficiency as the size decreases further. (2) Chip
antennas further reduce the volume required by pairing a smaller, more lossy antenna design, such
as a highly compressed meander or a helix antenna, with a ceramic package with higher dielectric
constant and lower loss than traditional FR4 (glass epoxy used in PCBs). Chip antennas provide a
trade-off between size and efficiency – in which both are critically important in small hand-held
battery-powered devices. Both antennas provide reasonable efficiency with a typical -3 to -6 dBi
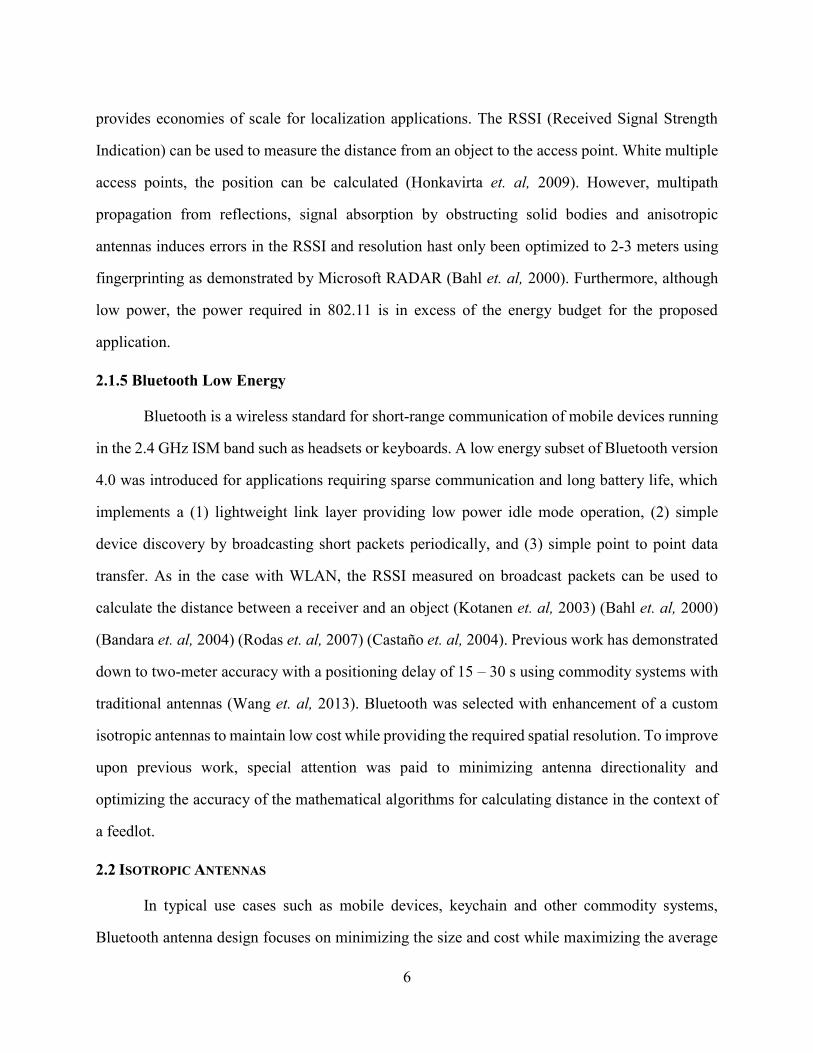
loss (efficiency compared to a reference dipole antenna) and a mostly omnidirectional propagation
pattern as shown in figure 2-1
Figure 2-1: Radiation pattern for Inverted F Antenna (Freescale 2015)
Vertical Polarization
Horizontal Polarization
8
However preliminary testing of such antennas for localization showed that the propagation
patterns were too anisotropic to obtain repeatable signal strength reading required to accurately
measure distance in any arbitrary direction. Since signal strength-based localization depends on a
predictable change of the strength given the distance between transmitter and receiver, the antenna
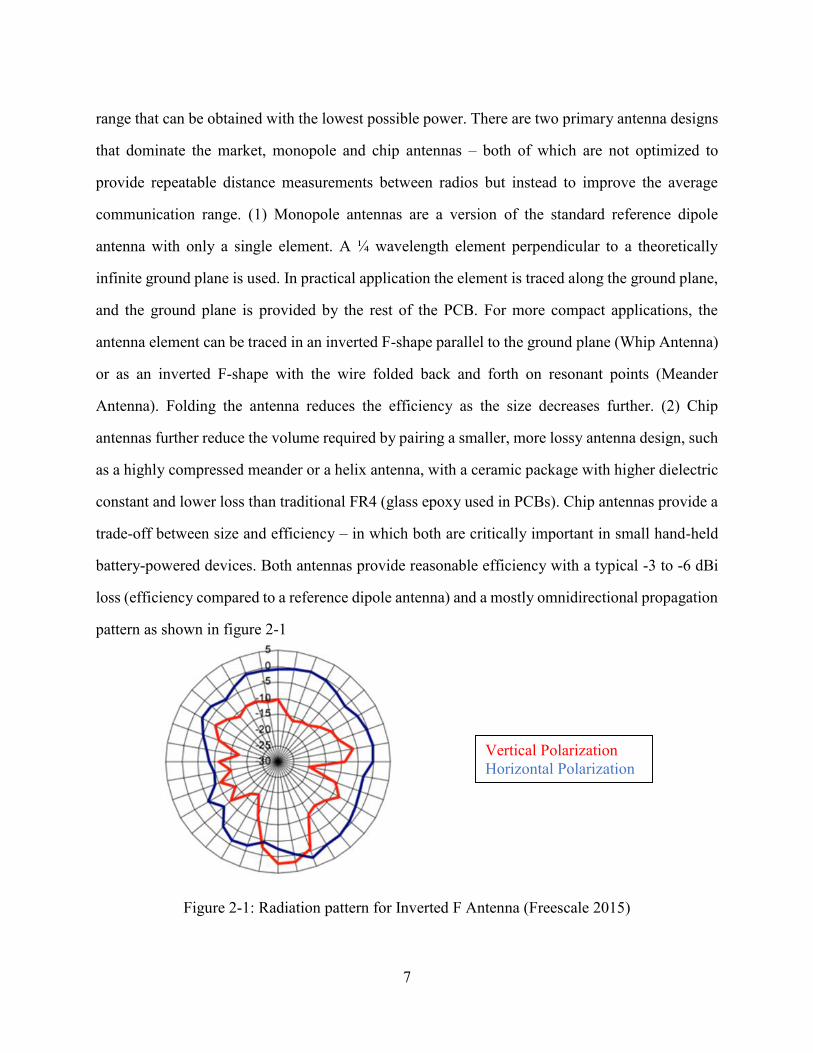
must propagate evenly – at least along a parallel plane to ground. A simple dipole antenna can
provide the required isotropy – the radiation pattern of which is toroid-shaped about the axis of the
dipole. In other words, the radiation is completely even on a plane perpendicular to the antenna. A
challenge specific to cattle localization is that the antenna must stand perpendicular to the ground
with a length of 8 cm for an antenna operating at 2.4 GHz. Maintaining a stable antenna position
and orientation while secured to a cattle halter is difficult and unreliable.
Figure 2-2: Horizontal and vertical radiation patterns of the Cloverleaf antenna (Greve, 2015)
An additional concern specific to distance measurement with RSSI is polarization. With
linearly polarized antennas, the signal can reflect off the ground and other surfaces, leading both
to constructive and destructive interference on the receiving end. This effect, called multi-pathing,
can be beneficial for long range applications as the signal can be received even where no direct
line of sight exists. However, the signal strength is prone to fluctuate randomly because of multi-
pathing interference. With circular polarization, signals arriving from multipath will be attenuated
and thus the effects of this interference reduced. A simple antenna design that meets the

9
requirements of small size while simultaneously providing even propagation and circular
polarization is the three-lobed skew-planar wheel antenna. The antenna is composed of three lobes
with relative sizes at ¼ wavelength and is often referred to as a “cloverleaf antenna”. The design
requires a smaller total package volume than the dipole given the aspect ratio of the height, width
and thickness, and can be reliably encapsulated and mounted on top of cattle in the halter. By
providing a wire guide with a 3D printed substrate, the small volume of the cloverleaf antennas
can be exploited, the weight can be reduced by optimizing the infill of the substrate volume and
the wires can be protected from external abuse by routing through internal channels – only possible
with 3D printing as the proposed antenna guide could not be manufactured with traditional
infection mold processes. The freedom of 3D printing also allowed for the electronics casing to be
integrated mechanically with the wire guide antenna and halter mount in a single structure that
provided for reliable distance measurements (MacDonald et. al, 2014, Espalin et. al, 2014, Liang
et. al, 2015, Shemelya et. al, 2015, Lopes et.al, 2014).
2.3 DISTANCE CALCULATION FROM RSSI
To use Bluetooth RSSI for measuring distance, a function must be applied to translate the
signal strength to distance while dynamically accounting for the fluctuating conditions of the
ambient environment. Two formulas were evaluated to compute signal attenuation:
𝑟𝑠𝑠𝑖 = −(10𝑛〖𝑙𝑜𝑔〗_10 𝑑 + 𝐴) (2-1)
Equation 2-1 is a logarithmic attenuation formula where d identified the distance between
transmitter and receiver; while A and n are parameters describing the surrounding environment. A
is the absolute energy at one meter from the receiver, and n is the transmission constant. (Wang et
al, 2013)
𝑑 = √𝐶𝑃𝑡𝑥
𝑃𝑟𝑒𝑣
∝= 𝐴 (
𝑃𝑡𝑥
𝑃𝑟𝑒𝑣)
𝑛
(2-2)
Equation 2-1 is an exponential attenuation formula which considers two environmental
variables where A is constant and n is the information loss coefficient. In addition, receiver power
(Prev) and transmitted power (Ptx) are considered. (Vorst et. al, 2008)

10
2.4 TRIANGULATION METHOD
Given a collection of distance measurements between a set at least three landmark receivers
and the beacon/tag, the position of the tag can be calculated. The Barycentric and Centroid
triangulation technique were implemented to accommodate the probabilistic nature of the distance
data input and will be discussed in the experimental section. Figure 2-4 identifies the measured
signals and converted to distances as red arrows.
Figure 2-3: Triangulation principle and signal propagation example
Barycentric Location: The Barycentric method obtains the center of gravity from various
vertices, the receiving antennas of which have different priority weights. As distance
measurements are more reliable for shorter distances (stronger RSSI measurements), closer vertex
are afforded stronger weights which attracts the center of gravity and the weights are calculated
from the equation 2-3:
𝑃𝐴1=
(𝑑𝐴1)
−1
∑ (𝑑𝐴𝑛)
−1𝑛1
⁄ ∑ 𝑃𝐴𝑛
𝑛1 = 1 (2-3)
The center of gravity can then be calculated by multiplying the obtained weights by the
coordinates from the vertices, as shown in equation 2-4 (Weisstein et. al, 2015):
𝐶𝑒𝑛𝑡𝑒𝑟 = (∑ 𝑥𝐴𝑛𝑃𝐴𝑛
𝑛1 , ∑ 𝑦𝐴𝑛
𝑃𝐴𝑛
𝑛1 ) (2-4)
In the following figure 2-4, four receiving antennas and a transmitter in the central area are
considered. Each antenna has a certain distance to the transmitter, representing its inverse weight
Receiver
Receiver Receiver
Transmitter
RSS Receiver Transmitter
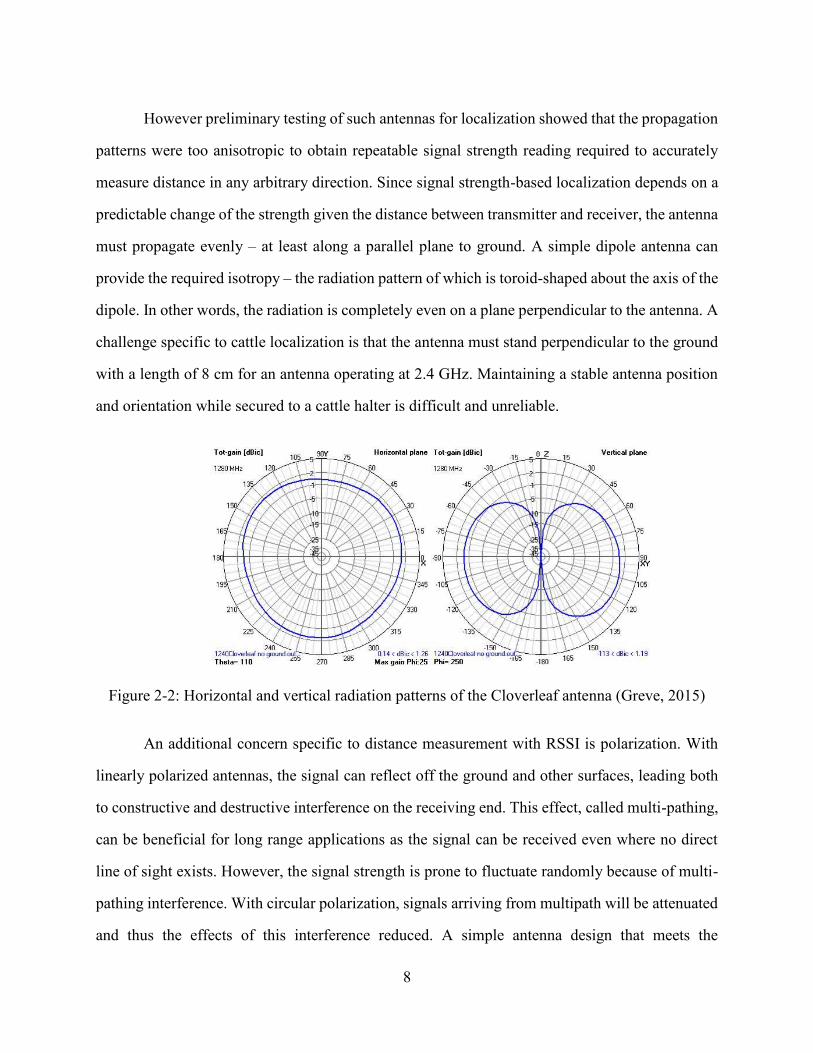
11
divided by its coordinates. The weight of the south-eastern antenna is 43% according to the formula
shown in equation 2-5:
Figure 2-4: Barycentric triangulation example with weighting
𝑃𝐴𝐶= 1.1−1
(1.1−1 + 1.8−1 + 3.3−1 + 3.0−1)⁄ = 0.43 (2-5)
The rest of the weights are likewise calculated and multiplied by their respective
coordinates as shown in table 2-1:
Table 2-1: Estimated position calculated from the obtained weights
Receiver X Y Weight X (Weighted) Y (Weighted)
A (northwest) 1 3 26.7% 1 × 0.26 = 0.27 3 × 0.26 = 0.80
B (northeast) 5 3 14.3% 5 × 0.14 = 0.72 3 × 0.14 = 0.43
C (southwest) 1 1 43.1% 1 × 0.43 = 0.43 1 × 0.43 = 0.43
D (southeast) 5 1 15.8% 5 × 0.15 = 0.79 1 × 0.15 = 0.15
Sum ≈ 2.0 (2.2) ≈ 1.5 (1.82)
Centroid location: As shown on the next graph in figure 2-5, each distance measured by
the receiver generates a radius. The intersection can be obtained by intercepting various radii and
are identified as smaller black dots. This method seeks to obtain the center from these intersections,
which are weighted equally. With collection of intersections, the possible range of location of the
transmitter can be inferred from equation 2-6 (Wang et. al, 2013):
𝐶𝑒𝑛𝑡𝑒𝑟 = (∑ 𝑥𝑖𝑛
𝑛1
𝑛,
∑ 𝑦𝑖𝑛𝑛1
𝑛) (2-6)

12
2.6 ACCELEROMETER AND OTHER SENSOR DATA FOR INFERRING CATTLE BEHAVIOR
While leveraging Bluetooth signal strength for localization, the channel can also be
employed to provide low bandwidth communication of other sensor data that can deliver further
insight into the performance of the herd. The proposed tags included accelerometers, the analytics
of which will be reported in future work with the intent of precisely identifying feeding frequency
and duration. Potentially other characteristics such as the general health can be inferred from this
acceleration data as well. Previous work of others has demonstrated the use of a wide array of
sensory information such as temperature, acceleration, blood oxygen levels, and heart rate all of
which provide awareness of the state specifically of each head of cattle (Foulkes et. al, 2013).
Nothing in the proposed platform precludes or hampers the integration of other sensors in addition
to accelerometers and this data collection and analysis will be the focus of future work.
Figure 2-5: Graphical representation of positioning according to the centroid

13
Chapter 3: Design of the Data Collection and Localization Framework
The architecture was developed based on initial requirements for the system that are not
addressed by currently available commercial systems. Additionally, the application was optimized
with the intent of scaling easily to a larger number of feedlots in an industrial-sized ranching
operation. As of today, the authors are unaware of any data collection frameworks (commercial or
otherwise) providing inexpensive data at the scale and precision of the current effort. The potential
and type of impact on ranch operation and herd performance were unknown initially and this work
is based on the hypothesis that with high volume and quality sensor data for all animals in an
operation, a ranch can garner practical information. Decisions can then be improved based on
operation-level patterns that guide the enterprise to higher efficiencies both strategically (feed
source, calf selection, etc.) and tactically (identify unhealthy / injured cattle, pregnant cattle, etc.).
3.1 SYSTEM REQUIREMENTS
Several characteristics for the framework were identified and prioritized to meet the overall
objectives. The overarching goal of the project can be summarized as a data collection system
providing:
(A) Durability: The system will include individual sensor beacons, which are required to
operate for multiple lifetimes of several animals sequentially. The beacons will be
fabricated with the intention of surviving at least two years in harsh environmental
conditions and with potential damage due to the natural behavior of the animals.
Batteries are assumed to be replaced just prior to attachment to an animal halter.
(B) Low Cost: The system will cost less than $5 USD per head with other overhead
expenses (receivers, repeaters and central computer) amortized into the per-head costs.
(C) High Resolution: Data collection will include high precision sensor information in
terms of both: (1) temporal resolution – reporting at least every 10 seconds, and (2)
spatial resolution – with less than 1 meter of positional error. Other sensor data will be
included in future work and an accelerometer is in the current version of the tag. The

14
exploration of identifying animal behavior from the accelerometer data is fertile for
identifying patterns relating to herd behavior.
(D) Low Energy: The system will include sensor beacons that operate continuously between
maintenance cycles in which infrequent intimate access to cattle harnesses is allowed
for charging or replacing batteries. Consequently, the beacons must operate unattended
for at least nine months – the course of the life of a single animal.
(E) Accessibility: The system will reliably provide all collected data for analysis in a remote
office location on a central computer wirelessly.
(F) Scalability: The system will allow for the ease of integration of any number of
contiguous feedlots within the operation without concerns regarding communication
range or reliability. A feed lot of 10 x 30 meters is targeted now with a maximum of
eight receivers per feedlot. However, the feed lot size could be increased with
additional receivers and the number of feedlots can be increased given the self-
configuring mesh network.
3.2 SYSTEM DESIGN
The framework included designing (1) sensors beacons (also referred to as tags) required
for each head and integrated into the harness and (2) receivers where eight receivers were
identified as providing optimal Bluetooth localization and sensor data transmission in a lot of no
more than 30 meters length and 10 meters width. The receivers also included ZigBee capability
for transmission of all aggregate data to the central computer through a reliable mesh network. The
beacons were based on commodity system-on-chip electronics (Nordic nRF51822) implemented
on a custom Printed Circuit Board (PCB) that included a battery and antenna connection as well
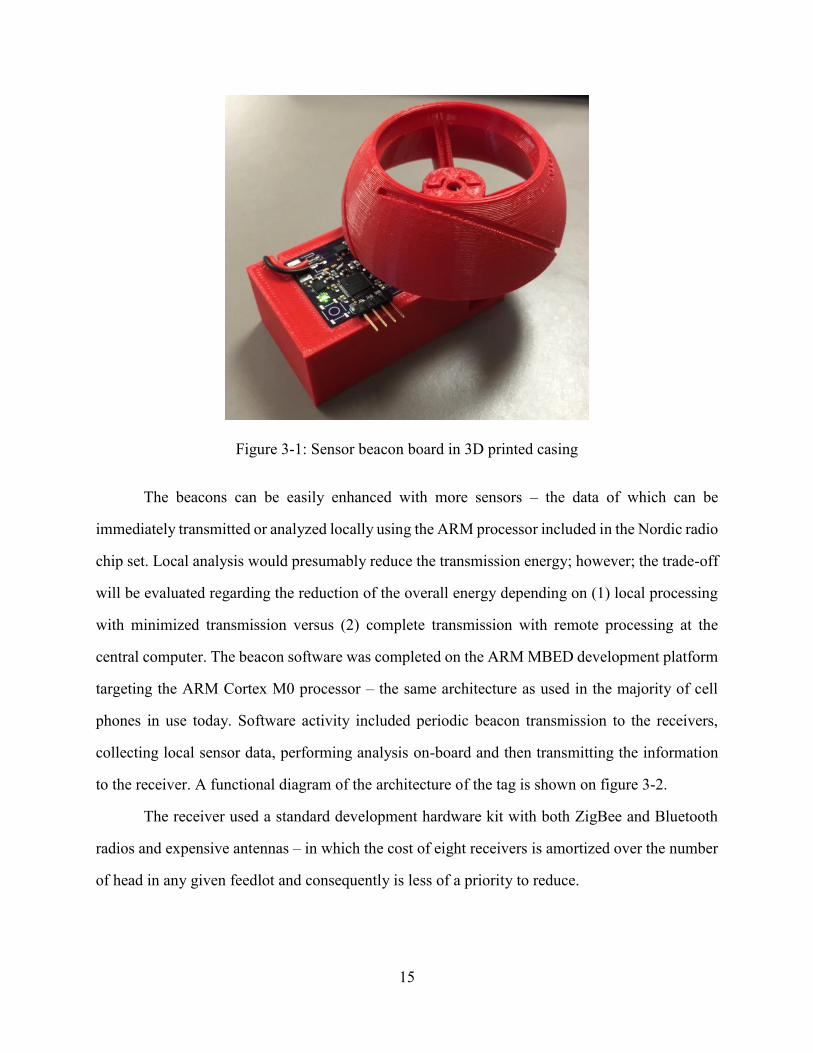
as an accelerometer. Figure 3-1 illustrates the sensor beacon board enclosed in a 3D printed casing
which also includes an integrated wire guide for the antenna.
15
Figure 3-1: Sensor beacon board in 3D printed casing
The beacons can be easily enhanced with more sensors – the data of which can be
immediately transmitted or analyzed locally using the ARM processor included in the Nordic radio
chip set. Local analysis would presumably reduce the transmission energy; however; the trade-off
will be evaluated regarding the reduction of the overall energy depending on (1) local processing
with minimized transmission versus (2) complete transmission with remote processing at the
central computer. The beacon software was completed on the ARM MBED development platform
targeting the ARM Cortex M0 processor – the same architecture as used in the majority of cell
phones in use today. Software activity included periodic beacon transmission to the receivers,
collecting local sensor data, performing analysis on-board and then transmitting the information
to the receiver. A functional diagram of the architecture of the tag is shown on figure 3-2.
The receiver used a standard development hardware kit with both ZigBee and Bluetooth
radios and expensive antennas – in which the cost of eight receivers is amortized over the number
of head in any given feedlot and consequently is less of a priority to reduce.

16
nRF51822BLE SoC
AccelerometerCloverleaf(2.4GHz)
Power Management
Battery
Figure 3-2: Block diagram of the tag/beacon architecture
Raspberry Pi
BluegigaBLE 112
Xbee ProDigimesh
USB
USB
Dipole(2.4GHz)
Cloverleaf(2.4GHz)
Power Management
Battery
Figure 3-3: Block diagram of the receiver
Figure 3-3 illustrates the basic block diagram showing two antennas – the Bluetooth
antenna for signal strength distance measurements of tags as well as any other auxiliary sensor
data and the ZigBee antenna for transmitting collected data through a mesh network to a central
computer for analysis. As the receiver are statically located, solar panels were used to provide
virtually unlimited operational lifetime. Although solar power was generated, batteries were
included to provide for data access during the night or when solar was not available.

17
Software development was completed using Python 2.7 running on a Raspberry Pi with the
Raspbian Linux distribution. The receiver software was responsible for aggregating the sensor and
localization data, measuring signal strength from each tag and re-transmitting any other received
data on the ZigBee mesh network.
3.3 SYSTEM IMPLEMENTATION
The following section justifies the selection of individual subsystems and describes each
one in detail. In addition, the electronic and mechanical design is explained.
3.3.1 Tag
The tag is composed of three main subsystems: system-on-a-chip, accelerometer and
power regulation. Each subsystem works in cohesion to collect, analyze and transmit data, while
utilizing the lowest power possible. Careful selection and pairing of each individual component
was required to optimize the power budget and obtain the required minimum battery lifetime of
six months.
3.3.1.1 System-on-a-Chip (SoC)
The SoC is the primary component of the system. It contains an RF transceiver which
communicates with the rest of the system using the Bluetooth protocol, a micro-controller to
collect, process and transmit data from sensors, in addition to controlling the state of the system.
Such a system allows for minimal power consumption as the internal subsystems can work
independently and efficiently. i.e. the transceiver subsystem can periodically send data pre-
generated without waking up the micro-controller.
A system with the aforementioned qualities is the nRF51822 by Nordic Semiconductor.
The included microcontroller is an ARM Cortex M0, developed primarily for low power
applications, with a floating-point unit useful for quickly performing mathematical operations
required for running algorithms. The RF transceiver support the Low Energy subset of Bluetooth
4.0 required in the application. An additional consideration was the availability of an open source
18
toolchain which reduces development costs greatly, in contrast to the IAR Workbench toolchain
($2,400 USD) required for a similar chip (TI CC2541).
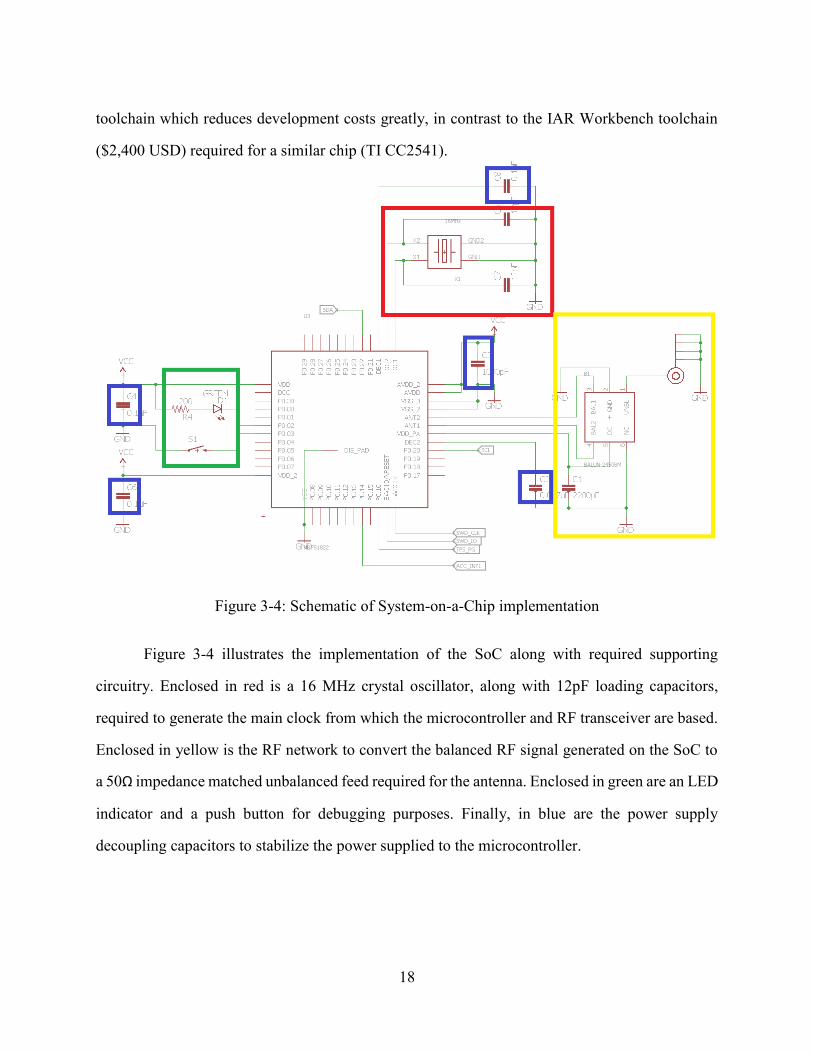
Figure 3-4: Schematic of System-on-a-Chip implementation
Figure 3-4 illustrates the implementation of the SoC along with required supporting
circuitry. Enclosed in red is a 16 MHz crystal oscillator, along with 12pF loading capacitors,
required to generate the main clock from which the microcontroller and RF transceiver are based.
Enclosed in yellow is the RF network to convert the balanced RF signal generated on the SoC to
a 50Ω impedance matched unbalanced feed required for the antenna. Enclosed in green are an LED
indicator and a push button for debugging purposes. Finally, in blue are the power supply
decoupling capacitors to stabilize the power supplied to the microcontroller.
19
3.3.1.2 Accelerometer
The accelerometer is the primary sensor in the system. The main constraint for selecting
an adequate sensor was low power consumption. No other requirements were given as the first
prototype is an experimental platform on top of which the algorithm is to be developed.
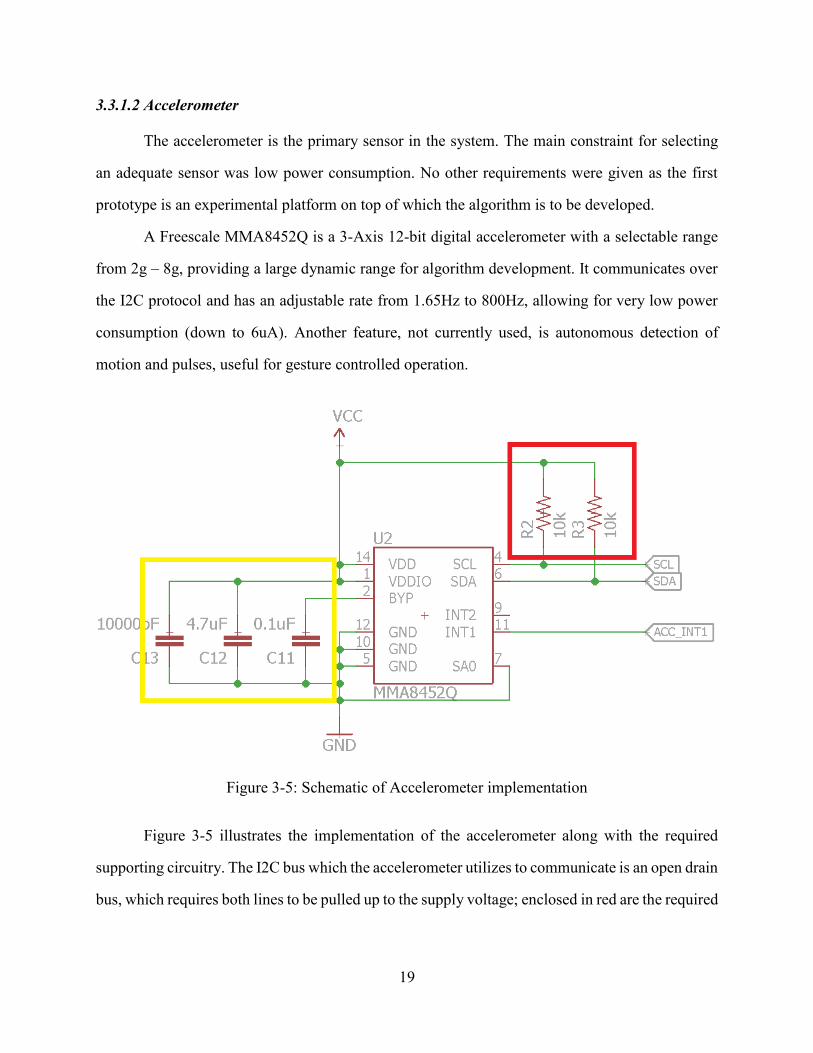
A Freescale MMA8452Q is a 3-Axis 12-bit digital accelerometer with a selectable range
from 2g – 8g, providing a large dynamic range for algorithm development. It communicates over
the I2C protocol and has an adjustable rate from 1.65Hz to 800Hz, allowing for very low power
consumption (down to 6uA). Another feature, not currently used, is autonomous detection of
motion and pulses, useful for gesture controlled operation.
Figure 3-5: Schematic of Accelerometer implementation
Figure 3-5 illustrates the implementation of the accelerometer along with the required
supporting circuitry. The I2C bus which the accelerometer utilizes to communicate is an open drain
bus, which requires both lines to be pulled up to the supply voltage; enclosed in red are the required

20
resistors. Enclosed in yellow are the power supply decoupling capacitors to stabilize the power
supplied to the accelerometer.
3.3.1.3 Power Regulation
A critical component for low power operation for the device is the power regulator. It must
provide a stable power supply to the circuit, while wasting the least possible amount of power in
conversion. The metric to classify the efficiency of a power regulator is the quiescent current. This
metric indicates the amount of current utilized for operating the regulator.
A regulator with the required properties is the TPS62740 by Texas Instruments. In
particular, the regulator is designed specifically for low power wireless applications; with a
quiescent current of 360nA. It can also operate on input voltages from 2.2V to 5.5V, allowing
operation from a wide range of batteries.
Figure 3-6: Schematic of Power Regulator implementation

21
Figure 3-6 illustrates the implementation of the power regulator along with the required
supporting circuitry. The implementation is based on the reference design provided by Texas
Instruments. The device provides four VSEL pins to select the output voltage. An output voltage
of 2.5V was selected as the lowest voltage that allows proper operation of all components (of
which the LED has a forward voltage of 2.5V). The PG (Power Good) pin provides an indication
of when the output voltage is stable and operation can begin, it is tied to an output pin in the
microcontroller.
3.3.1.4 Mechanical Design
To date, two different mechanical designs have been implemented. The first design
includes a holder for two AA batteries, the printed circuit board, and a custom 3D printed antenna.
The modeling was performed in SolidWorks CAD software and 3D printed using a MakerBot
Replicator 2X in ABS plastic. However, it is not designed for use in cattle as it does not provide
protection to the components it houses. Figure 3-7 illustrates the CAD design and final assembled
enclosure. This design is only useful for testing purposes.
Figure 3-7: Tag CAD Design and Final Assembly
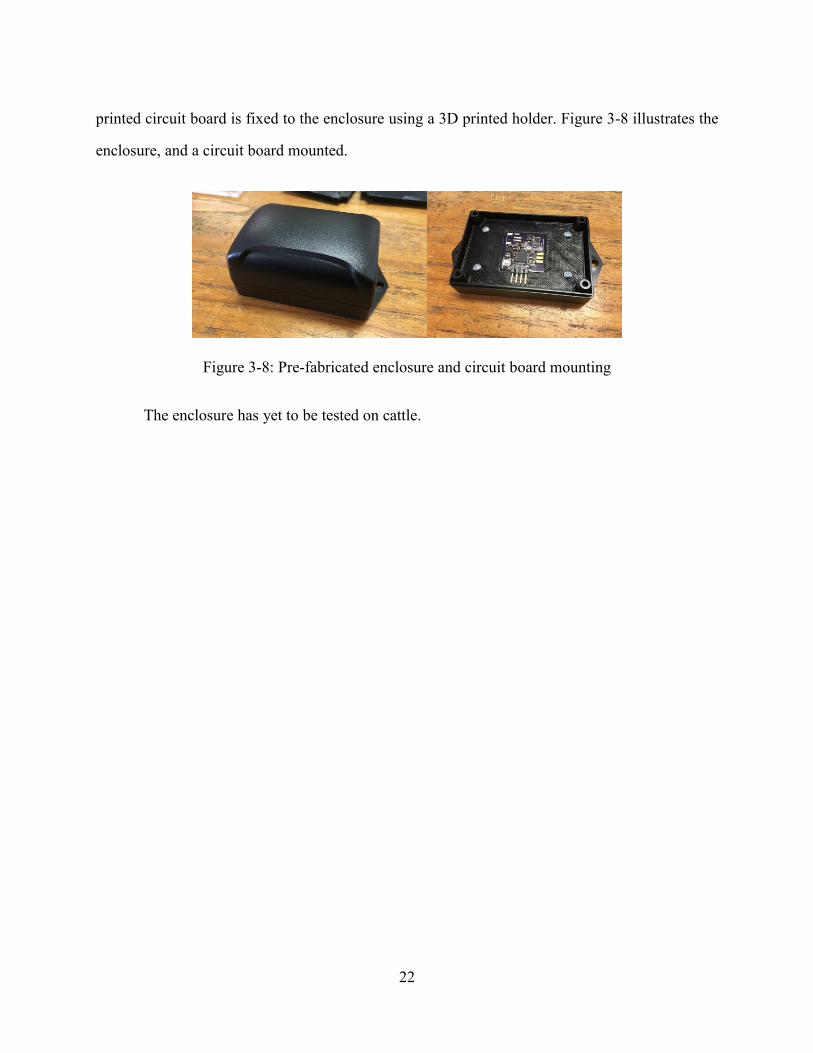
The second design uses a pre-fabricated enclosure rated for outdoor use. This enclosure
can host the printed circuit board with a regular wire antenna, in addition to a CR2032 battery
holder. Mounting holes are included to mount the enclosure to cattle using a standard halter. The
22
printed circuit board is fixed to the enclosure using a 3D printed holder. Figure 3-8 illustrates the
enclosure, and a circuit board mounted.
Figure 3-8: Pre-fabricated enclosure and circuit board mounting
The enclosure has yet to be tested on cattle.
23
Chapter 4: Experimental Results
Experiments were designed to evaluate the effectiveness of Bluetooth LE in terms of both
measuring distance using RSSI as well as reliably transmitting a relatively high bandwidth of
auxiliary information such as accelerometer data. Initial testing was performed with Bluetooth
development platform that contained a traditional PCB inverted F-shaped antenna. Due to the
highly inconsistent RSSI readings obtained, no correlation between distance and signal strength
could be calculated if the direction was changed. The inconsistency was identified as the result of
uneven propagation from the F-shaped antenna.
4.1 LOCALIZATION ACCURACY
To identify a suitable antenna for localization, a comparison of a variety of antennas in
terms of determining the distance between a beacon and a receiver was performed, four antennas
were implemented and the RSSI was measured from a range of angles for a range of distances.
This test included evaluating four antennas:
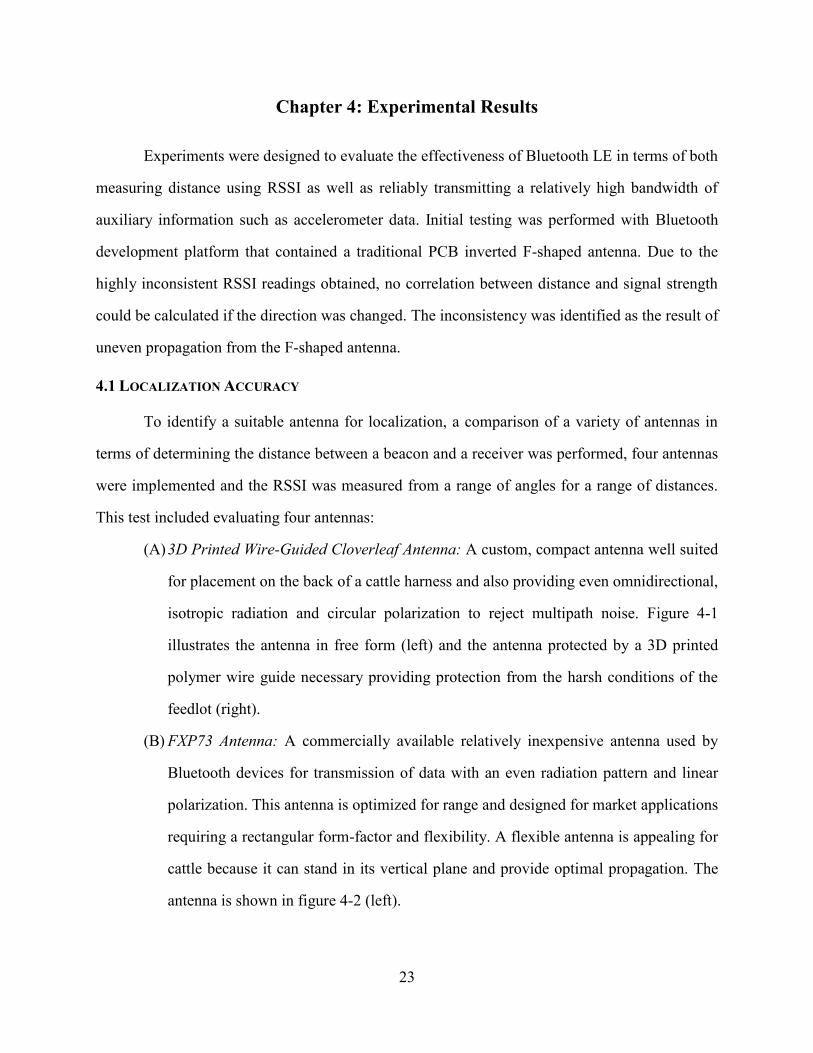
(A) 3D Printed Wire-Guided Cloverleaf Antenna: A custom, compact antenna well suited
for placement on the back of a cattle harness and also providing even omnidirectional,
isotropic radiation and circular polarization to reject multipath noise. Figure 4-1
illustrates the antenna in free form (left) and the antenna protected by a 3D printed
polymer wire guide necessary providing protection from the harsh conditions of the
feedlot (right).
(B) FXP73 Antenna: A commercially available relatively inexpensive antenna used by
Bluetooth devices for transmission of data with an even radiation pattern and linear
polarization. This antenna is optimized for range and designed for market applications
requiring a rectangular form-factor and flexibility. A flexible antenna is appealing for
cattle because it can stand in its vertical plane and provide optimal propagation. The
antenna is shown in figure 4-2 (left).
24
(C) WRL-11320 Antenna: A commercially available, relatively expensive antenna used by
commercial Bluetooth devices for longer distance transmission of data but not
optimized for localization applications with RSSI as radiation is somewhat directional.
The antenna is shown in figure 4-2 (center).
(D) 2.4 GHz Half-Wave Dipole Antenna: A commercially available relatively expensive
antenna used by Bluetooth devices for transmission of data but not optimized for
localization applications with RSSI. This antenna is used by routers or other high
performance networking devices, which require extended range or bandwidth. The
antenna provides an ideal propagation pattern and is used as a reference but is not
suitable for cattle as the required orientation orthogonal to ground is difficult to
maintain above the neck on the halter. The antenna is shown in figure 4-2 (right).
Figure 4-1: Cloverleaf with (right) / without (left) polymer guide

25
Figure 4-2: FXP73 (Left) WRL11320 (Center) Half-Wave Dipole (Right)
During the evaluation the performance of the four antennas was tested to device which
would be most appropriate to use in the localization. The first antenna (A – Cloverleaf) was
fabricated with wire and selected based on the omnidirectional behavior and polarization. The
greatest benefit of antenna A is the compact, low aspect design and the advantage of the
encapsulating geometry creating a wire guide which can be integrated with the additional
electronics and into the collar. The next two antennas (B – FXP73 and C – WRL11320) are
commercial and are part of the evaluation due to the common implementation. Finally, the last
antenna (D – Half-Wave Dipole) was included as a reference. Although inconvenient in form for
a cattle harness, antenna D is the standard for isotropic radiation and included for comparison
purposes. The test consisted of a single receiver and transmitter in each case, with the transmitter
placed at distances from two to ten meters from the receiver, and with zero and ninety-degree angle
to test the isotropy of the antenna. Since antenna A is symmetric in every direction, only one test
is shown.
26
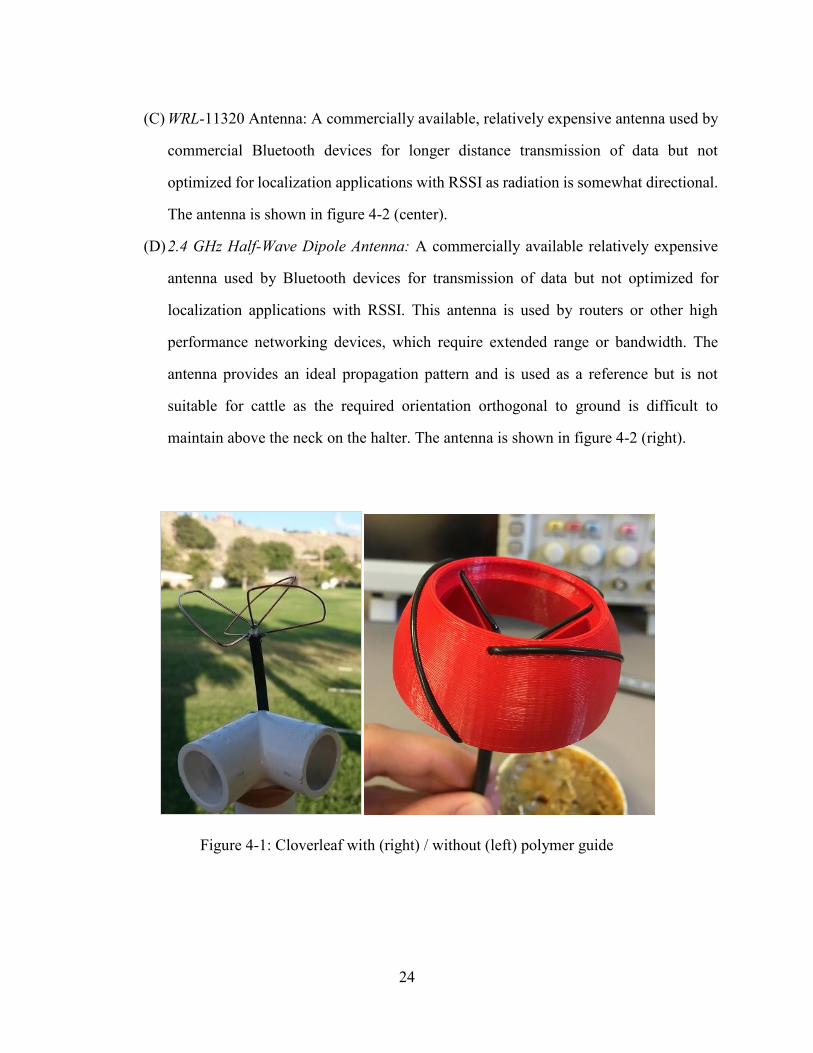
Table 4-1: Advertisement packet loss with each antenna
Distance (meters) A B C D
0º 0º 90º 0º 90º 0º 90º
2 1.2% 0.0% 1.6% 1.6% 0.8% 0.8% 0.8%
4 1.2% 0.4% 2.9% 0.4% 0.8% 1.2% 0.8%
6 0.4% 0.0% 0.8% 0.8% 0.8% 0.4% 1.2%
8 0.0% 0.4% 0.4% 0.8% 1.2% 10.4% 1.6%
10 0.8% 0.0% 0.8% 0.8% 0.8% 0.8% 1.6%
12 1.2% 0.8% 0.8% 2.5% 19.5%
Average 0.8% 0.2% 1.2% 0.8% 0.7% 2.6% 4.2%
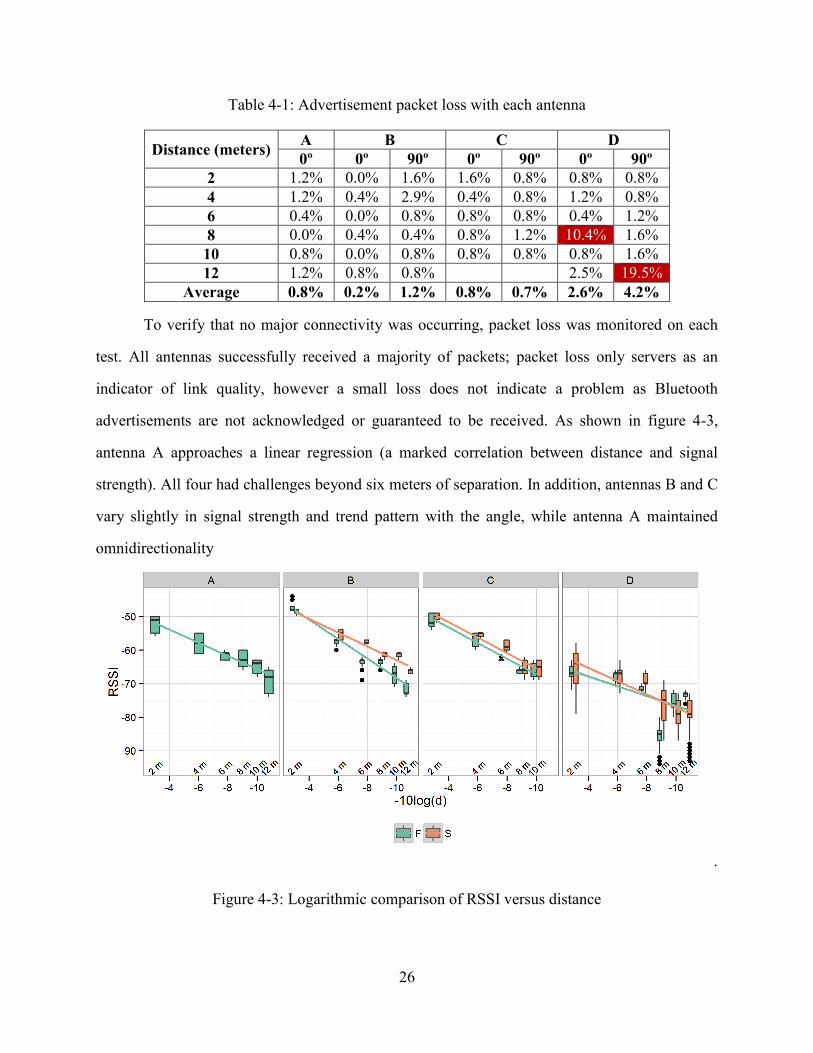
To verify that no major connectivity was occurring, packet loss was monitored on each
test. All antennas successfully received a majority of packets; packet loss only servers as an
indicator of link quality, however a small loss does not indicate a problem as Bluetooth
advertisements are not acknowledged or guaranteed to be received. As shown in figure 4-3,
antenna A approaches a linear regression (a marked correlation between distance and signal
strength). All four had challenges beyond six meters of separation. In addition, antennas B and C
vary slightly in signal strength and trend pattern with the angle, while antenna A maintained
omnidirectionality
.
Figure 4-3: Logarithmic comparison of RSSI versus distance
27
The four antennas obtained good results on a linear regression between distance and signal
strength. The best performance was antenna B (r2 = 0.95), followed by antenna C (r2 = 0.91), then
antenna A (r2 = 0.82) and finally antenna D (r2 = 0.36). While underperforming compared to
antennas B and C, antenna A was chosen for the omnidirectional propagation (same linear
regression independent of angle) and the reduced cost based on simple wire and guide fabricated
with 3D printing.
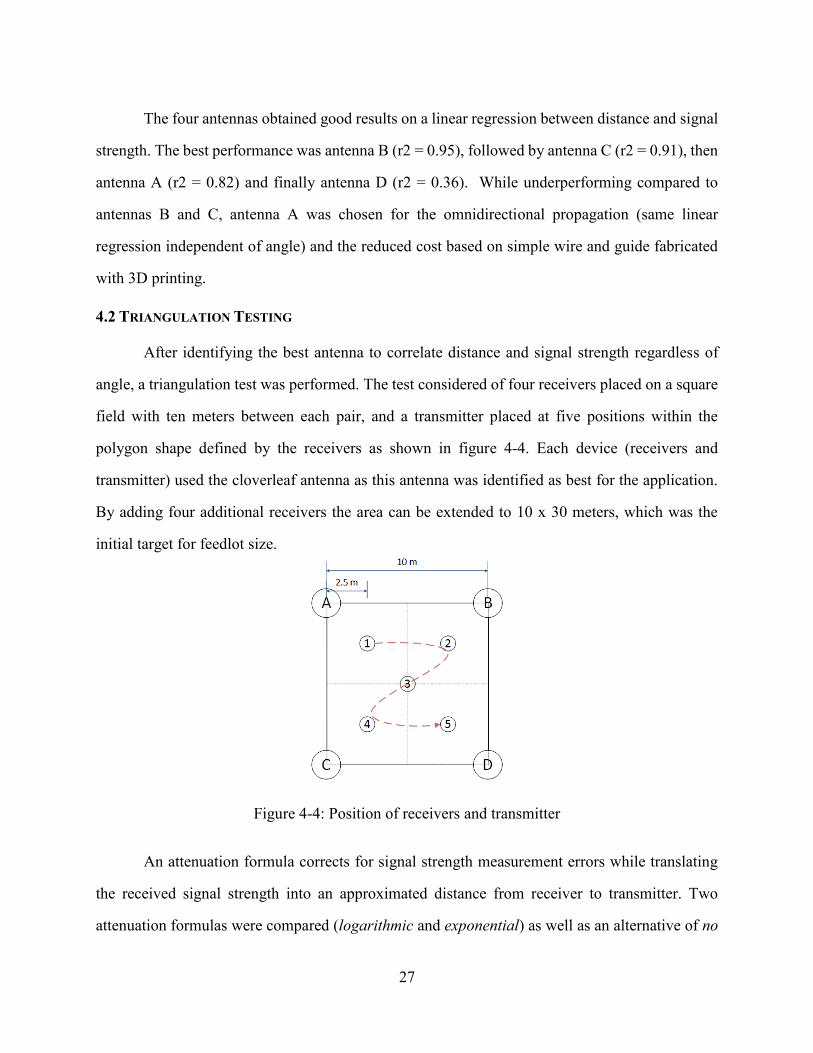
4.2 TRIANGULATION TESTING
After identifying the best antenna to correlate distance and signal strength regardless of
angle, a triangulation test was performed. The test considered of four receivers placed on a square
field with ten meters between each pair, and a transmitter placed at five positions within the
polygon shape defined by the receivers as shown in figure 4-4. Each device (receivers and
transmitter) used the cloverleaf antenna as this antenna was identified as best for the application.
By adding four additional receivers the area can be extended to 10 x 30 meters, which was the
initial target for feedlot size.
Figure 4-4: Position of receivers and transmitter
An attenuation formula corrects for signal strength measurement errors while translating
the received signal strength into an approximated distance from receiver to transmitter. Two
attenuation formulas were compared (logarithmic and exponential) as well as an alternative of no
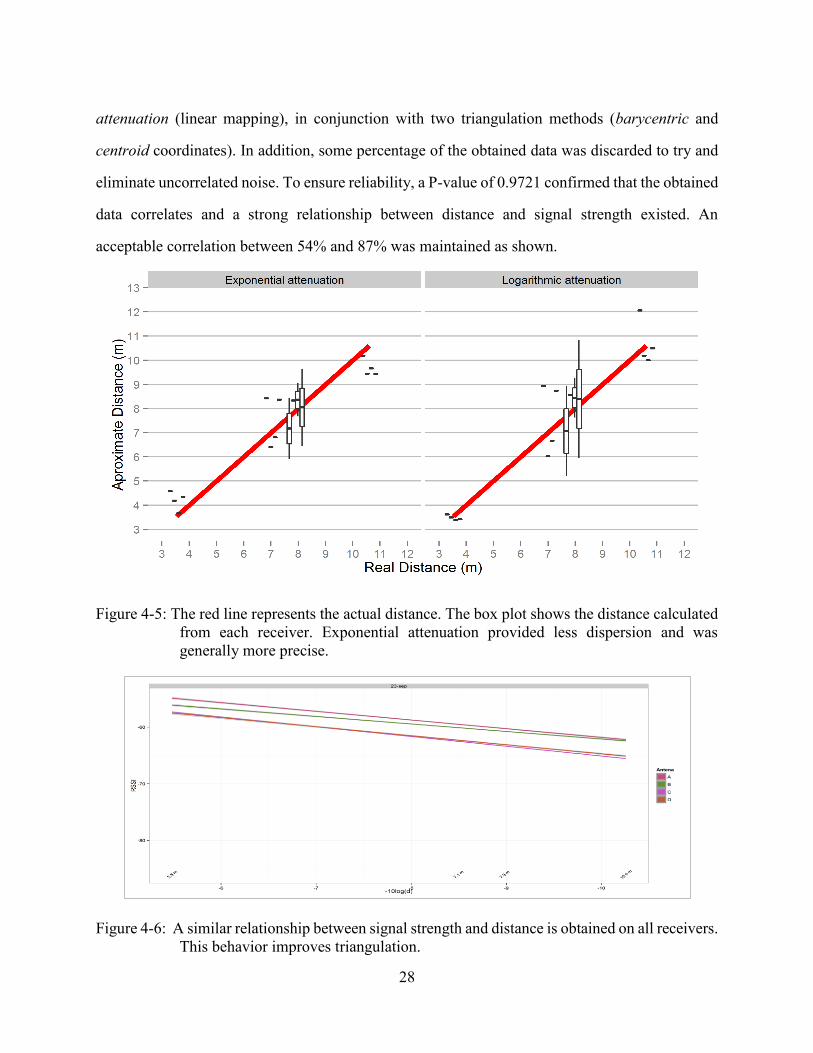
28
attenuation (linear mapping), in conjunction with two triangulation methods (barycentric and
centroid coordinates). In addition, some percentage of the obtained data was discarded to try and
eliminate uncorrelated noise. To ensure reliability, a P-value of 0.9721 confirmed that the obtained
data correlates and a strong relationship between distance and signal strength existed. An
acceptable correlation between 54% and 87% was maintained as shown.
Figure 4-5: The red line represents the actual distance. The box plot shows the distance calculated
from each receiver. Exponential attenuation provided less dispersion and was
generally more precise.
Figure 4-6: A similar relationship between signal strength and distance is obtained on all receivers.
This behavior improves triangulation.
29
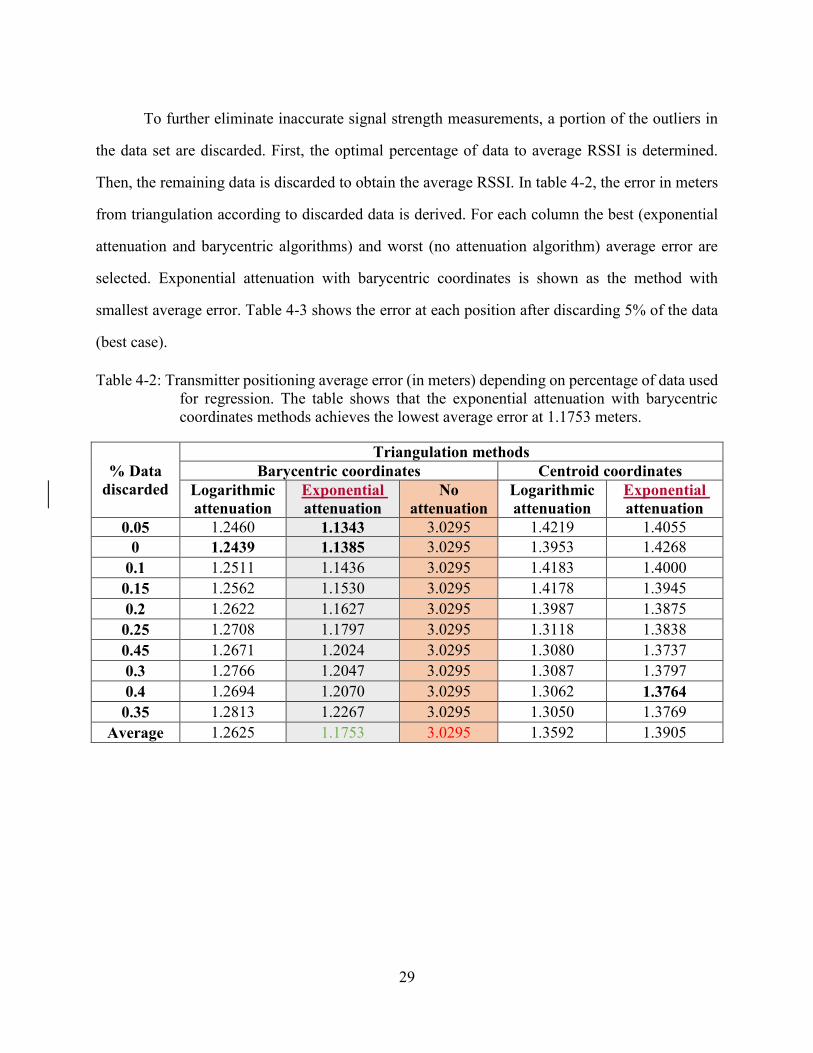
To further eliminate inaccurate signal strength measurements, a portion of the outliers in
the data set are discarded. First, the optimal percentage of data to average RSSI is determined.
Then, the remaining data is discarded to obtain the average RSSI. In table 4-2, the error in meters
from triangulation according to discarded data is derived. For each column the best (exponential
attenuation and barycentric algorithms) and worst (no attenuation algorithm) average error are
selected. Exponential attenuation with barycentric coordinates is shown as the method with
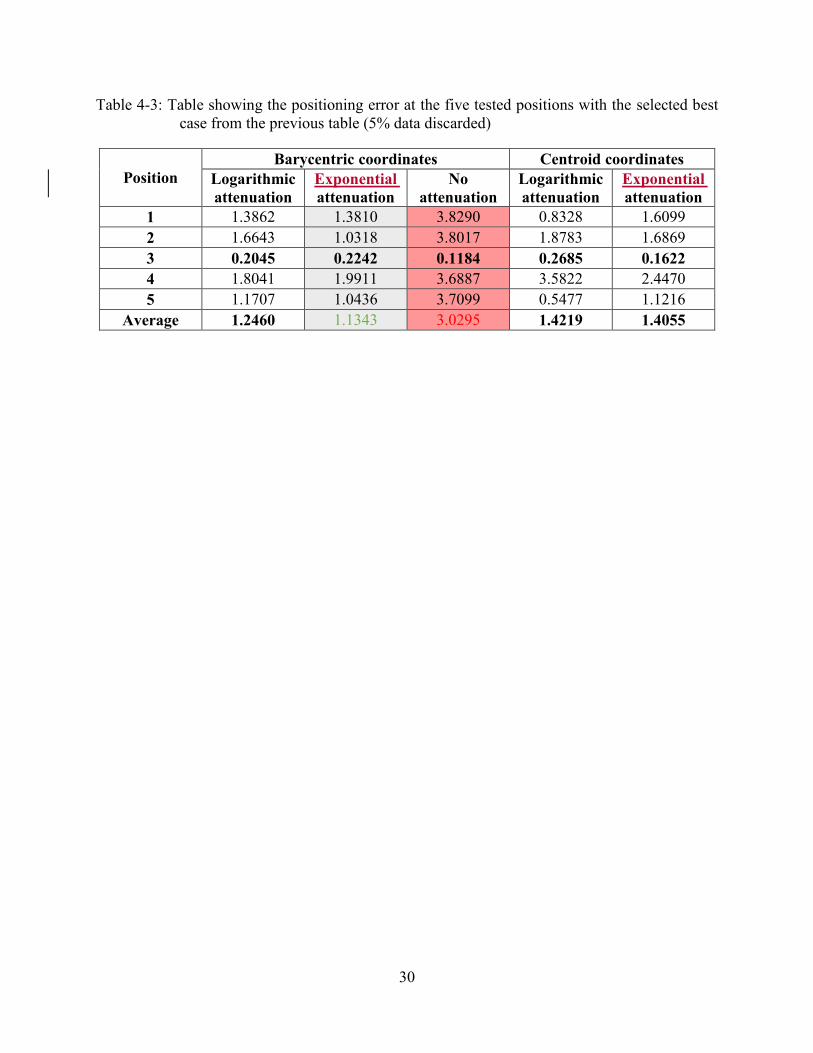
smallest average error. Table 4-3 shows the error at each position after discarding 5% of the data
(best case).
Table 4-2: Transmitter positioning average error (in meters) depending on percentage of data used
for regression. The table shows that the exponential attenuation with barycentric
coordinates methods achieves the lowest average error at 1.1753 meters.
% Data
discarded
Triangulation methods
Barycentric coordinates Centroid coordinates
Logarithmic
attenuation
Exponential
attenuation
No
attenuation
Logarithmic
attenuation
Exponential
attenuation
0.05 1.2460 1.1343 3.0295 1.4219 1.4055
0 1.2439 1.1385 3.0295 1.3953 1.4268
0.1 1.2511 1.1436 3.0295 1.4183 1.4000
0.15 1.2562 1.1530 3.0295 1.4178 1.3945
0.2 1.2622 1.1627 3.0295 1.3987 1.3875
0.25 1.2708 1.1797 3.0295 1.3118 1.3838
0.45 1.2671 1.2024 3.0295 1.3080 1.3737
0.3 1.2766 1.2047 3.0295 1.3087 1.3797
0.4 1.2694 1.2070 3.0295 1.3062 1.3764
0.35 1.2813 1.2267 3.0295 1.3050 1.3769
Average 1.2625 1.1753 3.0295 1.3592 1.3905
30
Table 4-3: Table showing the positioning error at the five tested positions with the selected best
case from the previous table (5% data discarded)
Position
Barycentric coordinates Centroid coordinates
Logarithmic
attenuation
Exponential
attenuation
No
attenuation
Logarithmic
attenuation
Exponential
attenuation
1 1.3862 1.3810 3.8290 0.8328 1.6099
2 1.6643 1.0318 3.8017 1.8783 1.6869
3 0.2045 0.2242 0.1184 0.2685 0.1622
4 1.8041 1.9911 3.6887 3.5822 2.4470
5 1.1707 1.0436 3.7099 0.5477 1.1216
Average 1.2460 1.1343 3.0295 1.4219 1.4055

31
Chapter 5: Conclusions
A proposed framework for supplying high volume, high fidelity sensor data for use in the
operation of a large agricultural enterprise has been designed and demonstrated. The ability of a
ranch to achieve precision agriculture through advanced cattle analytics is just now possible based
on the advancement of inexpensive, commodity networking electronics in conjunction with new
and more precise sensors. Collectively, these technologies are providing a refined level of
visibility on the operational details of the herd as well as the individual head of cattle in order for
ranchers to operate their businesses with improved efficiencies – remotely from the comfort of
their home or office.
32
References
[Nadimi, E.S., et al. 2008. ZigBee-based wireless sensor networks for monitoring animal presence
and pasture time in a strip of new grass. Computers and Electronics in Agriculture 61.2. pp
79-87.]
[Owen-Smith, N., Fryxell, J.M., Merrill, E.H. 2013. Foraging theory upscaled: the behavioural
ecology of herbivore movement. Philos. Trans. R. Soc. B 365. Pp 2267-2278.]
[Gaillard, J.M., Hebblewhite, M., Loison, A., Fuller, M., Powell, R., Basille, M., Van Moorter, B.
2010. Habitat-performance relationships: finding the right metric at a given spatial scale.
Philos. Trans. R. Soc. B. pp. 2255-2265.]
[González, L.A., et. al. 2015. Behavioral classification of data from collars containing motion
sensors in grazing cattle. Computer and Eletronics in Agriculture 110. Pp. 91-102.]
[Anderson, D.M., Estell, R.E., Cibils, A.F., 2013. Spatiotemporal cattle data – a plea for protocol
standardization. Positioning 4. Pp 115-136.]
[Zhao, Y., Hao, Y., Parini, C.G. 2005. Radiation properties of PIFA on electromagnetic bandgap
substrates. Microwave and optical technology letters 44.1. pp. 21-24.]
[Van, H.N., Jin. Y., Soh, W. 2007. Indoor localization using multiple wireless technologies.
Mobile Adhoc and Sensor Systems. MASS 2007, IEEE International Conference.]
[Anderson, D.M., Winters, C., Estell, R.E., Fredrickson, E.L., Doniec, M., Detweiler, C., Ru, D.,
James, D., Nolen, B. 2012. Characterising the spatial and temporal activities of free-
ranging cows from GPS data. Rangeland J. 34. pp. 149-161.]
[Gezici, S., et. al. 2005. Localization via ultra-wideband radios: a look at positioning aspects for
future sensor networks. Signal Processing Magazine, IEEE 22.4. pp. 70-84.]
[Honkavirta, V., et. al. 2009. A comparative survey of WLAN location fingerprinting methods.
Positioning, Navigation and Communication. WPNC 2009, 6th Workshop.]
[Bahl, P. 2000. RADAR: An in-building RF-based user location and tracking system. INFOCOM
2000. Nineteenth Annual Joint Conference of the IEEE Computer and Communications
Societies. Proceeding. IEEE. Vol. 2.]
[McCrady, D., Doyle, L., Forstrom, H., Dempsey, T., Martorana, M. 2000. Mobile ranging using
low-accuracy clocks. IEEE Transactions on Microwave Theory and Techniques, Vol. 48.
pp. 951.]
[Vorst, P., Sommer, J., Hoene, C., Schneider, P., Weiss, C., Schairer, T., Rosenstiel, W., Zell, A.,
Carle, G. 2008. Indoor positioning via three different RF technologies.]
[Sanpechuda, T., Kovavisaruch, L. 2008. A review of RFID localization: Applications and
techniques. Electrical Engineering / Electronics, Computer, Telecommunications and
Information Technology, 2008. ECTI-CON 2008. 5th International Conference Vol 2.
IEEE.]
[Castaño, J.G., Svensson, M., Ekstrom, M. 2004. Local positioning for wireless sensor based on
Bluetooth. Radio and Wireless Conference, IEEE.]

33
[Wang, Y. et. al. 2013. Bluetooth positioning using RSSI and triangulation methods. Consumer
Communications and Networking Conference (CCNC), IEEE.]
[Bandara, U. et. al. 2004. Design and implementation of a Bluetooth signal strength based location
sensing system. Radio and Wireless Conference, IEEE.]
[Kotanen, A., et. al. 2003. Experiments on local positioning with Bluetooth. Information
Technology: Coding and Computing [Computers and Communications], IEEE.]
[Rodas, J., et. al. 2007. Sistema de Posicionamiento Basado en Bluetooth con Calibrado Dinámico.
Proc. URSI, Santa Cruz de Tenerife, Spain.]
[Weisstein, E. W. 2015. Barycentric Coordinates. Text. Retrieved September 23, 2015.
http://mathworld.wolfram.com/BarycentricCoordinates.html.]
[Foulkes, J., et. al. 2013. Livestock Management System. Proceedings of the International
Conference on Embedded Systems and Applications (ESA), Computer Engineering and
Applied Computing.]
[Liang, M., Shemelya, C., MacDonald, E., Wicker, R., Xin, H., 2015. 3D Printed Microwave Patch
Antenna via Fused Deposition Method and Ultrasonic Wire Mesh Embedding Technique.
IEEE Antennas and Wireless Propagation Letters, Issue 99.]
[Shemelya, C., Cedillos, F., Aguilera, E., Muse, D., Espalin, D., Wicker, R., MacDonald, E. 2015.
Encapsulated Copper Wire and Copper Mesh Capacitive Sensing for 3D Printing
Applications. IEEE Sensors Jounal, Vol. 15., Issue. 2.]
[Espalin, D., Muse, D., Medina, F., MacDonald, E., Wicker, R.B. 2014. 3D Printing Multi-
Functionality: Structures with Electronics. International Journal of Advanced
Manufacturing Technology, Vol. 72, Issue 5-8. pp. 963-978.]
[MacDonald, E., Salas, R., Espalin, D., Perez, M., Aguilera, E., Muse, D., Wicker, R. 2014. 3D
Printing for the Rapid Prototyping of Structural Electronics. Access IEEE, Vol. 2.]
[Lopes, A.J., Lee, I.H., MacDonald, E., Quintana, R., Wicker, R., 2014. Laser Curing of Silver-
Based Conductive Inks for In Situ 3D Structural Electronics Fabrication in
Stereolithography. Journal Materials Processing Technology, Vol. 214, Iss. 9. pp. 1935-
1945.]
[Hofmann-Wellenhof, B., Lichtenegger, H., Collins, J. 2013. Global Positioning System: theory
and practice. Springer Science & Business Media.]
[Greve, A. 2015. Build IBCrazy’s Cloverleaf – The Ultimate Circularly Polarized Aerial Antenna.
RC Groups. Web. Retrieved January 14, 2015 from
http://www.rcgroups.com/forums/showthread.php?t=1388264.]
[U.S. Department of Agriculture. 2015. Weekly Industrial Circular. Retrieved from
http://www.usda.gov.]
[U.S. Federal Aviation Administration. 2015. GPS Frequently Asked Questions. Retrieved from
http://www.faa.gov/about/office_org/headquarters_offices/ato/service_units/techops/navs
ervices/gnss/faq/gps/.]
[Texas Instruments. 2014. TPS6274x 360nA Iq Step Down Converter For Low Power Application.
Retrieved April 22, 2015 from http://www.ti.com/lit/ds/symlink/tps62740.pdf.]

34
[NXP / Freescale Semiconductor. 2015. MMA8452Q, 3-Axis, 12-bit/8-bit Digital Accelerometer.
Retrieved April 22, 2015 from
http://www.nxp.com/files/sensors/doc/data_sheet/MMA8452Q.pdf.]
[Nordic Semiconductor. 2016. nRF51822 Multiprotocol Bluetooth low energy / 2.4 GHz RF
System on Chip. Retrieved April 22, 2015 from
https://www.nordicsemi.com/eng/nordic/download_resource/20339/13/7308456.]
35
Vita
Luis Carlos Bañuelos Chacón was born on September of 1992 in Ciudad Juárez,
Chihuahua, México. Luis obtained his high school diploma from Tecnológico de Monterrey in
Ciudad Juárez on May 2010. He then enrolled at the University of Texas at El Paso in August
2010, and was awarded a Bachelor of Science degree in Electrical Engineering in December 2014.
In January 2015, he continued with his graduate studies at the University of Texas at El Paso in
the field of Computer Engineering. Through the course of his degrees, he worked as a Research
Assistant at the W.M. Keck Center for 3D Innovation from June 2013 to May 2016.
Contact Information: [email protected]
This thesis was typed by Luis Carlos Bañuelos Chacón.