Embed Size (px)
Citation preview
1) FAN 2) Heat Exchanger 3) Compressor 4) Compressor Control
6.0
4.5
3.0
1.5
0.0
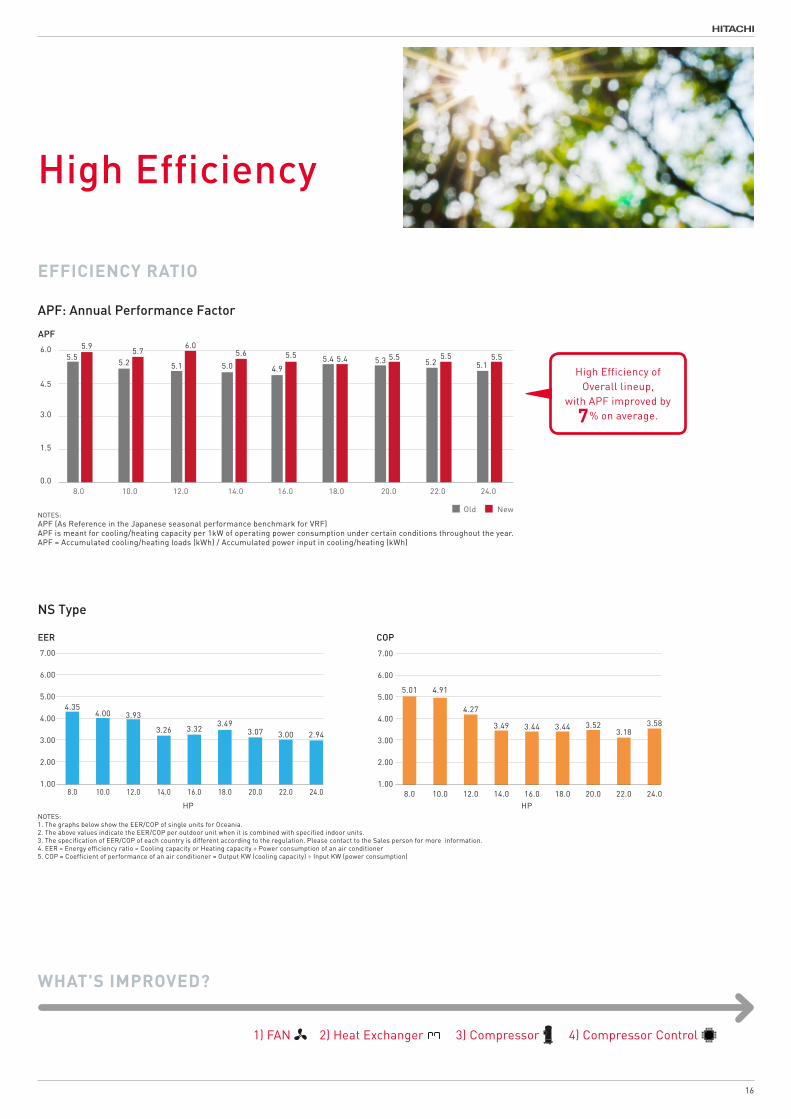
5.55.9
5.2 5.1
5.76.0
5.0 4.9
5.6 5.5 5.4 5.3 5.2 5.15.4 5.5 5.5 5.5
8.0 10.0 12.0 14.0 16.0 18.0 20.0 22.0 24.0
Old NewNOTES:APF (As Reference in the Japanese seasonal performance benchmark for VRF)APF is meant for cooling/heating capacity per 1kW of operating power consumption under certain conditions throughout the year.APF = Accumulated cooling/heating loads (kWh) / Accumulated power input in cooling/heating (kWh)
NOTES:1. The graphs below show the EER/COP of single units for Oceania.2. The above values indicate the EER/COP per outdoor unit when it is combined with specified indoor units.3. The specification of EER/COP of each country is different according to the regulation. Please contact to the Sales person for more information.4. EER = Energy efficiency ratio = Cooling capacity or Heating capacity ÷ Power consumption of an air conditioner5. COP = Coefficient of performance of an air conditioner = Output KW (cooling capacity) ÷ Input KW (power consumption)
5.01 4.91
4.27
3.49 3.44 3.44 3.523.18
3.58
8.0 10.0 12.0 14.0 16.0 18.0 20.0 22.0 24.0
5.00
4.00
3.00
7.00
6.00
2.00
1.00
4.354.00 3.93
3.26 3.323.49
3.07
8.0 10.0 12.0 14.0 16.0 18.0 20.0 22.0 24.0
3.00 2.94
HPHP
5.00
4.00
3.00
7.00
6.00
2.00
1.00
EFFICIENCY RATIO
WHAT'S IMPROVED?
APF: Annual Performance Factor
NS Type
High Efficiency
High Efficiency of Overall lineup,
with APF improved by
7% on average.
APF
5.01 4.91
4.27
3.49 3.44 3.44 3.523.18
3.58
8.0 10.0 12.0 14.0 16.0 18.0 20.0 22.0 24.0
5.00
4.00
3.00
7.00
6.00
2.00
1.00
4.354.00 3.93
3.26 3.323.49
3.07
8.0 10.0 12.0 14.0 16.0 18.0 20.0 22.0 24.0
3.00 2.94
HPHP
5.00
4.00
3.00
7.00
6.00
2.00
1.00
COPEER
16
High Efficiency
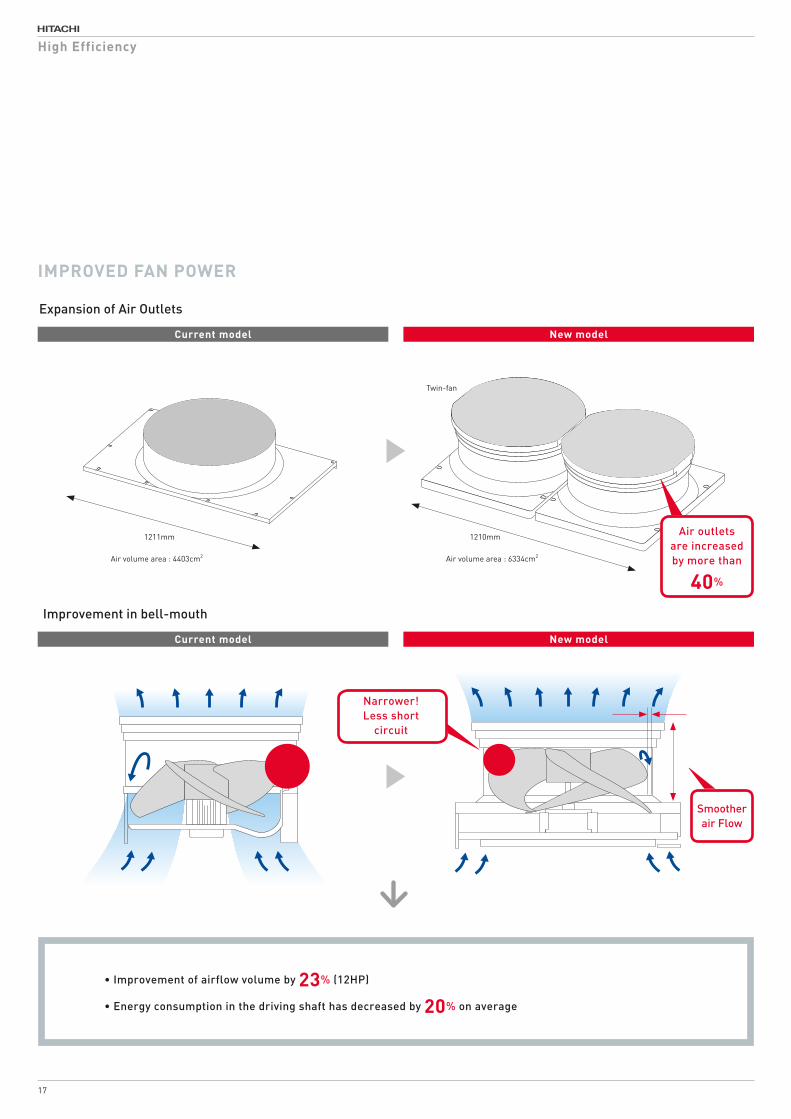
IMPROVED FAN POWER
Expansion of Air Outlets
• Improvement of airflow volume by 23% (12HP)
• Energy consumption in the driving shaft has decreased by 20% on average
Improvement in bell-mouth
Current model New model
Narrower!Less short
circuit
Smoother air Flow
17
Twin-fan
Air volume area : 6334cm2Air volume area : 4403cm2
1210mm1211mm
Current model New model
Air outlets are increased by more than
40%
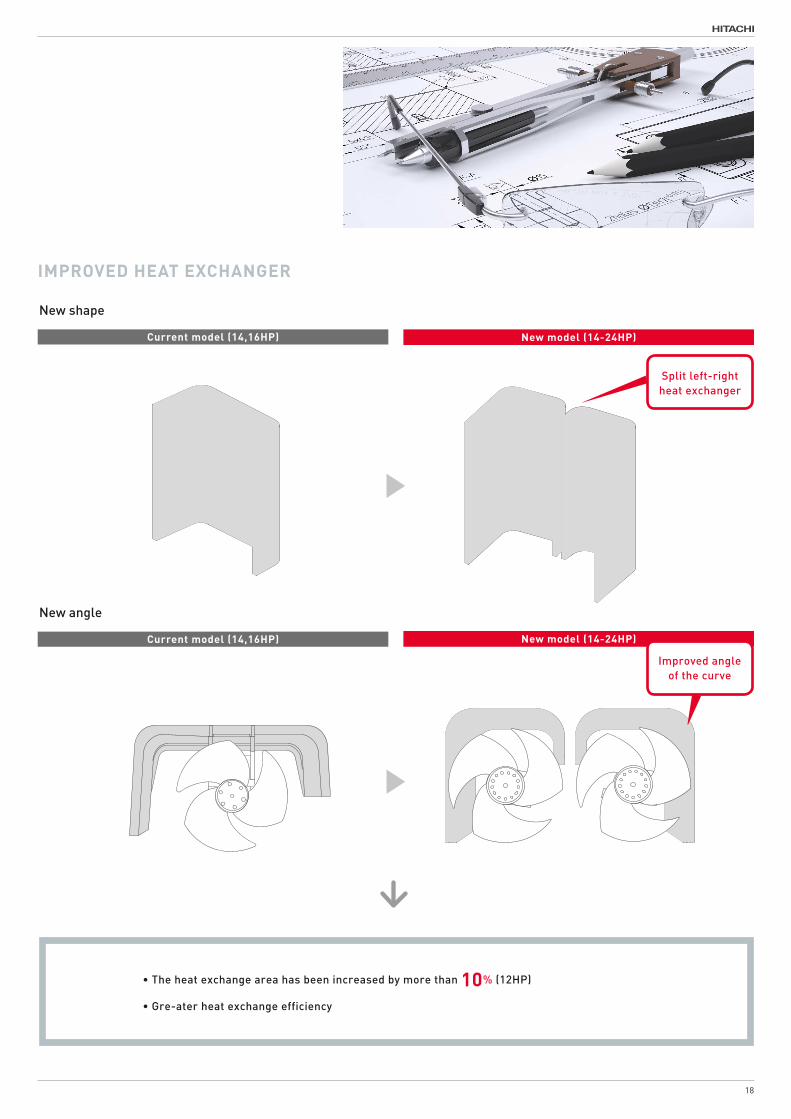
IMPROVED HEAT EXCHANGER
New shape
New angle
• The heat exchange area has been increased by more than 10% (12HP)
• Gre-ater heat exchange efficiency
Current model (14,16HP) New model (14-24HP)
Improved angle of the curve
18
Current model (14,16HP) New model (14-24HP)
Split left-right heat exchanger
100%
20%
Inve
rter
Com
pres
sor
Con
trol
Cap
acity
Cooling Load Max.Min.
100%
10%
Inve
rter
Com
pres
sor
Con
trol
Cap
acity
Cooling Load Max.Min.
InverterCompressor
InverterCompressor
Oil Pump
Motor Stator
Motor Rotor
Counterweight
Oldham’s CouplingOrbiting Scroll
Fixed Scroll
Pressure bypass valve
Main Bearing
Thrust Bearing
Frame Seal
Crankshaft
Sub Bearing
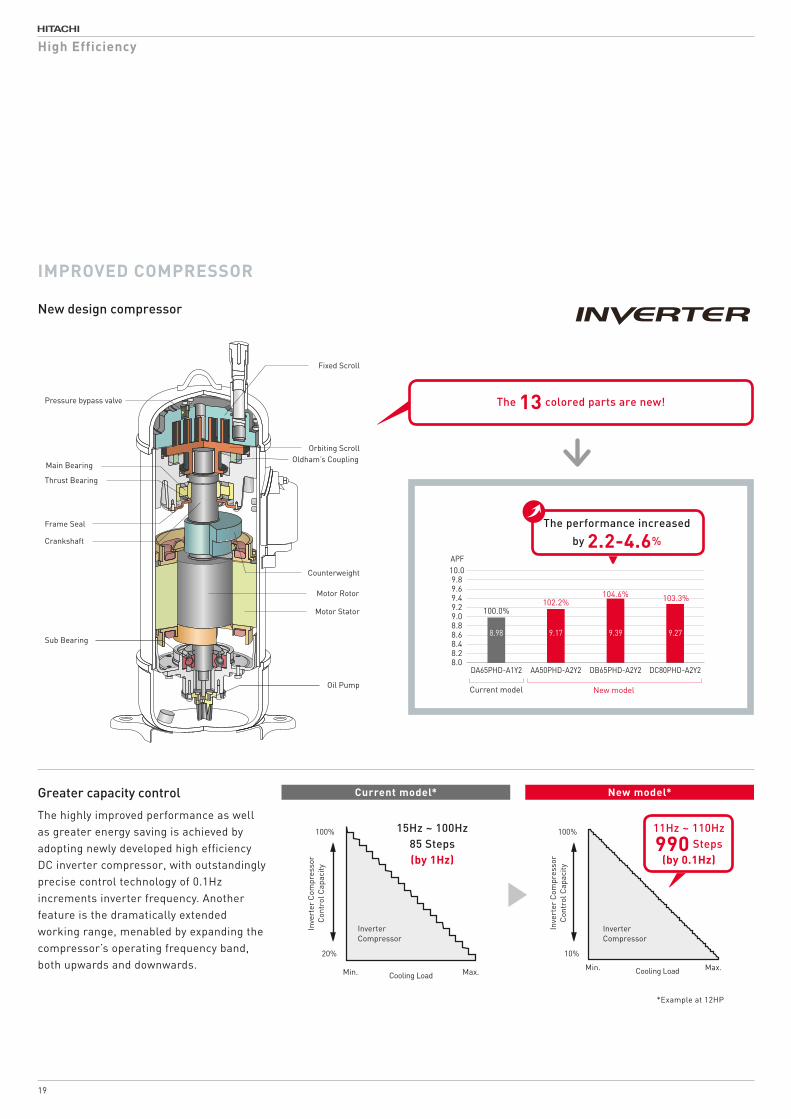
10.09.89.69.49.29.08.88.68.48.28.0
100.0%
8.98
DA65PHD-A1Y2
APF
102.2%
9.17
AA50PHD-A2Y2
104.6%
9.39
DB65PHD-A2Y2
103.3%
9.27
DC80PHD-A2Y2
Current model New model
100%
20%
Inve
rter
Com
pres
sor
Con
trol
Cap
acity
Cooling Load Max.Min.
100%
10%
Inve
rter
Com
pres
sor
Con
trol
Cap
acity
Cooling Load Max.Min.
InverterCompressor
InverterCompressor
IMPROVED COMPRESSOR
New design compressor
Greater capacity control
The 13 colored parts are new!
11Hz ~ 110Hz
990 Steps(by 0.1Hz)
15Hz ~ 100Hz85 Steps(by 1Hz)
The highly improved performance as well as greater energy saving is achieved by adopting newly developed high efficiency DC inverter compressor, with outstandingly precise control technology of 0.1Hz increments inverter frequency. Another feature is the dramatically extended working range, menabled by expanding the compressor’s operating frequency band, both upwards and downwards.
Current model* New model*
The performance increased
by 2.2-4.6%
*Example at 12HP
High Efficiency
19
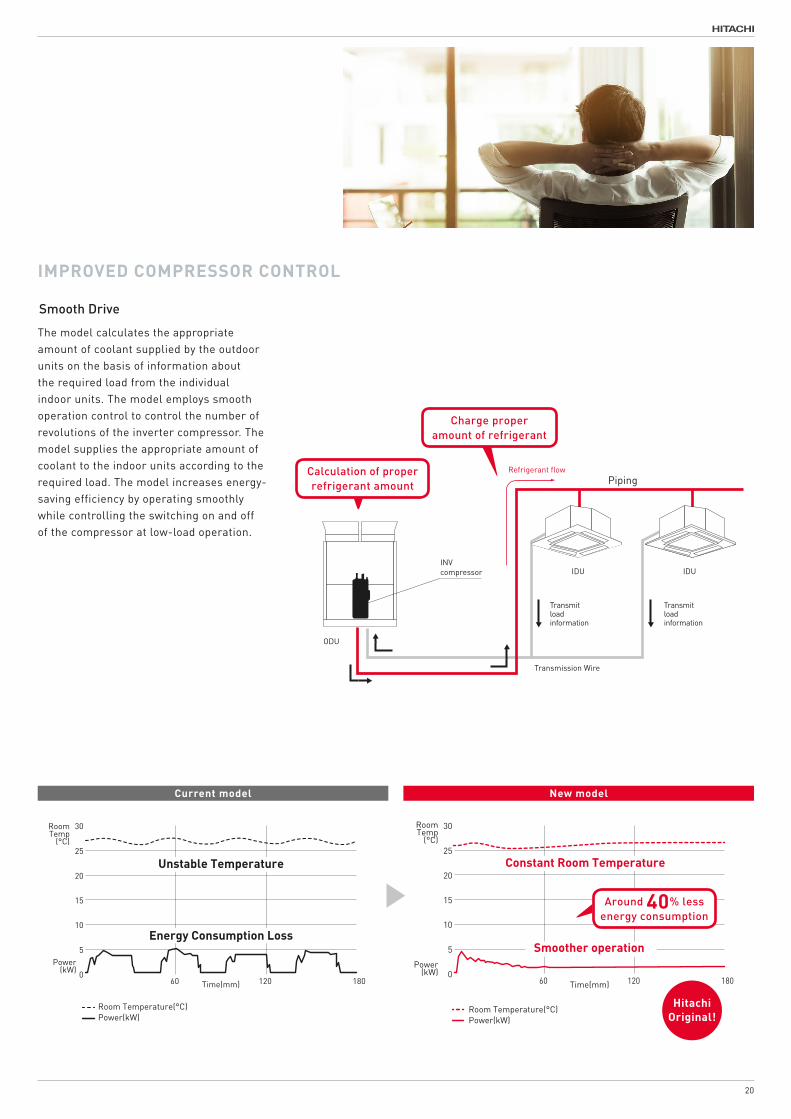
IDU
ODU
Refrigerant flow
IDU
Transmission Wire
Piping
INVcompressor
Transmitloadinformation
Transmitloadinformation
060 120 180Time(mm)
Power(kW)
RoomTemp
(°C)
5
10
15
20
25
30
Room Temperature(°C)Power(kW)
Unstable Temperature
Energy Consumption Loss
060 120 180Time(mm)
5
10
15
20
25
30
Power(kW)
RoomTemp
(°C)
Room Temperature(°C)Power(kW)
Constant Room Temperature
Smoother operation
The model calculates the appropriate amount of coolant supplied by the outdoor units on the basis of information about the required load from the individual indoor units. The model employs smooth operation control to control the number of revolutions of the inverter compressor. The model supplies the appropriate amount of coolant to the indoor units according to the required load. The model increases energy-saving efficiency by operating smoothly while controlling the switching on and off of the compressor at low-load operation.
IMPROVED COMPRESSOR CONTROL
Smooth Drive
Current model New model
HitachiOriginal!
Around 40% lessenergy consumption
20
Calculation of proper refrigerant amount
Charge proper amount of refrigerant
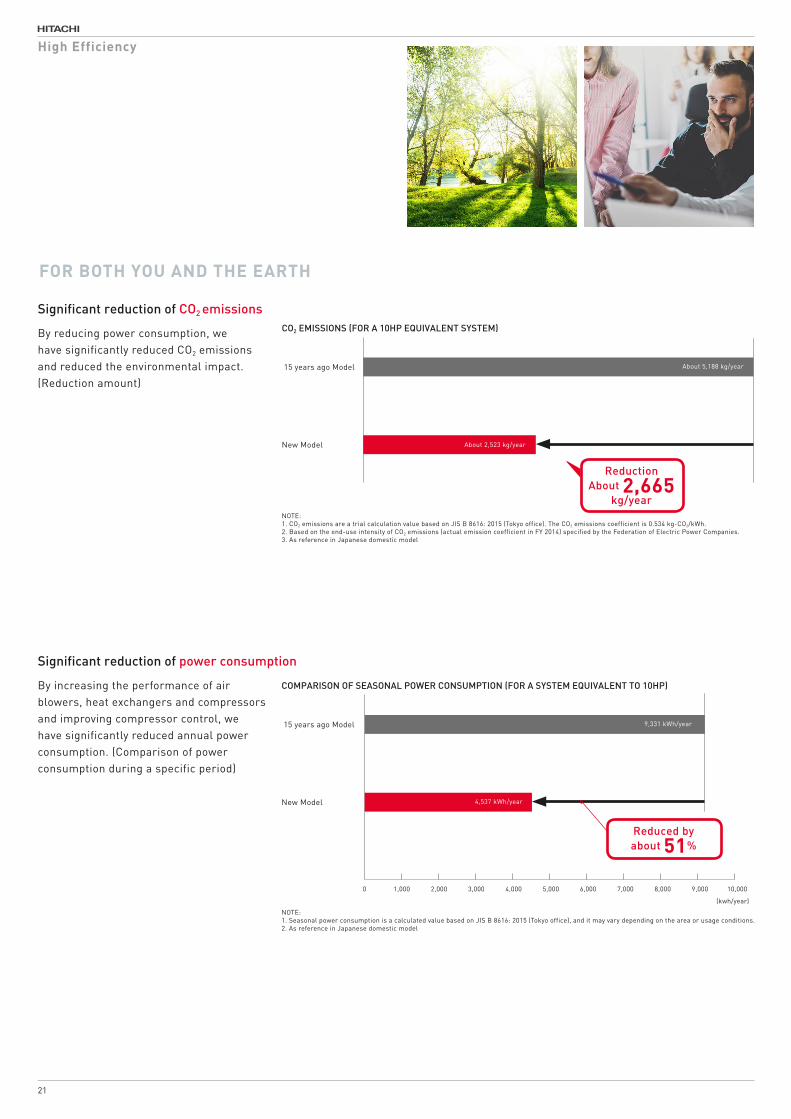
Significant reduction of CO2 emissions
Significant reduction of power consumption
By reducing power consumption, we have significantly reduced CO2 emissions and reduced the environmental impact. (Reduction amount)
By increasing the performance of air blowers, heat exchangers and compressors and improving compressor control, we have significantly reduced annual power consumption. (Comparison of power consumption during a specific period)
FOR BOTH YOU AND THE EARTH
NOTE:1. CO2 emissions are a trial calculation value based on JIS B 8616: 2015 (Tokyo office). The CO2 emissions coefficient is 0.534 kg-CO2/kWh.2. Based on the end-use intensity of CO2 emissions (actual emission coefficient in FY 2014) specified by the Federation of Electric Power Companies.3. As reference in Japanese domestic model
15 years ago Model
CO2 EMISSIONS (FOR A 10HP EQUIVALENT SYSTEM)
New Model
About 5,188 kg/year
About 2,523 kg/year
ReductionAbout 2,665
kg/year
NOTE:1. Seasonal power consumption is a calculated value based on JIS B 8616: 2015 (Tokyo office), and it may vary depending on the area or usage conditions.2. As reference in Japanese domestic model
15 years ago Model
COMPARISON OF SEASONAL POWER CONSUMPTION (FOR A SYSTEM EQUIVALENT TO 10HP)
New Model
(kwh/year)
4,537 kWh/year
9,331 kWh/year
Reduced byabout 51%
0 1,000 2,000 3,000 4,000 5,000 6,000 7,000 8,000 9,000 10,000
High Efficiency
21