Embed Size (px)
Citation preview

High beta cavity simulations and RF measurements
Alessandro D’Elia- Cockroft Institute and University of Manchester
1

HIE-ISOLDE upgrading stages
Stage 1 is shown at the top, while stage 2 can be split into two sub-stages depending on the physics priorities: the low energy cryomodules will allow the delivery of a beam with better emittance; the high energy cryomodule will enable the maximum energy to be reached
M. Pasini, D. Voulot, M. A. Fraser, R. M. Jones, ”BEAM DYNAMICS STUDIES FOR THE SCREX-ISOLDE LINAC AT CERN”, Linac 2008, Victoria, Canada
3MeV/u* 5.5MeV/u* 10MeV/u*
* A/q= 4.5
1.2MeV/u*
2

High beta cavity
3
784.5mm
300mm
Beam
Coupler and Pick up seats
Resonator (/4)

Tools “calibration”
In order to get reliable cavity parameters values from simulations, a comparison between the results coming from HFSS and CST Microwave has been performed using Superfish as a benchmark
4

Superfish vs CST Microwave and HFSS
5
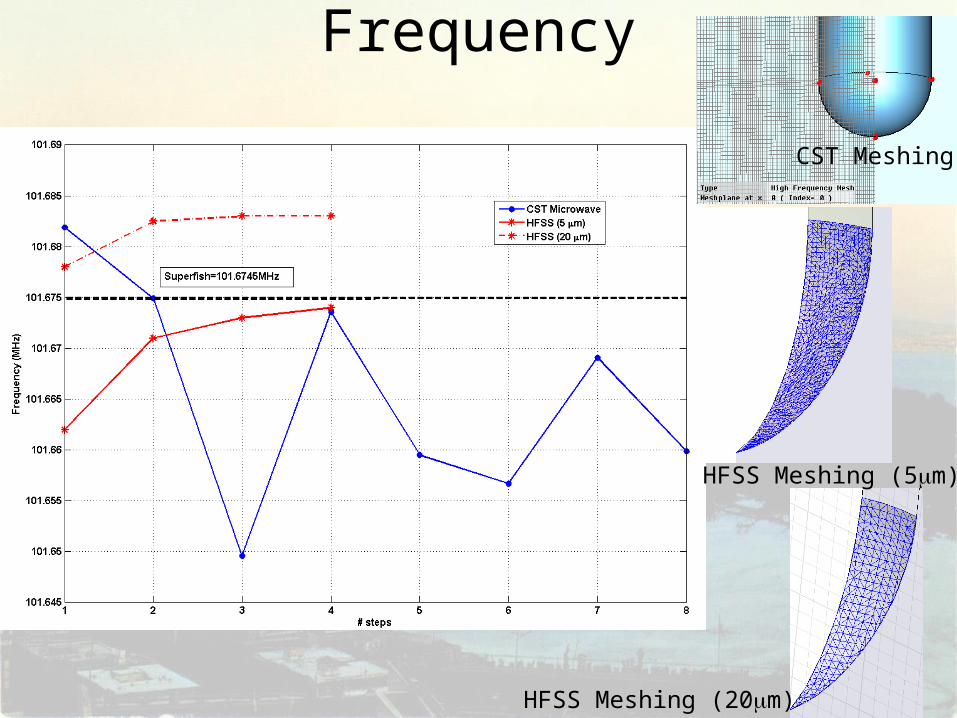
Frequency
6
HFSS Meshing (5m)
HFSS Meshing (20m)
CST Meshing

E field*
7
* All field values are normalized to give 1J stored energy in the cavity (CST Normalization)

H field*
8
* All field values are normalized to give 1J stored energy in the cavity (CST Normalization)

Comparison tables
9
Superfish CST HFSS ∆CST-SF (%) ∆HFSS-SF (%)
Frequency (MHz)
101.674 101.666 101.674
Hpeak
(kA/m)16.711 16.76 16.763 0.3 1.1
Epeak
(MV/m)11.38 11.5 11.6 1 1.9
Quality Factor
∆ (%)
Superfish 11795 -
CST 11844 0.4
HFSS 11746 -0.4

“Real” structure
10

Remarks
• Never being confident to post-processing results!!
• Even if HFSS and CST results are consistent and very close to Superfish, when we start to complicate our structure (tuner plate, coupler and pick-up), the possibility of having a finer refinement on surface meshing gets HFSS results more reliable
• The above statement are not general!!
11

Cavity Parameters
12
ISOLDE TRIUMF* SPIRAL 2**
Frequency [MHz] 101.28 141.4 88
(%) 10.3 11.2 12
Lnorm (mm) 30 18 41
Epeak/Eacc 5.4 4.9 4.9
Bpeak/Eacc[G/(MV/m)]
96 99 90
Rsh/Q0 [] 554 545 518
=Rs∙Q0 [] 30.34 25.6 37.5
* V. Zvyagintsev et al., “Development, Production And Tests Of Prototype Superconducting Cavities For
The High Beta Section Of The Isac-ii Heavy Ion Accelerator At Triumf”, RuPAC 2008, Zvenigorod, Russia
** G. Devanz, “SPIRAL2 resonators” talk held at SRF05

Q0 values
13
ISOLDE(Eacc=6MV/m)
Pcav (W) Rs (n) Q0=/Rs
5 33 109
7 46 6.6∙108
10 65 4.6∙108
12 79 3.9∙108
15 98 3.1∙108
** G. Olry et al., “Tests Results Of The Beta 0.12 Quarter Wave Resonators For The Spiral2 Superconducting Linac”, LINAC 2006, Knoxville, Tennessee USA
* V. Zvyagintsev et al., “Development, Production And Tests Of Prototype Superconducting Cavities For
The High Beta Section Of The Isac-ii Heavy Ion Accelerator At Triumf”, RuPAC 2008, Zvenigorod, Russia
TRIUMF*: Q0=7∙108 with Pcav=7W and Eacc=8.5MV/m
SPIRAL2**: Q0=109 with Pcav=10W and Eacc=6.5MV/m

Some word about the hot frequency
The cold frequency has to be 101.28MHz
In air: -32kHz
101.248MHz
In superconducting mode of operation (shortening of the length of the antenna,…): -332kHz
100.916MHz
Other contributions (chemistry,…): ????
~ 100.900MHz
skin depth variation: -11kHz
100.905MHz
14

Study of RF tuning plate
15

Frequency with tuner plateTipgap 70mm Tipgap 90mm
Tuner plate position +5mm 100.684 MHz 101.235 MHz
∆ Tipgap 27.55kHz/mm
Tuner plate position -15mm 100.929 MHz 101.339 MHz
∆ Tipgap 20.5kHz/mm
∆ Tuner plate 12.25kHz/mmTotal Coarse
range=245kHz
5.2kHz/mm
Pick up length=-1mm, coupler length=5mm
Triumf tuner coarse range 32kHz16

Measurements vs Simulations25/03/2009
Tipgap 90Without tuner plate
Tipgap 75Without tuner plate
Tipgap 70Without tuner plate
Simulation Measurements* Simulation Measurements* Simulation Measurements*
Long coupler and pick-up
101.233 MHz(- 32kHz air)101.201 MHz
101.246 MHz**(-77kHz Res) *101.169 MHz
101.013 MHz(- 32kHz air)100.981 MHz
101.000 MHz(-77kHz Res) *100.923 MHz
100. 899 MHz(- 32kHz air)100.867 MHz
100.916 MHz(-77kHz Res) *100.839 MHz
Short coupler and pick-up
101.410 MHz(- 32kHz air)101.378 MHz
101.483 MHz(-77kHz Res) *101.406 MHz
101.191 MHz(- 32kHz air)100.159 MHz
101.240 MHz(-77kHz Res) *101.163 MHz
101.083 MHz(- 32kHz air)101.051 MHz
101.150 MHz(-77kHz Res) *101.073 MHz
* Resonator longer of 0.4mm with respect to the nominal length (135kHz/mm)
** These new measurements have been done in a much noisy environment that explain the 13kHz of difference with respect to the previous ones
17

Expected final hot frequency
Measured frequency 101.150 MHz
∆ plate-tuner (pos-15) - 130 kHz
∆ tuner central position (-5) - 122.5 kHz
Expected frequency = 100.897 MHz(goal f~100.900 MHz)
18

External Q
Let us assume Q0=5x10⁸ and a condition of perfect coupling (c=1)
Therefore we want
• Qext of RF coupler of 2.5x10⁶ in order to be undercoupled (c=200 ∆f 40Hz) (larger bandwidth)
• Qext Pick-up of 1010 in order to be overcoupled (negligible power flowing from the pick-up) 19
HzQ
ff
Qf
f
loadload
4.01 0
0
Qload=2.5x10⁸

Q measurements
• Hot measurements are important to test and calibrate the coupler and pick-up before going to cryostate
• Very difficult to get reliable measurements allowing for such a high Qext values
• Cold measurements are needed for the final characterization• It is not possible going through standard frequency domain measurements
as
• Two different strategies for hot and cold measurements
20
00
0
with 1
fff
fQ
Qf
fload
load

β measurements
21
RF Coupler Pick-up
Network Analyzer
Pc
PfPe
Pr
Pin
Pin = Pf-Pr = Pc+Pe
2
1
11
c
cfP
Dividing everything by Pe and rearraging, by considering that
puc
e
f
e
P
PS
P
P and212
2
2
2
21)1(
421
S
S
c
cpu
Note: the system is symmetric so that I can feed from the pick-up and meauring c

Qext hot measurements1) Measuring SWR from S11
2) Measuring S21 pu
3) Measuring Qload
4) Evaluating Qext
22
c S21 pu Qload Q0 Qpu Qc
1.019 - - 5636 11380 - 11168
1.73 2.21∙10-1 0.055709 3902 10870 1.95∙105 6283
1.84 1.67∙10-2 0.000306 3944.5 11204 3.66∙107 6089
1.84 3.52∙10-5 1.36∙10-9 3944.5 11202 8.24∙1012 6088
1.0157 1.75∙10-2 0.000307 5643 11376 3.70∙107 11200
0.9574 2.31∙10-1 0.056495 5504 11085 1.96∙105 11578
1 if1
1 if
c
c
c
SWR
SWR
pucloadQQ 10
extQ
Q0
Legend
W/o pick-up
Lpu_in=22mm
Lpu_in=-1mm
Max Error= 3.6%

Q cold measurements
f
fQ
0
0 as Q0109 ∆f0.1Hz
Lt Q
UP
dt
dU 0 LQ
t
eUtU0
0)(
0
LL
Q
By feeding the cavity by a rectangular pulse
pucpuccavt
L QU
P
U
P
U
P
U
P
Q
1
11
00000
Knowing c, we get Q0
By switching off I can measure
fc
cr PP
2
1
1
c
23
We can use for c value the one we got from the hot measurements or we can feed the cavity by a rectangular pulse, in the steady-state

Coupler
24• -10mm Linsertion 60mm 7500 < Qext < 5∙109
Macor
• Dust free sliding mechanism

Coupler
25

Internal Reflections

Conclusions
• E-m design of the high beta cavity is finished
• The machining of the copper part is finished
• Measurements show a very good agreement with simulations
• First prototype of the tuner already available, sputtering on the end of June
• Mechanical design and fabrication of the coupler is started, deliviring date, end of July
• Starting the design of the low beta cavities27

Reviewer comments
28
The cavity parameter list represents a challenging but attainable specification and would represent the state of the art in sputtered heavy ion linac performance
CERN has applied for EuCARD to develop quarter wave sputtering using a magnetron or other techniques and this R+D would benefit HIE-Isolde but also the world community as new material searches are ongoing to improve cavity performance while reducing production costs.
A study of the power dissipation in the RF coupler at different coupling factors is needed in order to define the heat deposited to the Helium space
The tuning sensitivity of the bottom tuning plate at 13kHz/mm should be adequate to meet the coarse tuning range required in the cavity. However it may be preferable to reduce this sensitivity somewhat to allow a reduced specification on the tuner resolution since in this case a tuner position change of only 1 micron corresponds to more than the expected full cavity bandwidth. A factor of two reduction would help. This would also reduce the rf currents on the tuning plate where thermal conduction may be limited due to a marginal pressed contact