Embed Size (px)
Citation preview
EXAMPLE
Hierarchical ModelingHierarchical ModelingLinking to Science-Support ModelsLinking to Science-Support Models
Groundwater Modeling SystemRT3D and MT3DMS
EXAMPLE
Hierarchical ModelingHierarchical ModelingLinking to Science-Support ModelsLinking to Science-Support Models
Groundwater Modeling SystemRT3D and MT3DMS
FRAMES-2.0 Workshop
U.S. Nuclear Regulatory Commission
Bethesda, Maryland
November 15-16, 2007
Pacific Northwest National Laboratory
Richland, Washington
2
PurposePurposePurposePurpose
Demonstrate Hierarchical Modeling by Linking to Science-Support Models
Perform a 3-D Numerical RT3D Groundwater Simulation
Perform a Semi-analytical Groundwater Simulation

3
FRAMES and GMSFRAMES and GMSFRAMES and GMSFRAMES and GMS
GMS is the most sophisticated/comprehensive groundwater modeling package, containing numerous numerical models and support features ONLY GROUNDWATER
FRAMES seamlessly links user-defined disparate models, databases, and modeling systems to transfer data
4
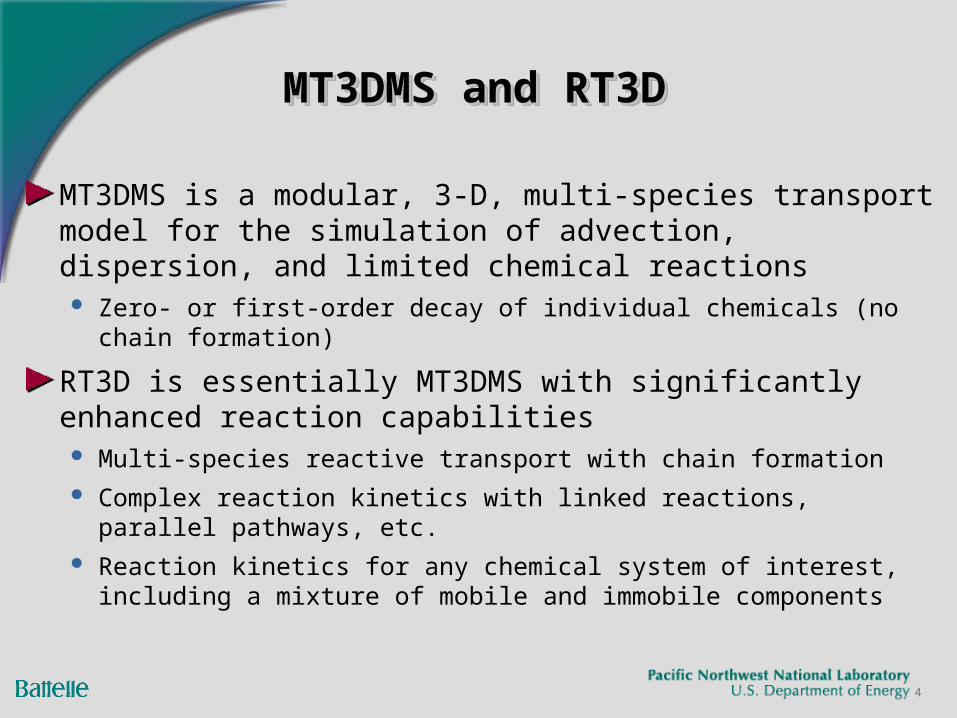
MT3DMS and RT3DMT3DMS and RT3DMT3DMS and RT3DMT3DMS and RT3D
MT3DMS is a modular, 3-D, multi-species transport model for the simulation of advection, dispersion, and limited chemical reactions Zero- or first-order decay of individual chemicals (no chain formation)
RT3D is essentially MT3DMS with significantly enhanced reaction capabilities Multi-species reactive transport with chain formation Complex reaction kinetics with linked reactions, parallel pathways, etc. Reaction kinetics for any chemical system of interest, including a
mixture of mobile and immobile components
5
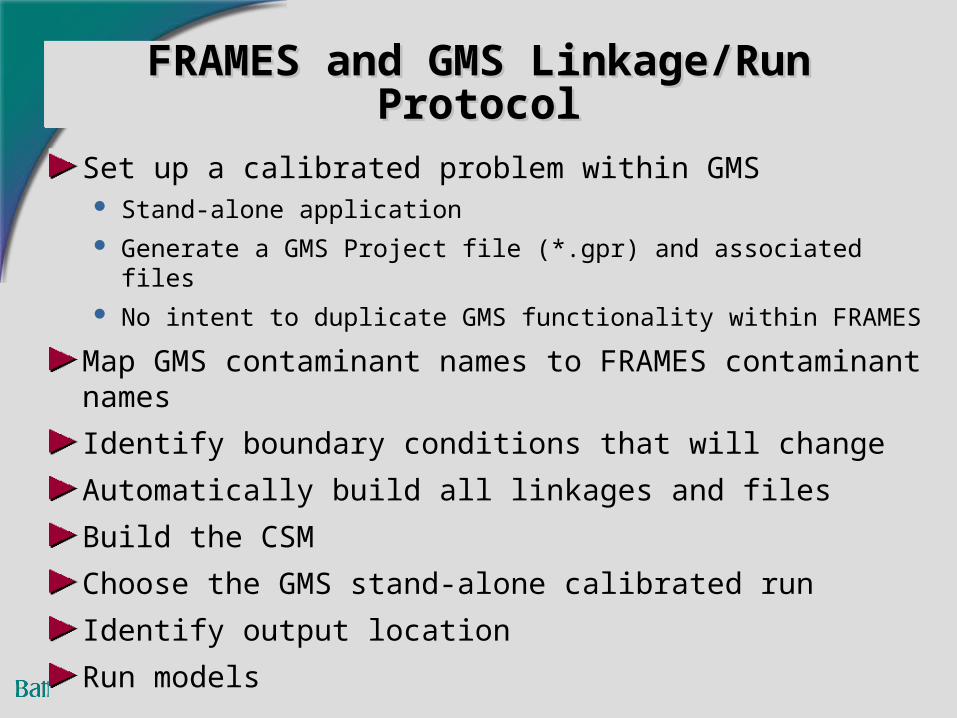
FRAMES and GMS Linkage/Run ProtocolFRAMES and GMS Linkage/Run ProtocolFRAMES and GMS Linkage/Run ProtocolFRAMES and GMS Linkage/Run Protocol
Set up a calibrated problem within GMS Stand-alone application Generate a GMS Project file (*.gpr) and associated files No intent to duplicate GMS functionality within FRAMES
Map GMS contaminant names to FRAMES contaminant names
Identify boundary conditions that will change
Automatically build all linkages and files
Build the CSM
Choose the GMS stand-alone calibrated run
Identify output location
Run models
6
Discussion TopicsDiscussion TopicsDiscussion TopicsDiscussion Topics
Example Application of Hierarchical Modeling RT3D Area Source Simulation Semi-analytical Groundwater Simulation
7
Example ApplicationExample Applicationof Hierarchical Modelingof Hierarchical Modeling
Example ApplicationExample Applicationof Hierarchical Modelingof Hierarchical Modeling
8
Example ApplicationExample Applicationof Hierarchical Modelingof Hierarchical Modeling
Example ApplicationExample Applicationof Hierarchical Modelingof Hierarchical Modeling
RT3D
Semi-analytical Model
Compare Semi-analytical and Numerical modeling results
9
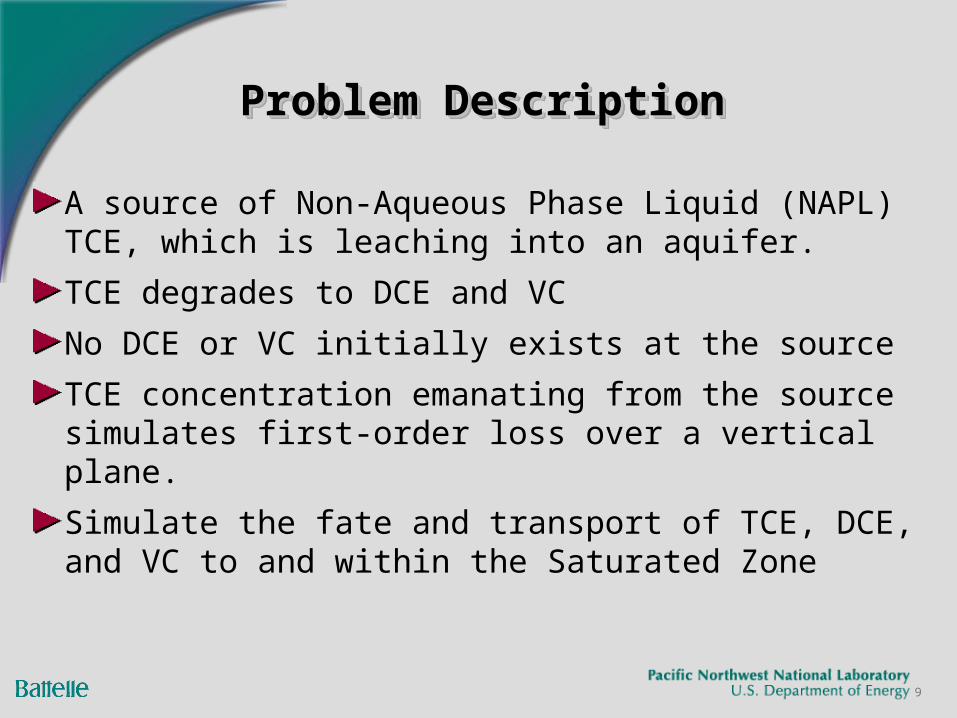
Problem DescriptionProblem DescriptionProblem DescriptionProblem Description
A source of Non-Aqueous Phase Liquid (NAPL) TCE, which is leaching into an aquifer.
TCE degrades to DCE and VC
No DCE or VC initially exists at the source
TCE concentration emanating from the source simulates first-order loss over a vertical plane.
Simulate the fate and transport of TCE, DCE, and VC to and within the Saturated Zone
10
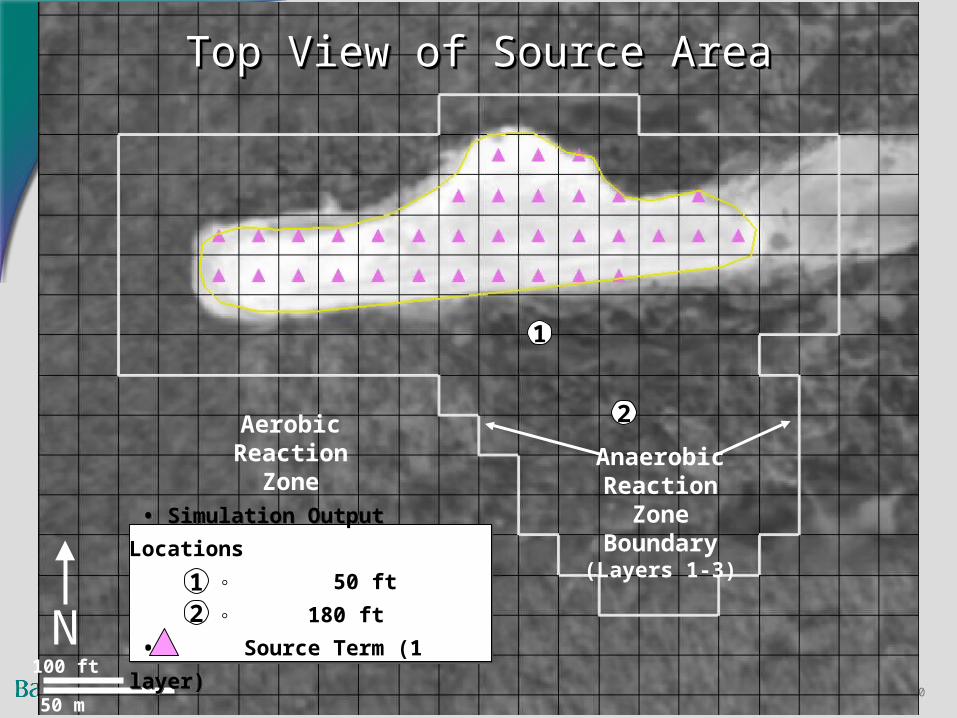
Top View of Source AreaTop View of Source AreaTop View of Source AreaTop View of Source Area
AnaerobicReaction
ZoneBoundary(Layers 1-3)
N100 ft
50 m
AerobicReaction
Zone
1
2
• Simulation Output Locations
◦ 50 ft
◦ 180 ft
• Source Term (1 layer)
• Simulation Output Locations
◦ 50 ft
◦ 180 ft
• Source Term (1 layer)
12
11
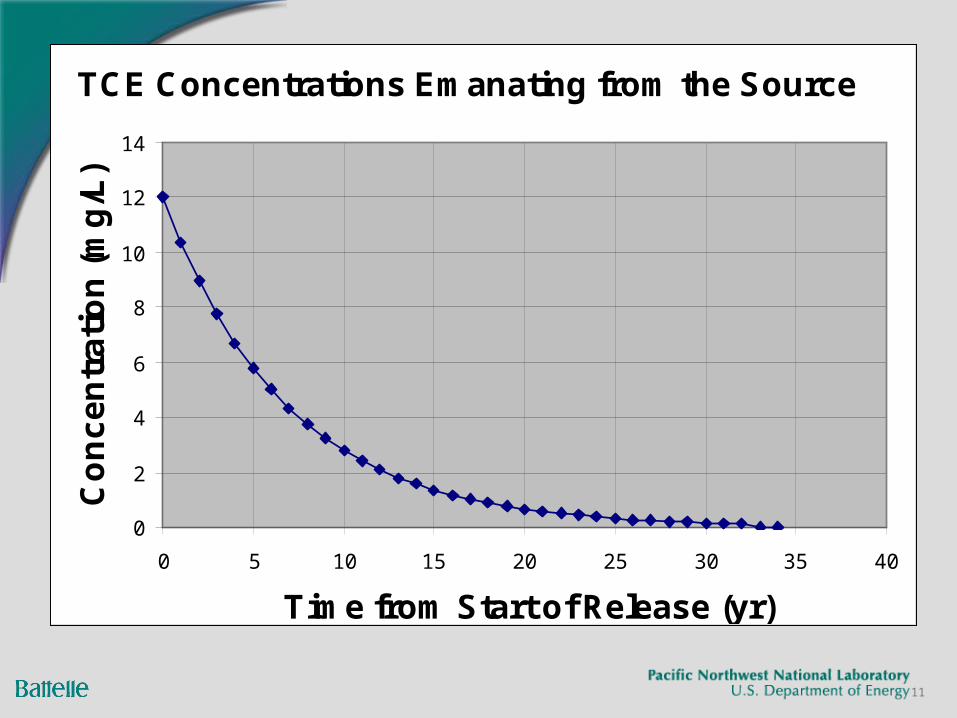
TCE Concentrations Emanating from the Source
0
2
4
6
8
10
12
14
0 5 10 15 20 25 30 35 40
Time from Start of Release (yr)
Co
nc
en
tra
tio
n (
mg
/L)
12
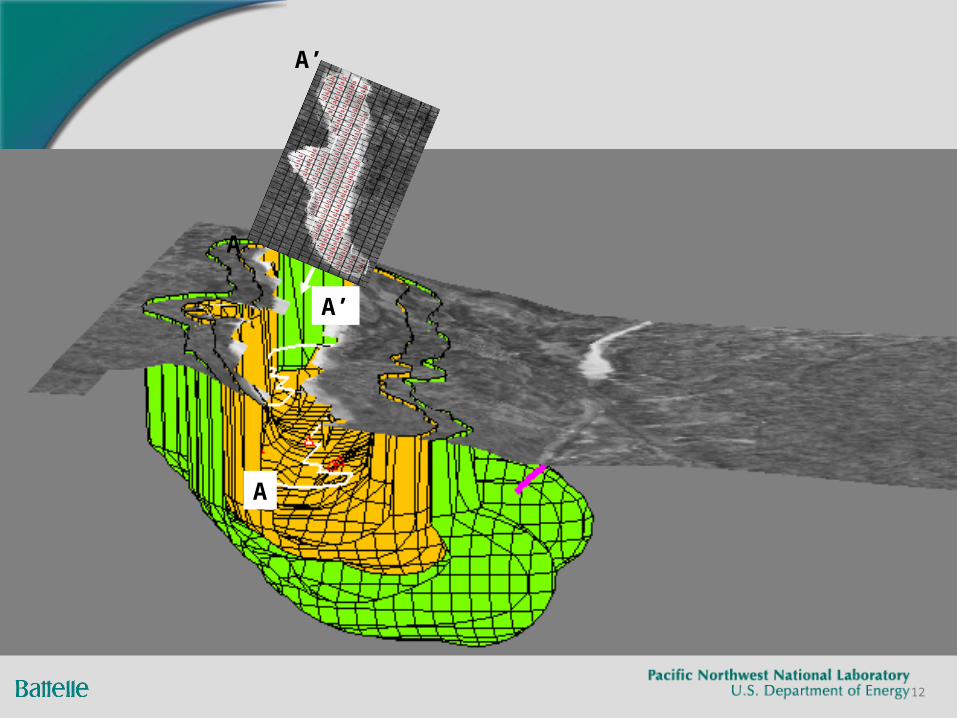
A
A’
A
A’
13
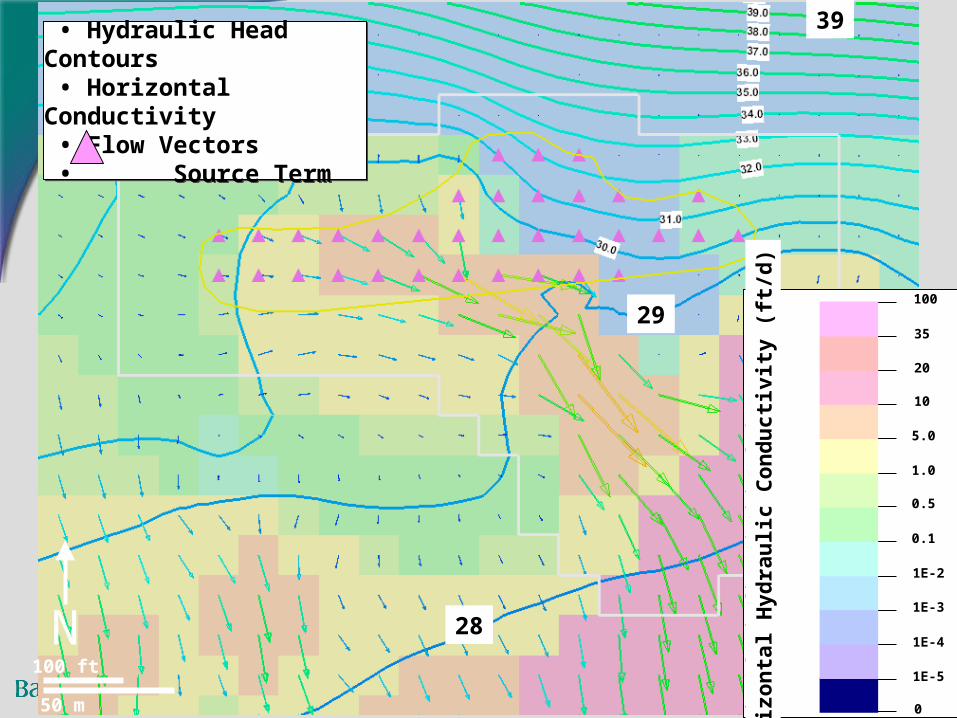
N100 ft
50 m
• Hydraulic Head Contours • Horizontal Conductivity • Flow Vectors • Source Term
• Hydraulic Head Contours • Horizontal Conductivity • Flow Vectors • Source Term
Ho
rizo
nta
l Hyd
rau
lic C
on
du
ctiv
ity
(ft/
day
)
100
35
20
10
5.0
1.0
0.5
0.1
1E-2
1E-3
1E-4
1E-5
0
Ho
rizo
nta
l Hyd
rau
lic C
on
du
ctiv
ity
(ft/
d)
28
29
39
14
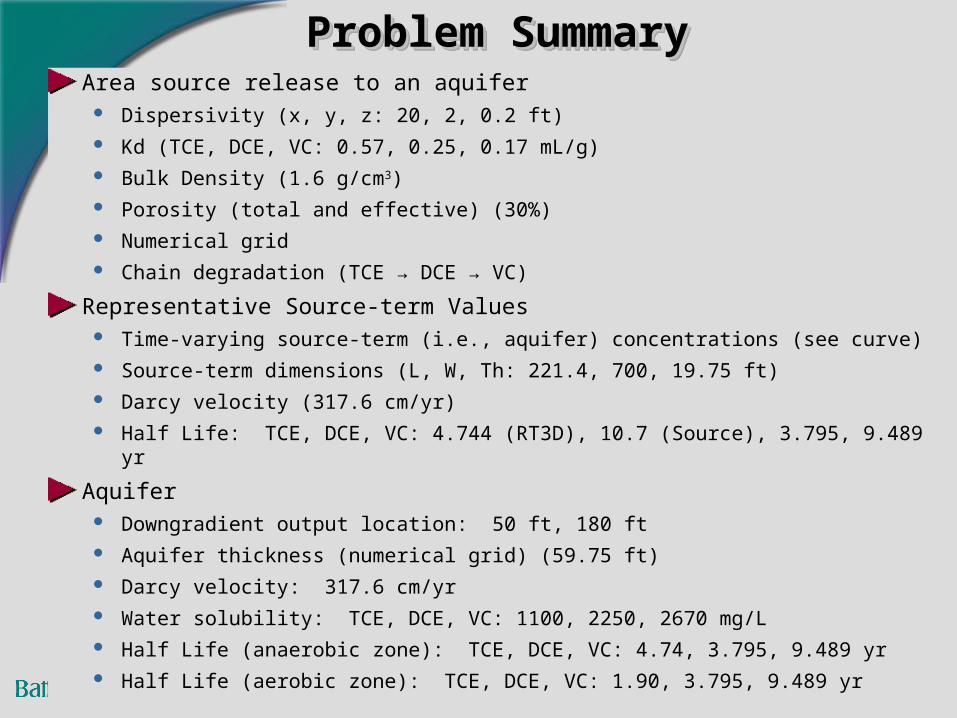
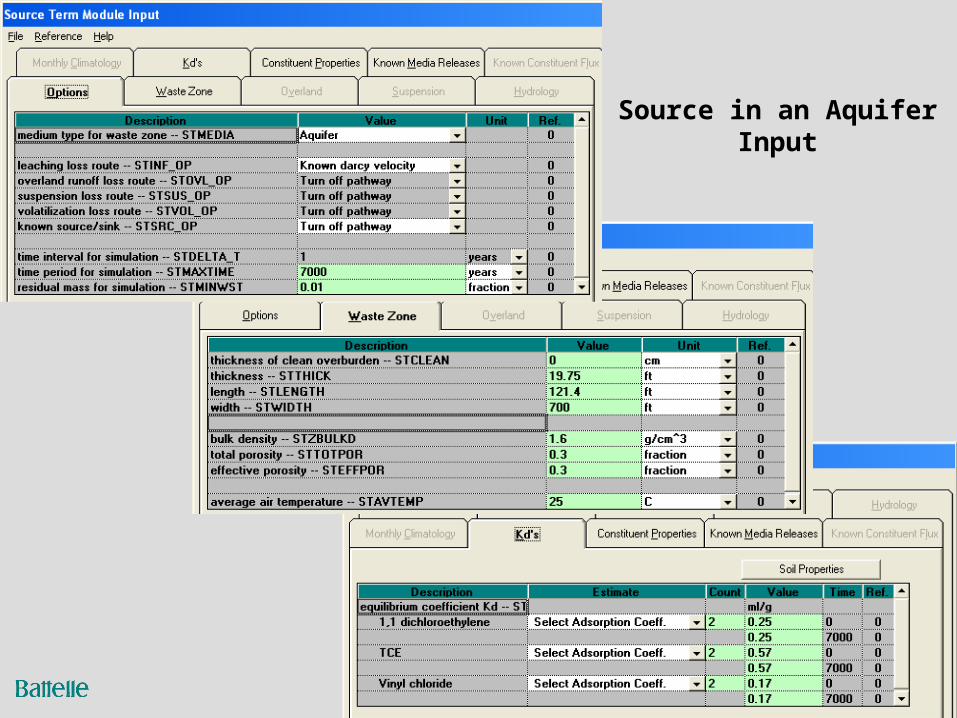
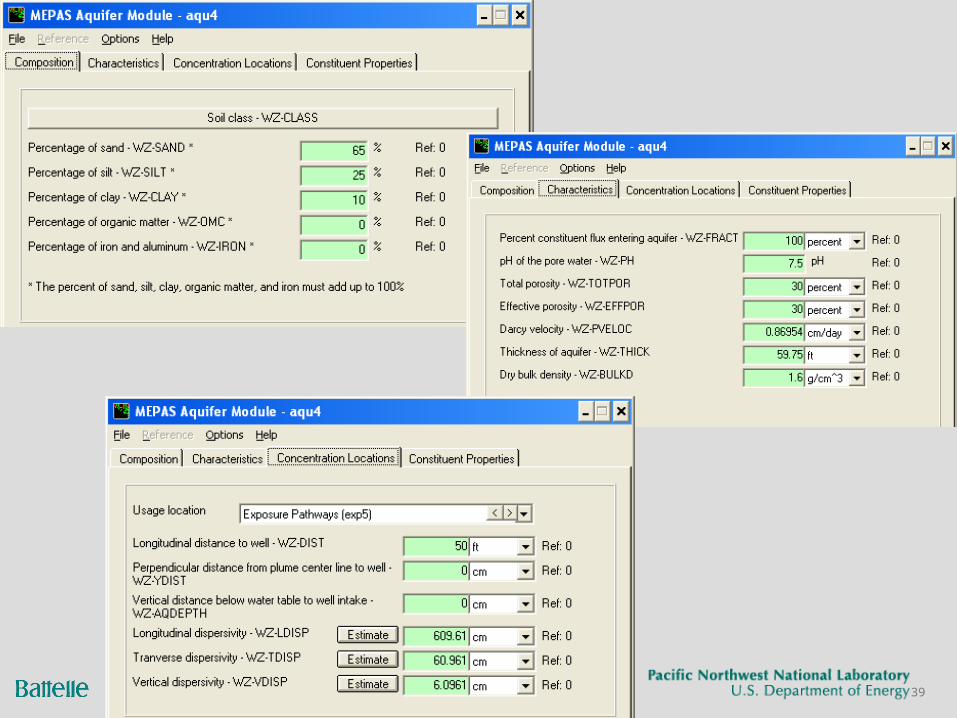
Problem SummaryProblem SummaryProblem SummaryProblem SummaryArea source release to an aquifer
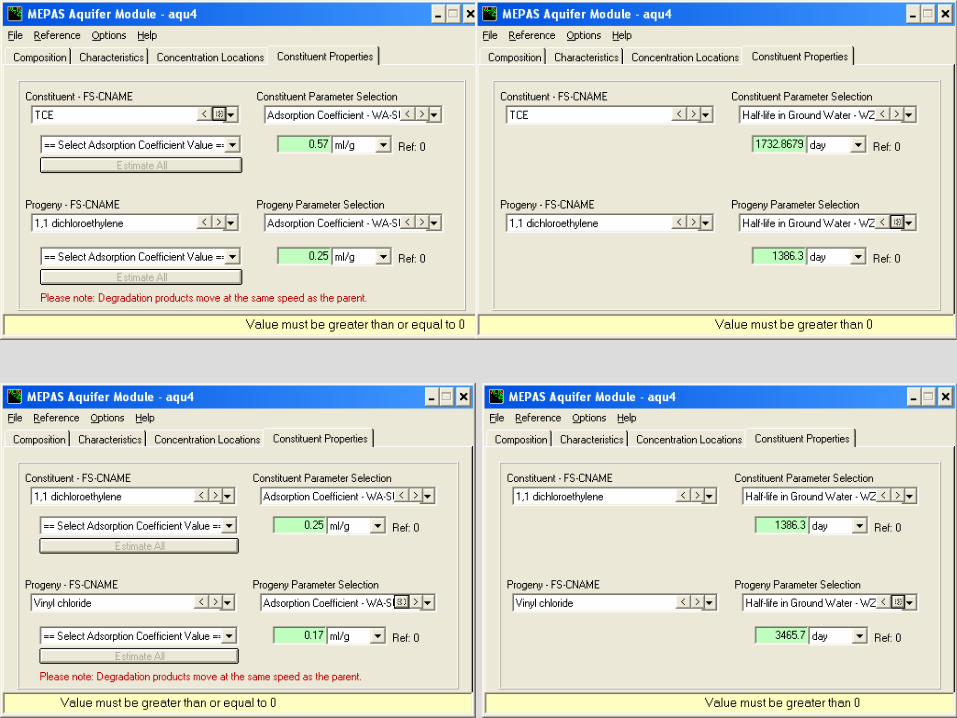
Dispersivity (x, y, z: 20, 2, 0.2 ft) Kd (TCE, DCE, VC: 0.57, 0.25, 0.17 mL/g) Bulk Density (1.6 g/cm3) Porosity (total and effective) (30%) Numerical grid Chain degradation (TCE → DCE → VC)
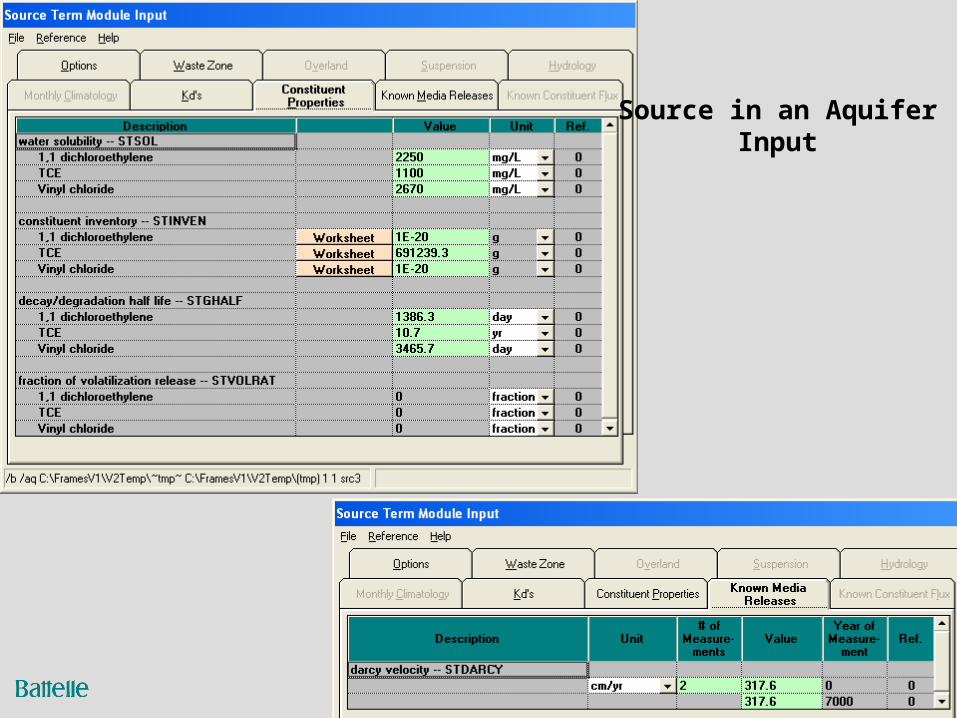
Representative Source-term Values Time-varying source-term (i.e., aquifer) concentrations (see curve) Source-term dimensions (L, W, Th: 221.4, 700, 19.75 ft) Darcy velocity (317.6 cm/yr) Half Life: TCE, DCE, VC: 4.744 (RT3D), 10.7 (Source), 3.795, 9.489 yr
Aquifer Downgradient output location: 50 ft, 180 ft Aquifer thickness (numerical grid) (59.75 ft) Darcy velocity: 317.6 cm/yr Water solubility: TCE, DCE, VC: 1100, 2250, 2670 mg/L Half Life (anaerobic zone): TCE, DCE, VC: 4.74, 3.795, 9.489 yr Half Life (aerobic zone): TCE, DCE, VC: 1.90, 3.795, 9.489 yr
15
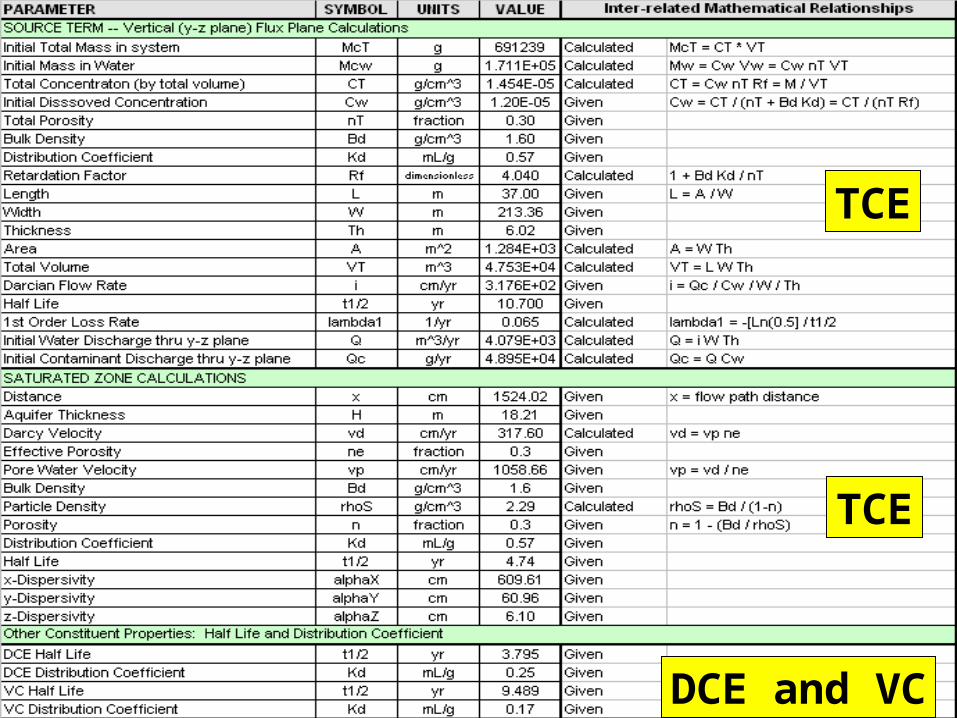
TCE
DCE and VC
TCE
16
RT3D ApplicationRT3D Application
17
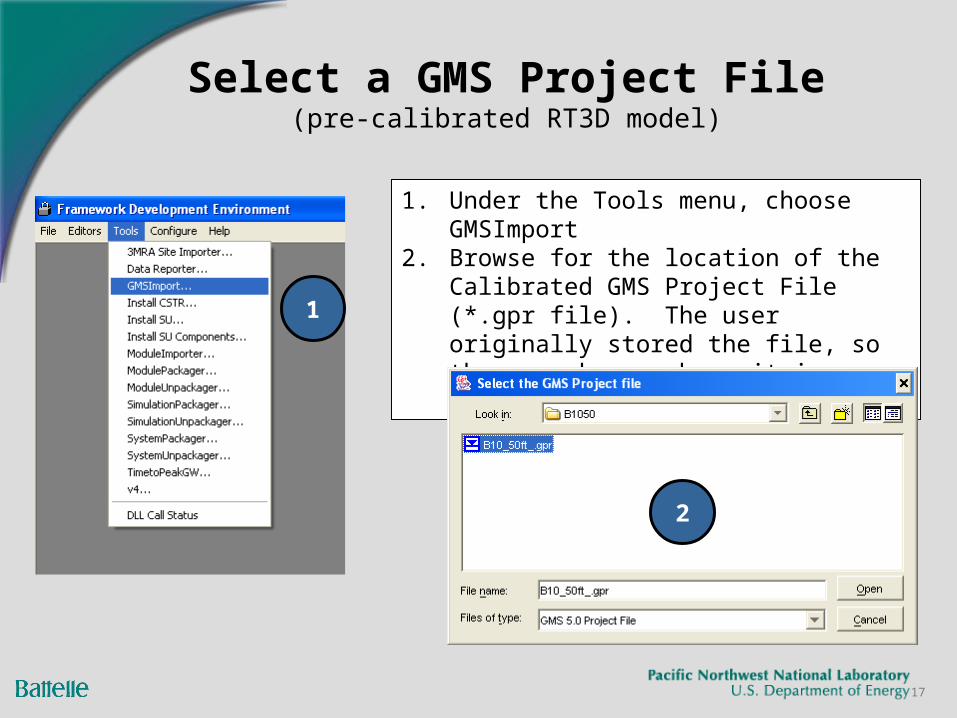
Select a GMS Project File(pre-calibrated RT3D model)
1. Under the Tools menu, choose GMSImport2. Browse for the location of the Calibrated
GMS Project File (*.gpr file). The user originally stored the file, so the user knows where it is located.1
2
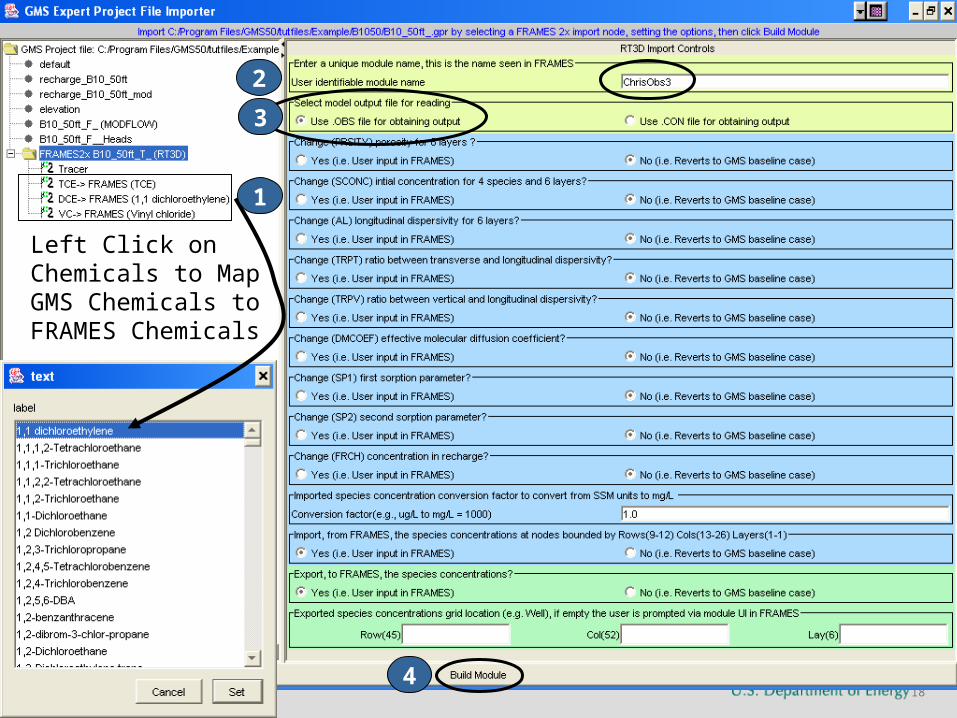
18
Left Click on Chemicals to Map GMS Chemicals to FRAMES Chemicals
2
1
3
4
19
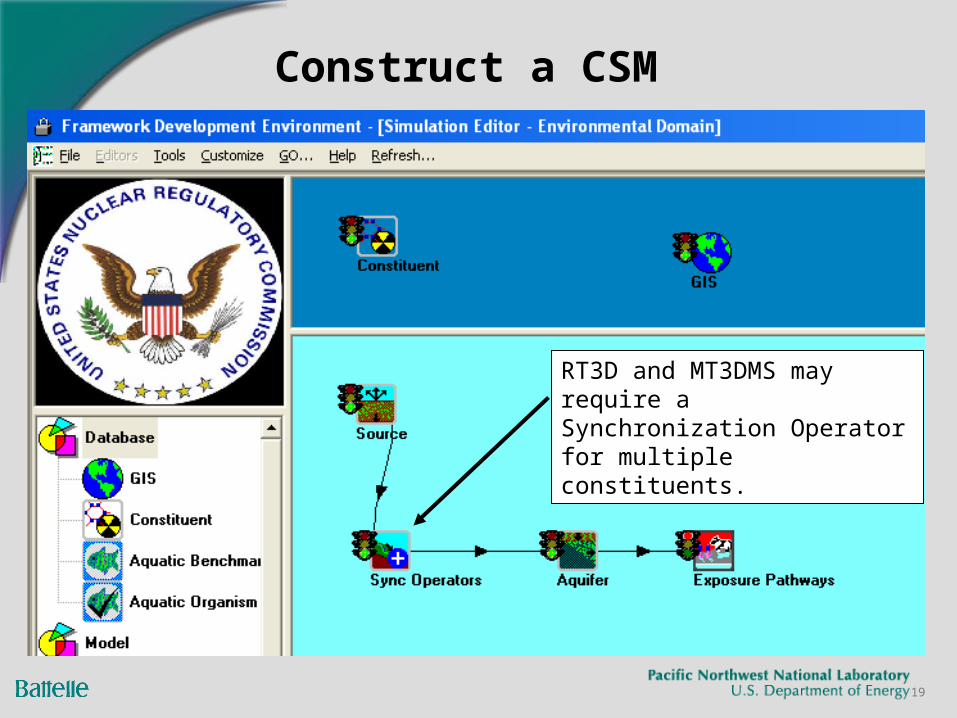
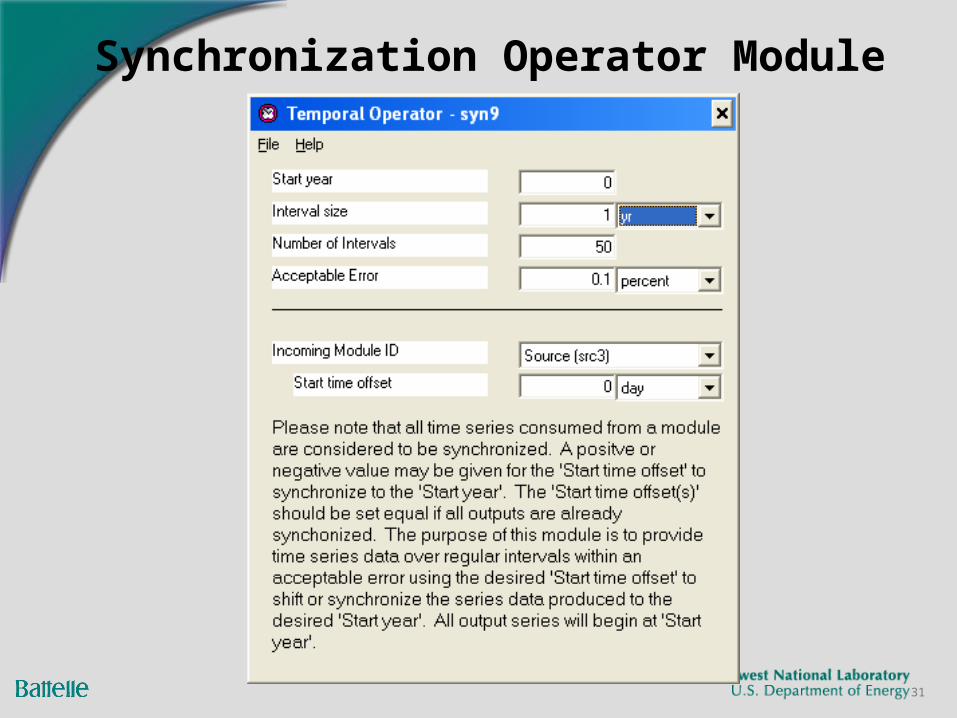
RT3D and MT3DMS may require a Synchronization Operator for multiple constituents.
Construct a CSM
20
Choose Modules
21
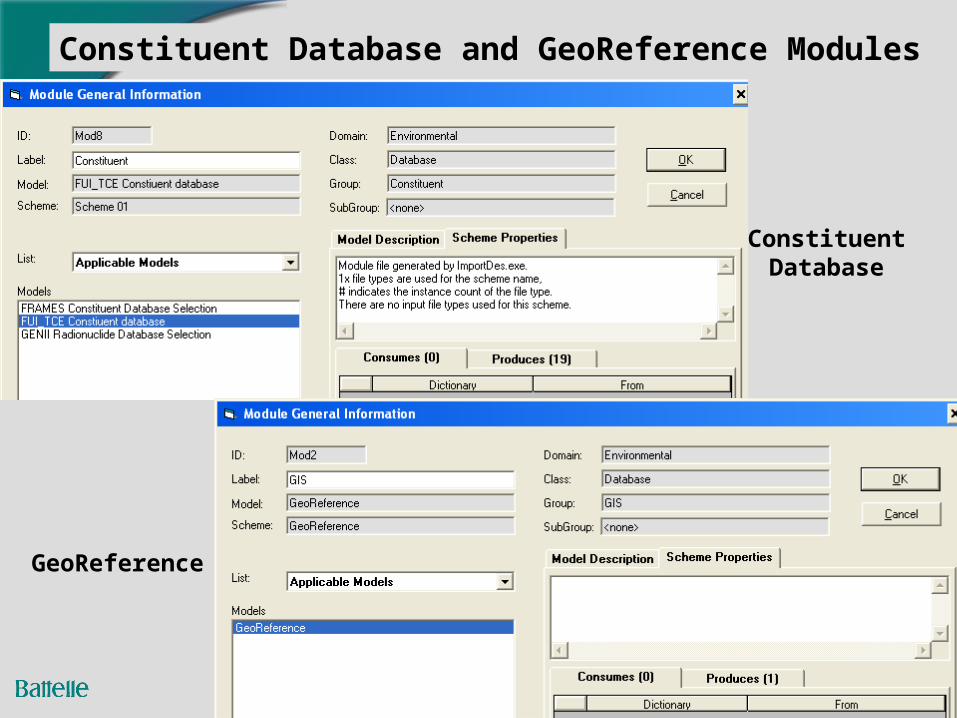
ConstituentDatabase
GeoReference
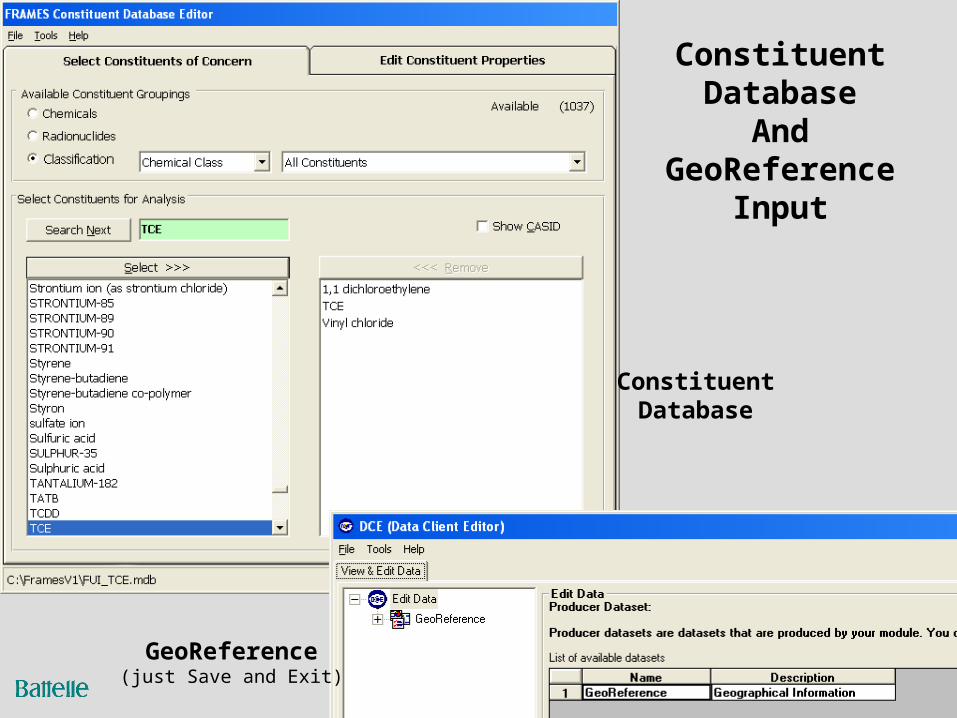
Constituent Database and GeoReference Modules
22
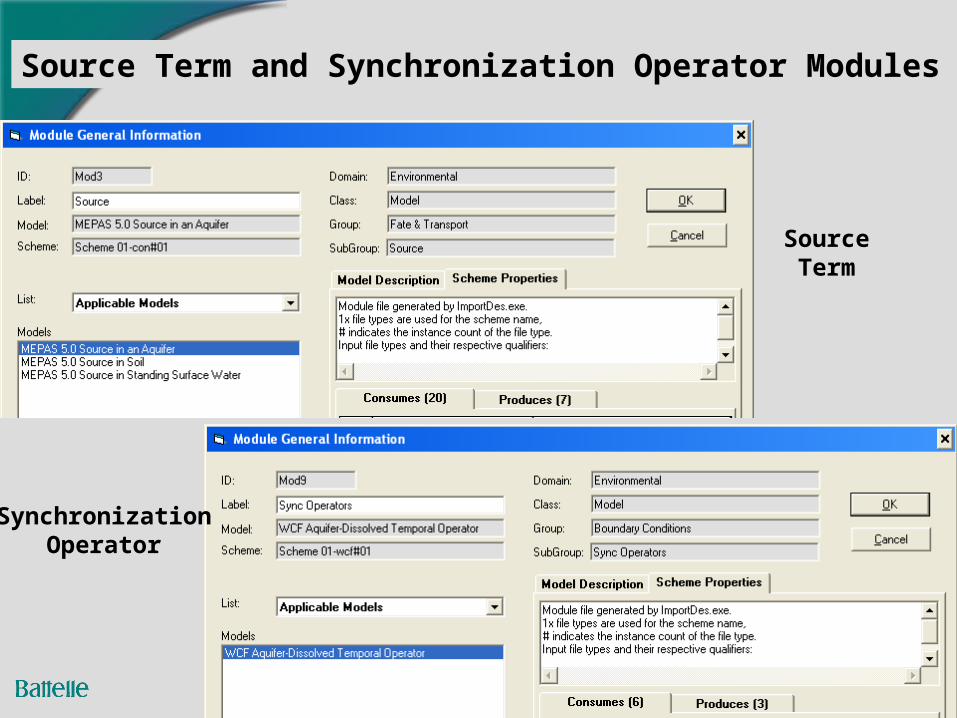
SourceTerm
SynchronizationOperator
Source Term and Synchronization Operator Modules
23
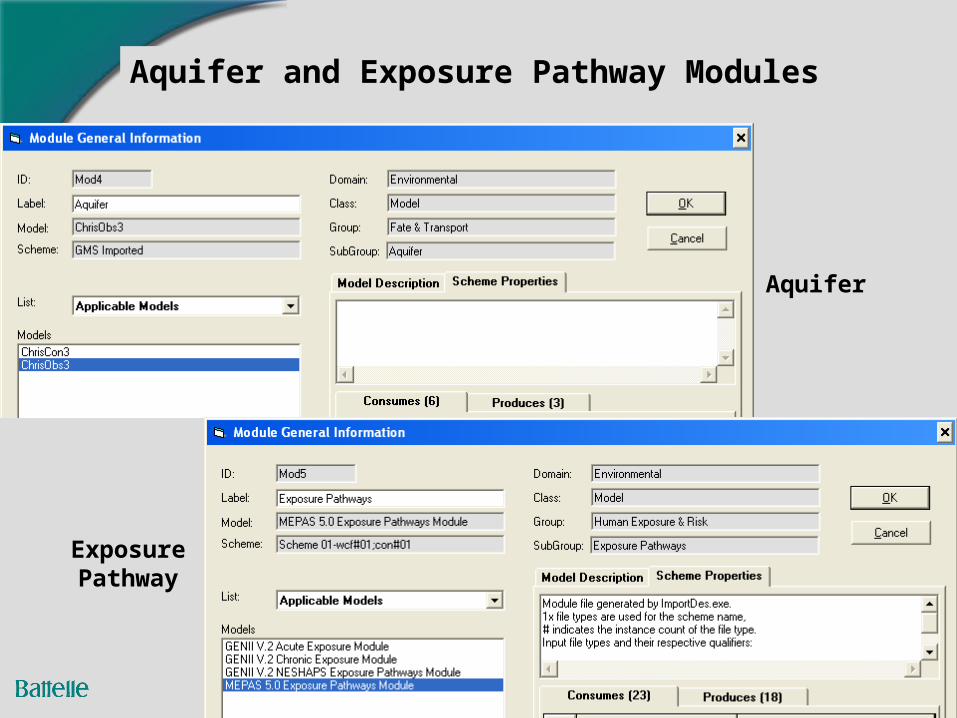
Aquifer
ExposurePathway
Aquifer and Exposure Pathway Modules
24
Input Data to Each Module
25
ConstituentDatabase
GeoReference(just Save and Exit)
ConstituentDatabase
AndGeoReference
Input
26
Source in an AquiferInput
27
Source in an AquiferInput
28
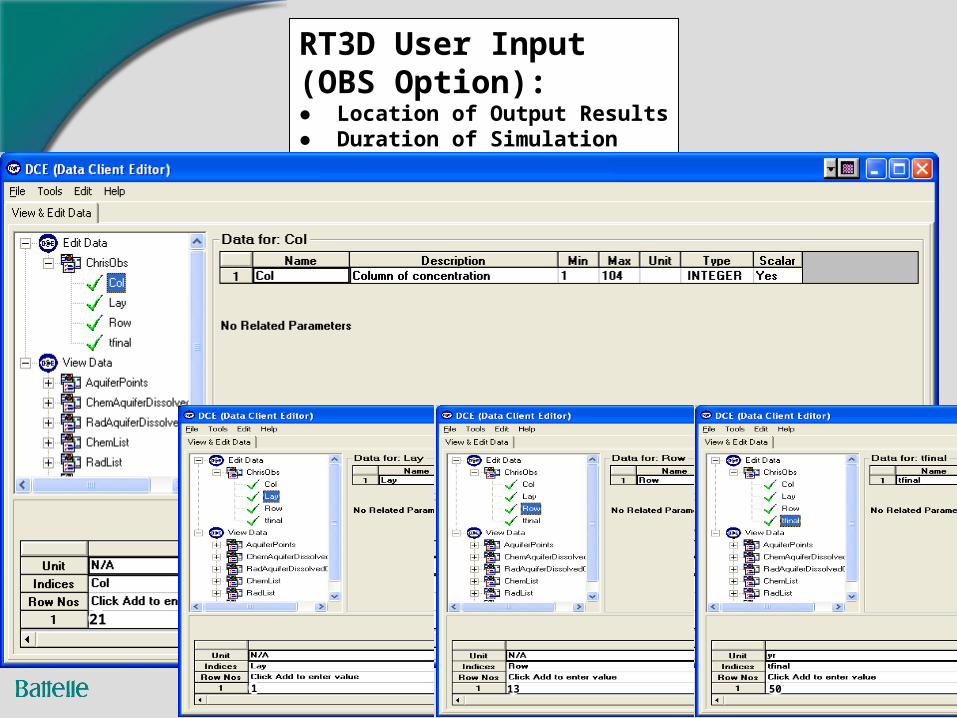
RT3D User Input(OBS Option):● Location of Output Results● Duration of Simulation
21
1 13 50
29
Run Each ModuleRun Each ModuleRun Each ModuleRun Each Module
Constituent DatabaseGeoReference ModuleSource TermSynchronization OperatorAquifer
30
VC Concentrations Emanating from the Source
0.0
0.5
1.0
1.5
2.0
2.5
0 20 40 60 80 100
Time from Start of Release (yr)
Co
nc
en
tra
tio
n (
mg
/L)
DCE Concentrations Emanating from the Source
0.0
0.5
1.0
1.5
2.0
2.5
3.0
0 20 40 60 80 100
Time from Start of Release (yr)
Co
nc
en
tra
tio
n (
mg
/L)
TCE Concentrations Emanating from the Source
0
2
4
6
8
10
12
14
0 5 10 15 20 25 30 35 40
Time from Start of Release (yr)
Co
nc
en
tra
tio
n (
mg
/L)
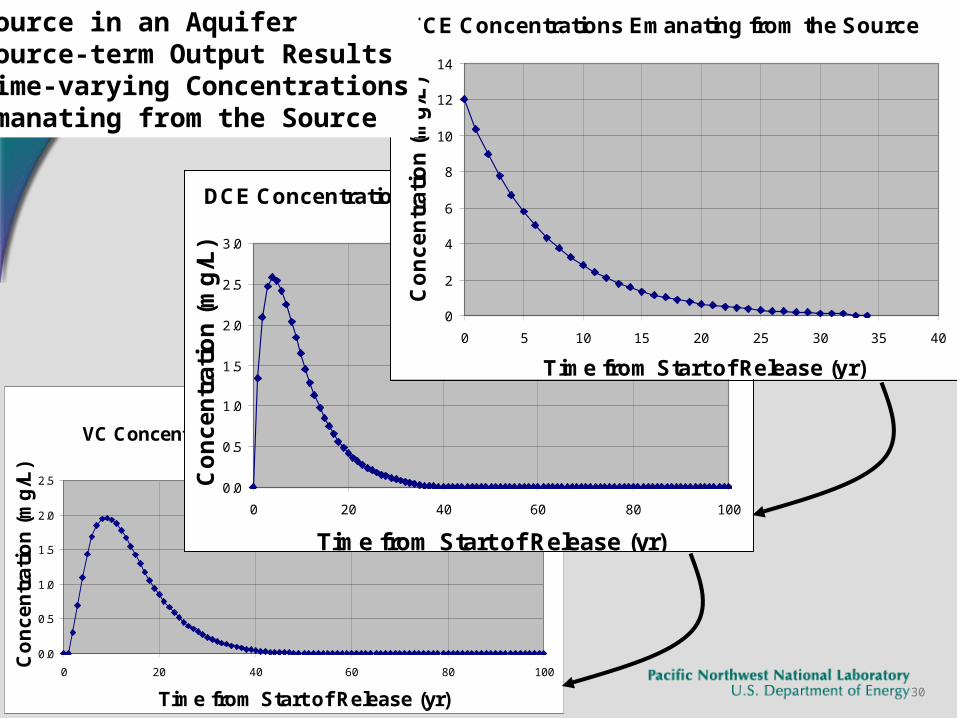
Source in an AquiferSource-term Output ResultsTime-varying ConcentrationsEmanating from the Source
31
Synchronization Operator Module
32
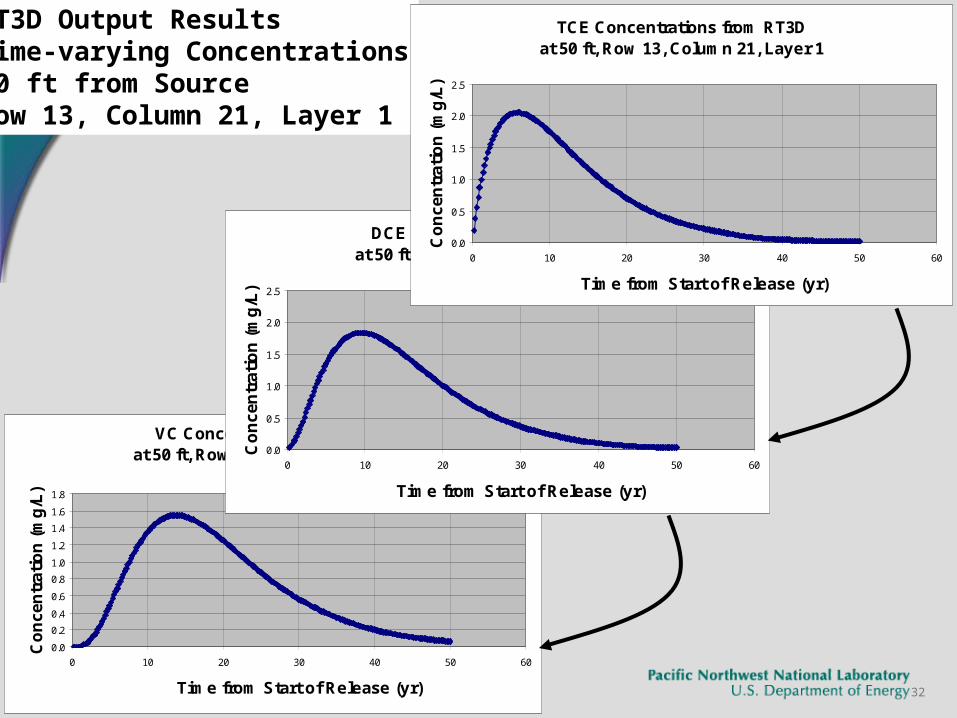
RT3D Output ResultsTime-varying Concentrations50 ft from SourceRow 13, Column 21, Layer 1
VC Concentrations from RT3Dat 50 ft, Row 13, Column 21, Layer 1
0.0
0.2
0.4
0.6
0.8
1.0
1.2
1.4
1.6
1.8
0 10 20 30 40 50 60
Time from Start of Release (yr)
Co
nce
ntr
ati
on
(m
g/L
)
DCE Concentrations from RT3Dat 50 ft, Row 13, Column 21, Layer 1
0.0
0.5
1.0
1.5
2.0
2.5
0 10 20 30 40 50 60
Time from Start of Release (yr)
Co
nce
ntr
atio
n (
mg
/L)
TCE Concentrations from RT3Dat 50 ft, Row 13, Column 21, Layer 1
0.0
0.5
1.0
1.5
2.0
2.5
0 10 20 30 40 50 60
Time from Start of Release (yr)
Co
nce
ntr
atio
n (
mg
/L)
33
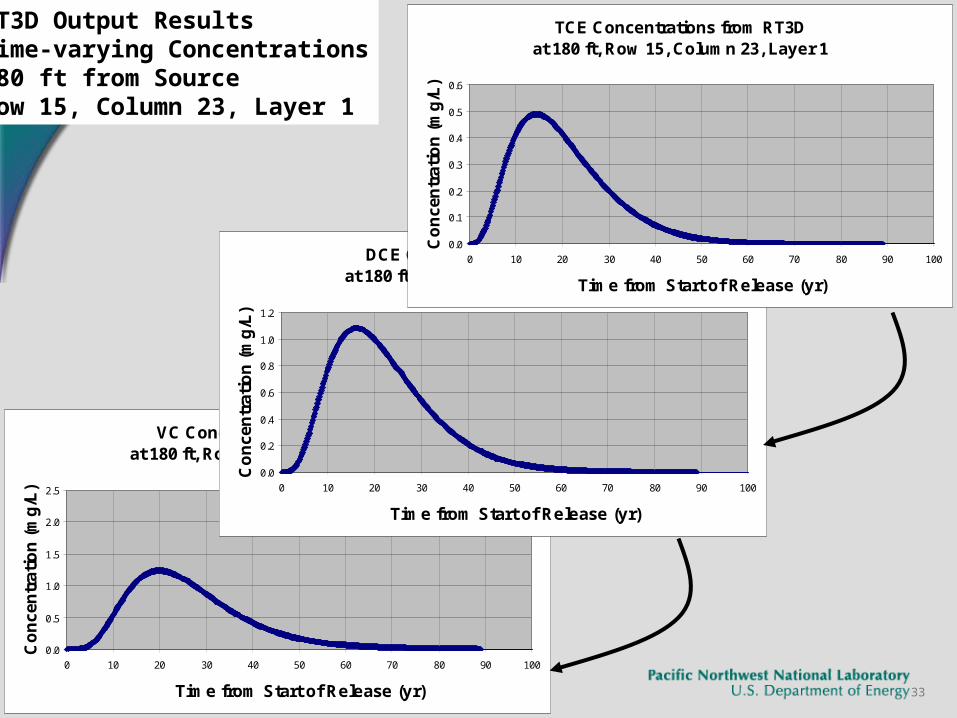
RT3D Output ResultsTime-varying Concentrations180 ft from SourceRow 15, Column 23, Layer 1
VC Concentrations from RT3Dat 180 ft, Row 15, Column 23, Layer 1
0.0
0.5
1.0
1.5
2.0
2.5
0 10 20 30 40 50 60 70 80 90 100
Time from Start of Release (yr)
Co
nce
ntr
atio
n (
mg
/L)
DCE Concentrations from RT3Dat 180 ft, Row 15, Column 23, Layer 1
0.0
0.2
0.4
0.6
0.8
1.0
1.2
0 10 20 30 40 50 60 70 80 90 100
Time from Start of Release (yr)
Co
nce
ntr
atio
n (
mg
/L)
TCE Concentrations from RT3Dat 180 ft, Row 15, Column 23, Layer 1
0.0
0.1
0.2
0.3
0.4
0.5
0.6
0 10 20 30 40 50 60 70 80 90 100
Time from Start of Release (yr)
Co
nce
ntr
atio
n (
mg
/L)
34
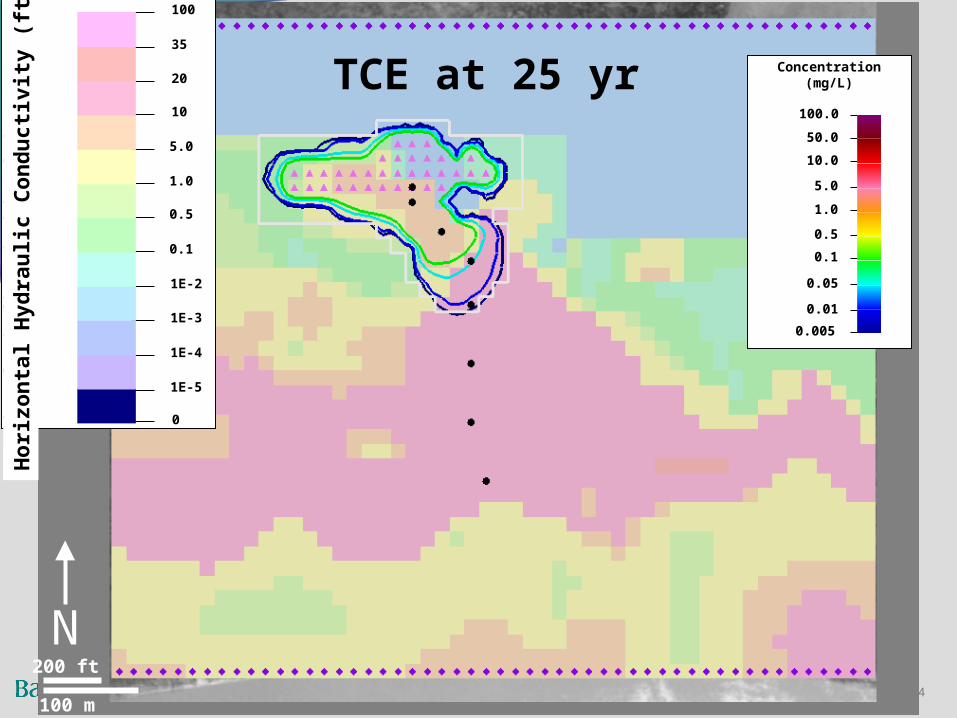
N200 ft
100 m
Concentration(mg/L)
50.0
0.005
1.0
0.1
0.05
10.0
5.0
0.01
0.5
100.0
TCE at 25 yr
Ho
rizo
nta
l Hyd
rau
lic C
on
du
ctiv
ity
(ft/
day
)100
35
20
10
5.0
1.0
0.5
0.1
1E-2
1E-3
1E-4
1E-5
0
Ho
rizo
nta
l Hyd
rau
lic C
on
du
ctiv
ity
(ft/
d)
35
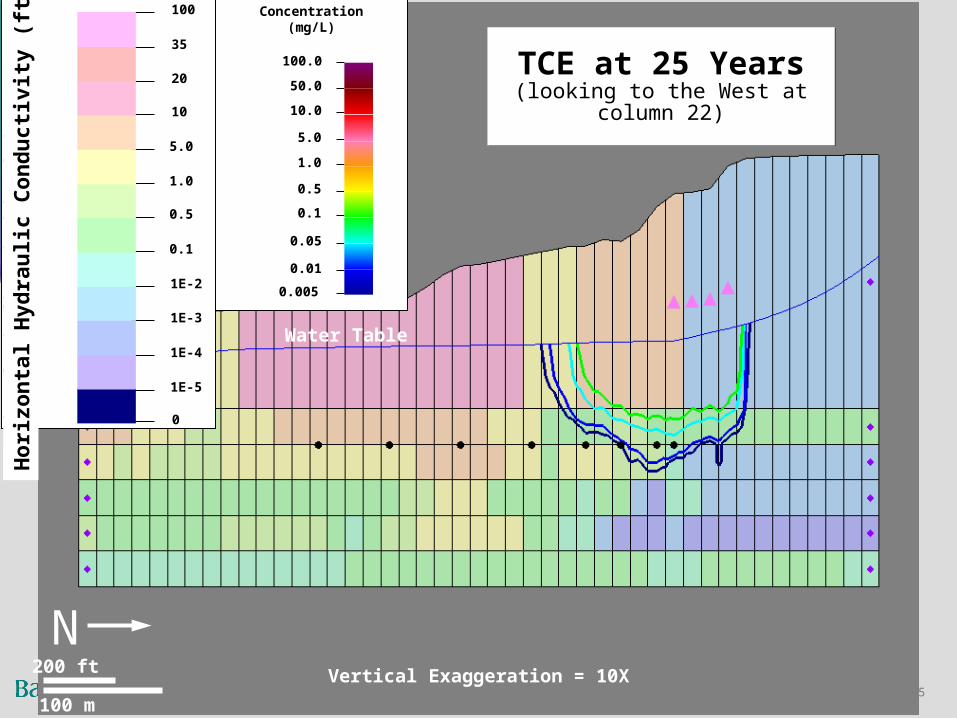
N200 ft
100 m
Concentration(mg/L)
50.0
0.005
1.0
0.1
0.05
10.0
5.0
0.01
0.5
100.0
Water Table
Vertical Exaggeration = 10X
TCE at 25 Years(looking to the West at column 22)
TCE at 25 Years(looking to the West at column 22)
Ho
rizo
nta
l Hyd
rau
lic C
on
du
ctiv
ity
(ft/
day
)100
35
20
10
5.0
1.0
0.5
0.1
1E-2
1E-3
1E-4
1E-5
0
Ho
rizo
nta
l Hyd
rau
lic C
on
du
ctiv
ity
(ft/
d)
36
Semi-analytical AquiferSemi-analytical AquiferModel ApplicationModel Application
37
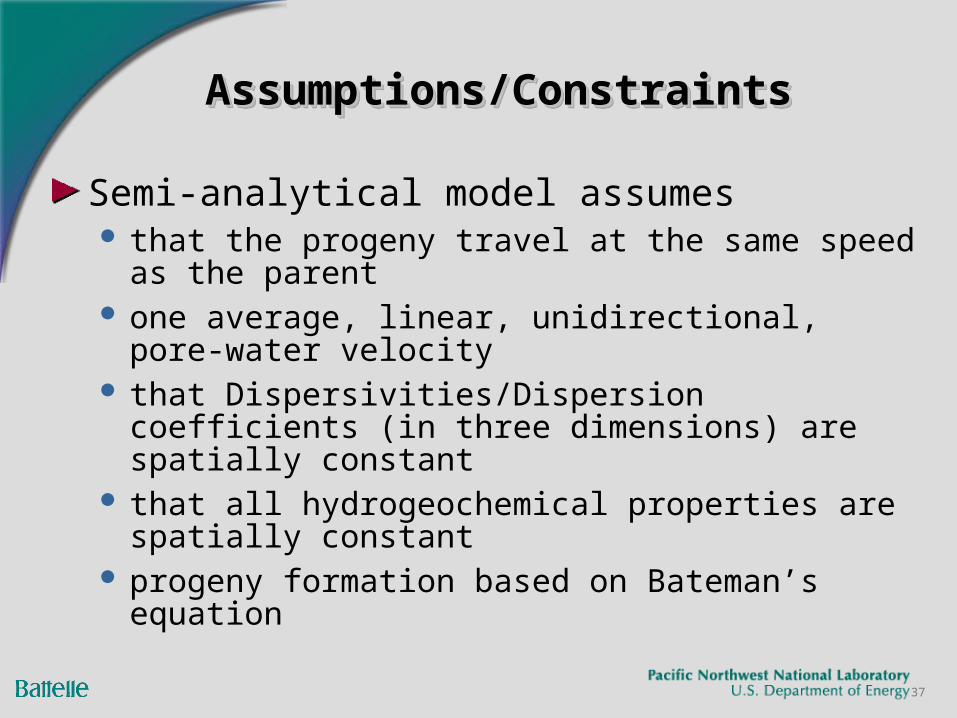
Assumptions/ConstraintsAssumptions/ConstraintsAssumptions/ConstraintsAssumptions/Constraints
Semi-analytical model assumes that the progeny travel at the same speed as the parent one average, linear, unidirectional, pore-water velocity that Dispersivities/Dispersion coefficients (in three
dimensions) are spatially constant that all hydrogeochemical properties are spatially
constant progeny formation based on Bateman’s equation
38
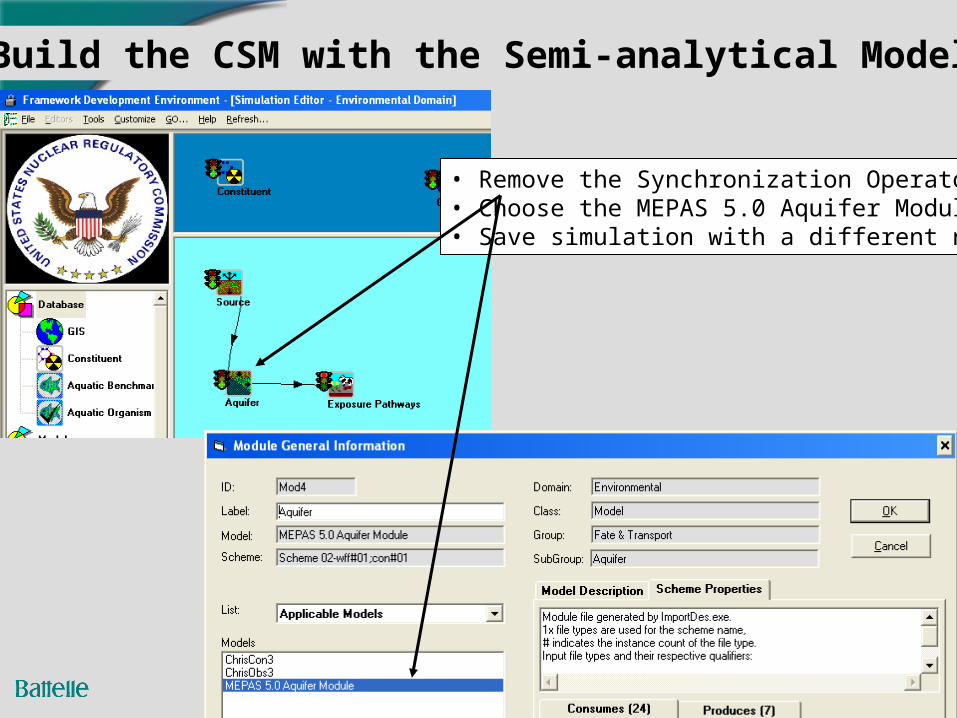
• Remove the Synchronization Operator• Choose the MEPAS 5.0 Aquifer Module• Save simulation with a different name
Build the CSM with the Semi-analytical Model
39
40
41
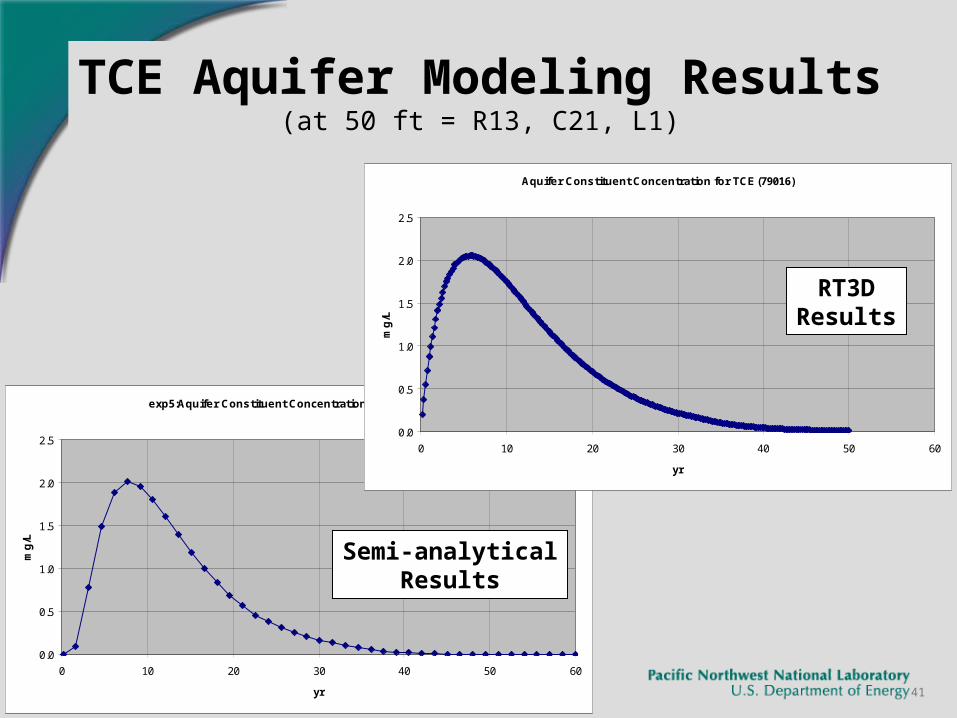
TCE Aquifer Modeling Results(at 50 ft = R13, C21, L1)
exp5:Aquifer Constituent Concentration for TCE (79016)
0.0
0.5
1.0
1.5
2.0
2.5
0 10 20 30 40 50 60
yr
mg
/L
Aquifer Constituent Concentration for TCE (79016)
0.0
0.5
1.0
1.5
2.0
2.5
0 10 20 30 40 50 60
yr
mg
/L
RT3DResults
Semi-analyticalResults
42
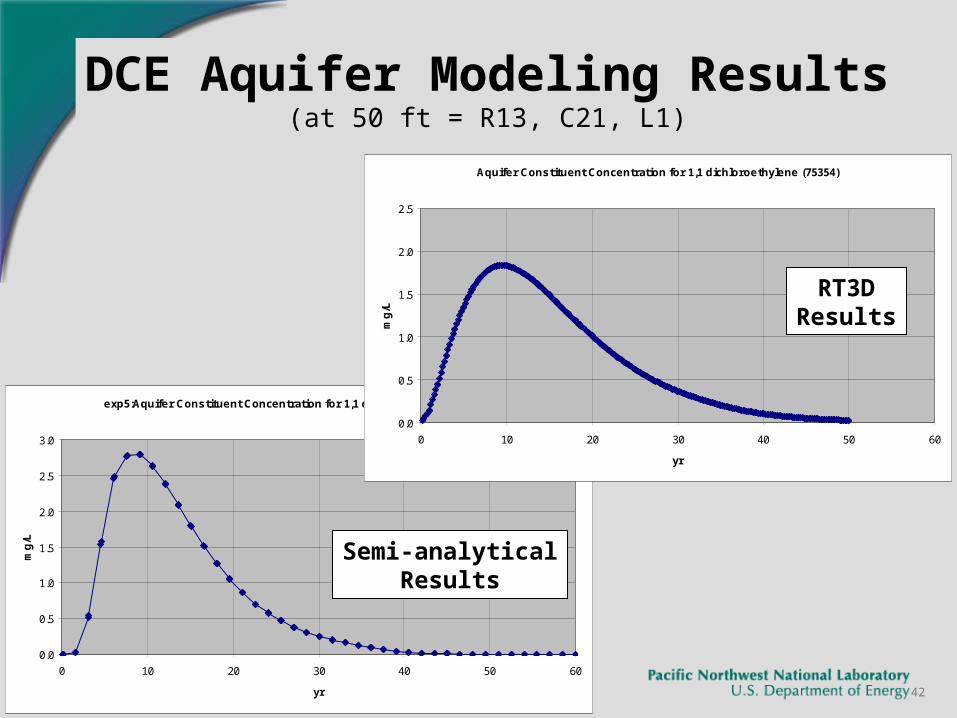
DCE Aquifer Modeling Results(at 50 ft = R13, C21, L1)
exp5:Aquifer Constituent Concentration for 1,1 dichloroethylene (75354)
0.0
0.5
1.0
1.5
2.0
2.5
3.0
0 10 20 30 40 50 60
yr
mg
/L
Aquifer Constituent Concentration for 1,1 dichloroethylene (75354)
0.0
0.5
1.0
1.5
2.0
2.5
0 10 20 30 40 50 60
yr
mg
/L
RT3DResults
Semi-analyticalResults
43
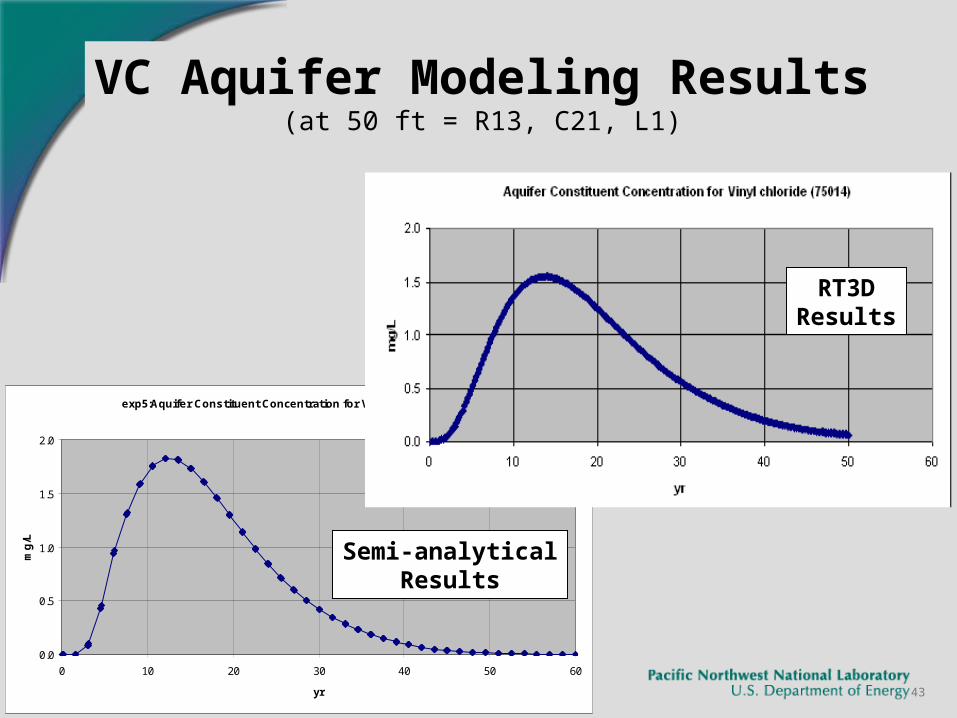
VC Aquifer Modeling Results(at 50 ft = R13, C21, L1)
exp5:Aquifer Constituent Concentration for Vinyl chloride (75014)
0.0
0.5
1.0
1.5
2.0
0 10 20 30 40 50 60
yr
mg
/L
RT3DResults
Semi-analyticalResults

44
TCE Aquifer Modeling Results(at 180 ft = R15, C23, L1)
exp5:Aquifer Constituent Concentration for TCE (79016)
0.00
0.10
0.20
0.30
0.40
0.50
0 10 20 30 40 50 60 70 80 90 100
yr
mg
/L
Aquifer Constituent Concentration for TCE (79016)
0.0
0.1
0.2
0.3
0.4
0.5
0.6
0 10 20 30 40 50 60 70 80 90 100
yr
mg
/L
RT3DResults
Semi-analyticalResults
45
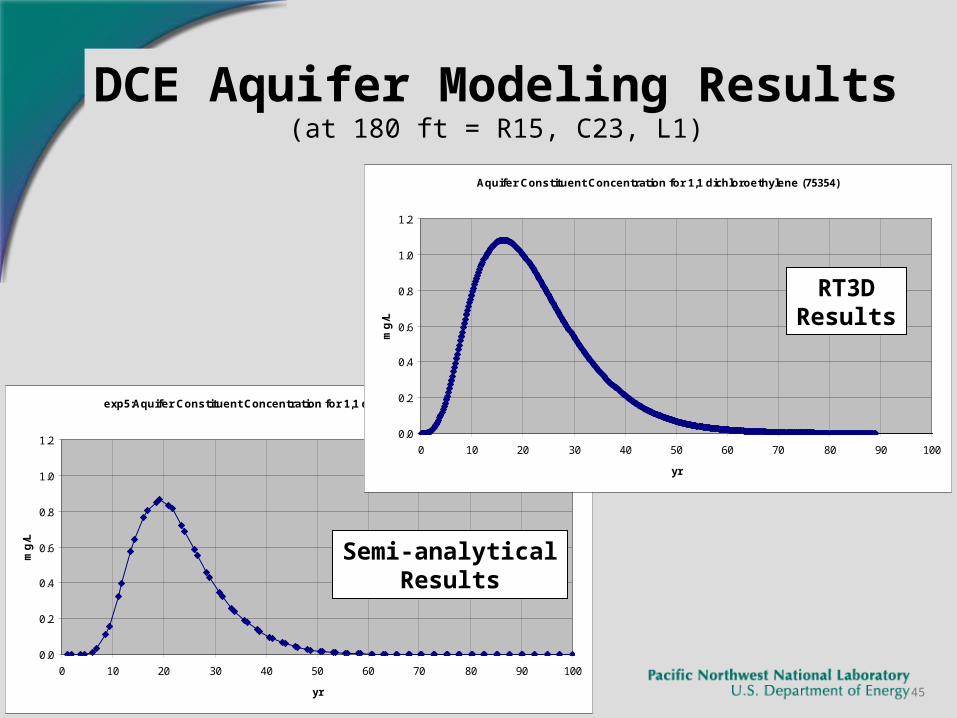
DCE Aquifer Modeling Results(at 180 ft = R15, C23, L1)
exp5:Aquifer Constituent Concentration for 1,1 dichloroethylene (75354)
0.0
0.2
0.4
0.6
0.8
1.0
1.2
0 10 20 30 40 50 60 70 80 90 100
yr
mg
/L
Aquifer Constituent Concentration for 1,1 dichloroethylene (75354)
0.0
0.2
0.4
0.6
0.8
1.0
1.2
0 10 20 30 40 50 60 70 80 90 100
yr
mg
/L
RT3DResults
Semi-analyticalResults
46
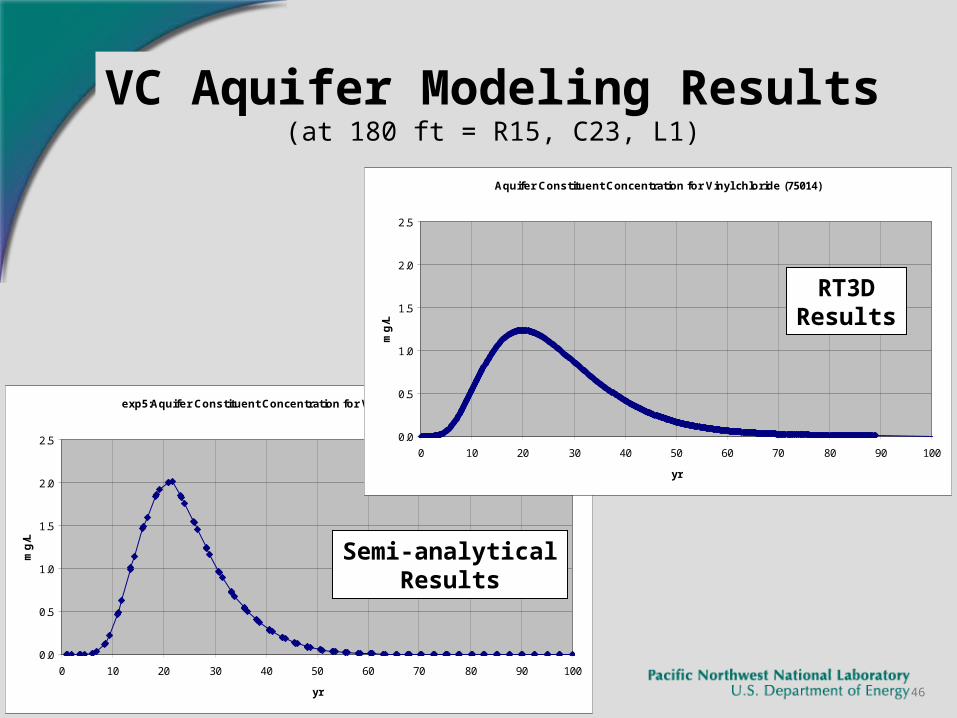
VC Aquifer Modeling Results(at 180 ft = R15, C23, L1)
exp5:Aquifer Constituent Concentration for Vinyl chloride (75014)
0.0
0.5
1.0
1.5
2.0
2.5
0 10 20 30 40 50 60 70 80 90 100
yr
mg
/L
Aquifer Constituent Concentration for Vinyl chloride (75014)
0.0
0.5
1.0
1.5
2.0
2.5
0 10 20 30 40 50 60 70 80 90 100
yr
mg
/L
RT3DResults
Semi-analyticalResults