Embed Size (px)
Citation preview

Program Evaluation and Audit
Hiawatha Light Rail Fare Compliance
March 21, 2008
2008-A04

2
Background
The Hiawatha Light Rail Line, operational since 2004, was designed with a Proof of Payment system; there are no turnstiles or other barriers that require fare payment before boarding the train. Passengers are required to provide proof of payment during fare compliance checks by Metro Transit Police Officers and can receive a citation and fine of $180 for failure to purchase a ticket. Transit police officers are regularly assigned to ride the rail and conduct compliance checks. However, given their other responsibilities for public safety, staffing aboard the trains may vary if police are actively engaged in other duties.
Based on records from compliance checks, Metro Transit reports that 99% of passengers on the Hiawatha Line have paid their fare. Given the Proof of Payment system, some concern has been expressed that this number may be overstated. The Regional Administrator requested that Program Evaluation and Audit conduct a review of fare compliance and fare checks on the Hiawatha Line.
Purpose The purpose of this project is to determine a) how much enforcement occurs, i.e. how likely is it that any individual passenger on the train will be checked for fare compliance on any given trip, and b) the actual rate of fare compliance among passengers on the train.
Scope The scope of this audit includes police inspection tactics and passenger fare payment.
Methodology The following methods of inquiry were used to examine police fare inspection and fare compliance:
• Metro Transit personnel were interviewed • Audit examined police fare inspection tactics on a random sample of train trips • Randomly selected light rail passengers were surveyed for type of fare payment • Audit estimated the probability of police fare inspection and associated cost • Data from passenger surveys was statistically analyzed to determine fare evasion
rates
Assurances This audit was conducted in accordance with the Institute of Internal Auditors’ Standards for the Professional Practice of Internal Auditing and the US Government Accountability Office’s Governmental Audit Standards.
2008-A04

3
OBSERVATIONS
Fare Inspection Metro Transit Police (MTPD) officers enforce fares on light rail through a combination of directed patrols and random sweeps. According to MTPD statistics, officers inspected 982,415 passengers or 10.79% of all passenger trips for fares in 2007. Audit staff rode the train over a three week period in order to verify the police inspection rate. Audit train trips were randomly selected and included all times of day (early morning and late night as well). In total, Audit staff rode 100 end-to-end trips between Warehouse station and Mall of America and was inspected for a fare four times. Audit observations indicate that the probability of being checked for a fare is 4%. General police activity was observed on trains and platforms 13% of the time during fieldwork.
The Audit observed rate of inspection is much lower than the MTPD rate. However this may be due to the officers’ numerous directed patrols. Directed patrols include regular inspections at special events (i.e. Metrodome sporting events) and certain platforms identified as being at higher risk for fare evasion and other criminal activity. These directed patrols result in certain populations being checked for tickets more frequently than other passengers. For example, it is likely that Audit staff would have encountered more fare inspections if staff had boarded HLRT at Lake Street (a high risk platform) or the Metrodome station during a special event. Given accurate information about risk, directed patrols should be a more efficient way of inspecting fares because MTPD officers are more likely to catch fare evaders. Also, directed patrols are a necessary function in order for Metro Transit to be responsive to customer complaints. For example, MTPD officers have increased patrols at the Midtown station as a result of increased HLRT customer complaints of misconduct and harassment on that particular platform. Thus, while directed patrols no doubt decrease the number of random inspections on the train, the patrols are an effective way of catching fare evaders while maintaining public safety. Also, directed patrols contribute to the visibility of the police force which is another important deterrent against fare evasion and other crimes on trains and platforms.
As a test of the adequacy of current inspection levels, Audit calculated the cost of fare evasion given the 4% probability of inspection. Even with the relatively low probability of being inspected, Audit believes that the cost of a citation ($180) should inspire the vast majority of passengers to pay the fare. For example, if a person rode the train 100 times without paying a fare they would theoretically be caught four times and MTPD officers would give the offender four tickets for $180 each at a total cost of $720. Thus, the cost of 100 trips to the person would be $720 or $7.20 per trip. Even though the offender does not pay the fare up front for those trips, they will pay $7.20 per trip on average given the citation cost and risk of receiving a ticket. This same cost per trip applies to all fare evaders because they will always face a 4% probability of being caught by MTPD and fined $180. The cost of fare evasion at $7.20 is much higher than the maximum fare of $2.
2008-A04

4
Fare Compliance HLRT passengers were surveyed for how they paid their fare in order to review fare compliance. GoTo fare media were found to be the most popular form of payment, and the Metropass was the most common GoTo type card. The 2.5 hour single ride ticket and Super Saver Stored Value card were the second and third most common. Passengers seemed to be very accustomed to being checked for fares, and most passengers in a train car took out their ticket as soon as Audit staff asked the pre-selected passengers for their fare. T1. Fare Type Frequency, CombinedFare Type % GoTo fare media* 33.15% 2.5 hour TVM ticket 27.18% Super Saver Stored Value 12.86% Super Saver 31-day 10.97% Transfer (regular) 7.66% 6 hour TVM ticket 2.90% Reduced fare ticket 2.38% No ticket 1.93% Other 0.97%
*includes Metropass, U-Pass, College Pass
T2. Fare Type Frequency Fare Type % 2.5 hour TVM ticket 27.18%Metropass 14.45%Super Saver Stored Value 12.86%Super Saver 31-day 10.97%GoTo card 9.70% Transfer (regular) 7.66% U-Pass 4.50% College Pass 4.50% 6 hour TVM ticket 2.90% Reduced fare ticket 2.38% No ticket 1.93% Other 0.97%
Audit staff surveyed 92 randomly selected HLRT passengers on 72 randomly selected trains. All surveys took place weekdays between 7am and 6:30pm, and Audit asked selected passengers for their ticket in order to verify they paid the proper fare. Survey data shows a fare compliance rate between 93.53% and 89.03%, and a fare evasion rate between 6.47% and 10.97%. The evasion rate represents annual fare revenue losses between $518,217 and $878,554.
T3. Audit Fare Compliance Survey Data
Sample Size Compliance Rate Evasion Rate 95% Margin of ErrorLower Estimate 92 93.53% 6.47% 5.06% Higher Estimate 92 89.03% 10.97% 6.44%
Audit staff encountered a number of passengers who presented a type of fare media that is not valid on light rail. However Audit was unable to fully determine that these passengers had not paid a fare. The Super Saver Stored Value card is not valid on light rail without a valid transfer, but some passengers presented Audit staff with a stored value card and no transfer. There is not enough information on the stored value card itself to determine when it was used or if a fare was paid. Audit assumed that these passengers had paid the fare to get the lower fare evasion rate of 6.5%; the higher evasion rate of 11% assumes the passengers did not pay a fare. It is highly unlikely that either extreme is true, and the real evasion rate is probably somewhere between the two.
2008-A04

5
Audit believes the discrepancy between the Audit compliance rate and the 99% compliance from MTPD data is due to differences in fare inspection methods. For example, MTPD statistics include all passengers inspected at special events. However these passengers are inspected before they enter the train so those without a fare are simply told to go and buy a ticket and are not counted in MTPD statistics as non-compliant. MTPD officers often inspect thousands of passengers at large special events and all of them are considered fare compliant in the police data. The 100% fare compliance at special events positively skews police data.
Furthermore, the Audit survey involved inspecting only one or two pre-selected passengers while the train was between stations in order to discourage passengers from exiting the train to avoid the survey. MTPD officers have to try to inspect all passengers on a train car in order to be effective in their job. This is a task that takes more than a few minutes and may provide enough time for a few stealthy fare evaders to exit at the next station. Also, if officers do catch a fare evader they then have the task of writing out the citation. This is a process that takes at least five to ten minutes because the officer has to check the passenger’s identification and run a background check for any warrants for arrest. While the officer is writing out a citation for one fare evader, others may have the opportunity to exit the train.
Light rail fare evasion data from other cities indicates large variations in compliance rates. The Los Angeles Metro conducted a study that found an overall weekday fare evasion rate of 4.79% for their light rail system. A study of light rail in 18 cities published by the Transportation Research Board reported fare evasion rates between 1% and 25%. Fourteen light rail systems in the study were Proof of Payment models like HLRT, and most reported their evasion rate as a range instead of one rate. For example, the Berlin light rail reported 4 to 5% evasion, Stuttgart 3 to 10%, Brussels 5 to 19% and Budapest 10 to 12%. T4. Fraud and Inspection Rates**
City Fraud
Rate (%) Inspection Rate (%) City
Fraud Rate (%)
Inspection Rate (%)
Amsterdam* 1-19 0.54 Budapest 10-12 2.5 Brussels 5-19 1 Milan* 8-12 5 Croydon 2-6 5-10 Saarbrucken 2-10 2 Gothenburg 2-10 1.3 Berlin 4-5 1.6 Manchester 2-6 14 Montpellier 2-15 4.1 Porto 1-4 5.4 Cologne 4.2 0.8 Rouen 1.5-6 2.64 Dusseldorf* 2 <2 Stuttgart 3-10 1.6 Tunis* 11 3 The Hague 5-25 3-4 Salt Lake City 2.5 8 *Denotes city with (partially) closed light rail system. **Table taken from “Fare Evasion on Light Rail Systems” by Dauby and Kovacs, TRB Circular E-C112.
In general, the study reported a lack of credible measurement methodology for fare evasion in the selected systems. This reinforces how difficult it is to measure fare evasion on Proof of Payment systems. However, the data also shows that the HLRT fare evasion rate is similar to that of other Proof of Payment systems.
2008-A04

6
Fare Media During the course of fieldwork Audit staff encountered some limited but significant control weaknesses in certain fare media. The U-Pass, College Pass and Super Saver Stored Value fare cards have issues in their design that make it difficult to determine whether a passenger has paid a valid fare on the light rail.
Super Saver Stored Value cards were the third most popular fare media with 13% of surveyed passengers paying their fare with a stored value card. According to the Council’s fare policy, stored value cards are not valid on light rail without a transfer from a bus, such as a 12-hour rail only transfer. The bus transfer is necessary to provide exact time of card use which determines valid fare payment. Only 58% of surveyed passengers with a stored value card also had the required transfer; the other 42% presented only the stored value card. Those without the transfer usually claimed that they were unaware of the policy while a few complained that the requirement is unreasonable, particularly for those who only ride the train. MTPD officers have also heard complaints from passengers that bus drivers refuse to give out the transfers.
The Council is working to convert all stored value to GoTo cards. Currently, stored value cardholders can trade their unused cards for GoTo card value.
Audit found that 9% of all surveyed passengers paid their fare using a College Pass or U-Pass. These are a type of GoTo card that is highly discounted and provides unlimited rides for four months. These cards are only supposed to be used by current college students. The U-Pass and College Pass do not have either a name or picture of the cardholder on the card itself, such as on a Metropass. U-Pass cards previously had a picture and the name of the cardholder printed directly on the card. With the conversion to GoTo passes, the pictures and names were dropped from the card. College Passes have never included a picture or name on the card.
Cubic Handheld Unit (HIT machine) HIT machines are handheld devices manufactured by Cubic that scan GoTo cards in order to verify that the card is valid and payment has been made. Audit staff used the HIT machines while surveying passengers in order to verify that GoTo fare media were valid and had been tagged. Each machine was tested to make sure it was functioning properly before taking it in the field. Audit staff worked 17 shifts surveying passengers with HIT machines, and the machines failed during three of these shifts. It is possible that one of the machine failures simply required rebooting the machine, which would not be difficult for someone experienced at working with the devices. However the other two times when the machine failed, it became completely unresponsive. The issues with the machines were particularly frustrating given that Audit staff verified that each machine was in working order before using it for the survey. In general, Audit staff found the HIT machines difficult to work with in the field.
These devices were reviewed a year ago in audit report 2006-28 and it was found that many were not functioning properly. Transit has since addressed the issues identified in that report and MTPD officers have said that maintenance and repair of the machines has improved. However the HIT machines continue to be a challenge and need constant attention. For example, sometimes a machine needs to be reset to work properly, a
2008-A04

7
process that takes at least five minutes which can be very disruptive when officers are on a train enforcing fares.
Council staff who repair the HIT machines believe the problems stem from the age of the hardware (almost ten years) and glitches in the software. The software has a tendency to freeze up and the device then has to be rebooted, a process that takes at least 5 minutes. The age of the machines present significant concerns because the hardware is no longer manufactured. Currently, one HIT machine has a cracked screen which is not fixable. Transit is working with Cubic to identify replacement devices.
GoTo Fare Data During the course of the fare evasion survey, Audit staff verified that GoTo fare users were tagging their cards prior to getting on the light rail. Council fare policy indicates that all GoTo cardholders, including College and Metropass users, should tag their card on the GoTo card reader at the light rail station platform. Platforms have multiple GoTo card readers on which passengers can swipe their cards. Unfortunately, Audit found that many GoTo card users are not tagging their cards before boarding the trains.
T5. Frequency of GoTo Card TaggingFare type Tagged Yes No GoTo Card 87.72% 12.28% Metropass 56.33% 43.67% U-Pass 47.06% 52.94% College Pass 47.94% 52.06% All GoTo 63.58% 36.42%
People using the college passes are least likely to tag their card, however Metropass cardholders were also unlikely to tag as only 56% of those surveyed had tagged their card. The GoTo system is supposed to benefit the Council by providing better data about how people use transit. Given that people tag their GoTo cards as they should, the Council would receive continuous data on when and where people use the train or bus and how they transfer. However those benefits are lost when passengers are not consistently swiping their cards on the train.
2008-A04

8
CONCLUSIONS
Current MTPD fare enforcement strategies are maintaining a relatively high level of fare compliance on light rail.
The Hiawatha light rail system is barrier free so there will always be the opportunity for passengers to avoid paying the fare. The Council depends on MTPD fare enforcement and the high cost of the fare evasion citation to encourage passengers to pay their fare. Audit found that MTPD officers check about 4% of passengers through random sweeps of trains; when directed patrols are included the percentage of passengers checked increases to about 11%. Although the inspection rate may seem low, when coupled with the possibility of a fine of $180, current inspection rates maintain a compliance rate between 89% and 94%.
Some fare media lack enough information to verify fare payment on the light rail presenting a limited but significant control weakness.
MTPD officers need unequivocal information to validate that a passenger paid a fare. During the course of fieldwork, Audit staff identified several fare types that do not present enough information to verify fare payment which presents the risk that passengers are riding light rail without paying their fare.
2008-A04

9
RECOMMENDATIONS
Program Evaluation and Audit recommendations are categorized according to the level of risk they pose for the Council. The categories are:
• Essential – Steps must be taken to avoid the emergence of critical risks to the Council or to add great value to the Council and its programs. Essential recommendations are tracked through the Audit Database and status is reported twice annually to the Council’s Audit Committee.
• Significant – Adds value to programs or initiatives of the Council, but is not necessary to avoid major control risks or other critical risk exposures. Significant recommendations are also tracked with status reports to the Council’s Audit Committee.
• Considerations – Recommendation would be beneficial, but may be subject to being set aside in favor of higher priority activities for the Council, or may require collaboration with another program area or division. Considerations are not tracked or reported. Their implementation is solely at the hands of management.
• Verbal Recommendation – An issue was found that bears mentioning, but is not sufficient to constitute a control risk or other repercussions to warrant inclusion in the written report. Verbal recommendations are documented in the file, but are not tracked or reported regularly.
1. (Significant) The Council should add identifying information to U-Passes and College Passes, including the name of the valid cardholder and possibly a picture.
Currently the College and U-Pass cards do not include any information identifying the rightful cardholder. MTPD officers are supposed to verify that the rider is a college student by checking college ID. These passes need the cardholder name on the card itself, and ideally the card would include a picture of the rightful owner as is included on the Metropass.
Management Response: Fare evasion risks were carefully considered relative to the costs and benefits of various controls when implementing the Go-To versions of the U-Pass and College Pass. Unlike the previously used magnetic media, Go-To media has the built in control of being able to be canceled (hotlisted) without physically confiscating the card. This allows immediate termination of card rights if inappropriate use is identified.
When implementing the UPASS program with Go-To media the cost to print names/pictures on cards was estimated at approximately $110,000 for the school year. This cost greatly exceeded the fare evasion issues previously experienced with the UPASS as well as the estimated potential fare evasion with the Go-To media. As a result of discussions with the University of Minnesota, Metro Transit operations, Metro Transit Police, Marketing, and others it was determined to go forward with the program without incurring the cost of printing names/pictures on the cards. It was discussed and decided
2008-A04

10
that the risks understood regarding the UPASS and College PASS did not approach the known costs at that time. This decision would be evaluated as the program continued to determine if changes were needed.
As the program for UPASS is now completing its first 6 months of operation an evaluation of the decision on pictures/names for UPASS and College Pass relative to the $110,000 cost savings is appropriate as was planned during program inception. Discussions with Metro Transit Police have begun and fare inspections tests developed which would help determine if additional controls are necessary in addition to their current practices (i.e. monitoring web sites for pass sales, on board inspection and questioning etc…) For a designated time period the officers will record the name on the Student I.D. and the pass number so this information may be subsequently validated with the Student Pass database.
The additional fare compliance testing will be completed prior to the end of the current Spring Semester. Finance will review the results of this testing with Internal Audit, Metro Transit Police the University of Minnesota and other appropriate departments. A plan to implement any necessary modifications to the current program along with a cost/benefit analysis of these modifications will be documented and implemented in the next Fall Semester 2008.
2. (Significant) The Council should include HIT machine maintenance in future Cubic contract amendments.
The HIT machine is essential to fare enforcement on light rail. These devices are specially created by Cubic for the HLRT system, and the Council is dependent on Cubic for the device given that they wrote the software and engineered the hardware. Transit staff who deal with HIT machine repair report that they are limited in how much they can repair on the machines, and anything serious that needs to be fixed requires that the machine be sent back to Cubic at a cost to the Council. It is essential that the Council require Cubic to provide continuing support and maintenance for the device, including accommodations for device replacement at the end of its life.
Management Response: The HIT (Hand Held Inspection Terminals) equipment furnished by Cubic included the same hardware and software maintenance provisions as other system devices (Ticket Vending Machines, Rail Station Validators, Bus Validators etc…) Hardware and software was warranted against manufacturing issues for one year from implementation which has now expired.
Metro Transit did include provisions in the ongoing Software Support and Maintenance Agreement with Cubic which ensures these devices will remain compatible with any and all subsequent system upgrades. This support is effective for four more years.
As with many types of proprietary devices certain aspects are specifically engineered and configured by the provider (i.e. Cubic) and thus are not able to be serviced by others.
Also, as with many other aging technology devices, purchase of an overall maintenance agreement for these types of items typically, if available, is not cost-effective relative to the individual purchase of any needed replacements or repairs.
2008-A04

11
Metro Transit, as well as other Transportation Agencies (i.e. Los Angeles Metro, Edmonton etc..) will utilize these devices, and continues to discuss next generation devices with Cubic for future Metro Transit needs. Metro Transit recently requested and received a quote from Cubic on the purchase of additional HIT equipment. Cubic responded they have ample equipment available to meet our requested needs. Next generation equipment has been recently demonstrated by Cubic to the Los Angeles Metro and Metro Transit is in the process of scheduling a demonstration as well.
3. (Significant) Use of a transfer with stored value cards on light rail needs to be enforced more strictly.
Council policy states that stored value cards are not valid on light rail without a transfer. However Audit found that 42% of stored value card users did not have a valid transfer when riding light rail. Many stored value card holders without a transfer said that they were unaware they needed the transfer. Passengers without a rail transfer should be warned that they can be fined, and after a point those without a transfer should be given a citation.
Management Response: While the Transit Police Department does support the idea of stricter enforcement of the requirement to present both the magnetic SVC and a Rail Only Transfer there are certain challenges that do complicate the issuing of citations in some cases. First it should be noted that when an officer encounters a passenger with a SVC only and can establish that there is not a current fare encoded on the card through inspection of the media, enforcement action is taken. However when, through inspection of the SVC, it is determined that a current fare may still be valid it is not possible to issue a citation. The officers’ responsibility when issuing a citation is to certify that all information is true and correct to the best of his knowledge and must be able to testify in court that the fare is unpaid. There are, however, several strategies that are employed to address the issue of passengers using SVC without a Rail Only Transfer:
• When an officer can determine through inspection of the media that there is not a current fare on the SVC enforcement action is taken.
• Officers sometimes accompany a rail passenger to a bus, when available, to check the status of the transfer on their SVC. (Bus routes serve all Light Rail terminals except Bloomington Central and Humphrey Terminal)
• A database is kept documenting all rail passengers who have been previously warned or cited for fare evasion and a second violation is then much more likely to result in a citation.
Finally, the magnetic SVC is being phased out so this will no longer be an issue.
4. (Consideration) The Council should consider campaigns or incentives to encourage passengers to tag their GoTo cards prior to boarding light rail.
The GoTo system benefits the Council in providing constant data about how passengers use transit. Audit found that 36% of GoTo card users do not tag their card prior to boarding light rail. Passengers with college passes were least likely to have tagged their GoTo card. Many college pass users told Audit that they were unaware that they needed
2008-A04

12
to tag their card prior to boarding the train. The Council should consider encouraging passengers to tag their GoTo cards through a media campaign or incentive program.
Management Response: The tagging compliance is an ongoing consideration in the implementation and development of fare media and products at Metro Transit and other Agencies who utilize Proof of Payment systems. Metro Transit will continue to address tagging compliance as an important component of patron communication via Marketing and Communication programs.
2008-A04
Appendix A:
13
Statistical Methods
In order to address the two questions posed in this audit, namely a) how often are police inspecting tickets and b) how many people are riding the train without paying for a ticket, Audit staff employed complex survey methods. This appendix will describe the survey methods used by Audit in detail.
Fare Inspection Survey Audit rode on light rail a statistically significant number of times in order to act as the average commuter to some extent, and to verify how often police would come on board to inspect for fares. Trains trips covered by Audit staff were selected at random.
In order to set up the sample universe for the inspection survey, all train departure times from Warehouse station for Monday through Friday for a two week period were delineated and enumerated. Audit used the route 55 schedule as of January 2008 as the guide for the train trip universe, and partial train trips (pull outs) were excluded from the sample. The sample universe that Audit used included 1,092 departure times from Warehouse station.
Audit calculated the necessary sample size using the sample universe of 1,092 trips, a sampling error of 5% and a confidence level of 99%. Given these statistics, the necessary sample size was calculated to be 50 trips.
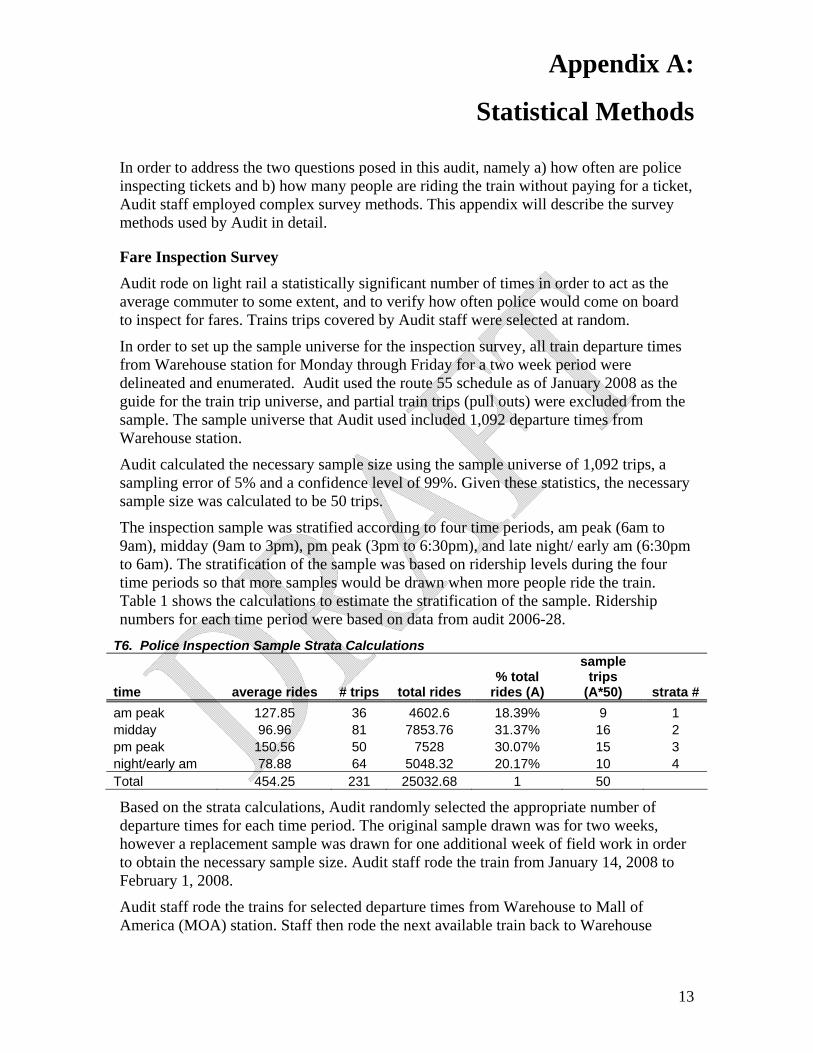
The inspection sample was stratified according to four time periods, am peak (6am to 9am), midday (9am to 3pm), pm peak (3pm to 6:30pm), and late night/ early am (6:30pm to 6am). The stratification of the sample was based on ridership levels during the four time periods so that more samples would be drawn when more people ride the train. Table 1 shows the calculations to estimate the stratification of the sample. Ridership numbers for each time period were based on data from audit 2006-28.
T6. Police Inspection Sample Strata Calculations
time average rides # trips total rides % total
rides (A)
sample trips
(A*50) strata # am peak 127.85 36 4602.6 18.39% 9 1 midday 96.96 81 7853.76 31.37% 16 2 pm peak 150.56 50 7528 30.07% 15 3 night/early am 78.88 64 5048.32 20.17% 10 4 Total 454.25 231 25032.68 1 50
Based on the strata calculations, Audit randomly selected the appropriate number of departure times for each time period. The original sample drawn was for two weeks, however a replacement sample was drawn for one additional week of field work in order to obtain the necessary sample size. Audit staff rode the train from January 14, 2008 to February 1, 2008.
Audit staff rode the trains for selected departure times from Warehouse to Mall of America (MOA) station. Staff then rode the next available train back to Warehouse
2008-A04

Appendix A:
14
station. Audit used the observation data from the randomly selected trip and the return trip. These two connected trips were treated as a cluster in data calculations.
During fieldwork, Audit staff noted both the number of times they were asked for a ticket as well as any police activity on trains and platforms. Audit observed a fare inspection rate of 4% as staff was asked for proof of fare four times during fieldwork. Also, Audit staff observed general police activity on 13% of trips.
T7. Light Rail Fare Inspection & Police Activity
Variable Sample Size Mean Standard Error Margin of Error (95%)Ticket Inspection 100 4.00% 2.45% 4.80% Police Activity 100 13.00% 3.48% 6.82%
All calculations for the inspection survey were done with SAS Enterprise Guide 4. Standard errors were calculated using the Taylor series expansion method, which produces robust variance estimators when complex survey designs such as clustered and stratified sampling are used.
Fare Evasion Survey In order to estimate the number of passengers who ride light rail without paying a fare, Audit staff surveyed passengers on how they paid their fare. Passengers surveyed were asked to let staff inspect their ticket for proof of payment.
The evasion survey sample size was calculated using a 99% confidence level and 5% sampling error which corresponded to a sample size of 39. However, Audit increased that sample size to 80 because of concerns about non-response from passengers (i.e. passengers refuse to show their fare to Audit staff).
The sample universe for the evasion survey was defined as train departure times from VA Medical Center and Cedar-Riverside stations. Audit limited the sample universe to trains leaving between 7am and 6:30pm. Audit had to obtain a HIT machine from Transit Police (MTPD) headquarters before each shift, and early morning and late night hours were excluded from the survey in order to work around MTPD station hours.
As with the inspection survey, Audit drew a random sample of train departure times stratified according to ridership. Once again, the result should be that more passengers were surveyed during times when there is higher ridership. The sample was stratified between am peak, midday and pm peak times. The sample was also divided so that Cedar-Riverside and VA Medical Center trains were equally represented in the survey. T8. Evasion Survey Strata Calculations
time average rides # trips total rides% total
rides (A) sample trips
(A*80) strata # am peak 127.85 36 4602.6 23.03% 18 1 midday 96.96 81 7853.76 39.30% 31 2 pm peak 150.56 50 7528 37.67% 30 3 Total 375.37 167 19984.36 100.00% 80
2008-A04

Appendix A:
15
Audit randomly selected the appropriate number of train departure times for each time period and station. For each selected train, Audit staff surveyed between one and three passengers. Passengers to be surveyed were randomly selected based on contiguous seat clusters on the light rail train cars; passengers sitting next to each other in a seat were treated as a cluster in data calculations. Please see Exhibit A at the end of this section for an example of the survey form and seat selections. Audit also randomly selected the front or rear train car for each sample. Surveys were conducted between February 11, 2008 and March 7, 2008.
Audit staff used HIT machines for each survey in order to verify GoTo fare media as valid. Generally it took about two minutes or less to conduct the survey, which was part of the original planning. Audit wanted to ensure that all selected passengers could be surveyed before they needed to exit the train. It was necessary to design the survey so that only a few people would be surveyed at one time. Audit staff generally surveyed passengers while the train was moving to further ensure that the selected passengers would not exit the train and avoid the survey. Audit staff would only survey one seat cluster for each selected train departure time.
In total, Audit surveyed 92 passengers on 72 trains. All selected passengers complied with the request to verify their fare payment. Only six passengers did not have valid fares. These passengers were not given citations but were warned that they could receive a fine of $180 from an MTPD officer if they do not have a valid fare.
A limited number of selected trains were not included in the final sample because of time constraints and staffing difficulties. In order to account for the survey being out of balance with the original stratification, Audit employed post-stratification weights. The weights function to balance to sample in each strata to the real proportion of ridership for that strata.
T9. Evasion Survey Post-Stratification Weight Calculation
time average
rides #
trips total rides
% total rides (A)
surveyed passengers
% total surveyed
(B) weight (A/B)
am peak 127.85 36 4602.6 23.03% 20 21.74% 1.0594 midday 96.96 81 7853.76 39.30% 33 35.87% 1.0956 pm peak 150.56 50 7528 37.67% 39 42.39% 0.8886 Total 375.37 167 19984.36 100.00% 92 100.00%
2008-A04

Appendix A:
16
For example, about 38% of passenger trips occur during pm peak hours. However, 42% of surveys were taken during pm peak hours. This imbalance indicates that pm peak passengers were over-sampled, and the calculated weight will help to correct this issue.
T10. Fare Type Frequency, Combined Fare Type % GoTo fare media* 33.15%2.5 hour TVM ticket 27.18%Super Saver Stored Value 12.86%Super Saver 31-day 10.97%Transfer (regular) 7.66% 6 hour TVM ticket 2.90% Reduced fare ticket 2.38% No ticket 1.93% Other 0.97% *includes Metropass, U-Pass, College Pass
T11. Fare Type Frequency Fare Type % 2.5 hour TVM ticket 27.18%Metropass 14.45%Super Saver Stored Value 12.86%Super Saver 31-day 10.97%GoTo card 9.70% Transfer (regular) 7.66% U-Pass 4.50% College Pass 4.50% 6 hour TVM ticket 2.90% Reduced fare ticket 2.38% No ticket 1.93% Other 0.97%
T12. Audit Fare Compliance Survey Data
Sample Size Compliance Rate Evasion Rate 95% Margin of ErrorLower Estimate 92 93.53% 6.47% 5.06% Higher Estimate 92 89.03% 10.97% 6.44%
Tables 10 to 12 show how surveyed passengers paid their fare, and the estimated fare compliance rate. All standard errors were calculated using the Taylor series expansion method. SAS Enterprise Guide 4 was used to calculate all statistics.
Given the estimated compliance rate, Audit calculated the fare revenue losses that correspond to the rate of non-payment.
2008-A04

Appendix A:
17
T13. Estimated 2007 fare losses
Lower Estimate Higher Estimate Total Passengers/ Trips 9,101,036 9,101,036 Total Fares Collected $8,008,912 $8,008,912 Estimated Evasion Rate 6.47% 10.97% Estimated non-paying customers 588,883 998,356 Average rail fare $0.88 $0.88 Estimated Fare Revenue Loss $518,217 $878,554 Operating expenses $22,073,796 $22,073,796 lost fares, % operating expenses 2.35% 3.98%
Total HLRT ridership and fare data were provided by Transit Finance staff. Given the evasion estimates between 6.5% and 11% of all passenger trips, Audit estimates fare revenue losses between $518,217 and $878,554 due to fare evasion.
2008-A04

Appendix A:
18
Exhibit A: Fare Compliance Survey Form
seat# seat# section# sample id:
32 1 Date: 31 2 Time:
Station: 30 3 Direction: 29 4
1
Random selections Train: 2 Seat Section 5 15
28 14 6 28 27
2
25 Notes
27 7 card type:
26 8
3
paid? tagged?
25 9 4
other:
24 10 card type:
23 11 paid?
5
tagged? other:
22 card type: 12 paid?
21
6
tagged? other:
20 13 19 14 card type:
paid? 18 15 tagged? 17 16
7
other:
2008-A04

Appendix B:
19
Train Fare Media
Trip Tickets Single Commuters may purchase single train ride tickets on the train platform. These tickets allow the commuter to ride the train for 2 ½ hours.
Cash Fare $2.00 Adult fare peak hours $1.50 Adult fare non-peak hours $ .50 Metro Mobility fare $ .50 Senior Citizen and 12 and under non-peak hours
Fare enforcement requires the officer to check the ticket for date and time. For Metro Mobility and Senior Citizen fares the commuter must provide identification.
6 Hour Pass Commuters may purchase a ticket good for six hours on the train platform. This ticket allows the commuter to ride the train for six hours.
Cash Fare $3.50
Fare enforcement requires the officer to check ticket for date and time.
Day Pass Commuter may purchase a ticket valid for 24 hours on the train platform.
Cash Fare $6.00
Fare enforcement requires the officer to check ticket for date and time.
Super Saver 31 Day Pass The Super Saver 31 Day Pass is good for both the bus and the train for 31 days from the date of first use. In order to use the pass on the train it must first be activated on a bus. The 31 day passes are priced as follows:
Cash Fare Purchase Price $2.75 $104.00 $2.00 $ 76.00 $1.50 $ 50.00 $ .50 $ 21.00 (Valid only for limited mobility commuters.)
Fare enforcement process requires officer to look at date of first usage. If not dated the officer will write the current date on the pass and explain that it needs to be activated on a bus. The 31 day countdown for the card does not occur until it has been activated. This allows a person to use the card as appropriate fare media on a train until such time as an officer dates the ticket or it is activated on a bus.
2008-A04