Embed Size (px)
Citation preview

HI-913 HARDY SHAKER
Installation Manual
DOC# 100929 • REV C (Jan 2017)
1180
1. OVERVIEW
The Metrix Model HI-913 Portable Shaker Table provides a field-tested method for on-the-spot dynamic verification of accelerometers, velocity pickups and non-contact displacement transducers. Optional mounting fixtures and hardware needed to connect transducers to the HI-913 mounting platform are available upon request. A closed-loop control algorithm provides enhanced stability and accuracy of frequency and amplitude levels.
The HI-913 incorporates a built-in sine wave oscillator, power amplifier, electrodynamic shaker, NIST-traceable reference accelerometer and digital display. The HI-913 is completely self-contained and operates on battery or AC power.
The built-in reference accelerometer is attached permanently to the shaker armature, maximizing the accuracy between the reference accelerometer and the test transducer. The HI-913 is designed to provide long-term reliable performance over the frequency range of 7 Hz to 10 kHz. The HI-913 can be used for a variety of applications that include:
•Verification and calibration of vibration transducers and related test systems
•Verification of connector and cabling integrity
•Confirm machine vibration alarm trip points are set properly and ensure end-to-end functionality of vibration monitoring systems
Notes
•Loads of up to 800 grams (28.3 ounces) can be mounted directly to the HI-913 mounting platform. Larger loads may be applied to the platform, however, if prolonged testing of a heavy load is planned, we recommend using an external transducer suspension system. Under these conditions the vibration wave-form should be viewed on the oscilloscope to aid in positioning the test transducer and platform to reduce distortion that can occur with very heavy weights.

Doc# 100929 • HI-913-Shaker • Jan2017-RevC Page 2 of 25
•The HI-913 should always be operated on a stable, flat surface.
•The HI-913 is designed for field test applications but care must be taken to maintain the integrity of the mounting platform assembly.
•Hearing protection recommended when operating the HI-913 for an extended amount of time.
Accessories
Accessories pictured below are included with each HI-913 Portable Shaker Table.
Mounting Wrench 1-Mounting Pad 2-1/4-28 to 1/4-28 Adapter3-10-32 to 1/4-28 Adapter
Power Supply and Plug Adaptors Acessory Pouch
A Certificate of Calibration is also included with every new unit. Metrix recommends annual recalibration of the HI-913 unit. The factory service code for the recalibration is HI-913 CAL01.

Doc# 100929 • HI-913-Shaker • Jan2017-RevC Page 3 of 25
2. BASIC OPERATION
Test Set-Up1. Mount your sensor to the HI-913 mounting platform.
• The HI-913 sensor mounting platform is threaded for a ¼-28 stud. Select an appropriate adaptor for mounting the sensor.
• While tightening the sensor, secure the HI-913 mounting platform with the supplied wrench to prevent damage to the shaker from torque.
2. Connect sensor signal conditioner and readout device as necessary. Make sure that connections are secure.
3. Power the unit ON by pressing and holding the FREQUENCY dial for 3 seconds.
NOTE: It is good practice to perform calibrations on battery power. Disconnecting from line power ensures a power surge will not cause the calibrator to power down during test. If excess current is detected during use, the portable calibrator shuts down to prevent damage.
Setting the Frequency and Amplitude Units1. Select the correct Frequency Units for your test by pressing the FREQUENCY dial to enter into the CALIBRATION OPTIONS menu:
• Use the FREQUENCY dial to highlight TEST SETTINGS then press.• Within the Test Settings Menu rotate the FREQUENCY dial to highlight
FREQUENCY UNIT then press to toggle between Hertz and CPM. 2. Select the correct Amplitude Units for your test by pressing and releasing the AMPLITUDE dial. The following options are available:
Acceleration Velocity Displacement
g’s pkg’s RMSm/s2 pkm/s2 RMS
in/s pkin/s RMSmm/s pkmm/s RMS
mils p-p
µm p-p
3. Select the desired vibration amplitude and frequency for testing by turning the AMPLITUDE and FREQUENCY dials clockwise to increase or counter clockwise to decrease the setting.
•Slow Turns – settings will increase or decrease by single steps•Fast Turns – settings will increase or decrease by larger increments

Doc# 100929 • HI-913-Shaker • Jan2017-RevC Page 4 of 25
Completing the Test4. Verify that the level indicated on the HI-913 is the same as the level being shown on the readout of the sensor under test.
5. Before powering the unit OFF, reduce the vibration amplitude. The HI-913 retains the settings used prior to shutdown when it is powered back ON. Reducing the amplitude prior to shutdown ensures the sensor under test will not be jarred when the HI-913 is powered ON. 6. Power the unit OFF by pressing and holding the FREQUENCY dial for 3 seconds.
• To preserve battery charge, the HI-913 will automatically power off after 20 minutes of inactivity when not plugged into the charger.
After Testing7. Plug the HI-913 into an AC power source when not in use. This will ensure the batteries are fully charged for your next test and will also help to maximize the lifespan of the batteries.
8. Periodic calibration checks are recommended.• A dedicated “verification sensor” can be used to check the system
readings and results. By using a dedicated sensor, you can ensure that the system is providing the same result during each test.
• The HI-913 should be returned to Metrix for regular recalibration (recommended annually) or for any maintenance or repair. The most current factory recalibration date is displayed on the LCD screen during the HI-913 boot-up sequence.
Additional FeaturesTest SettingsThe “Test Settings” menu can be found by pressing FREQUENCY dial > “Test Settings.” A screen with the following will appear, use the FREQUENCY dial to highlight and toggle all settings:
• Back – returns user to “Calibration Options” menu
• Cal Route: N/A, Active or off
o N/A indicates the Calibration Route firmware option has not been purchased. Calibration Route allows users to program semi-automated test points. See “Calibration Route” section for more information. Contact Metrix to unlock this feature.
• Source: Internal or External
o If external is selected the shaker can be controlled with an external source. See “Input/Output” for more information.

Doc# 100929 • HI-913-Shaker • Jan2017-RevC Page 5 of 25
• Frequency Unit: Hertz or CPM (cycles per minute)
Amplitude Units
• Amplitude units that are seldom or never used can be turned off by using the “Amplitude Units” feature, found by pressing FREQUENCY dial > “Amplitude Units.”
• The “Amplitude Unit Screen” shows all 10 available amplitude scales on model HI-913 Portable Vibration Calibrator. Use the FREQUENCY dial to highlight each scale and press the dial to toggle the scale on or off. A filled circle next to the scale indicates it is active. An empty circle next to the scale indicates it is inactive. Inactive scales do not appear when cycling through scales using the AMPLITUDE dial during normal operation.
• To go back to the “Calibration Options” menu use the FREQUENCY dial to highlight “Back” then press.
Calibration RouteFirmware Option: HI-913-CALROUTEModel HI-913 must be ordered with firmware option HI-913-CALROUTE for the Calibration Route features to be available. This firmware can be added at any time. Contact Metrix for ordering and installation information.
The Calibration Route firmware allows users to create and run semi-automated frequency response and amplitude linearity tests for vibration sensors on model HI-913. Tests or “routes” are created in the supplied Microsoft Excel® “Route Generator” workbook then uploaded to the HI-913 via supplied USB drive. Once uploaded the test is activated. But the test can also be de-activated at any time, putting the HI-913 back into manual operation mode. When a Calibration Route is active the HI-913 can only adjust to the pre-defined amplitude and frequency points that have been programmed.
Creating A New Test (Route)Version 2010 or later of Microsoft Excel® is required for the CalRoute features in Route Generator workbook to operate correctly. Drop-down arrows for frequency and amplitude units may not appear if using older versions of this software.

Doc# 100929 • HI-913-Shaker • Jan2017-RevC Page 6 of 25
1. Open the Route Generator workbook using Microsoft Excel®
2. Route Name: Enter the name of the test in cell B7 next to “Route Name”. When the test file is created and saved the file name will be this value followed by “_Route.pvc”.
3. Frequency Unit: Use the drop down arrow to choose the frequency unit (Hertz or CPM) in cell B8. One cannot toggle between Hertz and CPM during the test.
4. Amplitude Unit: Use the drop down arrow to choose the amplitude unit (g pk, g RMS, m/sec2 pk, m/sec2 RMS, in/sec pk, in/sec RMS, mm/sec pk, mm/sec RMS, mils p-p or µm p-p) in cell B10.
5. Amplitude: If desired, enter the amplitude for all test points in cell B9 next to “Amplitude”. This is useful for a frequency response test where all test points will have the same amplitude value. If creating a linearity test leave this cell blank since the amplitude values will change for each test point.
6. Press Table Auto-Fill. The grey cells in the table will automatically populate with the values chosen in steps 3-5. All cells will populate. The table is capable of creating a 30-point test. But any number of test points can be programmed. Before creating the route file user must delete values in cells for test points that should not be created (see example).
7. Enter the desired Frequency values for each test point in column A beginning with cell A14. The test will be conducted in the exact order as programmed. The first test point will be as programmed in row 14; the next will use row 15 values and so on.
a. The HI-913 can only simulate vibration in CPM values that are multiples of 60. I.e. 1800 CPM, 3600 CPM, 4200 CPM, etc. If a value is entered that is not a multiple of 60, the HI-913 will adjust up or down to the nearest CPM value that is a multiple of 60.
b. Example: 1900 CPM is entered as a test point. The HI-913 will adjust to 1800 CPM and 1800 CPM will be displayed.
8. Enter the desired Amplitude values for each test point in column B beginning with cell B14. Skip this step if all amplitude values have been automatically populated using the Table Auto-Fill button.
9. Delete undesired test points. For example, a 10-point test only requires rows 14-23. The Table Auto-Fill feature saves typing but one must delete data from cells that are not needed. For a 10-point test rows 24-43 should be blank thus they can be highlighted and cleared.
10. Press Create Route File. A .pvc file will be created, save this file to

Doc# 100929 • HI-913-Shaker • Jan2017-RevC Page 7 of 25
the USB drive in the Calibration_Route folder.
a. When prompted to save, open the USB Disk
b. Open the Metrix_PVC folder
c. Open the Calibration_Route folder
d. Press saveExample Accelerometer Test (Route)An example of a 10-point accelerometer test, created in the Report Generation Workbook, is shown above. Some helpful notes…
• When run, this test will shake the accelerometer at 1g pk at all points. If the shaker cannot generate 1g pk it will output the maximum vibration possible given the sensor’s weight and test speed. The shaker will not allow user to program points that can damage the shaker.
• The test will begin at 10 Hz and end at 5000 Hz, with test points at 50,100, 300, 500, 1000, 2000, 3000 and 4000 Hz as well.
• The file name will be CaseAccel_Route.pvc, when uploading to the HI-913 one would choose this file.
Example Proximity Probe Test (Route)An example of a 10-point proximity probe test, created in the Report Generation Workbook, is shown above. Some helpful notes…
• This test will simulate vibration at 3600 CPM for all test points.
• This is a linearity test. Vibration will start at 1.0 mils p-p and escalate to 10.0 mils p-p. The sensor will be evaluated every 1.0 mils.
• The name of the file will be ProxProbe_Route.pvc.
Loading & Activating a Calibration Test (Route)With the calibration test saved as a .pvc file to the Calibration_Route folder on the USB and the USB inserted into the port on the HI-913 the following instructions detail how to upload to model HI-913 and activate:
1. Press the FREQUENCY dial to enter “Calibration Options” menu, rotate to highlight TEST SETTINGS and press again to enter “Test Settings” menu.
2. Use FREQUENCY dial to highlight and click selection next to “Cal Route:”. Selection will be “Off” or “Active” depending upon previous status. When clicked user will enter into “Route Option” menu.
a. If display indicates “Cal Route: n/a” the 9100-CALROUTE firmware has not been purchased. Contact Metrix to add this firmware to the HI-913.
3. Use FREQUENCY dial to highlight and click on LOAD FILE FROM USB

Doc# 100929 • HI-913-Shaker • Jan2017-RevC Page 8 of 25
1. Up to six route files (tests) are shown. Use FREQUENCY dial to highlight and click on desired file.
2. Display will indicate “Route Load Successful Activate Now?” To activate press the AMPLITUDE dial.
a. To load to memory but not activate the test press FREQUENCY.
The calibration test is now loaded and active. Rotating the FREQUENCY dial allows user to scroll through programmed test points without saving data.
Executing the Semi-Automated Calibration Test (Route)The calibration test has been created and saved to the USB. It has also been uploaded and activated in the HI-913 using the previous section. The following instructions detail usage of the HI-913 while the pre-programmed test is active. To use the HI-913 in manual mode again the calibration route must be de-activated (see next section).
• With a Calibration Route active the HI-913 will only cycle to the pre-programmed test points. The FREQUENCY is used to cycle through the test points.
• Pressing the amplitude dial will not change amplitude scales while route is active.
• Once the Calibration Route is activated shaker will vibrate at first pre-programmed test point.
Route Option MenuThe Route Option menu is accessed by pressing FREQUENCY dial then using the dial to highlight and click on Test Settings, then using the dial to highlight the text next to Cal Route: and clicking on it. The menu has the following functionality and the FREQUENCY dial is used to navigate and select:
• Back – returns to Test Settings menu
• Activate Route – activates the calibration test stored in memory
• Deactivate Route – returns the HI-913 to manual operation, de-activates semi-automated test
• Load File From USB – shows a list of up to six pre-programmed tests (routes) read from Calibration_Route folder on USB drive
• Delete Route – returns the HI-913 to manual operation and also deletes the pre-programmed test from memory
• File Information – displays name of semi-automated test, number of test points and date it was created. If no test is active pressing file while this option is highlighted does nothing.
• Eject USB – allows user to safely remove the USB drive from HI-913

Doc# 100929 • HI-913-Shaker • Jan2017-RevC Page 9 of 25
Extending Low Frequency Operation to 5 HzFirmware Option: HI-913-LF5Model HI-913 must be ordered with firmware optionHI-913-LF5 for the low frequency response to be extended from 7 Hz to 5 Hz (420 CPM to 300 CPM). This firmware can be added at any time. Contact Metrix for ordering and installation information.
The operation of model HI-913 does not change if the HI-913-LF5 option is ordered. The minimum low frequency response will be 5 Hz instead of 7 Hz. Allow for extra time for the shaker and sensor under test to settle when testing at slow speeds. The HI-913 has a pre-compensation algorithm to reduce distortion. At speeds below 10 Hz this algorithm takes 1-5 seconds to center vibration on the fundamental frequency and reach the desired amplitude.
Definition of Frequency Units
• Hertz (Hz) is defined as the number of periodic cycles per second and it is a standard unit for measuring signal frequency.
• CPM stands for Cycles Per Minute. CPM is commonly used for testing industrial sensors that monitor rotational vibration. 1 Hz=60 CPM
Amplitude Basics
• Root Mean Square (RMS) is a calculation that takes the square root of the average of the squared amplitudes from a set of data. This type of measurement takes all amplitudes of a signal into account rather than just one, making it an accurate tool for an overall calculation.
• Peak (pk) bases calculations on the highest value of the signal generated during testing. For a sinusoidal wave (as is produced by the HI-913), the peak value is calculated by RMS*√2. The HI-913 does not measure a true peak value, but instead estimates the value mathematically based upon the RMS value.
Figure: Sinusoidal Wave
Doc# 100929 • HI-913-Shaker • Jan2017-RevC Page 10 of 25
• Peak-to-Peak (p-p) is a calculation of the difference between the highest positive peak and the lowest negative peak of a recorded sine wave. The p-p value is calculated as two times the peak value.
• Gravitational acceleration (g) is the acceleration experienced naturally by objects in earth’s gravitational field. It is approximately equal to 9.80665 m/s2.
Mounting Basics Connecting Sensor to HI-913 Platform
1. Mating surfaces of the mounting platform and sensor should be flat, parallel and free of dirt, paint, epoxy, scratches, etc.
2. Threads in platform, sensor and adaptor (if needed) must match to ensure a proper fit and that testing is free of errors. Clean any worn threads with a tap or die and coat them in a silicone grease for best results.
3. An adaptor may be needed to connect the sensor to the armature. The HI-913 platform requires a ¼-28 thread.
4. Silicone grease can be applied to the mating surfaces and threads to ensure good mechanical coupling. This is particularly important when testing at high frequencies.
5. For threaded sensors, please follow the sensor manufacturer’s torque recommendation.
Tightening and Loosening Connections1. When tightening or loosening the connection between the sensor
and the HI-913 mounting platform, secure the mounting platform with the supplied wrench.
2. It is important to keep sensors and fixtures centered and straight when attaching them to the HI-913 mounting platform. This will ensure a stable, even connection and eliminate potential alignment issues.
External Source InputAs an option, it is possible to drive the HI-913 by using an external signal source or a function generator. First, connect a signal source to the External Source BNC Input located on the top right corner of the unit. To enable the EXTERNAL SOURCE IN input, press the FREQUENCY dial to enter the “Calibration Options” menu then rotate FREQUENCY dial to highlight and click on TEST SETTINGS. Next, use FREQUENCY dial to highlight selection next to “Source:” and toggle between “Internal” and “External” by pressing the dial, select “External”.
1. When in external signal mode, the vibration amplitude is measured and displayed on the screen, however, the frequency and amplitude of the shaker is controlled by the external source, not by the HI-913. The frequency of the input signal is not displayed on this mode.
2. The amplitude and sensitivity values displayed on the screen are

Doc# 100929 • HI-913-Shaker • Jan2017-RevC Page 11 of 25
for reference only. The measurements are not accurate while in Ext Sig mode and do not fall under the published specifications for the product.
Do not exceed 1V RMS! Overdriving the unit may cause clipping, unwanted distortion and damage to the unit.
Monitor Reference OutputThe HI-913 is controlled by an internal shear mode quartz reference accelerometer. The voltage output of the reference accelerometer can be monitored through the available Monitor Reference BNC Output by connecting it to a readout device (e.g. voltmeter or oscilloscope).
USB ConnectionThe USB connection for model HI-913 has no functionality unless power supply accessories like HI-913-PS02 24 VDC power supply or HI-913-CALROUTE is ordered. It is used at Metrix, Inc. during the manufacturing and calibration processes.
3. THEORY OF OPERATION
InstrumentationThe Model HI-913 Portable Shaker Table internal electrical system is comprised of several different mechanisms:• Electrodynamic Shaker
• Power Amplifier
• Reference Accelerometer
• Signal Generation Electronics
• Sensor Signal Measurement Electronics
• LCD Digital Display
• Two Dials with Detent and Integrated Push Buttons
• 12 VDC, 4 Amp Hour Solid Gel Battery
• External Charger

Doc# 100929 • HI-913-Shaker • Jan2017-RevC Page 12 of 25
The LCD display continuously shows the frequency of the shaker drive signal and the vibration amplitude of the mounting platform as measured by the reference accelerometer.
The reference accelerometer is a PCB Piezotronics ICP® quartz shear sensor, integrated into the mounting platform. A calibration “standard” maintained by Metrix is used to calibrate the HI-913 as a complete system and provides NIST traceability.
The power amplifier is specially designed to provide the current required to drive the electrodynamic shaker.
The electronic signal processing system produces a variable frequency sine wave, which becomes the source of the driving signal to produce the vibration at the mounting platform.
The frequency of the shaker drive signal is controlled by the front panel FREQUENCY dial. The amplitude of the shaker drive signal is controlled through a feedback loop, to maintain the stability of the actual motion. Adjusting the front panel AMPLITUDE dial adjusts the target vibration amplitude.
Pressing the FREQUENCY dial toggles the frequency units between CPM and Hz. Pressing the FREQUENCY dial one more time enables the External Source Input. Pressing the AMPLITUDE dial toggles the amplitude measurement units through the following choices:
Frequency Acceleration Velocity Displacement
HzCPMExternal Signal
g’s pkg’s RMSm/s2 pkm/s2 RMS
in/s pkin/s RMSmm/s pkmm/s RMS
mils p-pµm p-p

Doc# 100929 • HI-913-Shaker • Jan2017-RevC Page 13 of 25
3.2 Battery and Charger
The Model HI-913 can be operated from AC line power or from its internal rechargeable battery. When the external power supply is connected, it becomes the primary power source, operating the unit while simultaneously charging the battery.
NOTE: It is good practice to perform calibrations on battery power. Disconnecting from line power ensures a power surge will not cause the calibrator to power down during test. If excess current is detected during use, the portable calibrator shuts down to prevent damage.
Battery power is supplied by a sealed solid gel lead acid 12 VDC rechargeable battery. The battery can be permanently damaged if completely drained. To prevent damage, the HI-913 will automatically shut off when the battery power level gets too low. Keeping the battery fully charged ensures the unit is always ready for use.
Under mild operating conditions, a fully charged battery will allow the HI-913 to operate for up to 18 hours. The charge life of the battery depends on both the length of use and the amount of power (dependent upon payload, frequency and amplitude) required for a particular test. When testing requires high vibration levels, the charge life will be shorter than during less rigorous testing. For example, continuous testing of a 100 gram payload at 10 g pk will drain the battery charge in approximately 1 hour.
A “Battery Life” indicator is displayed on the LCD screen to approximate the unit’s remaining charge life. Replacement batteries (Model HI-913 BAT01) and power supplies/chargers (Model HI-913-PS01) are available from Metrix, Inc.
The HI-913 calibrators continuously monitor the state of battery charge during operation, storage and charging. During operation, if the battery capacity falls near minimum, the unit will shut off after approximately 2 minutes of inactivity rather than the usual 20 minutes. During storage, if the battery voltage falls near the minimum, the unit will go into deep sleep, requiring connection of AC power and reset of time and date before resumption of operation. During charging, the unit continuously displays charging indication and state of charge, depending upon operation level and time of charge.
When operating the HI-913 at high amplitudes and heavy payloads with the battery charger plugged in, the current draw to the shaker and amplifier can be large enough to overload the charging circuit resulting in an unstable output signal. Operating the HI-913 under these conditions can result in damage to the electrical components in the system. In order to re-establish a stable output signal, turn down the amplitude level of the HI-913 or unplug the charger.
Battery Information and Care• The unit is delivered in a partially charged state. Fully charge unit for 20 hours
before using for the first time. (The unit cannot be overcharged by keeping it plugged into the power supply.)

Doc# 100929 • HI-913-Shaker • Jan2017-RevC Page 14 of 25
• To recharge the unit, use only the universal power supply included. All batteries lose energy from self-discharge over time and more rapidly at higher temperatures. A full charge cycle can take up to 20 hours.
• If not used for a prolonged period of time, recharge every 2 months.
• Suggested Best Practice: Charge unit fully prior to field use. Recharge the unit as soon as possible after use.
4. SPECIFICATIONS AND PERFORMANCE
General
Frequency Range (operating, 100 gram payload)
7 Hz - 10 kHz 420 - 600 k CPM
Maximum Amplitude (100 Hz no payload)
20 g pk15 in/s pk
50 mils pk-pk
196 m/s2 pk380mm/s pk
1270 µm pk - pkMaximum Payload[1] 800 gram 800 gram
[1] Operating range reduced at higher payloads. Reference manual for full details
Accuracy of ReadoutMEASURED WITH 10 GRAM QUARTZ REFERENCE ACCELEROMETER
Acceleration (30 Hz to 2 kHz) ± 3%Acceleration (7 Hz to 10 kHz) ±1 dBVelocity (10 Hz to 1000 Hz) ± 3%Displacement (30 Hz to 150 Hz) ± 3%Amplitude Linearity (100 gram payload, 100 Hz)
< 1% up to 10 g pk
Waveform Distortion (100 gram payload, 30 Hz to 2 kHz)
< 5% THD (typical) up to 5 g pk

Doc# 100929 • HI-913-Shaker • Jan2017-RevC Page 15 of 25
Units of Readout
Amplitude
Acceleration g pk m/s2 pkg RMS m/s2 RMS
Velocity in/s pk mm/s pk
in/s RMS mm/s RMSDisplacement mils pk-pk µm pk - pk
Frequency Hz mCPMm/s pk Power Requirements
Internal Battery (sealed solid gel lead acid)
12 VDC, 4 amp hours 12 VDC, 4 amp hours
AC Power (for recharging battery)
110 – 240 Volts, 50 - 60 Hz
110 – 240 Volts, 50 - 60 Hz
Operating Battery Life[2]
100 gram payload, 100 Hz, 1 g pk
18 hours
100 gram payload, 100 Hz, 10 g pk
1 hour
[2] As shipped from factory in new condition
Temperature
Operating 32° - 122 °F 0° - 50 °C
Physical
Dimensions (H x W x D) 8.5 in x 12 in x 10 in 22 cm x 30.5 cm x 28 cmWeight 18 pounds 8.2 kgSensor Mounting Platform Thread Size
¼ - 28
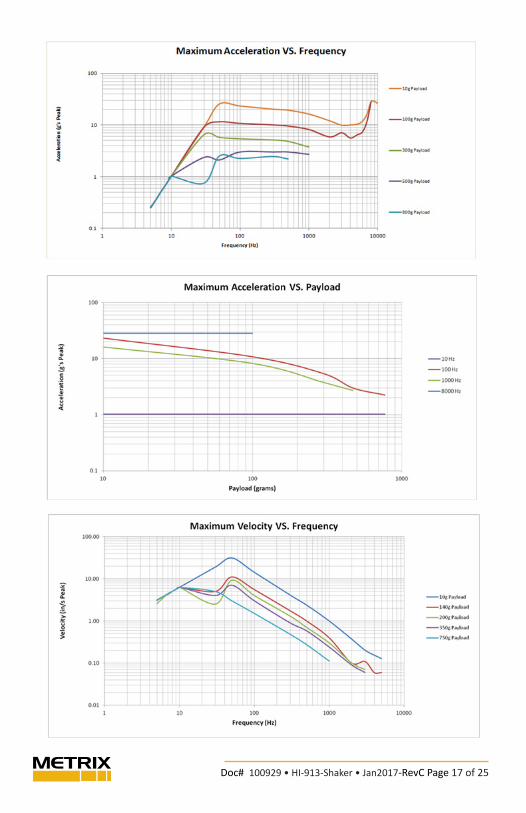
Shaker Loading Maximum advisable vibration levels are dependent upon the maximum frequency of operation and the payload. The chart below shows the maximum vibration levels as a function of both frequency and payloads. Payloads exceeding 800 grams should not be tested on the Model HI-913.
Excessive loads may result in damage to the moving coil and flexure. Care must be taken when testing payloads with large footprints, particularly those with an offset center of gravity. Severe rocking modes can produce high transverse motion and lateral loads on the moving coil and flexure, resulting in damage. When fitting test transducers and fixtures onto the mounting platform, aim to keep the center of gravity directly above, and in line with the center axis of the ¼-28 threaded hole. This is a safeguard against side loading the shaker.

Doc# 100929 • HI-913-Shaker • Jan2017-RevC Page 16 of 25
In some cases of extremely heavy shaker payloads at high vibration levels (depending on the frequency), the HI-913 may exhibit both frequency and amplitude instabilities. In this case, please reduce the excitation amplitude and/or the payload to eliminate the effect.
The HI-913 electronics incorporates a shaker power amplifier with thermal protection. If the shaker payload amplitude and run time exceed safe thermal ranges, the shaker table power amplifier will protect itself and shut off. The unit should be turned off and allowed to cool before resuming operation.
Doc# 100929 • HI-913-Shaker • Jan2017-RevC Page 17 of 25
Doc# 100929 • HI-913-Shaker • Jan2017-RevC Page 18 of 25
5. RECOMMENDED PRACTICES
Operational Verification and Recalibration
As with all calibration systems, periodic verification of the system’s performance is strongly recommended. This is best done by calibrating a dedicated verification accelerometer each day that the unit will be used. This practice confirms proper calibration of the equipment at the time of use.
Results of the verification should be compared to previous results obtained with that dedicated, controlled accelerometer. If the calibration result of the verification sensor changes, the HI-913 should be evaluated further to determine the root cause of the discrepancy.
Field repair of the HI-913 is not possible, so if performance of the HI-913 is out of specification, it should be sent back to Metrix, Inc. for evaluation, repair and recalibration. Please contact Metrix at [email protected] or +1.281.940.1802 for a Return of Material Authorization (RMA) number.
Standard Checks for Transducers
Linearity and frequency response checks should be performed periodically to validate vibration transducer functionality.
Linearity is checked by submitting the sensor to different vibration levels while frequency is kept constant (typically at 100 Hz or any other frequency specified by the transducer’s manufacturer). The vibration is set to different levels within the dynamic range of the sensor, trying to cover (as much as possible) from low to high operating levels. The sensor output is recorded and checked if it remains proportional (linear) to the sensor excitation input. Alternatively, the sensor sensitivity can also be recorded and its deviation observed for the different test points (it should not vary too much for sensors that are linear).
The frequency response of a vibration transducer can be tested by checking the sensor output across different frequency points within the operational frequency range of the transducer. Typically, the vibration level of the unit is set at a constant value (10m/s² and 1g are common choices for accelerometers) and the sensor output (or the sensor sensitivity) is observed and recorded at different frequency points.
Typical Accelerometer & Velocity Sensor Checkout
Accelerometers & velocity sensors are tested by performing a frequency response calibration. This is done by measuring the sensitivity of the sensor at a variety of frequencies within its linear range. Per the ISO 16063-21 accelerometer calibration standard, the amplitude at each frequency is at the discretion of the user and need not be kept consistent. Best practice is to use amplitude safely above the noise floor and but low enough not to create distortion on the shaker. Thus 1.0 g’s peak is the most common amplitude used for 100 mV/g accelerometers.
The ISO 16063-21 standard recommends testing at the center frequencies of the 1/3 octave bands. For accelerometers with 10 kHz high frequency response that

Doc# 100929 • HI-913-Shaker • Jan2017-RevC Page 19 of 25
would mean 29 different test points, which can be time consuming. Accelerometer manufacturers test at far less points. In general as long as the test covers the practical usage of the sensor and the test points are evenly dispersed through the test range the user will perform a good and thorough test of an accelerometer.
A good practice within industrial applications is to follow the American Petroleum Institute Standard 670 “Machinery Protection Systems” recommendations for accelerometer and velocity sensor test points. Standard 670 recommends testing at the following frequencies for both accelerometers and velocity sensors:
• 10, 20, 50, 60, 100, 200, 500, 1000, 2000, 5000 and 10000 Hz
o Model HI-913 is not capable of 61.44 Hz, only integer numbers such as 61 or 62.
For accelerometers the recommended amplitudes in API 670 are:• 0.15 g’s peak (1 m/sec2 RMS) for 10 Hz
• 1 g peak (7 m/sec2 RMS) for 20-1000 Hz
• 4 g’s peak (30 m/sec2 RMS) for 2000-10000 HzFor velocity sensors the recommended amplitudes in API 670 are:
• 0.92 ips peak (15.92 mm/sec RMS) for 10 Hz
• 3.08 ips peak (55.70 mm/sec RMS) for 20 Hz
• 1.23 ips peak (22.28 mm/sec RMS) for 50 Hz
• 0.62 ips peak (11.14 mm/sec RMS) for 100 Hz
• 0.31 ips peak (5.57 mm/sec RMS) for 200 Hz
• 0.12 ips peak (2.23 mm/sec RMS) for 500 Hz
• 0.06 ips peak (1.11 mm/sec RMS) for 1000 Hz
• 0.12 ips peak (2.39 mm/sec RMS) for 2000 Hz
• 0.05 ips peak (0.95 mm/sec RMS) for 5000 Hz
• 0.02 ips peak (0.48 mm/sec RMS) for 1000 Hz
o Note that velocity is not recommended as a vibration measurement scale at frequencies greater than 1000 Hz. Thus many sensor manufacturers install low-pass filters on velocity sensors at 1000 Hz or lower.
Practical Industrial (Predictive Maintenance) Testing Recommendations
While testing to the API 670 or ISO 16063-21 standard is certainly thorough it is not always practical and is time consuming especially for the predictive maintenance user. Thus Metrix makes the following recommendations for industrial vibration:
• For permanent mount accelerometers/velocity sensors routed to an online monitoring system or junction box, at least test the sensors at 1x and 2x running speed and confirm both the vibration alert (high) and alarm (high-high).
• For route-based predictive maintenance where one sensor is magnetically mounted on many machines at many

Doc# 100929 • HI-913-Shaker • Jan2017-RevC Page 20 of 25
points, perform a complete frequency response test of the accelerometer. Its accuracy is important at many frequencies. Test to Fmax on the vibration analyzer. If high frequency bearing fault detection methodologies are in use, test the sensor to the highest possible bearing defect frequency.
o Tip: magnetically mounting sensors greatly reduces high frequency response. A ferrous magnet target, mounting pad, is included with the HI-913. One can install this pad on the shaker and mount accelerometers magnetically. Always rock the sensor in place as one would on the machine. Test the accelerometer to Fmax on the analyzer to see if response is amplified at relevant high frequencies.
5.3 Non-Contact Displacement Sensor Calibration
Non-contact displacement sensors, also known as proximity probes, eddy current probes or simply displacement probes, can be checked for accuracy, linearity and frequency response. Proximity probe systems require the use of the optional proximity probe adaptor kit, shown on the next page. The following sections detail the procedure for performing linearity and frequency response checks on a non-contact displacement sensor.
Non-Contact Displacement Sensor Test Set-Up Note: The calculations in these instructions are based on a 200 mV/mil eddy current proximity probe to provide an example based on nominal sensitivity. In most cases, the proper proximity probe, extension cable, and driver (proximitor®) must be matched in order to obtain the expected output from this type of transducer.[Proximitor is a registered trademark of Bently Nevada.]

Doc# 100929 • HI-913-Shaker • Jan2017-RevC Page 21 of 25
1. Remove the (2) 10-32 pan head screws on the user panel of the portable shaker table (white arrows in picture below).
2. Install the AISI 4140 steel target into the shaker on the mounting platform.

Doc# 100929 • HI-913-Shaker • Jan2017-RevC Page 22 of 25
3. Install the non-contact displacement sensor in the microarm after stringing the probe through the probe bar as shown in the picture below. Please note: An 8 mm non-contact displacement sensor with 3/8 - 24 threaded case will mount directly while a 5 mm non-contact displacement sensor with a ¼ - 28 threaded case requires the supplied bushing. Slide the non-contact displacement sensor into the microarm; tighten the socket head cap screw inside the microarm to lightly squeeze the probe to ensure the probe is held securely.
Carefully lay out the assembly to resolve the required spacer or spacers to hold the non-contact displacement sensor the proper distance from the target as shown below. The non-contact displacement sensor will need to be held so that the sensor will contact the target and must be capable of traveling 100 mils before the micrometer runs out of travel. (for 200 mV/mil probe with 10-90 mils range). Non-contact displacement sensors come in various lengths so adjustability has been designed into the assembly. Attach selected spacer or spacers using setscrews provided, leaving threaded holes exposed.
Socket Head Cap Screw
Set Screw
Doc# 100929 • HI-913-Shaker • Jan2017-RevC Page 23 of 25
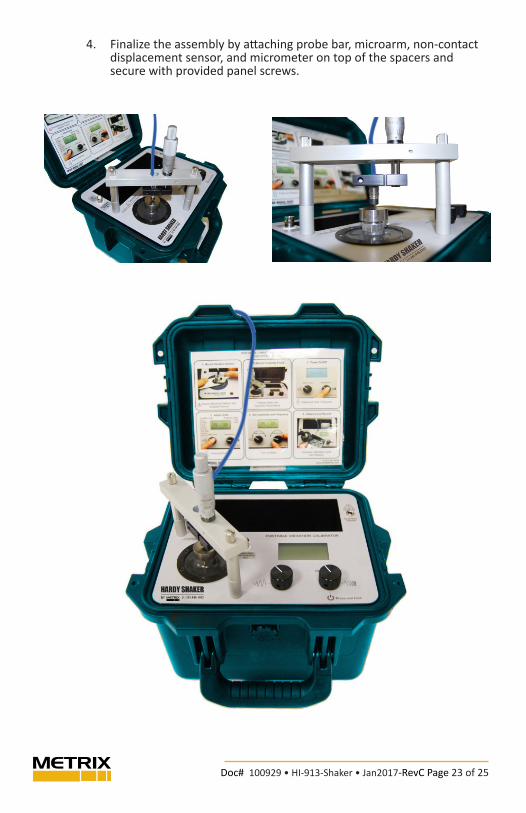
4. Finalize the assembly by attaching probe bar, microarm, non-contact displacement sensor, and micrometer on top of the spacers and secure with provided panel screws.

Doc# 100929 • HI-913-Shaker • Jan2017-RevC Page 24 of 25
Proximity Probe Dynamic Linearity Calibration & Confirmation of Vibration Alarms
IMPORTANT: The HI-913 powers up at the unit’s previous frequency and amplitude settings. Prior to using the HI-913 for calibrating non-contact displacement sensors, set amplitude to a low level to avoid striking the tip of the probe with the target due to previously set large displacements.
1. Mount the proximity probe to the shaker facing the target by following instructions in the previous section.
2. Gap the probe. With the non-contact displacement sensor powered up and the output from the probe driver wired to a voltmeter set to DC voltage, adjust the micrometer so the gap between the probe tip and the steel target is around 50 mils. If you are using a 200 mV/mil proximity probe the voltmeter should read between -8 and -11 Volts DC, typically ~-9 Volts DC is 50 mils. Fifty mils is the typical recommended gap setting for non-contact displacement sensors, ensuring the sensor is in the center of its dynamic range. If the probe is 50 mils from target (or rotating equipment before start-up) it can accurately measure up to 80 mils peak-to-peak vibration. Consult your non-contact displacement sensor’s user manual for additional information.
3. Power-on the shaker by pressing and holding the FREQUENCY dial.4. Test the probe at running speed of the machinery it protects.
Primary vibration issues occur at running speed. Thus ensuring the proximity probe is accurate at running speed is the most practical and confidence-building test. Test speed can be set in Hz or CPM (see Section 2: Operation Guide for instructions) by turning the FREQUENCY dial.
5. Confirm vibration alarms. Press the AMPLITUDE dial to cycle through vibration scales until either mils p-p or µm p-p is displayed. Choose the appropriate scale for your vibration monitoring system. Turn the AMPLITUDE dial, adjusting vibration to the lowest vibration alarm threshold (sometimes called “alert”). Confirm with control room that displayed amplitude on model HI-913 shaker equals value read on monitoring system. Confirm vibration alarm is triggered, making sure to wait long enough for programmed time delays to expire. Repeat the process for each vibration alarm threshold.
Troubleshooting the proximity probe systemIf the vibration alarms did not activate at desired vibration thresholds the most common reason when using proximity probes is incorrect cabling. Advice on troubleshooting follows below. Be sure to read the previous section on confirming vibration alarms by dynamic linearity testing.
• Connect the output of the probe driver to a volt meter measuring AC voltage.
• The volt meter measures in AC voltage RMS. The HI-913 simulates displacement vibration in peak-to-peak scale. Thus one must convert the RMS voltage measurement to peak-to-peak. To do so multiply the measurement on the volt meter by 2.828.
o Example: when shaking target at 5 mils peak-to-peak and 3600 CPM, volt meter measures 353 mV AC. Multiply this number by 2.828 to get 998 mV (353 mV x 2.828 = 998 mV). Proceed to next step.

Doc# 100929 • HI-913-Shaker • Jan2017-RevC Page 25 of 25
• Next, divide the voltage measurement by the amplitude displayed on HI-913. This will calculate the sensitivity of the probe.
o Example continued from above: divide 998 mV by 5.0 mils peak-to-peak to get 199.6 mV/mil (998 mV / 5.0 mils p-p = 199.6 mV/mil)
• For a 5 or 8mm probe, is the sensitivity within 5% of 200 mV/mil? I.e. within 190-210 mV/mil or 7.08–8.66 mV/µm? The monitoring system likely is scaled for 200 mV/mil or 7.87 mV/µm. If alarms did not activate it could be incorrect input sensitivity.
• Incorrect sensitivity is most often caused by incorrect cabling. Check the required length for the probe driver. Then check the length of the extension cable and integral cable on the probe itself. The probe cable length plus extension cable length should equal the required length for the probe driver.
• Make sure the probe was gapped properly prior to the test. See previous section.
• Ensure the proximity probe target is attached to the top of the shaker.
• Does the probe driver have a MOD? If so the probe driver may have been made for a different target material. The standard API 670 recommended target for testing proximity probes is 4140 steel. But custom proximity probe systems, calibrated to alternate materials, require a custom calibration target. Contact Metrix for custom target materials.
Maintenance
Recalibration and certification is recommended on an annual basis. Service of internal parts should only be performed by factory personnel. If the unit is removed from the case, the NIST calibration is void. Recertification can only performed after re-assembly.