Embed Size (px)
Citation preview

Evaluation of Noise Exposures at a Precast Concrete Manufacturer
HHE Report No. 2015-0133-3339
March 2019

Authors: Jessica F. Li, MSPH
Scott E. Brueck, MS, CIH
Desktop Publisher: Jennifer Tyrawski
Editor: Cheryl Hamilton
Industrial Hygiene Field Assistance: Rassull Suarez
Logistics: Donnie Booher, Kevin Moore
Keywords: North American Industry Classification System (NAICS) 328110 (Poured Concrete Foundation and Structure Contractors); New Hampshire; Noise; Hearing Loss; Hearing Protection; Precast Concrete; Concrete Manholes; Concrete Pipes; Concrete; Drycast; Wetcast
Disclaimer
The Health Hazard Evaluation Program investigates possible health hazards in the workplace under the authority of the Occupational Safety and Health Act of 1970 (29 U.S.C. § 669(a)(6)). The Health Hazard Evaluation Program also provides, upon request, technical assistance to federal, state, and local agencies to investigate occupational health hazards and to prevent occupational disease or injury. Regulations guiding the Program can be found in Title 42, Code of Federal Regulations, Part 85; Requests for Health Hazard Evaluations (42 CFR Part 85).
Availability of Report
Copies of this report have been sent to the employer and employees at the plant. The state and local health department and the Occupational Safety and Health Administration Regional Office have also received a copy. This report is not copyrighted and may be freely reproduced.
Recommended Citation
NIOSH [2019]. Evaluation of noise exposures at a precast concrete manufacturer. By Li JF, Brueck SE. Cincinnati, OH: U.S. Department of Health and Human Services, Centers for Disease Control and Prevention, National Institute for Occupational Safety and Health, Health Hazard Evaluation Report 2015-0133-3339, https://www.cdc.gov/niosh/hhe/reports/pdfs/2015-0133-3339.pdf.
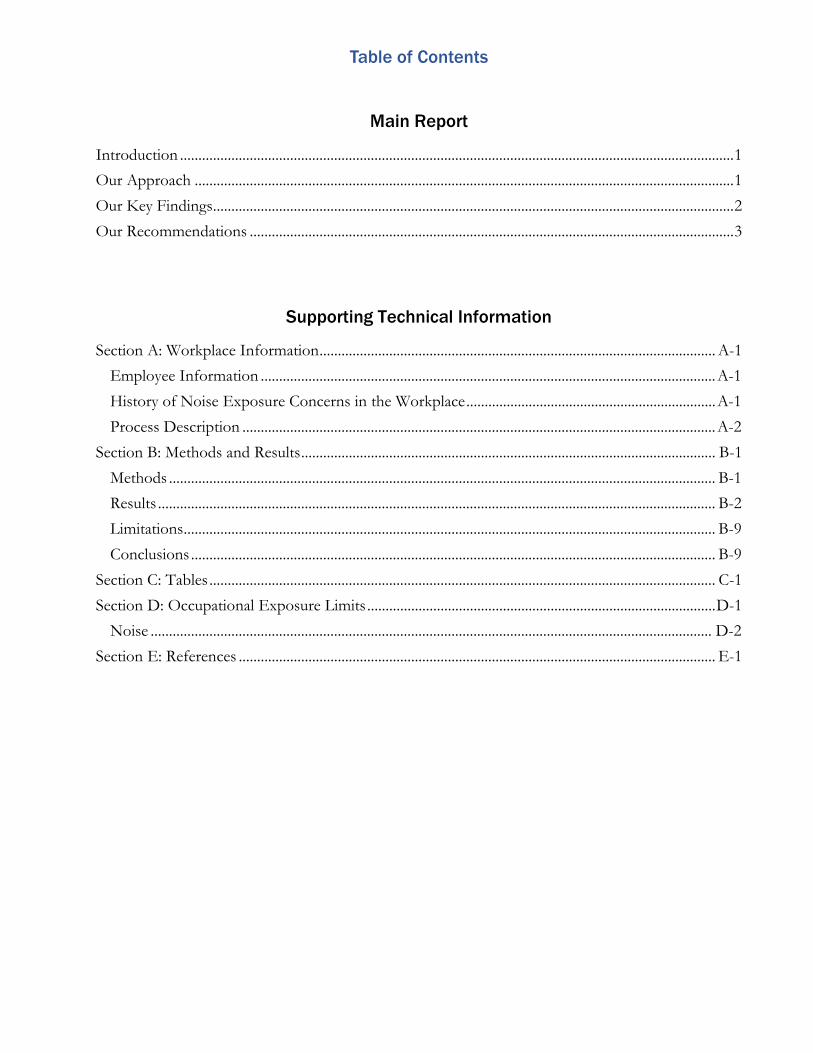
Table of Contents
Main Report
Introduction ....................................................................................................................................................... 1
Our Approach ................................................................................................................................................... 1
Our Key Findings .............................................................................................................................................. 2
Our Recommendations .................................................................................................................................... 3
Supporting Technical Information
Section A: Workplace Information ............................................................................................................ A-1
Employee Information ............................................................................................................................ A-1
History of Noise Exposure Concerns in the Workplace .................................................................... A-1
Process Description ................................................................................................................................. A-2
Section B: Methods and Results ................................................................................................................. B-1
Methods ..................................................................................................................................................... B-1
Results ........................................................................................................................................................ B-2
Limitations ................................................................................................................................................. B-9
Conclusions ............................................................................................................................................... B-9
Section C: Tables .......................................................................................................................................... C-1
Section D: Occupational Exposure Limits ............................................................................................... D-1
Noise ......................................................................................................................................................... D-2
Section E: References .................................................................................................................................. E-1

This page left intentionally blank

1
Introduction
Request
We visited a precast concrete manufacturer to measure employee noise exposures and noise levels in the production areas, and to identify possible noise control options.
Workplace
The company manufactured precast concrete highway barriers, manholes, and other products using drycast and wetcast processes. Drycast concrete manufacturing uses a low water to concrete ratio. Machines vibrate the concrete mix into the form mold. The finished concrete form can be removed from the mold right away for drying which allows for multiple forms to be made quickly. Wetcast concrete manufacturing uses a higher water to concrete ratio and the concrete forms are not removed until they dry inside the mold. We focused mainly on assessing noise during drycast manufacturing. Making a drycast concrete form involved the following steps:
1. Placing the empty mold and wire frame on the drycast vibration table
2. Pouring the concrete mix into the form mold
3. Vibrating the form mold until it is filled with concrete and the concrete has settled
4. Removing the finished form and base plate from the mold
5. Setting the form out to air dry
6. Removing the dried form from the base plate and stacking it for shipment
During our site visit, the drycast and wetcast areas had 20 employees working.
To learn more about the workplace, go to Section A in the Supporting Technical Information
Our Approach
We spent 2 days in the plant in October 2015. During our visit, we gathered information about:
• Work processes and workplace conditions
• Employee exposures to noise
• Noise levels in the production areas
Figure 1. Drycast operator controlling the pouring of concrete into the top cone form mold on the drycast vibration table. Photo by NIOSH.

2
To learn more about our methods, go to Section B in the Supporting Technical Information
Our Key Findings
Employees in all the job titles we monitored were overexposed to noise
• Drycast operators, wetcast operators, wire operators, quality control (QC) mix operators, forklift operators, and supervisors were exposed to noise levels above the National Institute for Occupational Safety and Health (NIOSH) recommended exposure limit.
Figure 2. Range of employees’ full-shift noise exposure results.
• Drycast operators, wetcast operators, and wire operators were exposed to noise levels above the Occupational Safety and Health Administration (OSHA) action level.
• One drycast operator was exposed to noise levels above the OSHA permissible exposure limit.
The Hearing Conservation Program should be improved
• Employees were all included in the program. We reviewed the audiometric (hearing) test results from 2015 for 125 employees.
• 56 employees only had baseline audiograms completed. Most of these (51 out of 56) were completed in either 2014 or 2015.
• 69 employees had a baseline and at least one annual audiogram. Some employees had gaps of time greater than 1 year between audiograms.

3
• 3 of the 69 employees with a baseline and annual audiogram had evidence of an OSHA standard threshold shift (change in hearing). The audiometric test provider only used OSHA criteria to identify hearing threshold shifts. NIOSH criteria are more sensitive and showed that 25 employees had a hearing threshold shift.
• All employees we observed wore foam insert earplugs, but some did not wear the earplugs properly.
To learn more about our results, go to Section B in the Supporting Technical Information
Our Recommendations
The Occupational Safety and Health Act requires employers to provide a safe workplace.
Benefits of Improving Workplace Health and Safety:
Improved worker health and well-being Improved image and reputation
Better workplace morale Better products, processes, and services
Better employee recruiting and retention Could increase overall cost savings
The year before our evaluation, the company made some changes intended to decrease noise exposure among workers. Below, we offer recommendations for further improvements based on the findings of our evaluation. For each recommendation, we list a series of actions you can take to address the issue at your workplace. The actions at the beginning of each list are preferable to the ones listed later. The list order is based on a well-accepted approach called the “hierarchy of controls.” The hierarchy of controls groups actions by their likely effectiveness in reducing or removing hazards. In most cases, the preferred approach is to eliminate hazardous materials or processes and install engineering controls to reduce exposure or shield employees. Until such controls are in place, or if they are not effective or feasible, administrative measures and personal protective equipment might be needed. Read more about the hierarchy of controls at https://www.cdc.gov/niosh/topics/hierarchy/.
We encourage the company to use a health and safety committee to discuss our recommendations and develop an action plan. Both employee representatives and management representatives should be included on the committee. Helpful guidance can be found in “Recommended Practices for Safety and Health Programs” at https://www.osha.gov/shpguidelines/index.html.

4
Recommendation 1: Reduce employees’ noise exposures
Why? Exposure to high noise levels can lead to noise-induced hearing loss. This hearing loss is caused by damage to the nerve cells of the inner ear. Unlike some other types of hearing disorders, it cannot be treated medically.
How? At your workplace, we recommend these specific actions:
Automate the concrete pour cycle so that the drycast operator does not need to stand next to the form mold to monitor the pour. • Moving the operator station farther away from the drycast machine is an option to
automation.
• Keeping proper concrete mix ratios reduces cycle time.
Isolate or enclose noisy equipment or processes to reduce noise exposures. • Construct a 3- or 4-sided booth for the drycast operator to stand in during production.
Use thick, clear acrylic so that the operator can see the drycast machine while in the booth.
• Enclose the drycast hydraulic motor area. Make sure to include a way to prevent heat build-up inside the enclosure.
• Enclose the second level mixer area to separate it from the rest of the drycast operation.
• Separate the wire prep area with a full wall.
Replace the current vibratory motors with frequency drive motors. • Vibratory motors that we observed operated at a single speed, resulting in higher noise
levels when the mold was not full.
• Frequency motors allow operators to slowly increase the speed and vibration as the mold fills with concrete, reducing noise levels.
Properly adjust and service existing equipment to reduce excess noise. • Maintain and keep vibratory motors and the four Acme bolts properly tightened.
• Tighten riser jacket components when they loosen.
• Maintain and properly tighten hydraulic tie-downs. Replace tie-downs when worn.
• Keep the pressure in the air bags under the vibration table between 40–60 pounds per square inch.

5
Consult with noise control engineers skilled in occupational noise reduction for additional guidance on noise controls. • The noise control engineers should be board certified by the Institute of Noise Control
Engineers.
Begin a “Buy Quiet” program to reduce noise by buying new equipment that makes less noise and vibration. • Information on Buy Quiet programs is available at
http://www.cdc.gov/niosh/topics/buyquiet/.
Train employees to use work practices that reduce noise levels. • Show workers how to partially fill the mold during the concrete pour sequence with
about 8–10 inches of concrete before starting drycast vibration.
• Instruct workers to clean the base plates at the end of each shift using steel wool to remove remaining concrete. We observed an employee removing excess concrete with a hammer. This hammering was a major source of noise in the area.
Recommendation 2: Improve the existing hearing conservation program
Why? When hazardous noise exists in the workplace, implementing an effective hearing loss prevention program (also referred to as a hearing conservation program) can help protect workers by assessing noise exposures, reducing noise levels, evaluating and monitoring workers’ hearing, training workers about noise, and providing hearing protection.
Figure 3. Drycast operator using a sledgehammer to loosen and release the base plate from the dried form. Photo by NIOSH.
Figure 4. Employee striking the side of the base plate with a claw hammer to remove excess dried concrete. Photo by NIOSH.

6
How? At your workplace, we recommend these specific actions:
Ensure audiometric testing is completed regularly. • Complete baseline hearing audiograms before employees begin working in high noise
areas.
• Make sure that audiograms are repeated every year.
• Include the measured noise exposure levels by job title in each employee’s audiometric test record.
Use both NIOSH and OSHA criteria to identify hearing threshold shifts to improve early detection of potential hearing loss. • Refer to NIOSH audiometric evaluation and monitoring recommendations at
http://www.cdc.gov/niosh/docs/98-126/ for more information on audiometric testing and hearing loss prevention programs.
Conduct noise measurement surveys after installing noise controls. • Conduct noise measurement surveys whenever a process changes or when new
equipment is installed to see if employees’ exposures and noise levels have been reduced enough.
Advise employees to report any hearing problems to their healthcare provider and to the company.
Improve the use of personal hearing protection. • Make sure that employees always wear hearing protection; if ear plugs are used, be sure
they are properly inserted.
• Provide hands-on training for all employees and supervisors on how to insert hearing protectors properly and the importance of proper hearing protector fit.
• Offer employees a variety of hearing protectors so they can wear what feel most comfortable.
• Give employees hearing protector fit testing to find out the noise attenuation (reduction) of protectors worn by plant employees.

Supporting Technical Information
Evaluation of Noise Exposures at a Precast Concrete Manufacturer
HHE Report No. 2015-0133-3339
March 2019
A-1
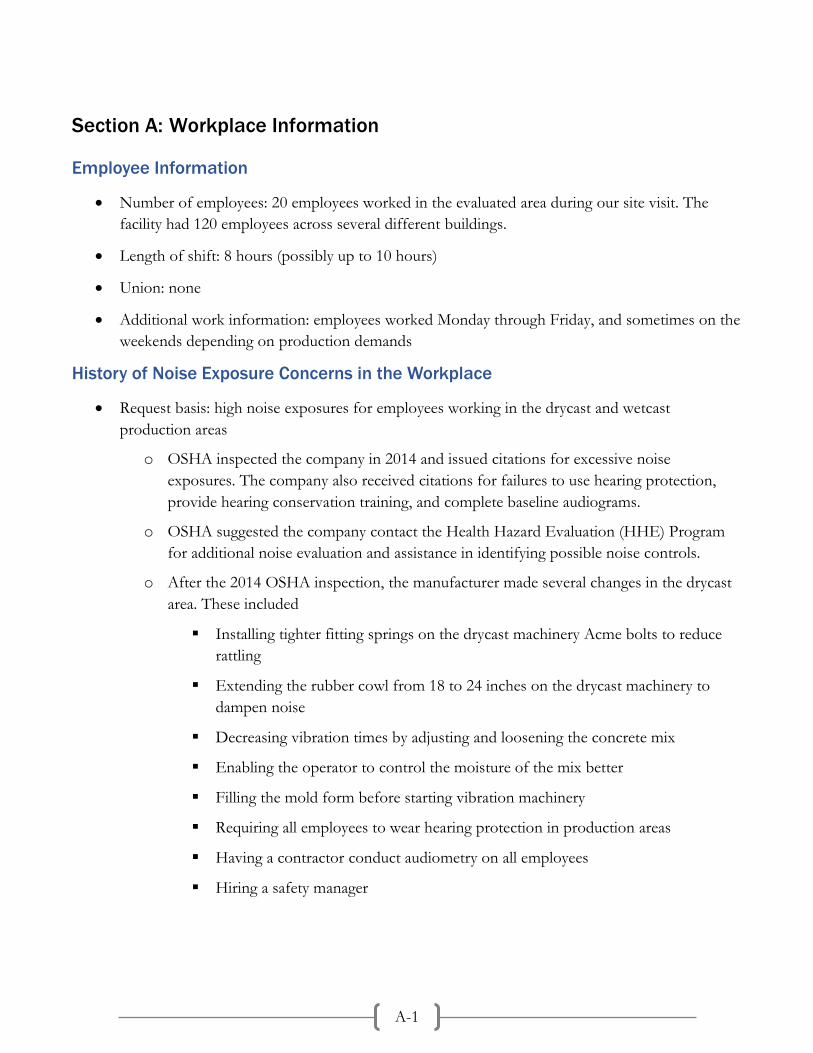
Section A: Workplace Information
Employee Information
• Number of employees: 20 employees worked in the evaluated area during our site visit. The facility had 120 employees across several different buildings.
• Length of shift: 8 hours (possibly up to 10 hours)
• Union: none
• Additional work information: employees worked Monday through Friday, and sometimes on the weekends depending on production demands
History of Noise Exposure Concerns in the Workplace
• Request basis: high noise exposures for employees working in the drycast and wetcast production areas
o OSHA inspected the company in 2014 and issued citations for excessive noise exposures. The company also received citations for failures to use hearing protection, provide hearing conservation training, and complete baseline audiograms.
o OSHA suggested the company contact the Health Hazard Evaluation (HHE) Program for additional noise evaluation and assistance in identifying possible noise controls.
o After the 2014 OSHA inspection, the manufacturer made several changes in the drycast area. These included
Installing tighter fitting springs on the drycast machinery Acme bolts to reduce rattling
Extending the rubber cowl from 18 to 24 inches on the drycast machinery to dampen noise
Decreasing vibration times by adjusting and loosening the concrete mix
Enabling the operator to control the moisture of the mix better
Filling the mold form before starting vibration machinery
Requiring all employees to wear hearing protection in production areas
Having a contractor conduct audiometry on all employees
Hiring a safety manager

A-2
Process Description
As seen in Figure A1, the production area consisted of the drycast and wetcast areas. A concrete wall with a passageway separated the two areas. The drycast area had four drycast machines; two of these were used during our visit. The wetcast area had two wetcast machines. The wire prep area was located next to the drycast area. This area was partially enclosed with a concrete wall measuring about 8-feet high, 16-feet wide, and 4-inches thick (denoted by the dashed line in Figure A1). Wire frames, which were placed in empty molds before the molds were filled with concrete mix, were welded together in the wire prep area. The form drying and storage area was also located next to the drycast area. In this area, finished concrete forms were set out to dry and then stored for transport out of the plant.
Figure A1. Diagram of production area. A dashed line represents a partial wall. Figure by NIOSH.
Drycast In the drycast concrete process, the concrete form can be removed from the mold right after filling, allowing for multiple pieces to be made quickly in succession using the same mold. The drycast process used concrete with a lower water to concrete ratio than the wetcast process, but required machinery that generated vertical and centrifugal vibrations to move and settle the concrete into the mold. Several form molds were used for casting different concrete pieces. Concrete forms made during the site visit included top cones, risers, and top slabs of varying dimensions.
A quality control/mixer operator used a computer-controlled mixer to prepare the concrete mix, which was then transported to the drycast hopper by a conveyor. One drycast operator used an overhead crane to move the form mold into place on top of the drycast machinery, and placed a wire frame inside the mold. A second drycast operator filled the drycast hopper from the conveyor, poured the concrete into the form mold from the drycast hopper, and controlled the vibration table machinery which vibrated the mold as concrete was poured in. Once filled, the finished concrete form with base plate was removed from the mold by the first drycast operator using an overhead crane, and the form was set out to dry in the storage area.
Once the forms were dry, drycast operators removed them from the base plate and used manual overhead cranes to stack them for shipment. The safety manager reported that the majority of noise came from the vibration of machinery used in the drycast process.
A-3
Wetcast In the wetcast concrete process, the concrete forms dried in the mold before removal. The wetcast process used a higher water to concrete ratio than the drycast process. Small pencil vibrators helped settle the concrete mix in the mold. Pencil vibrators generated less noise than the equipment used in the drycast process.

B-1
Section B: Methods and Results
The objectives of our evaluation were to:
• Measure precast concrete employees’ full-shift time-weighted average (TWA) noise exposures
• Evaluate noise frequency characteristics of the precast concrete machinery
• Identify potential noise control options
• Review the company hearing conservation program and employee audiograms
Methods
We gathered information about workers’ noise exposures and their work environment by (1) reviewing existing documents; (2) measuring employees’ noise exposures; (3) measuring area sound levels; and (4) observing work processes and workplace conditions.
We reviewed the following documents:
• OSHA 300 log of work-related injuries and illnesses
• Summary of audiometric test results
• OSHA citation issued in 2014
We took full-shift TWA personal noise exposure measurements:
• Number taken: 12 employees over two shifts
• Where: drycast and wetcast work areas
• Noise monitoring equipment: Larson Davis Spark™ model 706RC integrating noise dosimeters
o We placed the dosimeter microphone on the top of the employee’s shoulder at the midpoint between the neck and edge of the shoulder.
o We collected noise data using three different settings to compare against the NIOSH recommended exposure limit (REL), the OSHA permissible exposure limit (PEL), and the OSHA action level (AL).
We took instantaneous area sound levels:
• Where: drycast, wetcast, wire prep, form drying and storage areas
• Noise measurement equipment: Larson Davis Model 824 integrating sound level meter
o We measured one-third octave band noise frequency levels (i.e., measurement of noise levels across 30 different frequencies).
o We positioned the instrument at a height of about 5 feet above the floor and within 3–6 feet of the employees or the primary noise source in the area.
B-2
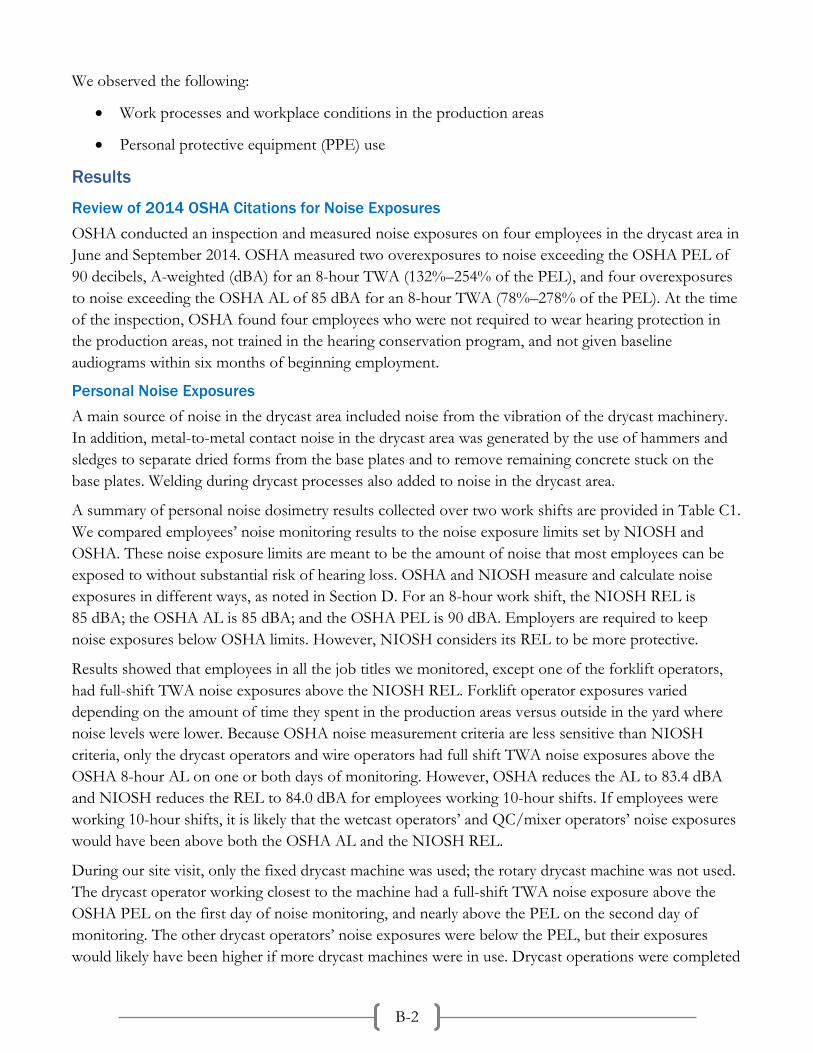
We observed the following:
• Work processes and workplace conditions in the production areas
• Personal protective equipment (PPE) use
Results
Review of 2014 OSHA Citations for Noise Exposures OSHA conducted an inspection and measured noise exposures on four employees in the drycast area in June and September 2014. OSHA measured two overexposures to noise exceeding the OSHA PEL of 90 decibels, A-weighted (dBA) for an 8-hour TWA (132%–254% of the PEL), and four overexposures to noise exceeding the OSHA AL of 85 dBA for an 8-hour TWA (78%–278% of the PEL). At the time of the inspection, OSHA found four employees who were not required to wear hearing protection in the production areas, not trained in the hearing conservation program, and not given baseline audiograms within six months of beginning employment.
Personal Noise Exposures A main source of noise in the drycast area included noise from the vibration of the drycast machinery. In addition, metal-to-metal contact noise in the drycast area was generated by the use of hammers and sledges to separate dried forms from the base plates and to remove remaining concrete stuck on the base plates. Welding during drycast processes also added to noise in the drycast area.
A summary of personal noise dosimetry results collected over two work shifts are provided in Table C1. We compared employees’ noise monitoring results to the noise exposure limits set by NIOSH and OSHA. These noise exposure limits are meant to be the amount of noise that most employees can be exposed to without substantial risk of hearing loss. OSHA and NIOSH measure and calculate noise exposures in different ways, as noted in Section D. For an 8-hour work shift, the NIOSH REL is 85 dBA; the OSHA AL is 85 dBA; and the OSHA PEL is 90 dBA. Employers are required to keep noise exposures below OSHA limits. However, NIOSH considers its REL to be more protective.
Results showed that employees in all the job titles we monitored, except one of the forklift operators, had full-shift TWA noise exposures above the NIOSH REL. Forklift operator exposures varied depending on the amount of time they spent in the production areas versus outside in the yard where noise levels were lower. Because OSHA noise measurement criteria are less sensitive than NIOSH criteria, only the drycast operators and wire operators had full shift TWA noise exposures above the OSHA 8-hour AL on one or both days of monitoring. However, OSHA reduces the AL to 83.4 dBA and NIOSH reduces the REL to 84.0 dBA for employees working 10-hour shifts. If employees were working 10-hour shifts, it is likely that the wetcast operators’ and QC/mixer operators’ noise exposures would have been above both the OSHA AL and the NIOSH REL.
During our site visit, only the fixed drycast machine was used; the rotary drycast machine was not used. The drycast operator working closest to the machine had a full-shift TWA noise exposure above the OSHA PEL on the first day of noise monitoring, and nearly above the PEL on the second day of monitoring. The other drycast operators’ noise exposures were below the PEL, but their exposures would likely have been higher if more drycast machines were in use. Drycast operations were completed

B-3
about 2 hours before the end of the shift on the second day, but employees stayed until the end of the shift doing cleaning and maintenance tasks. These tasks had lower noise levels than normal drycast production. As a result, the drycast operators’ overall TWA noise exposures were somewhat less on the second day of monitoring.
Our noise exposure measurements were slightly lower than previous noise measurements taken by OSHA. This could have resulted from the changes made to the drycast machinery and processes following the OSHA inspections in June and September 2014. Noise measurement differences could also be due to production differences or number of production equipment operating.
Noise in Drycast Area Figure B1 shows the sound level profile for one vibration cycle for a top cone form. These sound level measurements, taken near the drycast operator, showed that sound levels were 100–102 dBA at the beginning of the vibration, decreased to 96–99 dBA as the form mold filled with concrete, and then decreased to about 86 dBA after the one-minute vibration cycle was complete. During the first day of the site visit, the plant made 60 top cones. The number of cones manufactured can vary day-to-day, depending on product demand.
Figure B1. Time history sound level profile showing the sound levels during one vibration cycle for a top cone at the drycast operator’s position.
Workplace noise is usually broadband noise that is distributed over a wide range of frequencies. However, noise from equipment, processes, and work activities can also have unique frequency-specific characteristics. For analysis of frequency distribution characteristics of workplace noise, the frequency spectrum is broken into smaller frequency bands called bandwidths, the most common being the octave band, which is defined as a frequency band where the upper band frequency is twice the lower band-edge frequency. The one-third octave band further divides each of the single octave bands into three smaller frequency bands to provide even more detailed information about the noise frequency
B-4
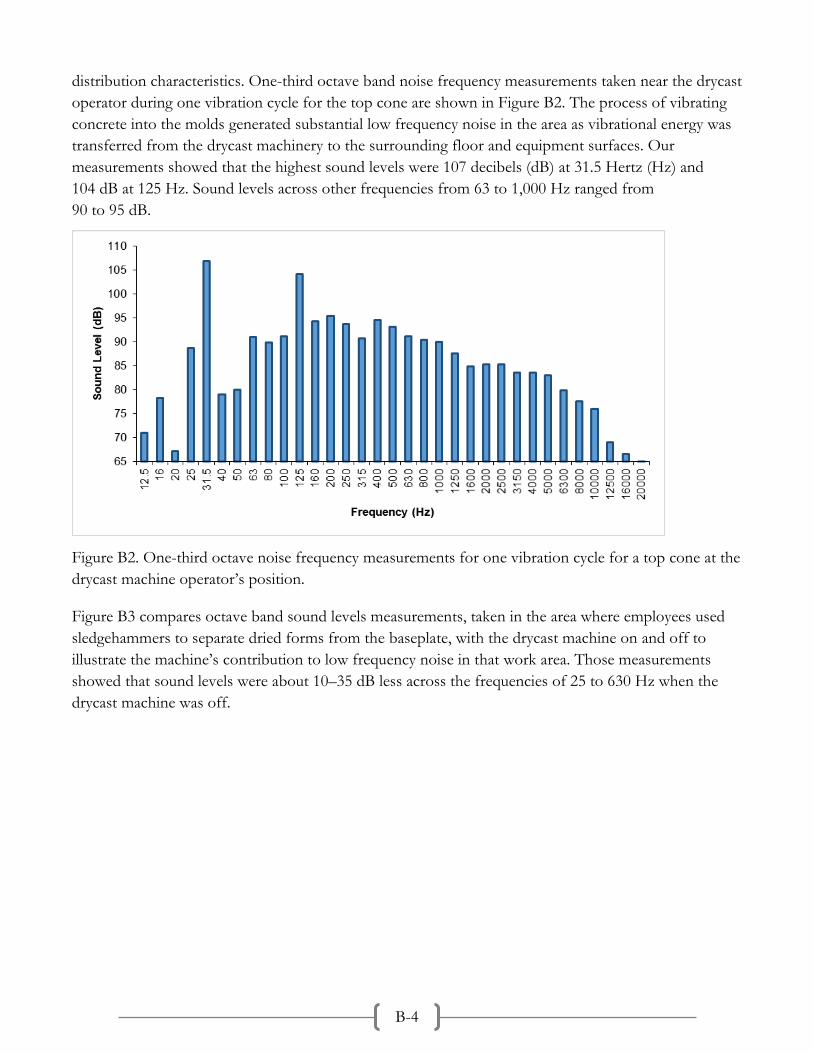
distribution characteristics. One-third octave band noise frequency measurements taken near the drycast operator during one vibration cycle for the top cone are shown in Figure B2. The process of vibrating concrete into the molds generated substantial low frequency noise in the area as vibrational energy was transferred from the drycast machinery to the surrounding floor and equipment surfaces. Our measurements showed that the highest sound levels were 107 decibels (dB) at 31.5 Hertz (Hz) and 104 dB at 125 Hz. Sound levels across other frequencies from 63 to 1,000 Hz ranged from 90 to 95 dB.
Figure B2. One-third octave noise frequency measurements for one vibration cycle for a top cone at the drycast machine operator’s position.
Figure B3 compares octave band sound levels measurements, taken in the area where employees used sledgehammers to separate dried forms from the baseplate, with the drycast machine on and off to illustrate the machine’s contribution to low frequency noise in that work area. Those measurements showed that sound levels were about 10–35 dB less across the frequencies of 25 to 630 Hz when the drycast machine was off.
B-5
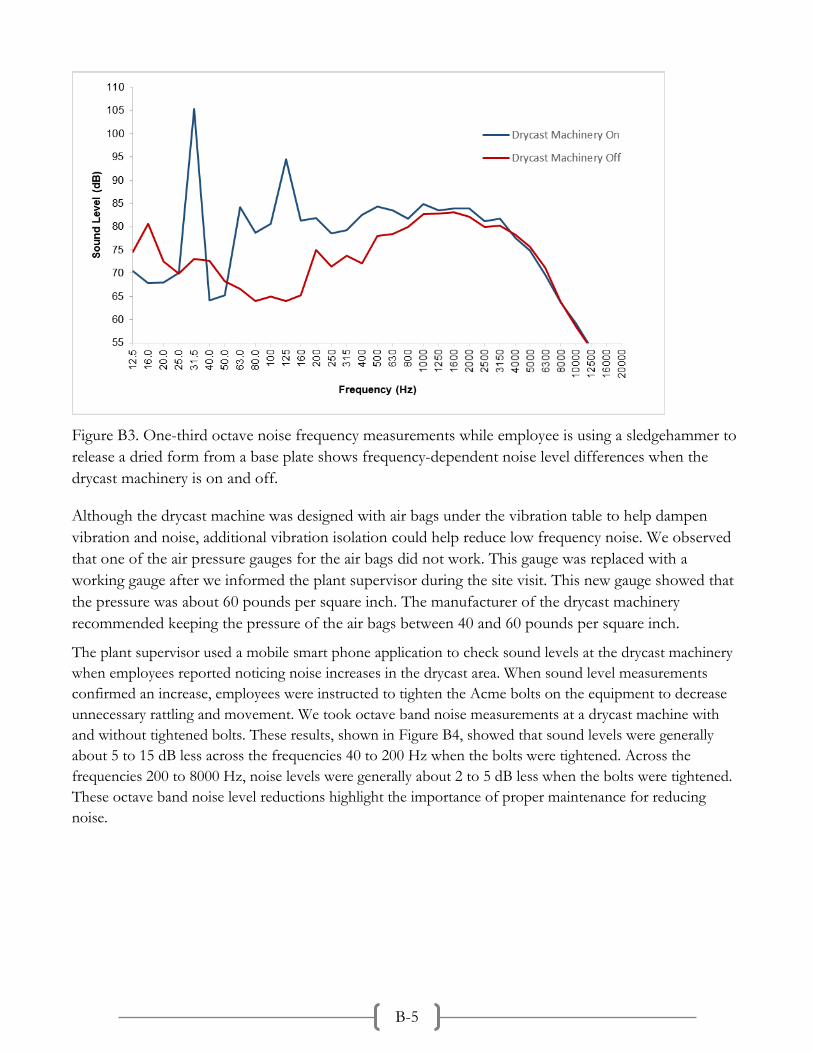
Figure B3. One-third octave noise frequency measurements while employee is using a sledgehammer to release a dried form from a base plate shows frequency-dependent noise level differences when the drycast machinery is on and off.
Although the drycast machine was designed with air bags under the vibration table to help dampen vibration and noise, additional vibration isolation could help reduce low frequency noise. We observed that one of the air pressure gauges for the air bags did not work. This gauge was replaced with a working gauge after we informed the plant supervisor during the site visit. This new gauge showed that the pressure was about 60 pounds per square inch. The manufacturer of the drycast machinery recommended keeping the pressure of the air bags between 40 and 60 pounds per square inch.
The plant supervisor used a mobile smart phone application to check sound levels at the drycast machinery when employees reported noticing noise increases in the drycast area. When sound level measurements confirmed an increase, employees were instructed to tighten the Acme bolts on the equipment to decrease unnecessary rattling and movement. We took octave band noise measurements at a drycast machine with and without tightened bolts. These results, shown in Figure B4, showed that sound levels were generally about 5 to 15 dB less across the frequencies 40 to 200 Hz when the bolts were tightened. Across the frequencies 200 to 8000 Hz, noise levels were generally about 2 to 5 dB less when the bolts were tightened. These octave band noise level reductions highlight the importance of proper maintenance for reducing noise.

B-6
Figure B4. One-third octave noise frequency measurements showing the difference in noise levels at the drycast machinery with and without tightened Acme bolts.
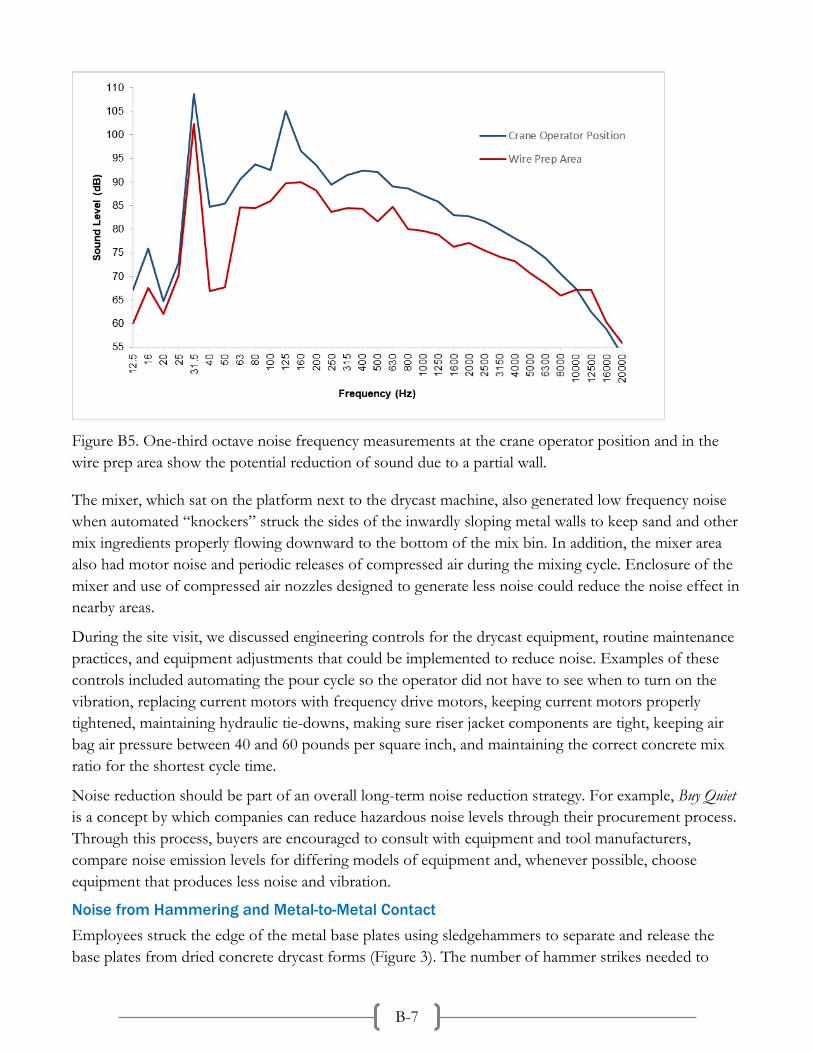
Noise generated by the drycast machinery also contributed to noise levels in nearby work areas, such as the wire prep area. In general, low frequency noise travels greater distances because of its long wavelength and transmission through surfaces. Higher frequency noise has a shorter wavelength, does not travel long distances, and can be lessened using barriers or enclosures. Although the wire prep area was right next to the drycast machinery, the area was partially enclosed with a concrete wall. We compared the overall sound levels and the one-third octave band noise frequency levels in the wire prep area with measurements taken near the crane operator, who stood 5 to 10 feet away from the drycast machinery. This partial barrier wall reduced some of the noise in the wire prep area that had been generated by the adjacent drycast machinery. Octave band noise frequency measurements showed that across the frequencies 40 to 8,000 Hz sound levels were generally about 10–20 dB less in the wire prep area (Figure B5). These results illustrate that noise controls, such as barrier walls or other enclosures, can reduce noise exposures from drycast equipment. More extensive noise controls (e.g., a full wall or complete enclosure) could further reduce noise exposures.
B-7
Figure B5. One-third octave noise frequency measurements at the crane operator position and in the wire prep area show the potential reduction of sound due to a partial wall.
The mixer, which sat on the platform next to the drycast machine, also generated low frequency noise when automated “knockers” struck the sides of the inwardly sloping metal walls to keep sand and other mix ingredients properly flowing downward to the bottom of the mix bin. In addition, the mixer area also had motor noise and periodic releases of compressed air during the mixing cycle. Enclosure of the mixer and use of compressed air nozzles designed to generate less noise could reduce the noise effect in nearby areas.
During the site visit, we discussed engineering controls for the drycast equipment, routine maintenance practices, and equipment adjustments that could be implemented to reduce noise. Examples of these controls included automating the pour cycle so the operator did not have to see when to turn on the vibration, replacing current motors with frequency drive motors, keeping current motors properly tightened, maintaining hydraulic tie-downs, making sure riser jacket components are tight, keeping air bag air pressure between 40 and 60 pounds per square inch, and maintaining the correct concrete mix ratio for the shortest cycle time.
Noise reduction should be part of an overall long-term noise reduction strategy. For example, Buy Quiet is a concept by which companies can reduce hazardous noise levels through their procurement process. Through this process, buyers are encouraged to consult with equipment and tool manufacturers, compare noise emission levels for differing models of equipment and, whenever possible, choose equipment that produces less noise and vibration.
Noise from Hammering and Metal-to-Metal Contact Employees struck the edge of the metal base plates using sledgehammers to separate and release the base plates from dried concrete drycast forms (Figure 3). The number of hammer strikes needed to

B-8
separate the base plates varied, but generally ranged from 4 to 12 strikes. Sound level measurements during sledgehammer use reached 108 dBA.
After the base plate was separated from the finished drycast form, employees used claw hammers to strike and remove the dried concrete residue that had remained on the base plate (Figure 4). The manufacturer of the drycast machinery told us that cleaning the base plates with steel wool, followed by an application of oil, would reduce the amount of residual concrete left on the plate after the form was removed. This would decrease the need to hammer on the base plates, and also lead to less plate damage caused by hammer strikes. In addition, dried forms release more easily from the base plates when the base plates are cleaned and oiled daily, reducing the hammer strikes needed to remove the forms from the plate.
Hearing Conservation Program and Audiograms The company had a hearing conservation program that included all plant employees. Audiometric testing was done by an external contractor who came onsite with a mobile test van. The company began regularly keeping records of annual audiometric test results in 2014. Before testing, the test provider collected hearing history on employees including recent ear infections, ringing in the ears, medical procedures on the ears, use of medications that could affect hearing, possible sources of noise exposures outside of work, previous employment or military service with noise exposures, and use of hearing protection when working in noisy areas. Testing was done at the audiometric frequencies of 500 Hz; 1000 Hz; 2000 Hz; 3000 Hz; 4000 Hz; 6000 Hz; and 8000 Hz. The audiometric test provider retested employees identified with an OSHA-defined standard threshold shift (STS) to confirm whether the shift was persistent [29 CFR 1910.95]. An occupational audiologist reviewed the test results of employees with a persistent shift and informed the company on whether additional audiologic evaluation was advisable. The test provider also identified and recommended further audiologic evaluations on employees with substantial hearing loss in one or more of their speech frequencies when revealed on the baseline audiogram. Each employee was given a copy of his or her hearing test results, information on how to interpret the results, and recommendations on further evaluation, if recommended. The test provider also gave video training to employees. This training included information on hearing mechanisms; noise exposure sources: how noise affects hearing; selection, use, and care of hearing protection; and reasons for hearing protection use. The safety manager provided instruction on how to properly insert and use hearing protection.
We reviewed the audiometric testing summary report of audiometric test results from 2015 for 125 employees. In addition to the audiometric test results from 2015, the report included audiometric history. Of the 125 employees with audiograms, 56 had only baseline audiograms, most (51 of 56) of which were completed in 2014 or 2015. Sixty-nine employees had a baseline and at least one annual audiogram. We noted gaps greater than 1 year sometimes occurred between audiograms. Of the 69 employees with a baseline and at least one annual audiogram, 1 employee had an OSHA STS that was confirmed by retesting, two employees had evidence of an STS but retesting had not been completed to confirm whether the STS was persistent, and 2 employees had an initial indication of an STS but confirmation testing showed that the STS was not persistent.
B-9
Twenty-five of the 69 employees with a baseline and at least one annual audiogram showed a NIOSH-defined significant hearing threshold shift [NIOSH 1998]. However, the audiometric test provider did not evaluate audiograms using NIOSH criteria to identify NIOSH-defined significant threshold shifts. NIOSH recommends, as good practice, that employees with annual audiograms showing a significant hearing threshold shift be immediately retested to verify the shift and, if verified, re-tested again within 30 days to confirm the shift. Because confirmation testing of audiometric results was not completed, some of these NIOSH threshold shifts may not have persisted. These results indicate that audiometric test results should be evaluated using NIOSH criteria, in addition to OSHA criteria, to identify hearing thresholds shifts. The greater sensitivity of the NIOSH criteria provides an opportunity for early intervention to prevent progression of hearing loss.
Personal Protective Equipment The company provided Moldex Spark® and 3M™ E-A-R™ Classic™ (noise reduction rating of 29 dB) ear plugs to their employees. Both types of ear plugs were located on top of the first aid supplies, near the employee break room. We observed that all employees in the plant wore hearing protection and most employees wore the E-A-R plugs. Due to the differences in the sizes and shapes of employees’ ear canals, providing a variety of hearing protectors allows employees to wear the ones they feel are the most comfortable and work best for them.
The noise attenuation of insert-type hearing protection by individual users depends on several factors, including the type of hearing protector, the shape of the user’s ear canal, how well the hearing protector fits, and if the hearing protector is inserted properly. Hearing protectors do not typically achieve the level of attenuation equal to the manufacturer’s noise reduction rating. In addition, we saw that some employees did not fully insert their earplugs or inserted them incorrectly, which can substantially reduce the hearing protector’s attenuation. To help improve the proper selection of hearing protectors, several hearing protection manufacturers have developed methods for fit testing employees to find the attenuation they actually receive from the hearing protectors they use.
Limitations
Limitations of our evaluation include the cross-sectional design of the evaluation. Cross-sectional studies collect information on exposures and health outcomes at the same time, so that causality cannot be proven. Further, industrial hygiene sampling can only document exposures on the days of sampling in the locations sampled.
Conclusions
Employees’ TWA noise exposures in all of the job titles monitored exceeded the NIOSH REL. All drycast operators we monitored exceeded the OSHA AL, and one drycast operator exceeded the OSHA PEL. We observed that all employees working in the plant wore hearing protection, but we observed instances of improper use. We recommend installing engineering noise controls, maintaining equipment to eliminate rattling from loose parts, consulting with equipment manufacturers to reduce equipment noise, and implementing a Buy Quiet program to reduce noise exposures by replacing old with new equipment that generates less noise and vibration.

C-1
Section C: Tables
Table C1. Time-weighted average personal noise exposure results (dBA) Day Job Title Duration*
(hours:minutes) Results based on NIOSH REL
criteria
Results based on OSHA AL
criteria
Results based on OSHA PEL
criteria 1 Drycast operator 1 8:12 95.1 91.4 90.2
Drycast operator 2 8:13 93.9 88.1 86.3 Drycast operator 3 8:15 93.0 89.0 87.6 Drycast operator 4 8:16 92.3 88.6 86.6 Wetcast operator 1 7:59 91.2 83.5 80.1 Wetcast operator 2 7:58 85.5 80.6 74.7
Wire operator 1 8:01 91.1 85.8 83.0 Wire operator 2 8:02 87.9 84.5 81.3
Supervisor 8:03 89.8 83.0 80.1 QC/mixer operator 8:12 88.8 83.7 80.4 Forklift operator 1 7:45 85.7 80.8 74.8 Forklift operator 2 7:51 84.0 80.2 73.1
2 Drycast operator 1 7:56 94.8 91.5 89.9 Drycast operator 2 7:54 92.5 86.8 83.7 Drycast operator 3 7:49 91.8 88.3 86.3 Drycast operator 4 7:53 87.1 83.7 79.2 Wetcast operator 1 6:02 86.2 80.9 74.7 Wetcast operator 2 6:09 88.6 83.0 78.9
Wire operator 1 7:56 88.1 83.8 79.8 Wire operator 2 7:48 90.3 84.6 79.9
Supervisor 7:52 87.4 81.9 78.8 QC/mixer operator 5:59 86.4 81.6 77.3 Forklift operator 1 7:58 86.6 82.2 77.3 Forklift operator 2 7:56 79.0 74.7 59.2
Noise exposure limits (8-hour work shift) 85 85 90 *Results over the specified occupational exposure limit are in bold †Noise exposure measurements of less than 8 hours duration are assumed to represent 8-hour time-weighted average exposures, on the basis of employees' typical work activities during their full work shift

D-1
Section D: Occupational Exposure Limits
NIOSH investigators refer to mandatory (legally enforceable) and recommended occupational exposure limits (OELs) for chemical, physical, and biological agents when evaluating workplace hazards. OELs have been developed by federal agencies and safety and health organizations to prevent adverse health effects from workplace exposures. Generally, OELs suggest levels of exposure that most employees may be exposed to for up to 10 hours per day, 40 hours per week, for a working lifetime, without experiencing adverse health effects. However, not all employees will be protected if their exposures are maintained below these levels. Some may have adverse health effects because of individual susceptibility, a pre-existing medical condition, or a hypersensitivity (allergy). In addition, some hazardous substances act in combination with other exposures, the general environment, or medications or personal habits of the employee to produce adverse health effects. Most OELs address airborne exposures, but some substances can be absorbed directly through the skin and mucous membranes.
Most OELs are expressed as a TWA exposure. A TWA refers to the average exposure during a normal 8- to 10-hour workday. Some chemical substances and physical agents have recommended short-term exposure limits ceiling values. Unless otherwise noted, the short-term exposure limit is a 15-minute TWA exposure. It should not be exceeded at any time during a workday. The ceiling limit should not be exceeded at any time.
In the United States, OELs have been established by federal agencies, professional organizations, state and local governments, and other entities. Some OELs are legally enforceable limits; others are recommendations.
• The U.S. Department of Labor OSHA permissible exposure limits (29 CFR 1910 [general industry]; 29 CFR 1926 [construction industry]; and 29 CFR 1917 [maritime industry]) are legal limits. These limits are enforceable in workplaces covered under the Occupational Safety and Health Act of 1970.
• NIOSH RELs are recommendations based on a critical review of the scientific and technical information and the adequacy of methods to identify and control the hazard. NIOSH RELs are published in the NIOSH Pocket Guide to Chemical Hazards [NIOSH 2010]. NIOSH also recommends risk management practices (e.g., engineering controls, safe work practices, employee education/training, PPE, and exposure and medical monitoring) to minimize the risk of exposure and adverse health effects.
• Another set of OELs commonly used and cited in the United States is the ACGIH TLVs. The TLVs are developed by committee members of this professional organization from a review of the published, peer-reviewed literature. TLVs are not consensus standards. They are considered voluntary exposure guidelines for use by industrial hygienists and others trained in this discipline “to assist in the control of health hazards” [ACGIH 2019].

D-2
Outside the United States, OELs have been established by various agencies and organizations and include legal and recommended limits. The Institut für Arbeitsschutz der Deutschen Gesetzlichen Unfallversicherung (Institute for Occupational Safety and Health of the German Social Accident Insurance) maintains a database of international OELs from European Union member states, Canada (Québec), Japan, Switzerland, and the United States. The database, available at http://www.dguv.de/ifa/GESTIS/GESTIS-Internationale-Grenzwerte-für-chemische-Substanzen-limit-values-for-chemical-agents/index-2.jsp, contains international limits for more than 2,000 hazardous substances and is updated periodically.
OSHA requires an employer to furnish employees a place of employment free from recognized hazards that cause or are likely to cause death or serious physical harm [Occupational Safety and Health Act of 1970 (Public Law 91–596, sec. 5(a)(1))]. This is true in the absence of a specific OEL. It also is important to keep in mind that OELs may not reflect current health-based information
When multiple OELs exist for a substance or agent, NIOSH investigators generally encourage employers to use the lowest OEL when making risk assessment and risk management decisions.
Noise
Noise-induced hearing loss (NIHL) is an irreversible condition that progresses with noise exposure. It is caused by damage to the nerve cells of the inner ear and cannot be treated medically [Berger et al. 2003]. More than 22 million U.S. workers are estimated to be exposed to workplace noise levels above 85 dBA [Tak et al. 2009]. NIOSH estimates that workers exposed to an average daily noise level of 85 dBA over a 40-year working lifetime have an 8% excess risk of material hearing impairment. This excess risk increases to 25% for an average daily noise exposure of 90 dBA [NIOSH 1998]. NIOSH defines material hearing impairment as an average of the hearing threshold levels for both ears that exceeds 25 dB at frequencies of 1000 Hz, 2000 Hz, 3000 Hz, and 4000 Hz.
Although hearing ability commonly declines with age, exposure to excessive noise can increase the rate of hearing loss. In most cases, NIHL develops slowly from repeated exposure to noise over time, but the progression of hearing loss is typically the greatest during the first several years of noise exposure. NIHL can also result from short-duration exposures to high noise levels or even from a single exposure to an impulse noise or a continuous noise, depending on the intensity of the noise and the individual’s susceptibility to NIHL [Berger et al. 2003]. Noise-exposed workers can develop substantial NIHL before it is clearly recognized. Even mild hearing losses can impair a person’s ability to understand speech and hear many important sounds. In addition, some people with NIHL also develop tinnitus. Tinnitus is a condition in which a person perceives sound in one or both ears, but no external sound is present. Persons with tinnitus often describe hearing ringing, hissing, buzzing, whistling, clicking, or chirping like crickets. Tinnitus can be intermittent or continuous and the perceived volume can range from soft to loud. Currently, there is no cure for tinnitus [Levine and Oron 2015].
The preferred unit for reporting noise measurements is dBA. A-weighting is used because it approximates the “equal loudness perception characteristics of human hearing for pure tones relative to a reference of 40 dB at a frequency of 1,000 Hz” and is considered to provide a better estimation of hearing loss risk than using unweighted or other weighting measurements [Berger et al. 2003]. The
D-3
OSHA noise standard specifies a PEL of 90 dBA and an AL of 85 dBA, both as 8-hour TWAs. Exposure to impulsive noise should never exceed 140 dBA.
For noise exposure measurements, NIOSH uses an 80 dBA threshold and a 3-dB exchange rate. Noise below the threshold level is not integrated by the noise dosimeter during measurements. The exchange rate expresses how much the sound level could increase or decrease while keeping the risk of hearing loss the same, if the exposure duration was simultaneously decreased or increased. For example, a 3-dB exchange rate requires that noise exposure time be halved for each 3-dB increase in noise levels. NIOSH considers noise measured using the 3-dB exchange rate to more accurately relate noise exposures to hearing loss risk [NIOSH 1998]. Using this criteria, an employee can be exposed to 88 dBA for no more than 4 hours, 91 dBA for 2 hours, 94 dBA for 1 hour, 97 dBA for 0.5 hours, and so on. For extended work shifts NIOSH adjusts the REL to 84.5 dBA for a 9-hour shift, 84.0 dBA for a 10-hour shift, 83.6 dBA for an 11-hour shift, and 83.2 dBA for a 12-hour work shift. When noise exposures exceed the REL, NIOSH recommends the use of hearing protection and implementation of a hearing loss prevention program [NIOSH 1998].
OSHA uses a 90 dBA threshold and a 5-dB exchange rate for the PEL measurements and an 80 dBA threshold and 5-dB exchange rate for the AL measurements. Using the OSHA criteria, an employee may be exposed to noise levels of 95 dBA for no more than 4 hours, 100 dBA for 2 hours, 105 dBA for 1 hour, 110 dBA for 0.5 hours, and so on. OSHA does not adjust the PEL for extended work shifts. However, the AL is adjusted to 84.1 dBA for a 9-hour shift, 83.4 dBA for a 10-hour shift, 82.7 dBA for an 11-hour shift, and 82.1 dBA for a 12-hour work shift. OSHA requires implementation of a hearing conservation program when noise exposures exceed the AL [29 CFR 1910.95].
Employees exposed to noise should have baseline and yearly hearing tests to evaluate their hearing thresholds and determine whether their hearing has changed over time. Hearing testing should be done in a quiet location, such as an audiometric test booth where background noise does not interfere with the accurate measurement of hearing thresholds. In workplace hearing conservation programs, hearing thresholds must be measured at 500 Hz; 1,000 Hz; 2,000 Hz; 3,000 Hz; 4,000 Hz; and 6,000 Hz. Additionally, NIOSH recommends testing at 8,000 Hz [NIOSH 1998].
The OSHA hearing conservation standard requires analysis of changes from baseline hearing thresholds to determine if the changes are substantial enough to meet OSHA criteria for a standard threshold shift. OSHA defines a standard threshold shift as a change in hearing threshold (relative to the baseline hearing test) of an average of 10 dB or more at 2,000 Hz; 3,000 Hz; and 4,000 Hz in either ear [29 CFR 1910.95]. If a standard threshold shift occurs, the company must determine if the hearing loss also meets the requirements to be recorded on the OSHA Form 300 Log of Work-Related Injuries and Illnesses [29 CFR 1904.1]. In contrast to OSHA, NIOSH defines a significant threshold shift as a change in the hearing threshold level of 15 dB or more (relative to the baseline hearing test) at any test frequency in either ear measured twice in succession [NIOSH 1998].
E-1
Section E: References
Health Effects of Noise
Berger EH, Royster LH, Royster JD, Driscoll DP, Layne M, eds. [2003]. The noise manual. 5th rev. ed. Fairfax, VA: American Industrial Hygiene Association.
Tak S, Davis RR, Calvert GM [2009]. Exposure to hazardous workplace noise and use of hearing protection devices among U.S. workers—NHANES, 1999–2004. Am J Ind Med 52(5):358–371, http://dx.doi.org/10.1002/ajim.20690.
Occupational Exposure Limits
ACGIH [2019]. 2019 TLVs® and BEIs®: threshold limit values for chemical substances and physical agents and biological exposure indices. Cincinnati, OH: American Conference of Governmental Industrial Hygienists.
CFR. Code of Federal Regulations. Washington, DC: U.S. Government Printing Office, Office of the Federal Register.
Levine RA, Oron Y [2015]. Tinnitus. In: Aminoff MJ, Boller F, Swaab DF, eds. The human auditory system: fundamental organization and clinical disorders, https://doi.org/10.1016/B978-0-444-62630-1.00023-8.
NIOSH [1998]. Criteria for a recommended standard: occupational noise exposure (revised criteria 1998). Cincinnati, OH: U.S. Department of Health and Human Services, Centers for Disease Control and Prevention, National Institute for Occupational Safety and Health, DHHS (NIOSH) Publication No. 98-126, http://www.cdc.gov/niosh/docs/98-126/pdfs/98-126.pdf.
NIOSH [2010]. NIOSH pocket guide to chemical hazards. Cincinnati, OH: U.S. Department of Health and Human Services, Centers for Disease Control and Prevention, National Institute for Occupational Safety and Health, DHHS (NIOSH) Publication No. 2010-168c, http://www.cdc.gov/niosh/npg/.

This page left intentionally blank

Delivering on the Nation’s promise: Promoting productive workplaces through safety and health research
Get More Information
Find NIOSH products and get answers to workplace safety and health questions:
1-800-CDC-INFO (1-800-232-4636) | TTY: 1-888-232-6348 CDC/NIOSH INFO: cdc.gov/info |cdc.gov/niosh Monthly NIOSH eNews: cdc.gov/niosh/eNews