Embed Size (px)
Citation preview
H.G. Infra Engineering Ltd
Investor Presentation, Nov 2018
We make people move
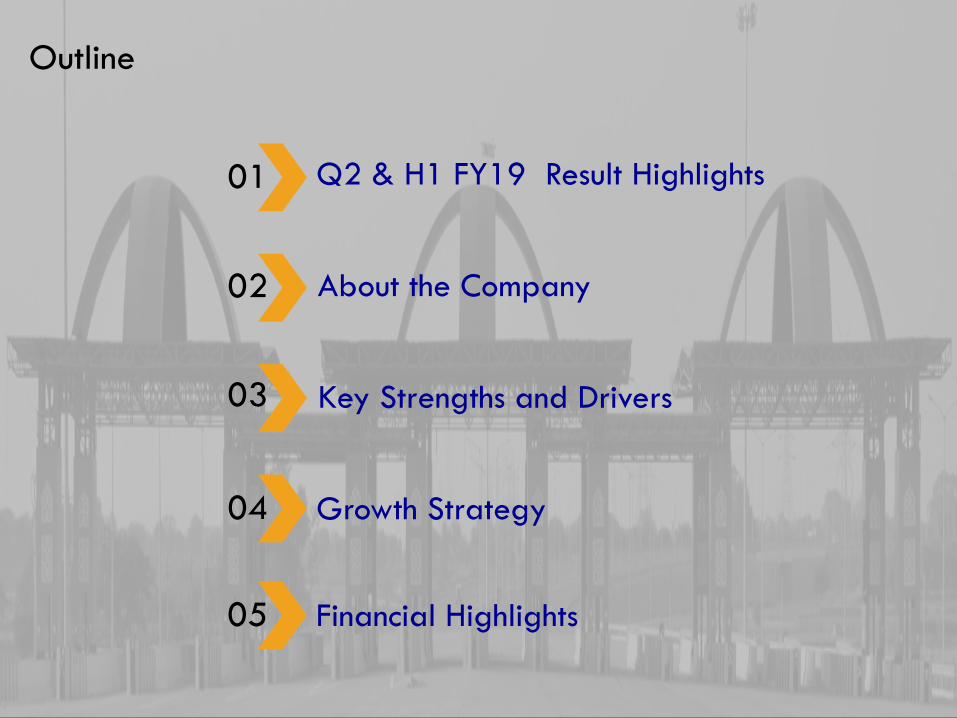
Q2 & H1 FY19 Result Highlights
About the Company
Growth Strategy
Key Strengths and Drivers
01
02
03
04
Outline
Financial Highlights 05
Q2 & H1 FY19 Results Highlights 01
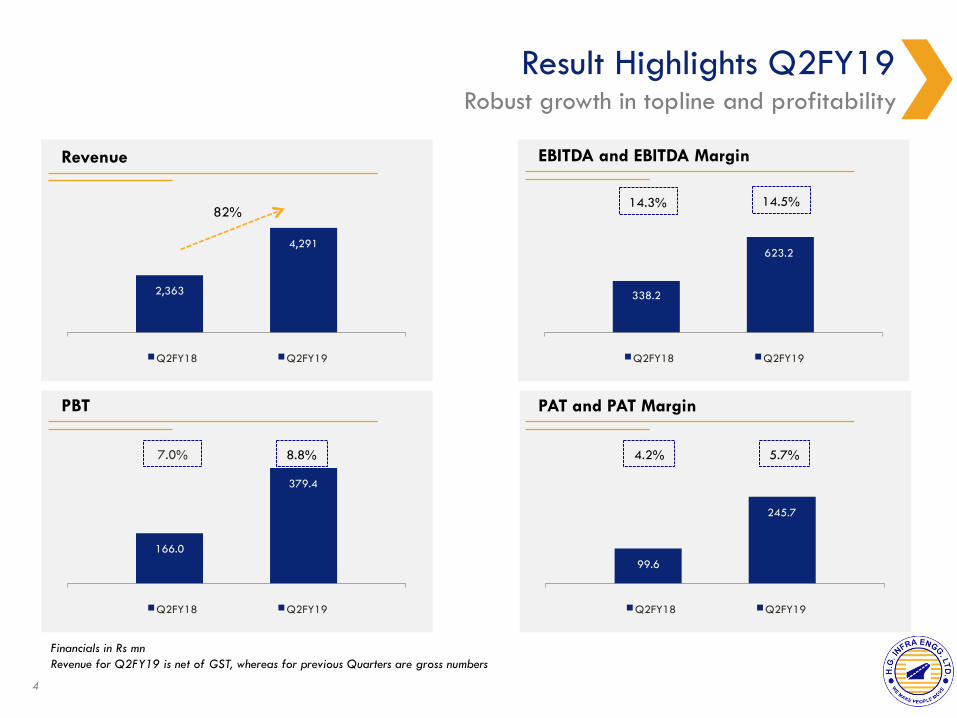
99.6
245.7
Q2FY18 Q2FY19
166.0
379.4
Q2FY18 Q2FY19
7.0% 8.8%
338.2
623.2
Q2FY18 Q2FY19
Result Highlights Q2FY19
2,363
4,291
Q2FY18 Q2FY19
Revenue EBITDA and EBITDA Margin
PBT PAT and PAT Margin
14.3% 14.5%
4.2% 5.7%
Robust growth in topline and profitability
Financials in Rs mn Revenue for Q2FY19 is net of GST, whereas for previous Quarters are gross numbers
82%
4
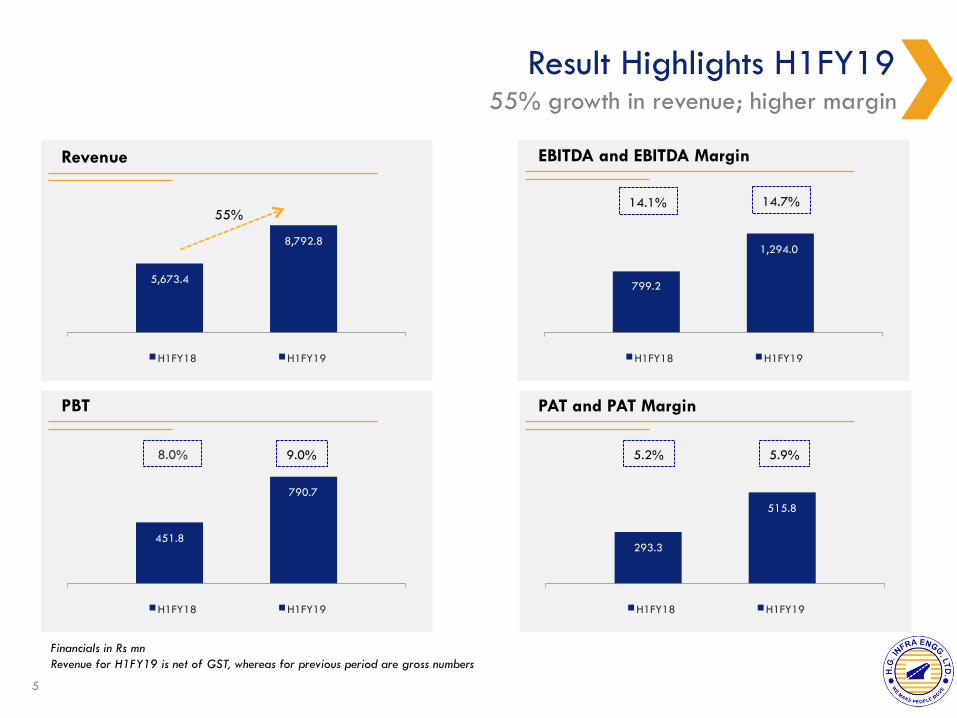
293.3
515.8
H1FY18 H1FY19
451.8
790.7
H1FY18 H1FY19
8.0% 9.0%
799.2
1,294.0
H1FY18 H1FY19
Result Highlights H1FY19
5,673.4
8,792.8
H1FY18 H1FY19
Revenue EBITDA and EBITDA Margin
PBT PAT and PAT Margin
14.1% 14.7%
5.2% 5.9%
55% growth in revenue; higher margin
Financials in Rs mn Revenue for H1FY19 is net of GST, whereas for previous period are gross numbers
55%
5
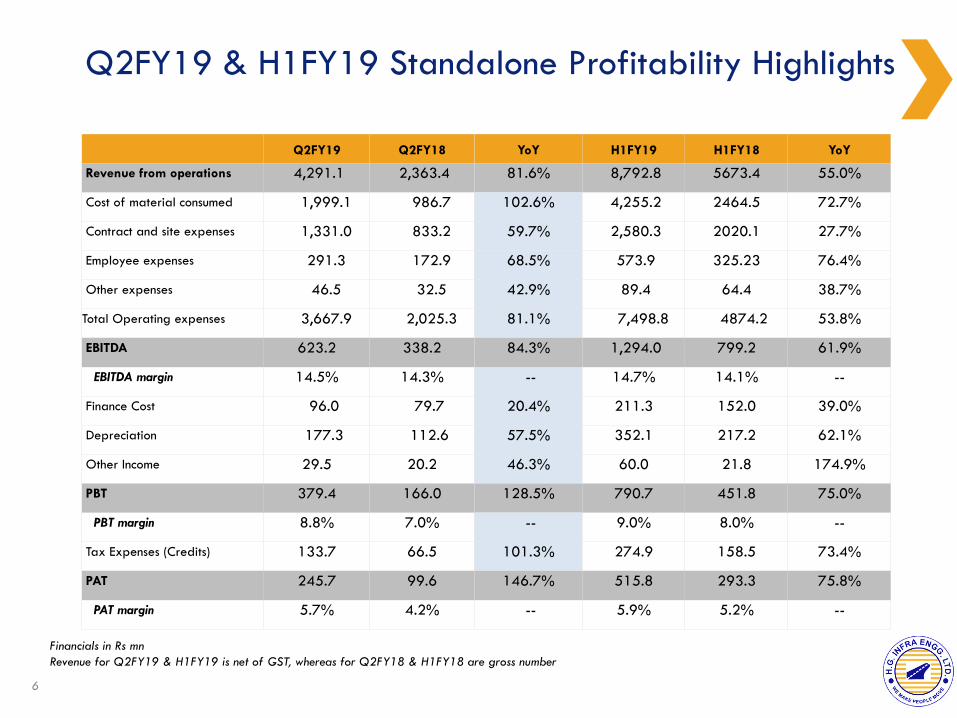
Q2FY19 & H1FY19 Standalone Profitability Highlights
6
Q2FY19 Q2FY18 YoY H1FY19 H1FY18 YoY
Revenue from operations 4,291.1 2,363.4 81.6% 8,792.8 5673.4 55.0%
Cost of material consumed 1,999.1 986.7 102.6% 4,255.2 2464.5 72.7%
Contract and site expenses 1,331.0 833.2 59.7% 2,580.3 2020.1 27.7%
Employee expenses 291.3 172.9 68.5% 573.9 325.23 76.4%
Other expenses 46.5 32.5 42.9% 89.4 64.4 38.7%
Total Operating expenses 3,667.9 2,025.3 81.1% 7,498.8 4874.2 53.8%
EBITDA 623.2 338.2 84.3% 1,294.0 799.2 61.9%
EBITDA margin 14.5% 14.3% -- 14.7% 14.1% --
Finance Cost 96.0 79.7 20.4% 211.3 152.0 39.0%
Depreciation 177.3 112.6 57.5% 352.1 217.2 62.1%
Other Income 29.5 20.2 46.3% 60.0 21.8 174.9%
PBT 379.4 166.0 128.5% 790.7 451.8 75.0%
PBT margin 8.8% 7.0% -- 9.0% 8.0% --
Tax Expenses (Credits) 133.7 66.5 101.3% 274.9 158.5 73.4%
PAT 245.7 99.6 146.7% 515.8 293.3 75.8%
PAT margin 5.7% 4.2% -- 5.9% 5.2% --
Financials in Rs mn Revenue for Q2FY19 & H1FY19 is net of GST, whereas for Q2FY18 & H1FY18 are gross number
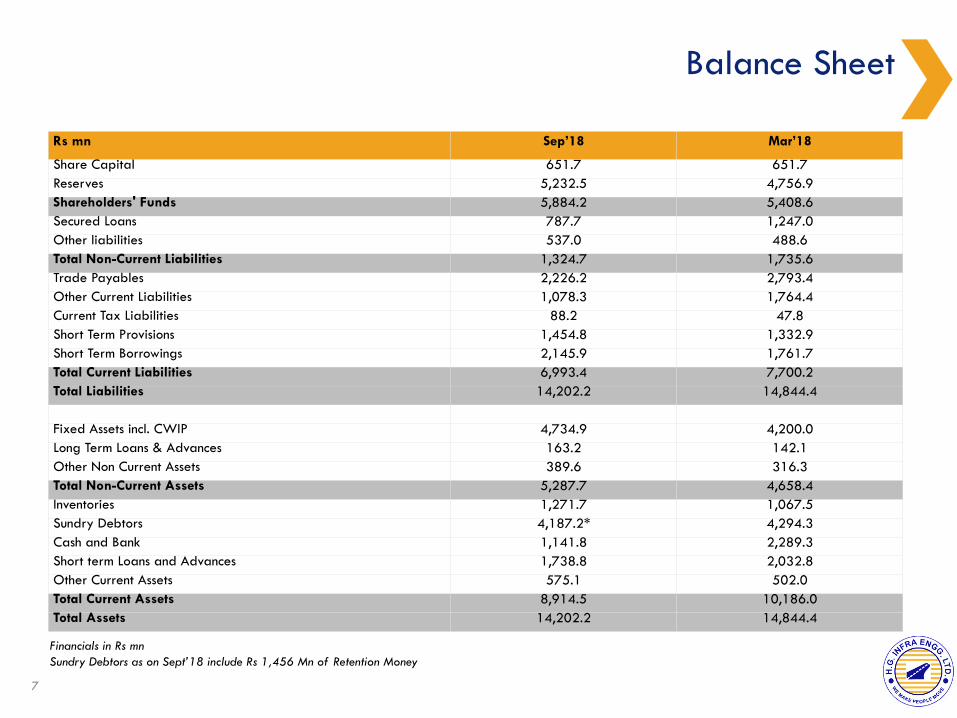
Balance Sheet
7
Rs mn Sep’18 Mar’18
Share Capital 651.7 651.7 Reserves 5,232.5 4,756.9 Shareholders' Funds 5,884.2 5,408.6 Secured Loans 787.7 1,247.0 Other liabilities 537.0 488.6 Total Non-Current Liabilities 1,324.7 1,735.6 Trade Payables 2,226.2 2,793.4 Other Current Liabilities 1,078.3 1,764.4 Current Tax Liabilities 88.2 47.8 Short Term Provisions 1,454.8 1,332.9 Short Term Borrowings 2,145.9 1,761.7 Total Current Liabilities 6,993.4 7,700.2 Total Liabilities 14,202.2 14,844.4
Fixed Assets incl. CWIP 4,734.9 4,200.0 Long Term Loans & Advances 163.2 142.1 Other Non Current Assets 389.6 316.3 Total Non-Current Assets 5,287.7 4,658.4 Inventories 1,271.7 1,067.5 Sundry Debtors 4,187.2* 4,294.3 Cash and Bank 1,141.8 2,289.3 Short term Loans and Advances 1,738.8 2,032.8 Other Current Assets 575.1 502.0 Total Current Assets 8,914.5 10,186.0 Total Assets 14,202.2 14,844.4
Financials in Rs mn Sundry Debtors as on Sept’18 include Rs 1,456 Mn of Retention Money

About the Company 02
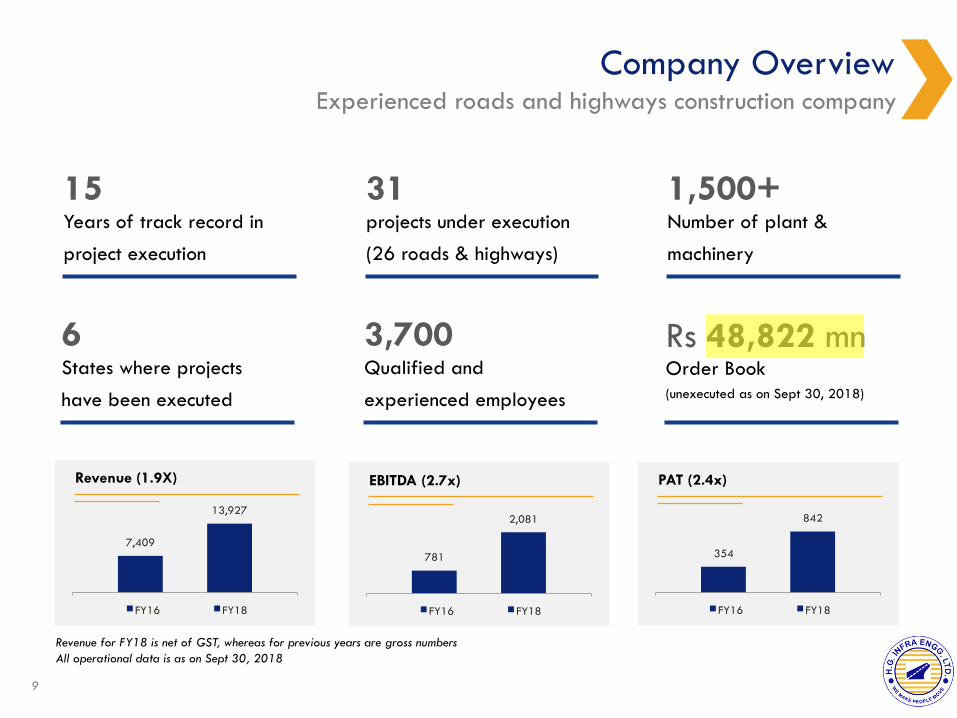
Company Overview Experienced roads and highways construction company
9
Years of track record in
project execution
15 projects under execution
(26 roads & highways)
31 Number of plant &
machinery
1,500+
States where projects
have been executed
6 Qualified and
experienced employees
3,700 Order Book (unexecuted as on Sept 30, 2018)
Rs 48,822 mn
7,409
13,927
FY16 FY18
Revenue (1.9X)
Revenue for FY18 is net of GST, whereas for previous years are gross numbers All operational data is as on Sept 30, 2018
781
2,081
FY16 FY18
EBITDA (2.7x)
354
842
FY16 FY18
PAT (2.4x)
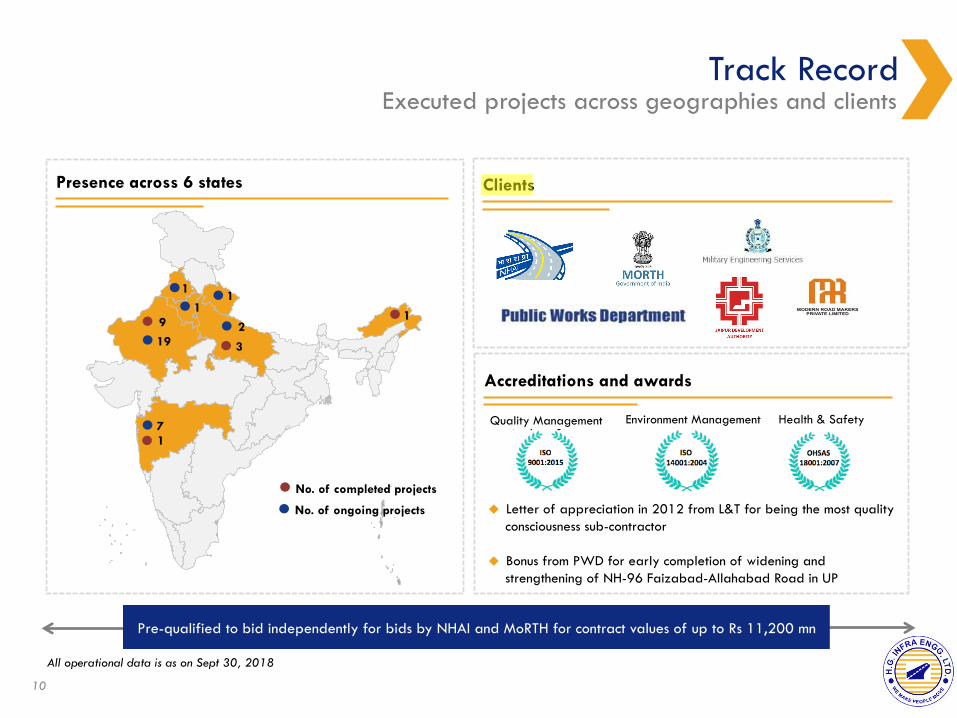
Track Record Executed projects across geographies and clients
10
19
7
1
1 1
9
3
1
No. of completed projects
No. of ongoing projects
Presence across 6 states Clients
Accreditations and awards
u Letter of appreciation in 2012 from L&T for being the most quality consciousness sub-contractor
u Bonus from PWD for early completion of widening and strengthening of NH-96 Faizabad-Allahabad Road in UP
All operational data is as on Sept 30, 2018
Quality Management Environment Management Health & Safety
Pre-qualified to bid independently for bids by NHAI and MoRTH for contract values of up to Rs 11,200 mn
1
2

Milestones Evolved from sub-contractor to main contractor with higher value contracts
11
Incorporated in 2003
2003-08 2010-14 2015-16 2017-18
Executed first sub-contract work of construction of
embankment
Commenced construction of a portion of the Yamuna
Expressway – ~Rs, 1,000mn
Four laning of 49 mm on the Jaipur-Tonk-Deoli section on NH-12 –
~Rs 2,500mn
Four laning of the Warora - Bamni section in Maharashtra – ~Rs 2,600mn
Construction project of four laning of NH-65, on the
Kaithal- Rajasthan border - ~Rs 4,000mn
Executed second renewal coat on the pavement of
six lane Jaipur
7 construction projects in Maharashtra by MoRTH –
~Rs 19,000mn
Powered for high growth: Order book – Rs 48,822 mn Equipment bank – 1,522 nos
Manpower – 3,700 nos
Listed on BSE and NSE
Won first Hybrid Annuity Project in Haryana ~Rs
6,060mn
*Milestones are as per calendar year
Two construction projects from NHAI - ~Rs 4,000mn
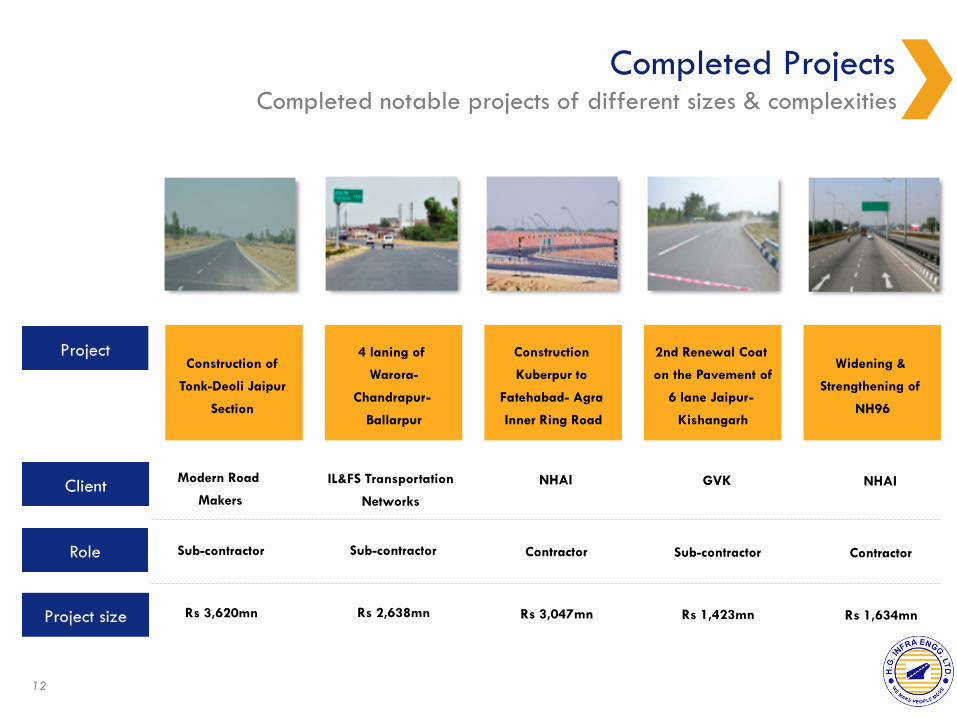
Completed Projects Completed notable projects of different sizes & complexities
12
Project
Client
Role
Project size
Construction of
Tonk-Deoli Jaipur
Section
4 laning of
Warora-
Chandrapur-
Ballarpur
Construction
Kuberpur to
Fatehabad- Agra
Inner Ring Road
2nd Renewal Coat
on the Pavement of
6 lane Jaipur-
Kishangarh
Widening &
Strengthening of
NH96
Modern Road
Makers
IL&FS Transportation
Networks NHAI NHAI GVK
Sub-contractor Sub-contractor Contractor Contractor
Sub-contractor
Rs 3,620mn Rs 2,638mn Rs 1,634mn Rs 3,047mn
Rs 1,423mn
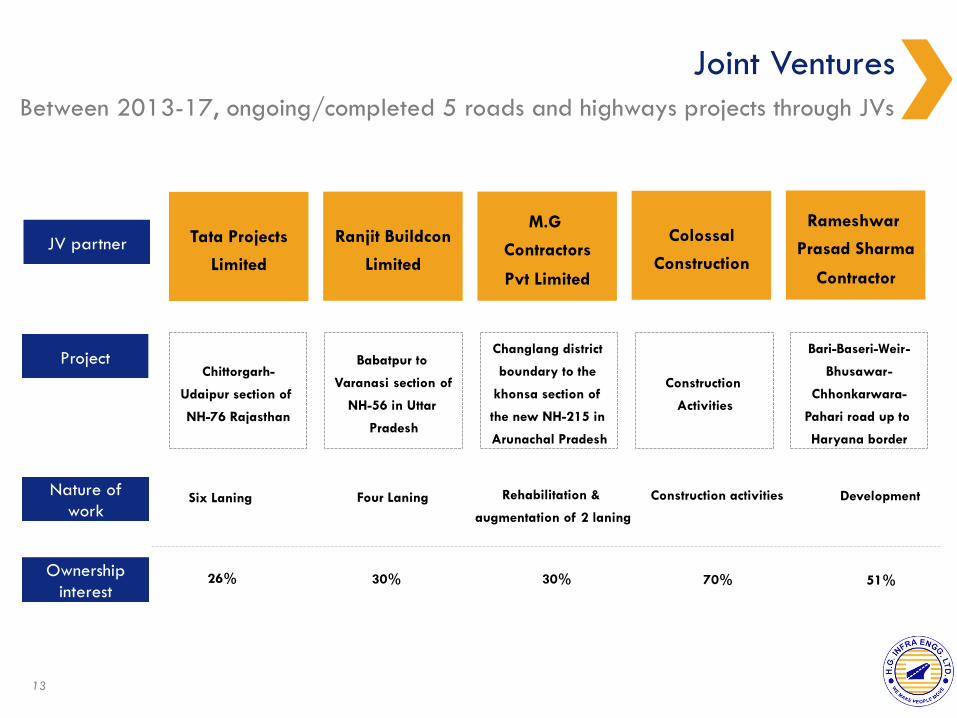
Joint Ventures Between 2013-17, ongoing/completed 5 roads and highways projects through JVs
Project
Nature of work
Ownership interest
Chittorgarh-
Udaipur section of
NH-76 Rajasthan
Babatpur to
Varanasi section of
NH-56 in Uttar
Pradesh
Changlang district
boundary to the
khonsa section of
the new NH-215 in
Arunachal Pradesh
Construction
Activities
Bari-Baseri-Weir-
Bhusawar-
Chhonkarwara-
Pahari road up to
Haryana border
Six Laning Four Laning Development Rehabilitation &
augmentation of 2 laning
Construction activities
51% 30% 70% 26%
JV partner Tata Projects
Limited
Ranjit Buildcon
Limited
M.G
Contractors
Pvt Limited
Colossal
Construction
Rameshwar
Prasad Sharma
Contractor
30%
13
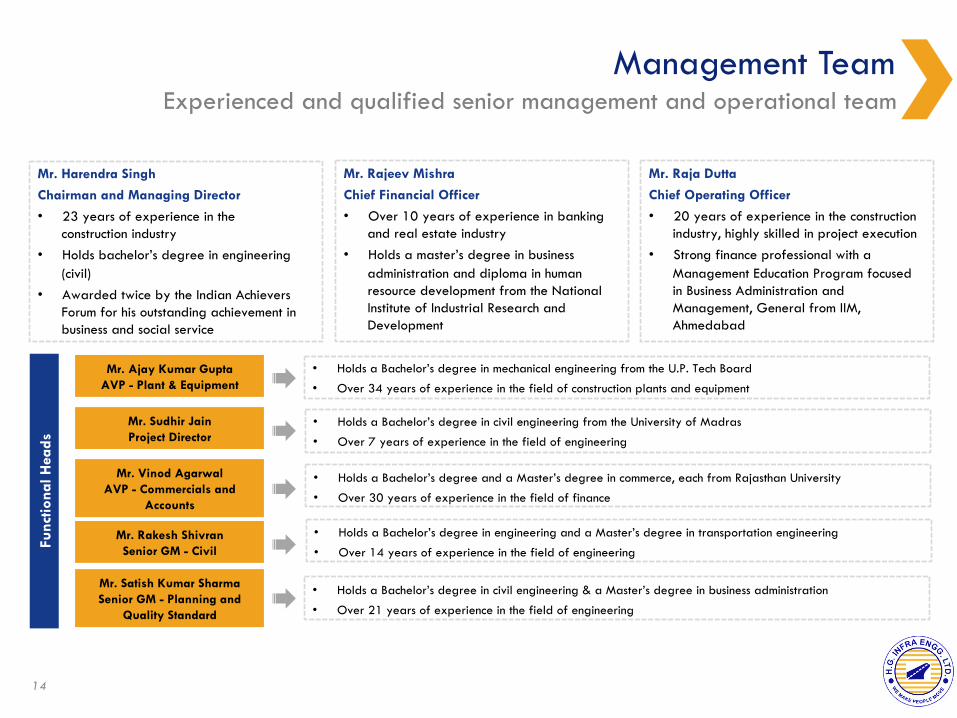
Management Team Experienced and qualified senior management and operational team
14
Func
tiona
l Hea
ds
Mr. Ajay Kumar Gupta AVP - Plant & Equipment
Mr. Sudhir Jain Project Director
Mr. Vinod Agarwal AVP - Commercials and
Accounts
Mr. Rakesh Shivran Senior GM - Civil
Mr. Satish Kumar Sharma Senior GM - Planning and
Quality Standard
• Holds a Bachelor’s degree in mechanical engineering from the U.P. Tech Board
• Over 34 years of experience in the field of construction plants and equipment
• Holds a Bachelor’s degree in civil engineering from the University of Madras
• Over 7 years of experience in the field of engineering
• Holds a Bachelor’s degree and a Master’s degree in commerce, each from Rajasthan University
• Over 30 years of experience in the field of finance
• Holds a Bachelor’s degree in engineering and a Master’s degree in transportation engineering
• Over 14 years of experience in the field of engineering
• Holds a Bachelor’s degree in civil engineering & a Master’s degree in business administration
• Over 21 years of experience in the field of engineering
Mr. Harendra Singh
Chairman and Managing Director
• 23 years of experience in the construction industry
• Holds bachelor’s degree in engineering (civil)
• Awarded twice by the Indian Achievers Forum for his outstanding achievement in business and social service
Mr. Rajeev Mishra
Chief Financial Officer
• Over 10 years of experience in banking and real estate industry
• Holds a master’s degree in business administration and diploma in human resource development from the National Institute of Industrial Research and Development
Mr. Raja Dutta
Chief Operating Officer
• 20 years of experience in the construction industry, highly skilled in project execution
• Strong finance professional with a Management Education Program focused in Business Administration and Management, General from IIM, Ahmedabad
Board of Directors Management supported by independent Board
15
Mr. Vijendra Singh Whole-time Director • 23 years of experience in the construction industry
• Responsible for the overall functioning of the Company
Mr. Ashok Kumar Thakur Independent Director • Holds a master’s degree in commerce from Lucknow University
• Over 37 years of experience in the banking industry
Mr. Onkar Singh Independent Director • Holds a bachelor’s & master’s degree in commerce and philosophy
• Over 20 years of experience in the economic administration and rural development sector
Ms. Pooja Hemant Goyal Independent Director • Holds a bachelor’s degree in commerce a master’s degree in law
• Over 5 years of experience in the legal industry
Ms. Dinesh Kumar Goyal Executive Director • Retired IAS, has more than 40 years experience in working at top level position in
departments such as finance, Energy, Public Works, Road & Highway & others
Key Strengths and Drivers 03
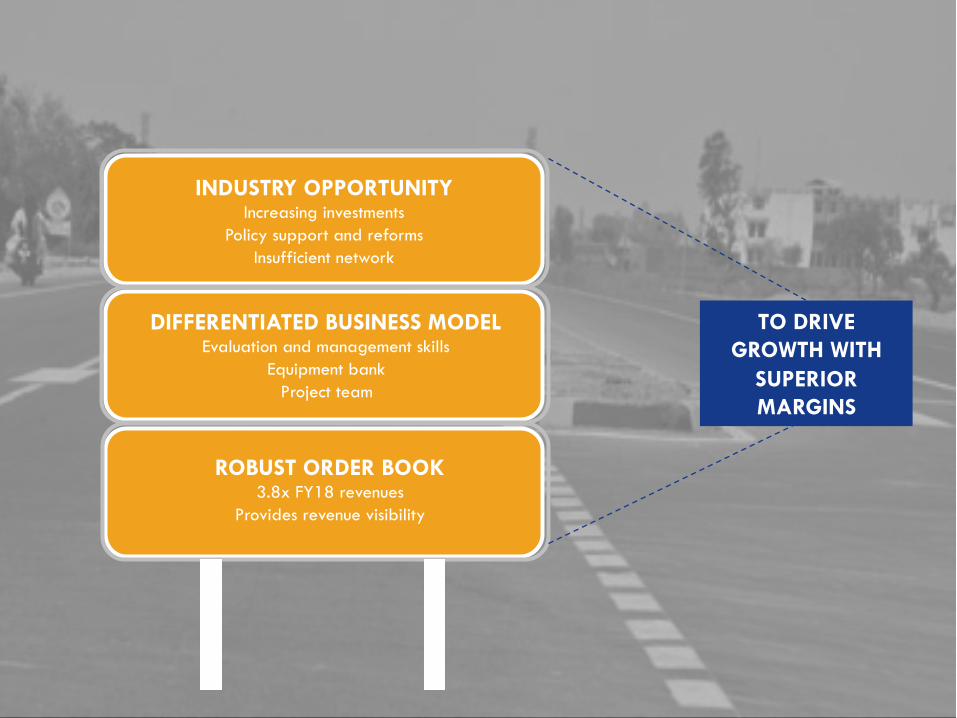
INDUSTRY OPPORTUNITY Increasing investments
Policy support and reforms Insufficient network
DIFFERENTIATED BUSINESS MODEL Evaluation and management skills
Equipment bank Project team
ROBUST ORDER BOOK 3.8x FY18 revenues
Provides revenue visibility
TO DRIVE GROWTH WITH
SUPERIOR MARGINS
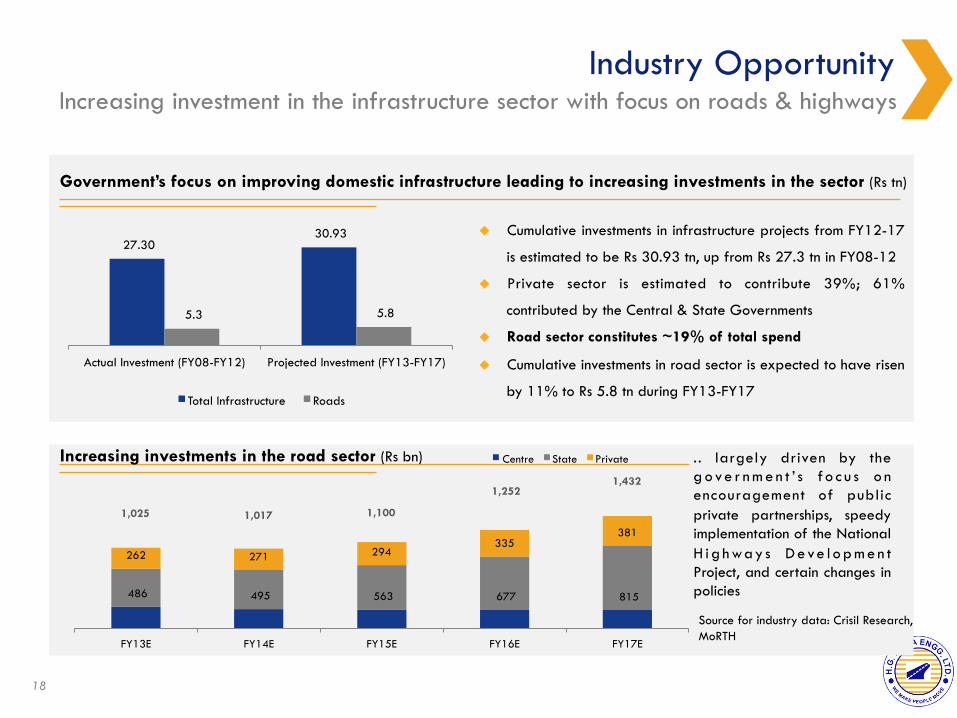
Industry Opportunity Increasing investment in the infrastructure sector with focus on roads & highways
18
27.30 30.93
5.3 5.8
Actual Investment (FY08-FY12) Projected Investment (FY13-FY17)
Total Infrastructure Roads
u Cumulative investments in infrastructure projects from FY12-17
is estimated to be Rs 30.93 tn, up from Rs 27.3 tn in FY08-12
u Private sector is estimated to contribute 39%; 61%
contributed by the Central & State Governments
u Road sector constitutes ~19% of total spend
u Cumulative investments in road sector is expected to have risen
by 11% to Rs 5.8 tn during FY13-FY17
Government’s focus on improving domestic infrastructure leading to increasing investments in the sector (Rs tn)
486 495 563 677 815
262 271 294 335
381
FY13E FY14E FY15E FY16E FY17E
Centre State Private Increasing investments in the road sector (Rs bn) .. largely driven by the g o ve r n m e n t ’ s f o c u s o n encouragement of public private partnerships, speedy implementation of the National H i g h way s D e ve l o p m e n t Project, and certain changes in policies
1,025 1,017 1,100
1,252 1,432
Source for industry data: Crisil Research, MoRTH
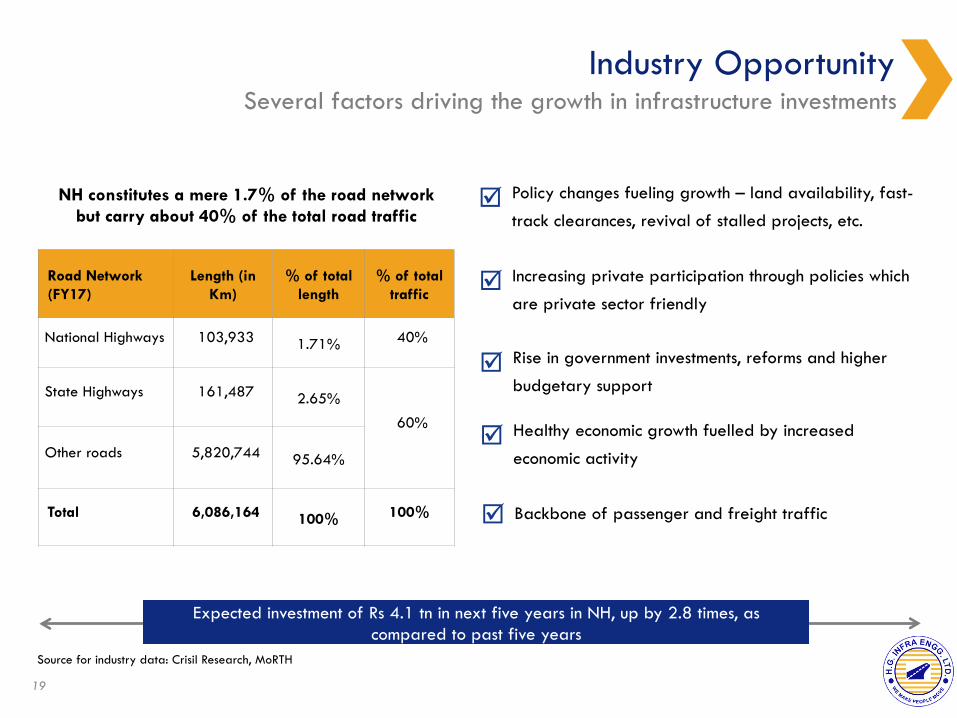
Industry Opportunity Several factors driving the growth in infrastructure investments
19
Policy changes fueling growth – land availability, fast-
track clearances, revival of stalled projects, etc. þ
Increasing private participation through policies which
are private sector friendly þ
Rise in government investments, reforms and higher
budgetary support þ
Healthy economic growth fuelled by increased
economic activity þ
Backbone of passenger and freight traffic þ
Road Network (FY17)
Length (in Km)
% of total length
% of total traffic
National Highways 103,933 1.71% 40%
State Highways 161,487 2.65%
60%
Other roads 5,820,744 95.64%
Total 6,086,164 100% 100%
NH constitutes a mere 1.7% of the road network but carry about 40% of the total road traffic
Expected investment of Rs 4.1 tn in next five years in NH, up by 2.8 times, as compared to past five years
Source for industry data: Crisil Research, MoRTH
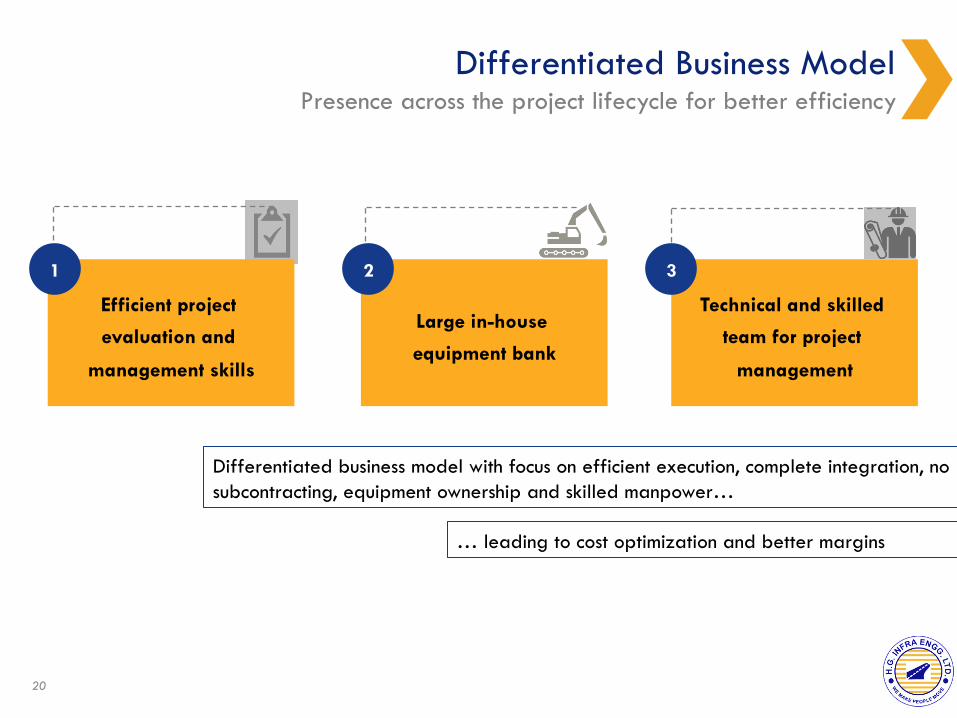
Differentiated Business Model Presence across the project lifecycle for better efficiency
20
Differentiated business model with focus on efficient execution, complete integration, no subcontracting, equipment ownership and skilled manpower…
Efficient project
evaluation and
management skills
Large in-house
equipment bank
Technical and skilled
team for project
management
1 2 3
… leading to cost optimization and better margins
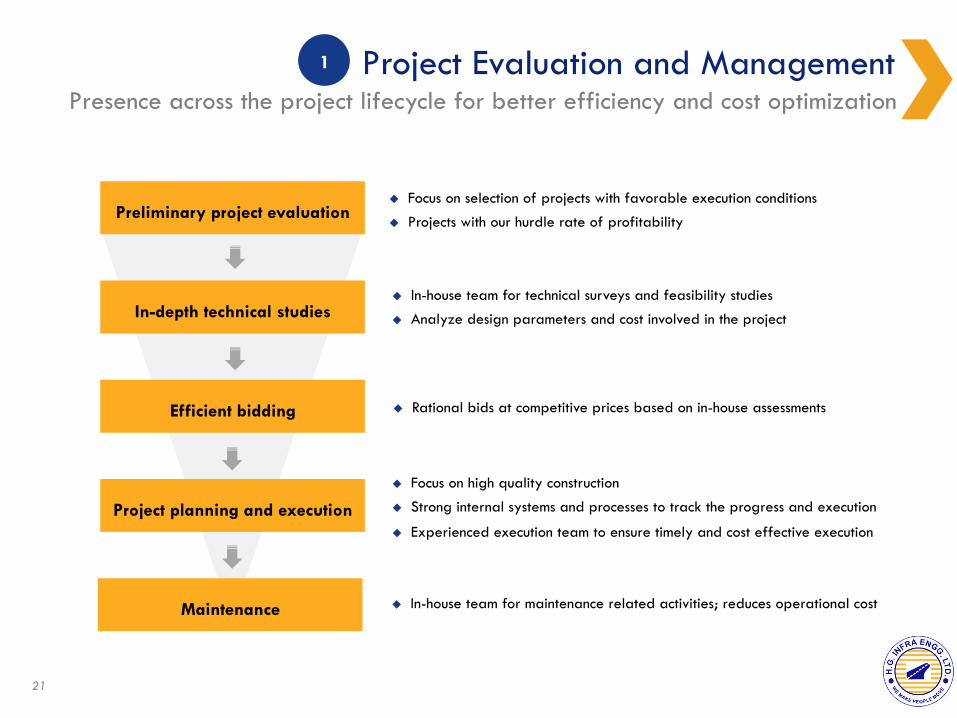
Project Evaluation and Management Presence across the project lifecycle for better efficiency and cost optimization
21
Preliminary project evaluation
In-depth technical studies
Efficient bidding
Project planning and execution
Maintenance
u Focus on selection of projects with favorable execution conditions
u Projects with our hurdle rate of profitability
u In-house team for technical surveys and feasibility studies
u Analyze design parameters and cost involved in the project
u Rational bids at competitive prices based on in-house assessments
u Focus on high quality construction
u Strong internal systems and processes to track the progress and execution
u Experienced execution team to ensure timely and cost effective execution
u In-house team for maintenance related activities; reduces operational cost
1
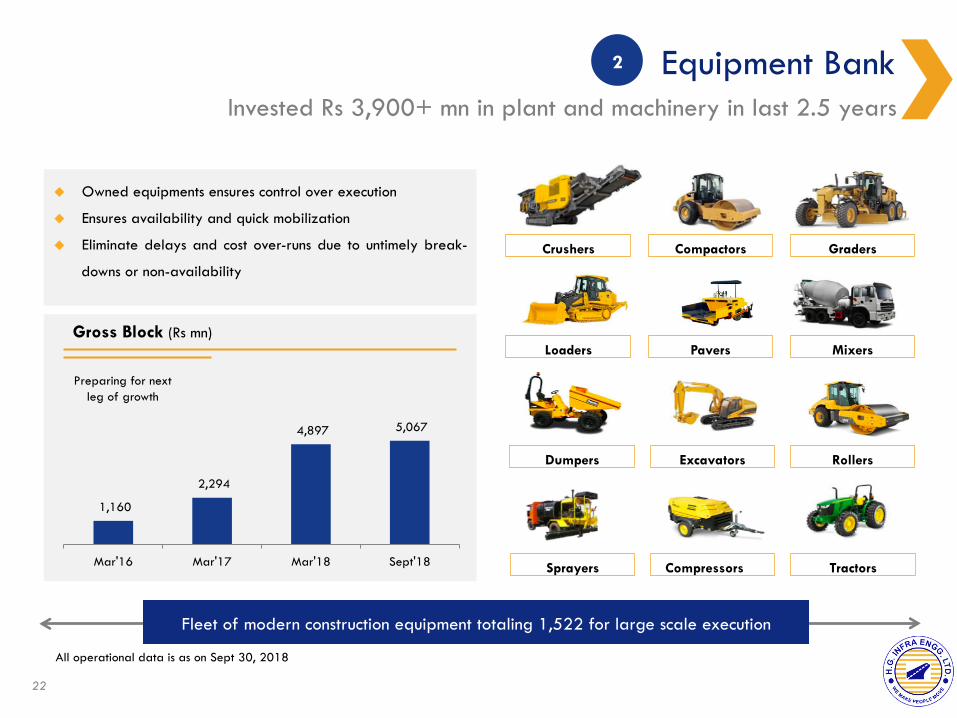
Equipment Bank Invested Rs 3,900+ mn in plant and machinery in last 2.5 years
22
Crushers Compactors Graders
Pavers Mixers
Rollers Excavators Dumpers
Loaders
u Owned equipments ensures control over execution
u Ensures availability and quick mobilization
u Eliminate delays and cost over-runs due to untimely break-
downs or non-availability
Tractors Compressors Sprayers
2
All operational data is as on Sept 30, 2018
Fleet of modern construction equipment totaling 1,522 for large scale execution
1,160
2,294
4,897 5,067
Mar'16 Mar'17 Mar'18 Sept'18
Gross Block (Rs mn)
Preparing for next leg of growth
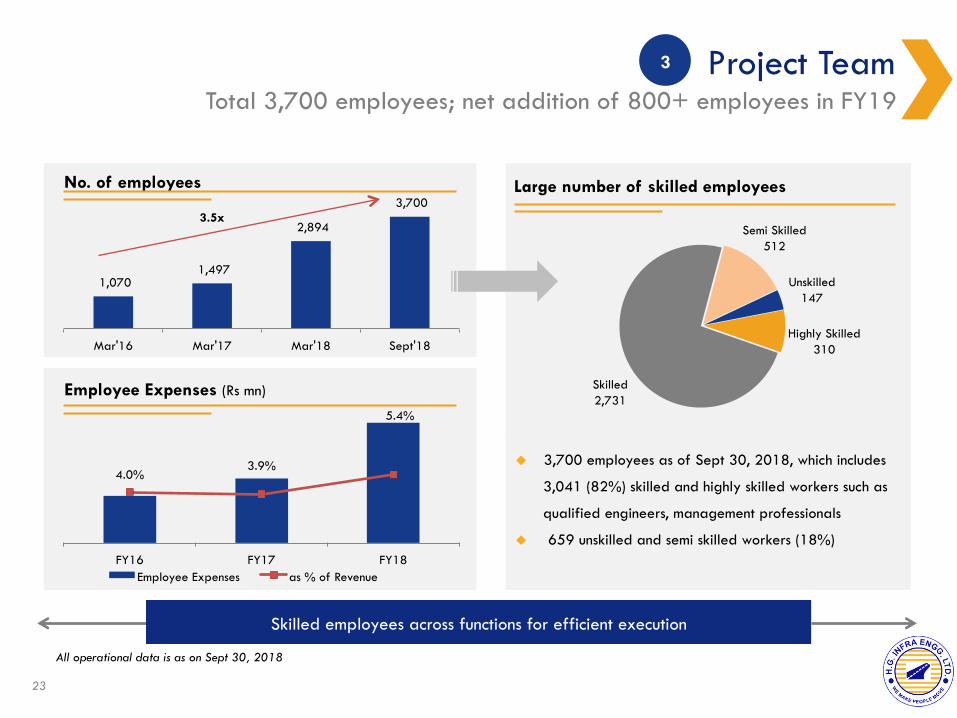
1,070 1,497
2,894
3,700
Mar'16 Mar'17 Mar'18 Sept'18
Project Team Total 3,700 employees; net addition of 800+ employees in FY19
23
u 3,700 employees as of Sept 30, 2018, which includes
3,041 (82%) skilled and highly skilled workers such as
qualified engineers, management professionals
u 659 unskilled and semi skilled workers (18%)
No. of employees
Highly Skilled 310
Skilled 2,731
Semi Skilled 512
Unskilled 147
Skilled employees across functions for efficient execution
Large number of skilled employees
3
All operational data is as on Sept 30, 2018
3.5x
4.0% 3.9%
5.4%
FY16 FY17 FY18 Employee Expenses as % of Revenue
Employee Expenses (Rs mn)
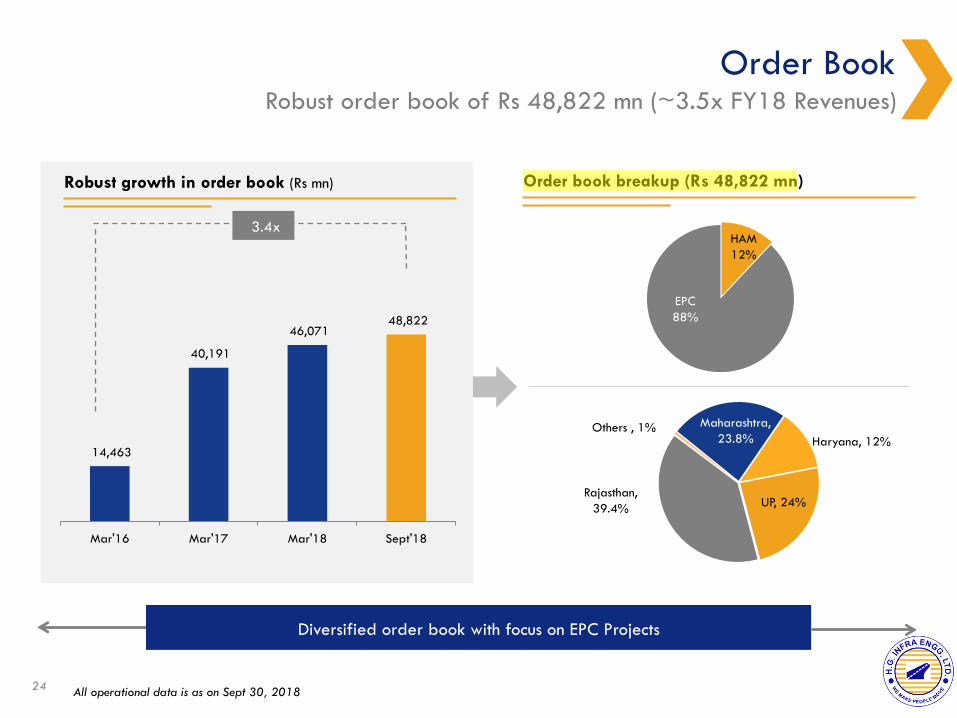
Order Book Robust order book of Rs 48,822 mn (~3.5x FY18 Revenues)
24
HAM 12%
EPC 88%
UP, 24% Rajasthan,
39.4%
Others , 1% Maharashtra, 23.8% Haryana, 12%
Order book breakup (Rs 48,822 mn)
Diversified order book with focus on EPC Projects
All operational data is as on Sept 30, 2018
14,463
40,191
46,071 48,822
Mar'16 Mar'17 Mar'18 Sept'18
Robust growth in order book (Rs mn)
3.4x
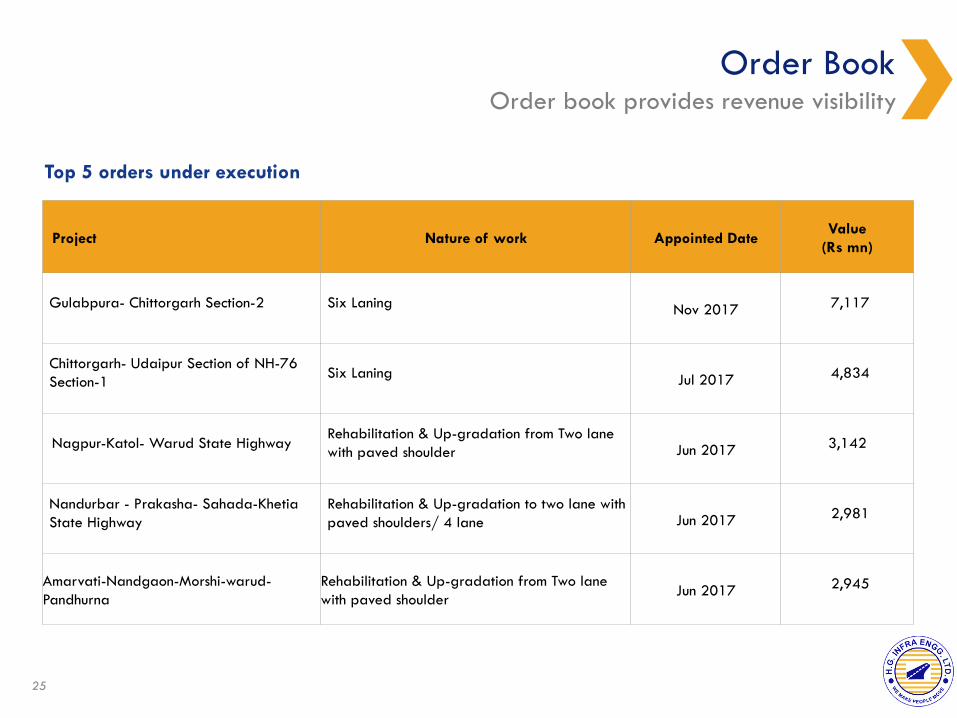
Order Book Order book provides revenue visibility
25
Project Nature of work Appointed Date Value
(Rs mn)
Gulabpura- Chittorgarh Section-2 Six Laning Nov 2017 7,117
Chittorgarh- Udaipur Section of NH-76 Section-1 Six Laning Jul 2017 4,834
Nagpur-Katol- Warud State Highway Rehabilitation & Up-gradation from Two lane with paved shoulder Jun 2017 3,142
Nandurbar - Prakasha- Sahada-Khetia State Highway
Rehabilitation & Up-gradation to two lane with paved shoulders/ 4 lane Jun 2017 2,981
Amarvati-Nandgaon-Morshi-warud- Pandhurna
Rehabilitation & Up-gradation from Two lane with paved shoulder Jun 2017 2,945
Top 5 orders under execution

Growth Strategy 04
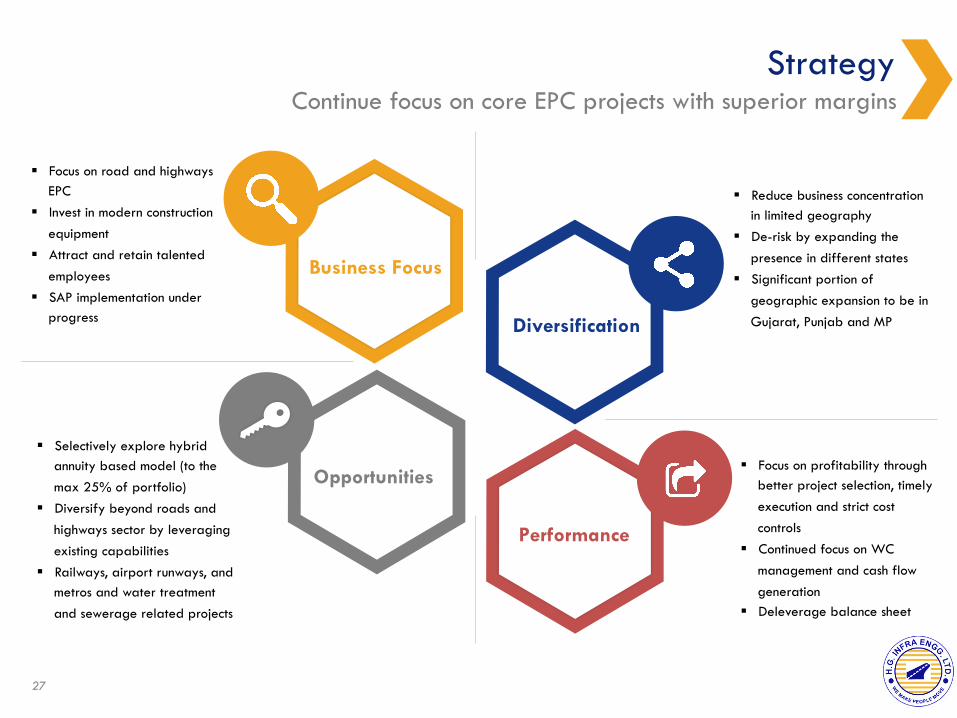
Strategy Continue focus on core EPC projects with superior margins
27
Opportunities
Performance
Diversification
Business Focus
§ Focus on road and highways EPC
§ Invest in modern construction equipment
§ Attract and retain talented employees
§ SAP implementation under progress
§ Selectively explore hybrid annuity based model (to the max 25% of portfolio)
§ Diversify beyond roads and highways sector by leveraging existing capabilities
§ Railways, airport runways, and metros and water treatment and sewerage related projects
§ Reduce business concentration in limited geography
§ De-risk by expanding the presence in different states
§ Significant portion of geographic expansion to be in Gujarat, Punjab and MP
§ Focus on profitability through better project selection, timely execution and strict cost controls
§ Continued focus on WC management and cash flow generation
§ Deleverage balance sheet
Financial Highlights 05
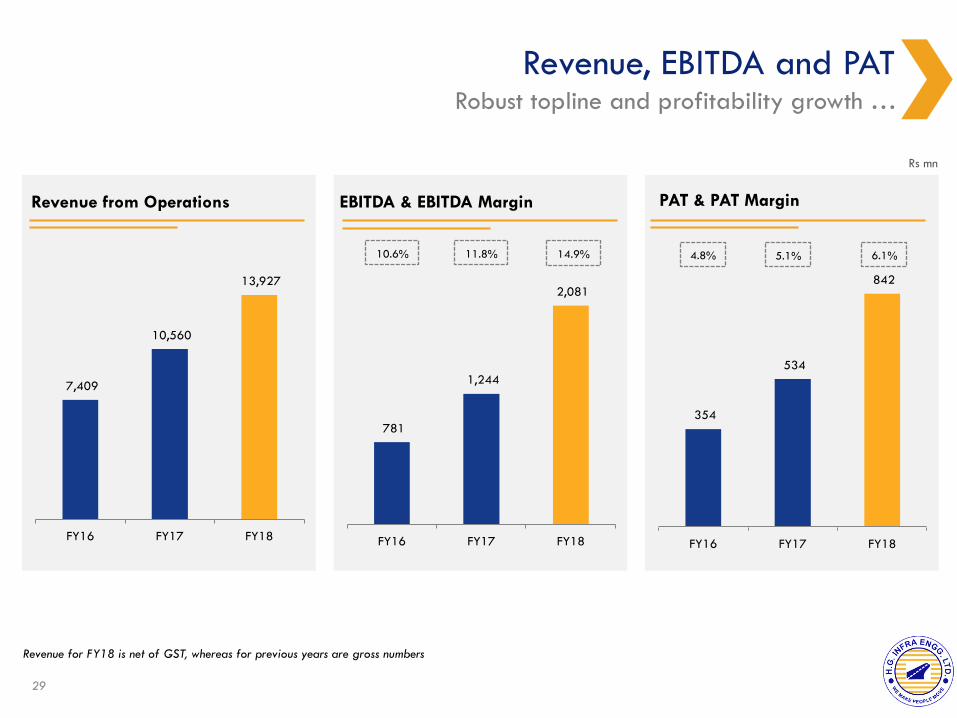
Revenue, EBITDA and PAT Robust topline and profitability growth …
29
7,409
10,560
13,927
FY16 FY17 FY18
Revenue from Operations
781
1,244
2,081
FY16 FY17 FY18
354
534
842
FY16 FY17 FY18
EBITDA & EBITDA Margin PAT & PAT Margin
5.1% 4.8% 6.1%
Rs mn
Revenue for FY18 is net of GST, whereas for previous years are gross numbers
14.9% 11.8% 10.6%
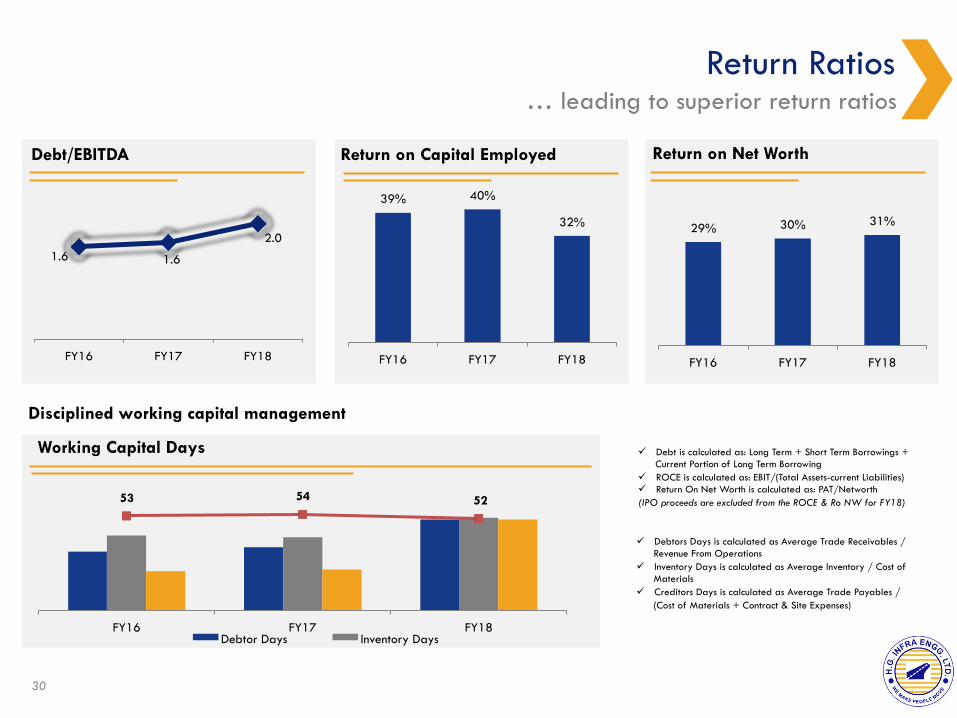
53 54 52
FY16 FY17 FY18 Debtor Days Inventory Days
Return Ratios … leading to superior return ratios
30
1.6 1.6
2.0
FY16 FY17 FY18
Debt/EBITDA
39% 40%
32%
FY16 FY17 FY18
29% 30% 31%
FY16 FY17 FY18
Return on Capital Employed Return on Net Worth
ü Debt is calculated as: Long Term + Short Term Borrowings + Current Portion of Long Term Borrowing
ü ROCE is calculated as: EBIT/(Total Assets-current Liabilities) ü Return On Net Worth is calculated as: PAT/Networth (IPO proceeds are excluded from the ROCE & Ro NW for FY18)
Disciplined working capital management
Working Capital Days
ü Debtors Days is calculated as Average Trade Receivables / Revenue From Operations
ü Inventory Days is calculated as Average Inventory / Cost of Materials
ü Creditors Days is calculated as Average Trade Payables / (Cost of Materials + Contract & Site Expenses)
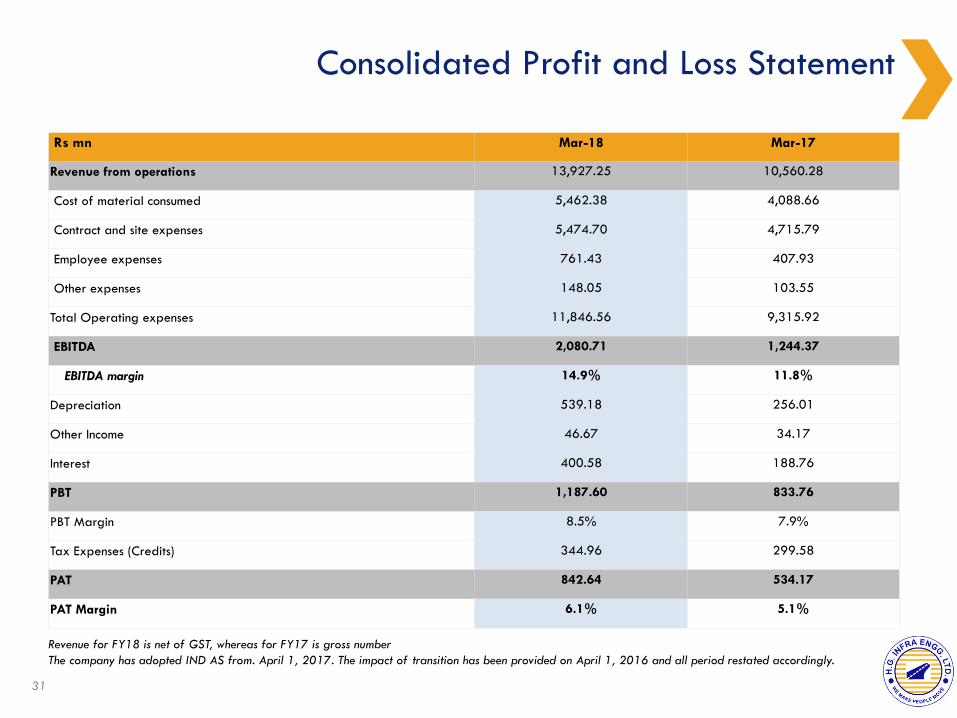
Consolidated Profit and Loss Statement
Rs mn Mar-18 Mar-17
Revenue from operations 13,927.25 10,560.28
Cost of material consumed 5,462.38 4,088.66
Contract and site expenses 5,474.70 4,715.79
Employee expenses 761.43 407.93
Other expenses 148.05 103.55
Total Operating expenses 11,846.56 9,315.92
EBITDA 2,080.71 1,244.37
EBITDA margin 14.9% 11.8%
Depreciation 539.18 256.01
Other Income 46.67 34.17
Interest 400.58 188.76
PBT 1,187.60 833.76
PBT Margin 8.5% 7.9%
Tax Expenses (Credits) 344.96 299.58
PAT 842.64 534.17
PAT Margin 6.1% 5.1%
Revenue for FY18 is net of GST, whereas for FY17 is gross number The company has adopted IND AS from. April 1, 2017. The impact of transition has been provided on April 1, 2016 and all period restated accordingly.
31
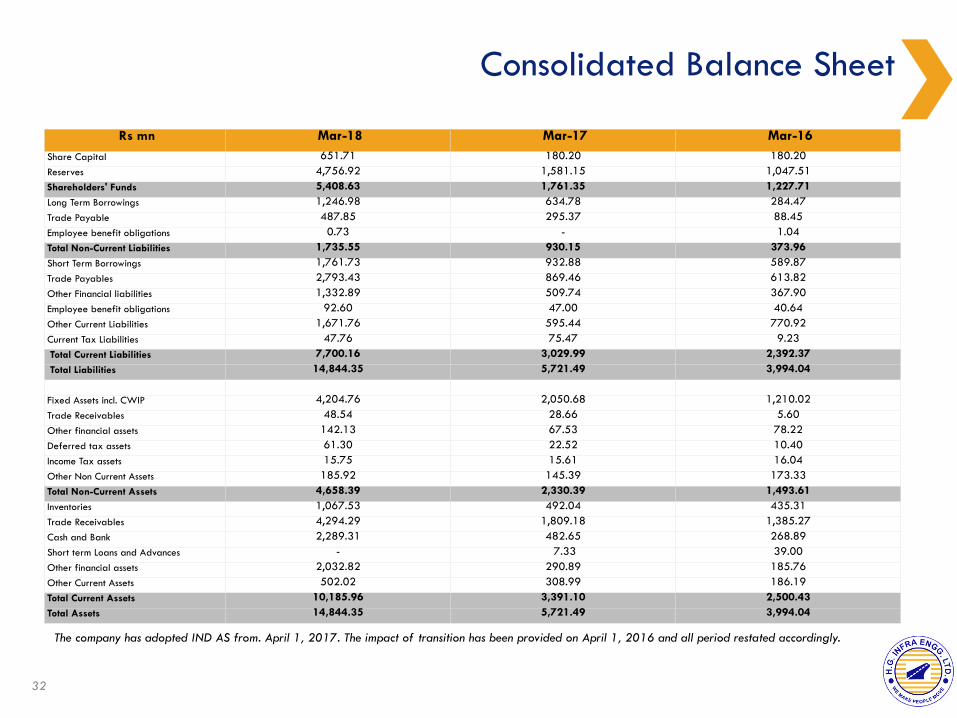
Consolidated Balance Sheet
Rs mn Mar-18 Mar-17 Mar-16 Share Capital 651.71 180.20 180.20 Reserves 4,756.92 1,581.15 1,047.51 Shareholders' Funds 5,408.63 1,761.35 1,227.71 Long Term Borrowings 1,246.98 634.78 284.47 Trade Payable 487.85 295.37 88.45 Employee benefit obligations 0.73 - 1.04 Total Non-Current Liabilities 1,735.55 930.15 373.96 Short Term Borrowings 1,761.73 932.88 589.87 Trade Payables 2,793.43 869.46 613.82 Other Financial liabilities 1,332.89 509.74 367.90 Employee benefit obligations 92.60 47.00 40.64 Other Current Liabilities 1,671.76 595.44 770.92 Current Tax Liabilities 47.76 75.47 9.23 Total Current Liabilities 7,700.16 3,029.99 2,392.37 Total Liabilities 14,844.35 5,721.49 3,994.04
Fixed Assets incl. CWIP 4,204.76 2,050.68 1,210.02 Trade Receivables 48.54 28.66 5.60 Other financial assets 142.13 67.53 78.22 Deferred tax assets 61.30 22.52 10.40 Income Tax assets 15.75 15.61 16.04 Other Non Current Assets 185.92 145.39 173.33 Total Non-Current Assets 4,658.39 2,330.39 1,493.61 Inventories 1,067.53 492.04 435.31 Trade Receivables 4,294.29 1,809.18 1,385.27 Cash and Bank 2,289.31 482.65 268.89 Short term Loans and Advances - 7.33 39.00 Other financial assets 2,032.82 290.89 185.76 Other Current Assets 502.02 308.99 186.19 Total Current Assets 10,185.96 3,391.10 2,500.43 Total Assets 14,844.35 5,721.49 3,994.04
The company has adopted IND AS from. April 1, 2017. The impact of transition has been provided on April 1, 2016 and all period restated accordingly.
32
This presentation and the accompanying slides (the “Presentation”), which have been prepared by
HG Infra Engineering Limited (the “Company”), have been prepared solely for information
purposes and do not constitute any offer, recommendation or invitation to purchase or subscribe for
any securities, and shall not form the basis or be relied on in connection with any contract or
binding commitment whatsoever. No offering of securities of the Company will be made except by
means of a statutory offering document containing detailed information about the Company.
This Presentation has been prepared by the Company based on information and data which the
Company considers reliable, but the Company makes no representation or warranty, express or
implied, whatsoever, and no reliance shall be placed on, the truth, accuracy, completeness, fairness
and reasonableness of the contents of this Presentation. This Presentation may not be all inclusive
and may not contain all of the information that you may consider material. Any liability in respect
of the contents of, or any omission from, this Presentation is expressly excluded.
Certain matters discussed in this Presentation may contain statements regarding the Company’s
market opportunity and business prospects that are individually and collectively forward-looking
statements. Such forward-looking statements are not guarantees of future performance and are
subject to known and unknown risks, uncertainties and assumptions that are difficult to predict.
These risks and uncertainties include, but are not limited to, the performance of the Indian economy
and of the economies of various international markets, the performance of the industry in India and
world-wide, competition, the company’s ability to successfully implement its strategy, the Company’s
future levels of growth and expansion, technological implementation, changes and advancements,
changes in revenue, income or cash flows, the Company’s market preferences and its exposure to
market risks, as well as other risks. The Company’s actual results, levels of activity, performance or
achievements could differ materially and adversely from results expressed in or implied by this
Presentation. The Company assumes no obligation to update any forward-looking information
contained in this Presentation. Any forward-looking statements and projections made by third
parties included in this Presentation are not adopted by the Company and the Company is not
responsible for such third party statements and projections.
Ms. Pooja Dokania [email protected] 022-62398084 Mr. Rajeev Menon [email protected] 022-62398084
B/ 1011A, Kanakia Wall Street, Andheri (East), Mumbai
Mr. Rajeev Mishra CFO [email protected]
Disclaimer Company
Investor Relations Advisors: Credo Advisors
www.hginfra.com
III Floor, Sheel Mohar Plaza, A-1, Tilak Marg, C-Scheme, Jaipur- 302001