Embed Size (px)
Citation preview
Fiscal YearStatutory Report
2018
New York State Housing Finance Agency
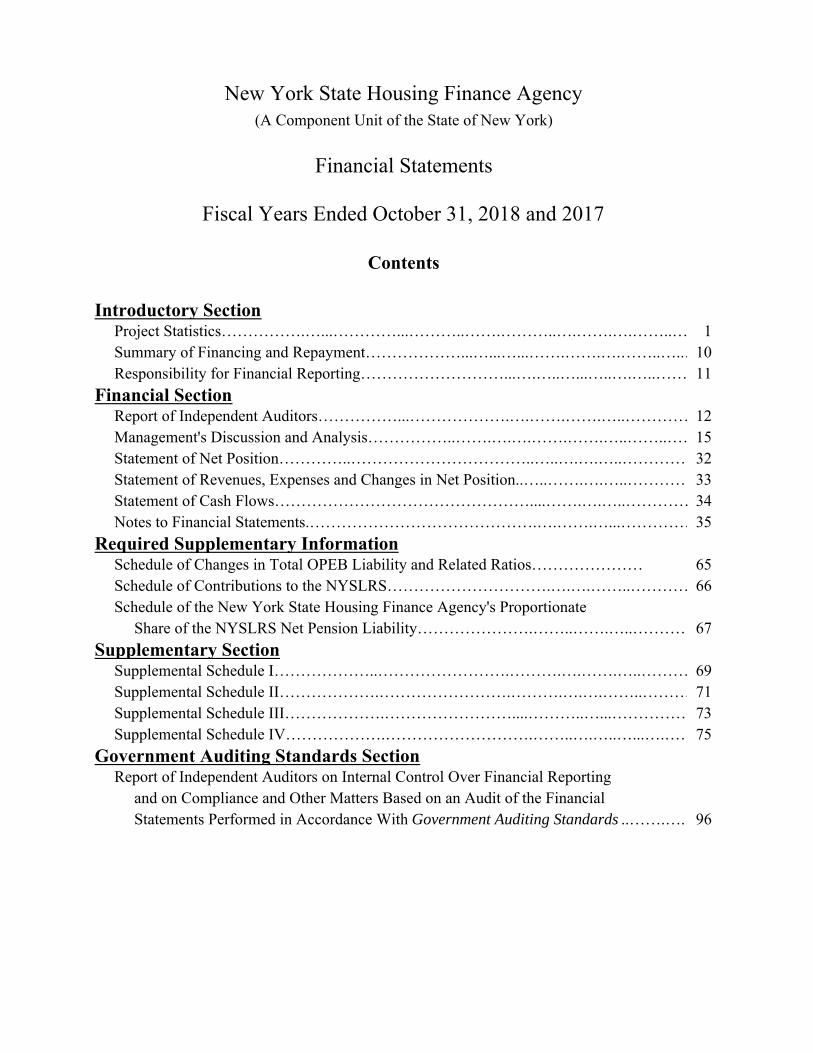
Introductory Section Project Statistics…………….…...…………...………..…….………..….…….….……..… 1 Summary of Financing and Repayment………………...…...…...…….…….….……..…..…10 Responsibility for Financial Reporting………………………...….…..…...…..….…..…… 11
Financial Section Report of Independent Auditors……………...……………….….…….…….…..………… 12 Management's Discussion and Analysis……………..…….….….…….…….…..……..……15 Statement of Net Position…………..……………………………..…..….….…..……………32 Statement of Revenues, Expenses and Changes in Net Position..…..…….….…..………… 33 Statement of Cash Flows…………………………………………....…….….…..………… 34 Notes to Financial Statements.…………………………………….….…….…...……………35
Required Supplementary Information Schedule of Changes in Total OPEB Liability and Related Ratios………………… 65 Schedule of Contributions to the NYSLRS………………………….….….……..…………66 Schedule of the New York State Housing Finance Agency's Proportionate Share of the NYSLRS Net Pension Liability………………….……..…….…..…………67
Supplementary Section Supplemental Schedule I………………..…………………….……….….…….…..……… 69 Supplemental Schedule II……………….…………………….……….….….……..……… 71 Supplemental Schedule III……………….……………………....………..…...…………… 73 Supplemental Schedule IV……………….……………………….……..….…..…...….……75
Government Auditing Standards Section Report of Independent Auditors on Internal Control Over Financial Reporting and on Compliance and Other Matters Based on an Audit of the Financial Statements Performed in Accordance With Government Auditing Standards ..…….….…96
Fiscal Years Ended October 31, 2018 and 2017
Contents
New York State Housing Finance Agency(A Component Unit of the State of New York)
Financial Statements
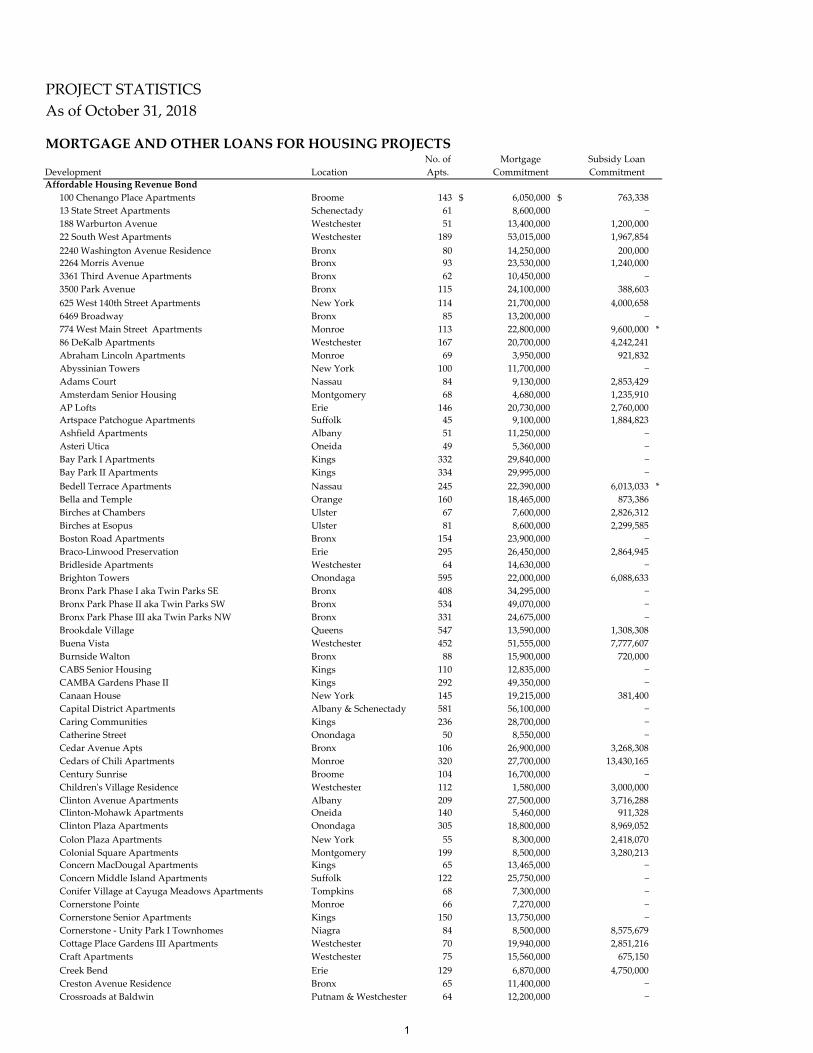
PROJECT STATISTICS
As of October 31, 2018
MORTGAGE AND OTHER LOANS FOR HOUSING PROJECTS No. of Mortgage Subsidy Loan
Development Location Apts. Commitment Commitment
Affordable Housing Revenue Bond
100 Chenango Place Apartments Broome 143 $ 6,050,000 $ 763,338
13 State Street Apartments Schenectady 61 8,600,000 −
188 Warburton Avenue Westchester 51 13,400,000 1,200,000
22 South West Apartments Westchester 189 53,015,000 1,967,854
2240 Washington Avenue Residence Bronx 80 14,250,000 200,000
2264 Morris Avenue Bronx 93 23,530,000 1,240,000
3361 Third Avenue Apartments Bronx 62 10,450,000 −
3500 Park Avenue Bronx 115 24,100,000 388,603
625 West 140th Street Apartments New York 114 21,700,000 4,000,658
6469 Broadway Bronx 85 13,200,000 −
774 West Main Street Apartments Monroe 113 22,800,000 9,600,000 *
86 DeKalb Apartments Westchester 167 20,700,000 4,242,241
Abraham Lincoln Apartments Monroe 69 3,950,000 921,832
Abyssinian Towers New York 100 11,700,000 −
Adams Court Nassau 84 9,130,000 2,853,429
Amsterdam Senior Housing Montgomery 68 4,680,000 1,235,910
AP Lofts Erie 146 20,730,000 2,760,000
Artspace Patchogue Apartments Suffolk 45 9,100,000 1,884,823
Ashfield Apartments Albany 51 11,250,000 −
Asteri Utica Oneida 49 5,360,000 −
Bay Park I Apartments Kings 332 29,840,000 −
Bay Park II Apartments Kings 334 29,995,000 −
Bedell Terrace Apartments Nassau 245 22,390,000 6,013,033 *
Bella and Temple Orange 160 18,465,000 873,386
Birches at Chambers Ulster 67 7,600,000 2,826,312
Birches at Esopus Ulster 81 8,600,000 2,299,585
Boston Road Apartments Bronx 154 23,900,000 −
Braco‐Linwood Preservation Erie 295 26,450,000 2,864,945
Bridleside Apartments Westchester 64 14,630,000 −
Brighton Towers Onondaga 595 22,000,000 6,088,633
Bronx Park Phase I aka Twin Parks SE Bronx 408 34,295,000 −
Bronx Park Phase II aka Twin Parks SW Bronx 534 49,070,000 −
Bronx Park Phase III aka Twin Parks NW Bronx 331 24,675,000 −
Brookdale Village Queens 547 13,590,000 1,308,308
Buena Vista Westchester 452 51,555,000 7,777,607
Burnside Walton Bronx 88 15,900,000 720,000
CABS Senior Housing Kings 110 12,835,000 −
CAMBA Gardens Phase II Kings 292 49,350,000 −
Canaan House New York 145 19,215,000 381,400
Capital District Apartments Albany & Schenectady 581 56,100,000 −
Caring Communities Kings 236 28,700,000 −
Catherine Street Onondaga 50 8,550,000 −
Cedar Avenue Apts Bronx 106 26,900,000 3,268,308
Cedars of Chili Apartments Monroe 320 27,700,000 13,430,165
Century Sunrise Broome 104 16,700,000 −
Childrenʹs Village Residence Westchester 112 1,580,000 3,000,000
Clinton Avenue Apartments Albany 209 27,500,000 3,716,288
Clinton‐Mohawk Apartments Oneida 140 5,460,000 911,328
Clinton Plaza Apartments Onondaga 305 18,800,000 8,969,052
Colon Plaza Apartments New York 55 8,300,000 2,418,070
Colonial Square Apartments Montgomery 199 8,500,000 3,280,213
Concern MacDougal Apartments Kings 65 13,465,000 −
Concern Middle Island Apartments Suffolk 122 25,750,000 −
Conifer Village at Cayuga Meadows Apartments Tompkins 68 7,300,000 −
Cornerstone Pointe Monroe 66 7,270,000 −
Cornerstone Senior Apartments Kings 150 13,750,000 −
Cornerstone ‐ Unity Park I Townhomes Niagra 84 8,500,000 8,575,679
Cottage Place Gardens III Apartments Westchester 70 19,940,000 2,851,216
Craft Apartments Westchester 75 15,560,000 675,150
Creek Bend Erie 129 6,870,000 4,750,000
Creston Avenue Residence Bronx 65 11,400,000 −
Crossroads at Baldwin Putnam & Westchester 64 12,200,000 −
1
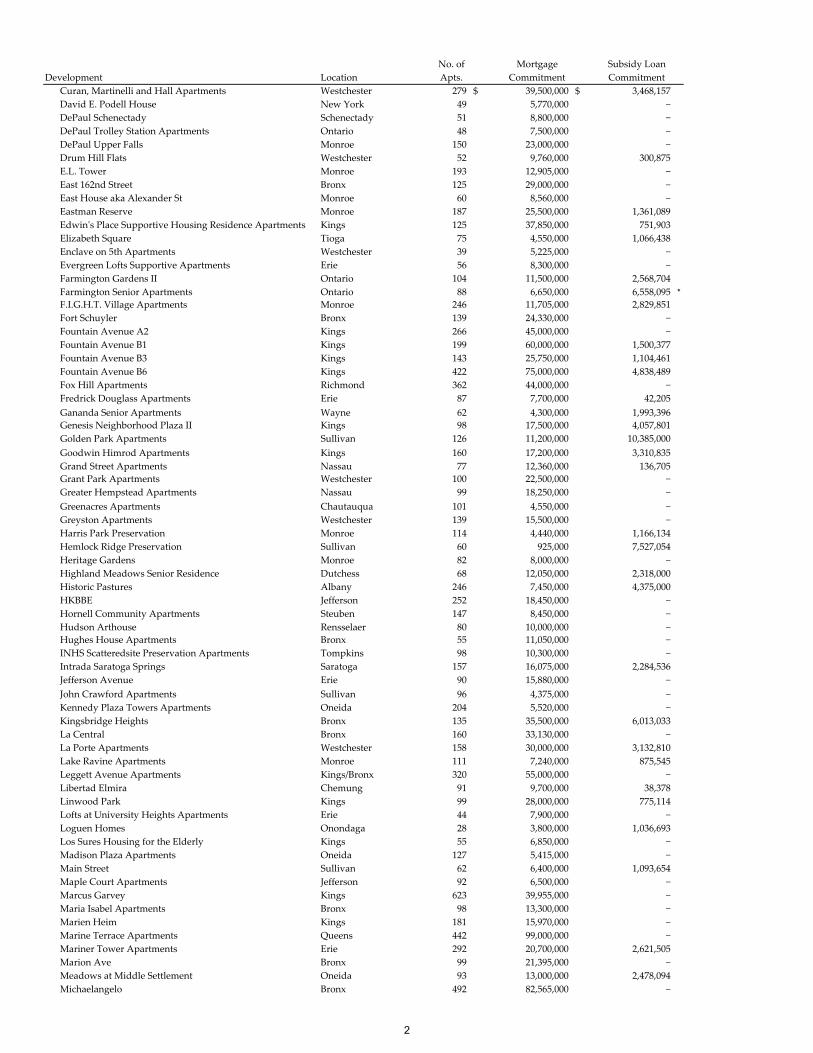
No. of Mortgage Subsidy Loan
Development Location Apts. Commitment Commitment
Curan, Martinelli and Hall Apartments Westchester 279 $ 39,500,000 $ 3,468,157
David E. Podell House New York 49 5,770,000 −
DePaul Schenectady Schenectady 51 8,800,000 −
DePaul Trolley Station Apartments Ontario 48 7,500,000 −
DePaul Upper Falls Monroe 150 23,000,000 −
Drum Hill Flats Westchester 52 9,760,000 300,875
E.L. Tower Monroe 193 12,905,000 −
East 162nd Street Bronx 125 29,000,000 −
East House aka Alexander St Monroe 60 8,560,000 −
Eastman Reserve Monroe 187 25,500,000 1,361,089
Edwinʹs Place Supportive Housing Residence Apartments Kings 125 37,850,000 751,903
Elizabeth Square Tioga 75 4,550,000 1,066,438
Enclave on 5th Apartments Westchester 39 5,225,000 −
Evergreen Lofts Supportive Apartments Erie 56 8,300,000 −
Farmington Gardens II Ontario 104 11,500,000 2,568,704
Farmington Senior Apartments Ontario 88 6,650,000 6,558,095 *
F.I.G.H.T. Village Apartments Monroe 246 11,705,000 2,829,851
Fort Schuyler Bronx 139 24,330,000 −
Fountain Avenue A2 Kings 266 45,000,000 −
Fountain Avenue B1 Kings 199 60,000,000 1,500,377
Fountain Avenue B3 Kings 143 25,750,000 1,104,461
Fountain Avenue B6 Kings 422 75,000,000 4,838,489
Fox Hill Apartments Richmond 362 44,000,000 −
Fredrick Douglass Apartments Erie 87 7,700,000 42,205
Gananda Senior Apartments Wayne 62 4,300,000 1,993,396
Genesis Neighborhood Plaza II Kings 98 17,500,000 4,057,801
Golden Park Apartments Sullivan 126 11,200,000 10,385,000
Goodwin Himrod Apartments Kings 160 17,200,000 3,310,835
Grand Street Apartments Nassau 77 12,360,000 136,705
Grant Park Apartments Westchester 100 22,500,000 −
Greater Hempstead Apartments Nassau 99 18,250,000 −
Greenacres Apartments Chautauqua 101 4,550,000 −
Greyston Apartments Westchester 139 15,500,000 −
Harris Park Preservation Monroe 114 4,440,000 1,166,134
Hemlock Ridge Preservation Sullivan 60 925,000 7,527,054
Heritage Gardens Monroe 82 8,000,000 −
Highland Meadows Senior Residence Dutchess 68 12,050,000 2,318,000
Historic Pastures Albany 246 7,450,000 4,375,000
HKBBE Jefferson 252 18,450,000 −
Hornell Community Apartments Steuben 147 8,450,000 −
Hudson Arthouse Rensselaer 80 10,000,000 −
Hughes House Apartments Bronx 55 11,050,000 −
INHS Scatteredsite Preservation Apartments Tompkins 98 10,300,000 −
Intrada Saratoga Springs Saratoga 157 16,075,000 2,284,536
Jefferson Avenue Erie 90 15,880,000 −
John Crawford Apartments Sullivan 96 4,375,000 −
Kennedy Plaza Towers Apartments Oneida 204 5,520,000 −
Kingsbridge Heights Bronx 135 35,500,000 6,013,033
La Central Bronx 160 33,130,000 −
La Porte Apartments Westchester 158 30,000,000 3,132,810
Lake Ravine Apartments Monroe 111 7,240,000 875,545
Leggett Avenue Apartments Kings/Bronx 320 55,000,000 −
Libertad Elmira Chemung 91 9,700,000 38,378
Linwood Park Kings 99 28,000,000 775,114
Lofts at University Heights Apartments Erie 44 7,900,000 −
Loguen Homes Onondaga 28 3,800,000 1,036,693
Los Sures Housing for the Elderly Kings 55 6,850,000 −
Madison Plaza Apartments Oneida 127 5,415,000 −
Main Street Sullivan 62 6,400,000 1,093,654
Maple Court Apartments Jefferson 92 6,500,000 −
Marcus Garvey Kings 623 39,955,000 −
Maria Isabel Apartments Bronx 98 13,300,000 −
Marien Heim Kings 181 15,970,000 −
Marine Terrace Apartments Queens 442 99,000,000 −
Mariner Tower Apartments Erie 292 20,700,000 2,621,505
Marion Ave Bronx 99 21,395,000 −
Meadows at Middle Settlement Oneida 93 13,000,000 2,478,094
Michaelangelo Bronx 492 82,565,000 −
2
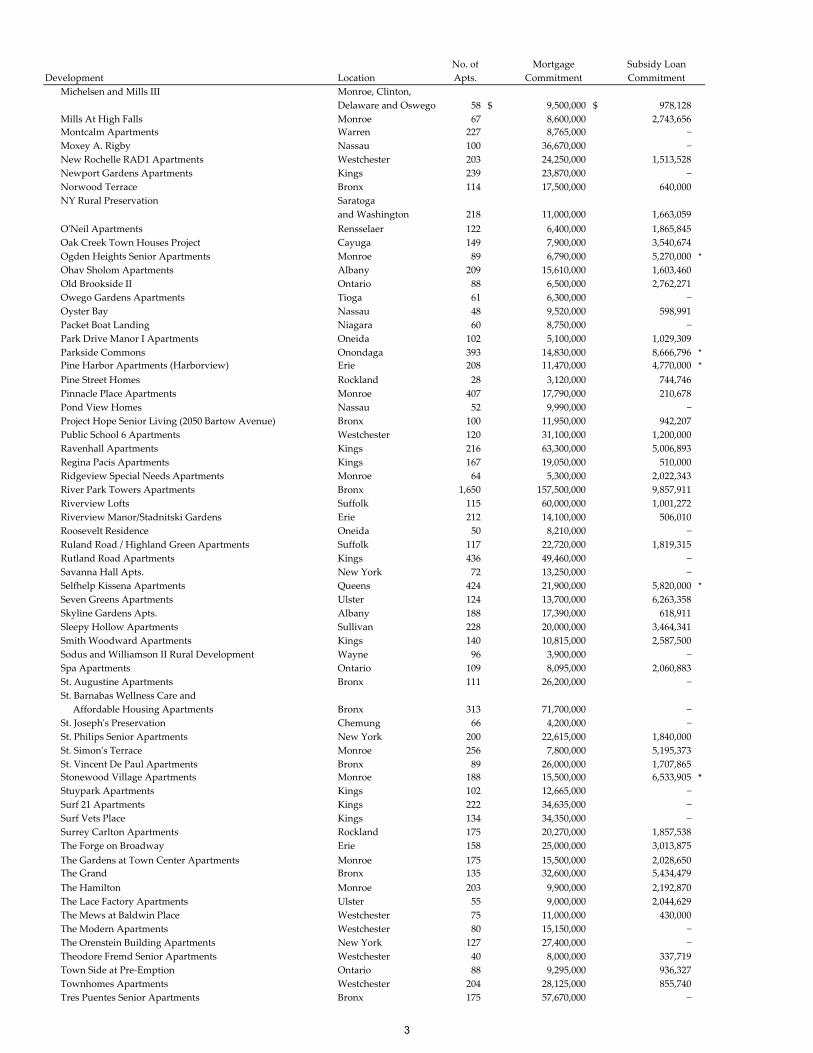
No. of Mortgage Subsidy Loan
Development Location Apts. Commitment Commitment
Michelsen and Mills III Monroe, Clinton,
Delaware and Oswego 58 $ 9,500,000 $ 978,128
Mills At High Falls Monroe 67 8,600,000 2,743,656
Montcalm Apartments Warren 227 8,765,000 −
Moxey A. Rigby Nassau 100 36,670,000 −
New Rochelle RAD1 Apartments Westchester 203 24,250,000 1,513,528
Newport Gardens Apartments Kings 239 23,870,000 −
Norwood Terrace Bronx 114 17,500,000 640,000
NY Rural Preservation Saratoga
and Washington 218 11,000,000 1,663,059
OʹNeil Apartments Rensselaer 122 6,400,000 1,865,845
Oak Creek Town Houses Project Cayuga 149 7,900,000 3,540,674
Ogden Heights Senior Apartments Monroe 89 6,790,000 5,270,000 *
Ohav Sholom Apartments Albany 209 15,610,000 1,603,460
Old Brookside II Ontario 88 6,500,000 2,762,271
Owego Gardens Apartments Tioga 61 6,300,000 −
Oyster Bay Nassau 48 9,520,000 598,991
Packet Boat Landing Niagara 60 8,750,000 −
Park Drive Manor I Apartments Oneida 102 5,100,000 1,029,309
Parkside Commons Onondaga 393 14,830,000 8,666,796 *
Pine Harbor Apartments (Harborview) Erie 208 11,470,000 4,770,000 *
Pine Street Homes Rockland 28 3,120,000 744,746
Pinnacle Place Apartments Monroe 407 17,790,000 210,678
Pond View Homes Nassau 52 9,990,000 −
Project Hope Senior Living (2050 Bartow Avenue) Bronx 100 11,950,000 942,207
Public School 6 Apartments Westchester 120 31,100,000 1,200,000
Ravenhall Apartments Kings 216 63,300,000 5,006,893
Regina Pacis Apartments Kings 167 19,050,000 510,000
Ridgeview Special Needs Apartments Monroe 64 5,300,000 2,022,343
River Park Towers Apartments Bronx 1,650 157,500,000 9,857,911
Riverview Lofts Suffolk 115 60,000,000 1,001,272
Riverview Manor/Stadnitski Gardens Erie 212 14,100,000 506,010
Roosevelt Residence Oneida 50 8,210,000 −
Ruland Road / Highland Green Apartments Suffolk 117 22,720,000 1,819,315
Rutland Road Apartments Kings 436 49,460,000 −
Savanna Hall Apts. New York 72 13,250,000 −
Selfhelp Kissena Apartments Queens 424 21,900,000 5,820,000 *
Seven Greens Apartments Ulster 124 13,700,000 6,263,358
Skyline Gardens Apts. Albany 188 17,390,000 618,911
Sleepy Hollow Apartments Sullivan 228 20,000,000 3,464,341
Smith Woodward Apartments Kings 140 10,815,000 2,587,500
Sodus and Williamson II Rural Development Wayne 96 3,900,000 −
Spa Apartments Ontario 109 8,095,000 2,060,883
St. Augustine Apartments Bronx 111 26,200,000 −
St. Barnabas Wellness Care and
Affordable Housing Apartments Bronx 313 71,700,000 −
St. Josephʹs Preservation Chemung 66 4,200,000 −
St. Philips Senior Apartments New York 200 22,615,000 1,840,000
St. Simonʹs Terrace Monroe 256 7,800,000 5,195,373
St. Vincent De Paul Apartments Bronx 89 26,000,000 1,707,865
Stonewood Village Apartments Monroe 188 15,500,000 6,533,905 *
Stuypark Apartments Kings 102 12,665,000 −
Surf 21 Apartments Kings 222 34,635,000 −
Surf Vets Place Kings 134 34,350,000 −
Surrey Carlton Apartments Rockland 175 20,270,000 1,857,538
The Forge on Broadway Erie 158 25,000,000 3,013,875
The Gardens at Town Center Apartments Monroe 175 15,500,000 2,028,650
The Grand Bronx 135 32,600,000 5,434,479
The Hamilton Monroe 203 9,900,000 2,192,870
The Lace Factory Apartments Ulster 55 9,000,000 2,044,629
The Mews at Baldwin Place Westchester 75 11,000,000 430,000
The Modern Apartments Westchester 80 15,150,000 −
The Orenstein Building Apartments New York 127 27,400,000 −
Theodore Fremd Senior Apartments Westchester 40 8,000,000 337,719
Town Side at Pre‐Emption Ontario 88 9,295,000 936,327
Townhomes Apartments Westchester 204 28,125,000 855,740
Tres Puentes Senior Apartments Bronx 175 57,670,000 −
3
No. of Mortgage Subsidy Loan
Development Location Apts. Commitment Commitment
Tri Veterans Housing Monroe 516 30,460,000 5,135,193
Valley Vista Apartments Onondaga 123 8,450,000 4,221,322
Via Vyse Bronx 120 23,500,000 −
VOA Cobblestone Place Webster Monroe 60 5,800,000 320,000
Warburton Dorado Westchester 188 17,355,000 6,146,248
Washington Avenue Apartments Bronx 118 18,200,000 2,256,217
Webster Avenue Supportive Housing Residence Bronx 170 30,520,000 −
Wesley Hall Westchester 118 9,545,000 3,827,442
West Middle School Cayuga 59 10,370,000 −
Westfall Heights Apartments Monroe 101 5,650,000 500,329
WIH Preservation Wayne 113 5,010,000 1,330,000
Wilbur Fay Apartments Oswego 95 13,725,000 2,372,121
Wilcox Lane Apartments Ontario 119 3,140,000 1,553,346
Willoughby Court Apartments Kings 266 23,445,000 −
Winbrook Phase I Apartments Westchester 103 25,000,000 1,000,000
Wincoram Commons II Suffolk 77 13,500,000 −
Woodlands and Barkley Apartments Sullivan 111 6,500,000 2,169,290
Woodstock Manor Apartments Westchester 60 6,550,000 582,200
Wyandanch Apartments Suffolk 86 24,250,000 1,805,596
Yonkers Apartments Westchester 129 19,260,000 1,595,000
Total 34,575 $ 4,143,865,000 $ 355,104,563
Affordable Housing Revenue Bond ‐ NIBP
25 State Street Apartments Westchester 50 $ 8,760,000 $ 4,058,924
Albany Gardens Apartments aka CAMBA Kings 209 34,060,000 −
Bradmar Village Chautauqua 99 8,320,000 2,206,084
Burt Farms II Apartments Orange 50 3,350,000 −
Ennis Francis House New York 219 38,565,000 −
Erie Harbor Apartments Monroe 131 18,390,000 3,103,136
Fairway Richmond Richmond 217 23,500,000 −
Gateway Gardens Villas Suffolk 40 6,000,000 −
Grote Street Apartments Bronx 249 22,270,000 759,905
HANAC Senior Apartments Queens 99 12,100,000 −
Heritage Homes Apartments Westchester 130 18,390,000 3,063,735
James Street Apartments Onondaga 82 8,775,000 892,281
Liberty Green III Apartments Orange 83 7,870,000 3,735,905
Machackemach Village Apartments Orange 50 2,310,000 −
Monteagle Niagara 149 5,720,000 1,986,386
North Country Rural Preservation Apartments St. Lawrence,
Franklin and Jeffers 254 14,390,000 −
Phillips Village II Monroe 497 27,050,000 2,049,538
Pine Town Apartments Nassau 130 19,650,000 −
Radisson Lysabder Greenway Apartments Onondaga 207 12,790,000 3,389,242
Roundtop Commons Apartments Westchester 92 15,500,000 189,949
Spring Valley Apartments Rockland 55 8,400,000 1,446,013
The Highlands Apartments (Geneseo) Livingston 89 4,950,000 −
Towpath Senior Wayne 97 5,430,000 1,056,097
Twin Oaks Apartments Nassau 94 15,610,000 3,400,000
Twin Parks Apartments Bronx 274 25,550,000 −
Village Square Apartments Steuben 74 3,450,000 354,205
Wartberg Marie Heins Residence (Friedrichs Supportive) Westchester 61 8,600,000 538,997
Warburton Riverview Apartments Westchester 92 16,200,000 2,822,641
Total 3,873 $ 395,950,000 $ 35,053,038
Multi‐Family Housing Revenue
(Secured Mortgage Program)
Airmont Gardens Apartments Airmont 140 $ 12,000,000 $ 1,201,183
Berkeley Square Apartments Wappingers Falls 150 9,500,000 −
Cannon Street Senior Apartments Poughkeepsie 40 3,350,000 295,360
Community Re‐Entry Project Middletown 26 1,000,000 187,397
Crotona Estates Apartments Bronx 56 3,845,000 −
Division Street Multi‐Family Housing Hastings‐on‐Hudso 14 2,600,000 350,000
Evergreen Hills Apartment Macedon 72 1,700,000 −
Extra Place Apartments Manhattan 42 6,225,000 −
Framark Place Apartments Victor 50 2,750,000 1,331,907
Friendship House Apartments Cortland 101 2,840,000 −
* The subsidy loan commitment for these loans was funded through a onetime federal program ‐ the Tax Credit Assistance Program
(ʺTCAPʺ) ‐ authorized by the American Recovery and Reinvestment Act of 2009, through which funds were made available to assist
affordable housing developments.
4
No. of Mortgage Subsidy Loan
Development Location Apts. Commitment Commitment
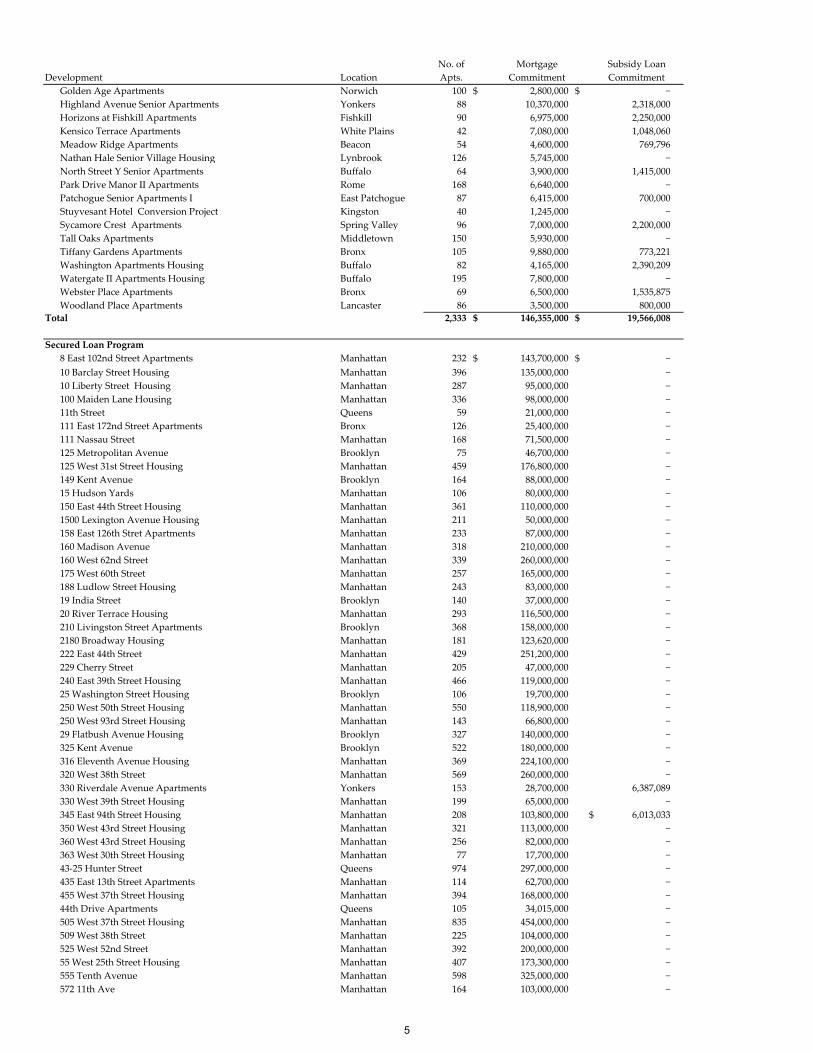
Golden Age Apartments Norwich 100 $ 2,800,000 $ −
Highland Avenue Senior Apartments Yonkers 88 10,370,000 2,318,000
Horizons at Fishkill Apartments Fishkill 90 6,975,000 2,250,000
Kensico Terrace Apartments White Plains 42 7,080,000 1,048,060
Meadow Ridge Apartments Beacon 54 4,600,000 769,796
Nathan Hale Senior Village Housing Lynbrook 126 5,745,000 −
North Street Y Senior Apartments Buffalo 64 3,900,000 1,415,000
Park Drive Manor II Apartments Rome 168 6,640,000 −
Patchogue Senior Apartments I East Patchogue 87 6,415,000 700,000
Stuyvesant Hotel Conversion Project Kingston 40 1,245,000 −
Sycamore Crest Apartments Spring Valley 96 7,000,000 2,200,000
Tall Oaks Apartments Middletown 150 5,930,000 −
Tiffany Gardens Apartments Bronx 105 9,880,000 773,221
Washington Apartments Housing Buffalo 82 4,165,000 2,390,209
Watergate II Apartments Housing Buffalo 195 7,800,000 −
Webster Place Apartments Bronx 69 6,500,000 1,535,875
Woodland Place Apartments Lancaster 86 3,500,000 800,000
Total 2,333 $ 146,355,000 $ 19,566,008
Secured Loan Program
8 East 102nd Street Apartments Manhattan 232 $ 143,700,000 $ −
10 Barclay Street Housing Manhattan 396 135,000,000 −
10 Liberty Street Housing Manhattan 287 95,000,000 −
100 Maiden Lane Housing Manhattan 336 98,000,000 −
11th Street Queens 59 21,000,000 −
111 East 172nd Street Apartments Bronx 126 25,400,000 −
111 Nassau Street Manhattan 168 71,500,000 −
125 Metropolitan Avenue Brooklyn 75 46,700,000 −
125 West 31st Street Housing Manhattan 459 176,800,000 −
149 Kent Avenue Brooklyn 164 88,000,000 −
15 Hudson Yards Manhattan 106 80,000,000 −
150 East 44th Street Housing Manhattan 361 110,000,000 −
1500 Lexington Avenue Housing Manhattan 211 50,000,000 −
158 East 126th Stret Apartments Manhattan 233 87,000,000 −
160 Madison Avenue Manhattan 318 210,000,000 −
160 West 62nd Street Manhattan 339 260,000,000 −
175 West 60th Street Manhattan 257 165,000,000 −
188 Ludlow Street Housing Manhattan 243 83,000,000 −
19 India Street Brooklyn 140 37,000,000 −
20 River Terrace Housing Manhattan 293 116,500,000 −
210 Livingston Street Apartments Brooklyn 368 158,000,000 −
2180 Broadway Housing Manhattan 181 123,620,000 −
222 East 44th Street Manhattan 429 251,200,000 −
229 Cherry Street Manhattan 205 47,000,000 −
240 East 39th Street Housing Manhattan 466 119,000,000 −
25 Washington Street Housing Brooklyn 106 19,700,000 −
250 West 50th Street Housing Manhattan 550 118,900,000 −
250 West 93rd Street Housing Manhattan 143 66,800,000 −
29 Flatbush Avenue Housing Brooklyn 327 140,000,000 −
325 Kent Avenue Brooklyn 522 180,000,000 −
316 Eleventh Avenue Housing Manhattan 369 224,100,000 −
320 West 38th Street Manhattan 569 260,000,000 −
330 Riverdale Avenue Apartments Yonkers 153 28,700,000 6,387,089
330 West 39th Street Housing Manhattan 199 65,000,000 −
345 East 94th Street Housing Manhattan 208 103,800,000 6,013,033$
350 West 43rd Street Housing Manhattan 321 113,000,000 −
360 West 43rd Street Housing Manhattan 256 82,000,000 −
363 West 30th Street Housing Manhattan 77 17,700,000 −
43‐25 Hunter Street Queens 974 297,000,000 −
435 East 13th Street Apartments Manhattan 114 62,700,000 −
455 West 37th Street Housing Manhattan 394 168,000,000 −
44th Drive Apartments Queens 105 34,015,000 −
505 West 37th Street Housing Manhattan 835 454,000,000 −
509 West 38th Street Manhattan 225 104,000,000 −
525 West 52nd Street Manhattan 392 200,000,000 −
55 West 25th Street Housing Manhattan 407 173,300,000 −
555 Tenth Avenue Manhattan 598 325,000,000 −
572 11th Ave Manhattan 164 103,000,000 −
5
No. of Mortgage Subsidy Loan
Development Location Apts. Commitment Commitment
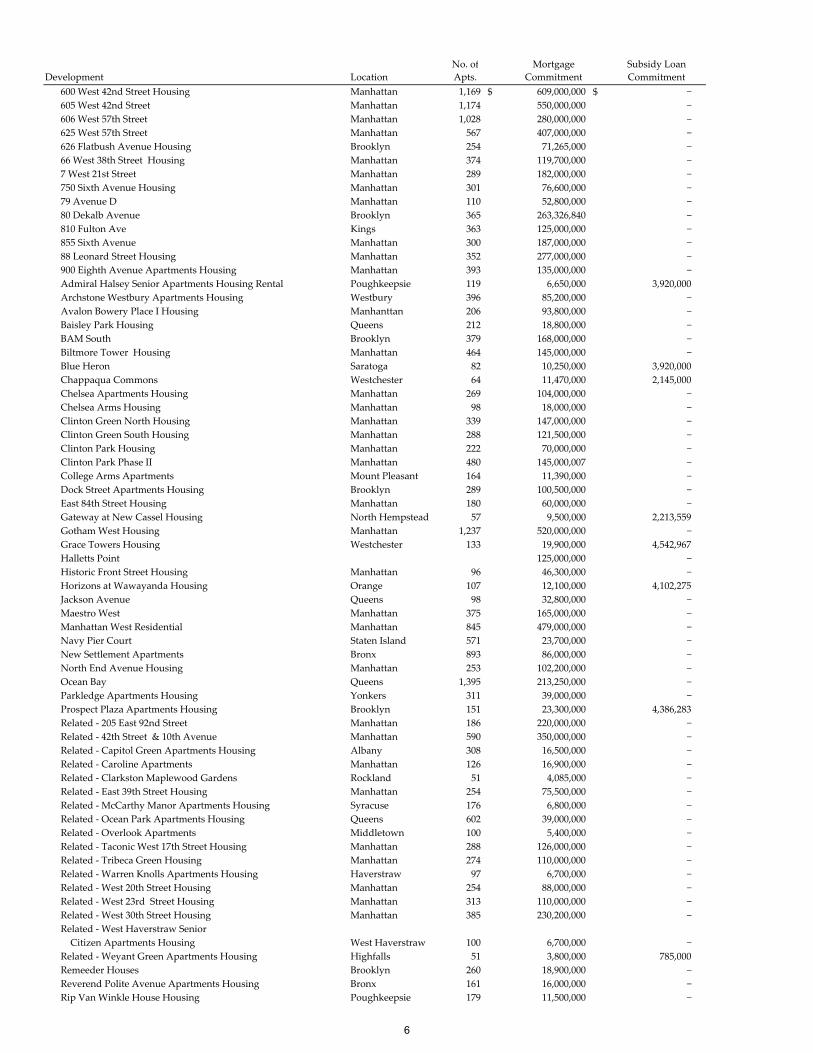
600 West 42nd Street Housing Manhattan 1,169 $ 609,000,000 $ −
605 West 42nd Street Manhattan 1,174 550,000,000 −
606 West 57th Street Manhattan 1,028 280,000,000 −
625 West 57th Street Manhattan 567 407,000,000 −
626 Flatbush Avenue Housing Brooklyn 254 71,265,000 −
66 West 38th Street Housing Manhattan 374 119,700,000 −
7 West 21st Street Manhattan 289 182,000,000 −
750 Sixth Avenue Housing Manhattan 301 76,600,000 −
79 Avenue D Manhattan 110 52,800,000 −
80 Dekalb Avenue Brooklyn 365 263,326,840 −
810 Fulton Ave Kings 363 125,000,000 −
855 Sixth Avenue Manhattan 300 187,000,000 −
88 Leonard Street Housing Manhattan 352 277,000,000 −
900 Eighth Avenue Apartments Housing Manhattan 393 135,000,000 −
Admiral Halsey Senior Apartments Housing Rental Poughkeepsie 119 6,650,000 3,920,000
Archstone Westbury Apartments Housing Westbury 396 85,200,000 −
Avalon Bowery Place I Housing Manhanttan 206 93,800,000 −
Baisley Park Housing Queens 212 18,800,000 −
BAM South Brooklyn 379 168,000,000 −
Biltmore Tower Housing Manhattan 464 145,000,000 −
Blue Heron Saratoga 82 10,250,000 3,920,000
Chappaqua Commons Westchester 64 11,470,000 2,145,000
Chelsea Apartments Housing Manhattan 269 104,000,000 −
Chelsea Arms Housing Manhattan 98 18,000,000 −
Clinton Green North Housing Manhattan 339 147,000,000 −
Clinton Green South Housing Manhattan 288 121,500,000 −
Clinton Park Housing Manhattan 222 70,000,000 −
Clinton Park Phase II Manhattan 480 145,000,007 −
College Arms Apartments Mount Pleasant 164 11,390,000 −
Dock Street Apartments Housing Brooklyn 289 100,500,000 −
East 84th Street Housing Manhattan 180 60,000,000 −
Gateway at New Cassel Housing North Hempstead 57 9,500,000 2,213,559
Gotham West Housing Manhattan 1,237 520,000,000 −
Grace Towers Housing Westchester 133 19,900,000 4,542,967
Halletts Point 125,000,000 −
Historic Front Street Housing Manhattan 96 46,300,000 −
Horizons at Wawayanda Housing Orange 107 12,100,000 4,102,275
Jackson Avenue Queens 98 32,800,000 −
Maestro West Manhattan 375 165,000,000 −
Manhattan West Residential Manhattan 845 479,000,000 −
Navy Pier Court Staten Island 571 23,700,000 −
New Settlement Apartments Bronx 893 86,000,000 −
North End Avenue Housing Manhattan 253 102,200,000 −
Ocean Bay Queens 1,395 213,250,000 −
Parkledge Apartments Housing Yonkers 311 39,000,000 −
Prospect Plaza Apartments Housing Brooklyn 151 23,300,000 4,386,283
Related ‐ 205 East 92nd Street Manhattan 186 220,000,000 −
Related ‐ 42th Street & 10th Avenue Manhattan 590 350,000,000 −
Related ‐ Capitol Green Apartments Housing Albany 308 16,500,000 −
Related ‐ Caroline Apartments Manhattan 126 16,900,000 −
Related ‐ Clarkston Maplewood Gardens Rockland 51 4,085,000 −
Related ‐ East 39th Street Housing Manhattan 254 75,500,000 −
Related ‐ McCarthy Manor Apartments Housing Syracuse 176 6,800,000 −
Related ‐ Ocean Park Apartments Housing Queens 602 39,000,000 −
Related ‐ Overlook Apartments Middletown 100 5,400,000 −
Related ‐ Taconic West 17th Street Housing Manhattan 288 126,000,000 −
Related ‐ Tribeca Green Housing Manhattan 274 110,000,000 −
Related ‐ Warren Knolls Apartments Housing Haverstraw 97 6,700,000 −
Related ‐ West 20th Street Housing Manhattan 254 88,000,000 −
Related ‐ West 23rd Street Housing Manhattan 313 110,000,000 −
Related ‐ West 30th Street Housing Manhattan 385 230,200,000 −
Related ‐ West Haverstraw Senior
Citizen Apartments Housing West Haverstraw 100 6,700,000 −
Related ‐ Weyant Green Apartments Housing Highfalls 51 3,800,000 785,000
Remeeder Houses Brooklyn 260 18,900,000 −
Reverend Polite Avenue Apartments Housing Bronx 161 16,000,000 −
Rip Van Winkle House Housing Poughkeepsie 179 11,500,000 −
6
No. of Mortgage Subsidy Loan
Project Location Apts. Commitment Commitment
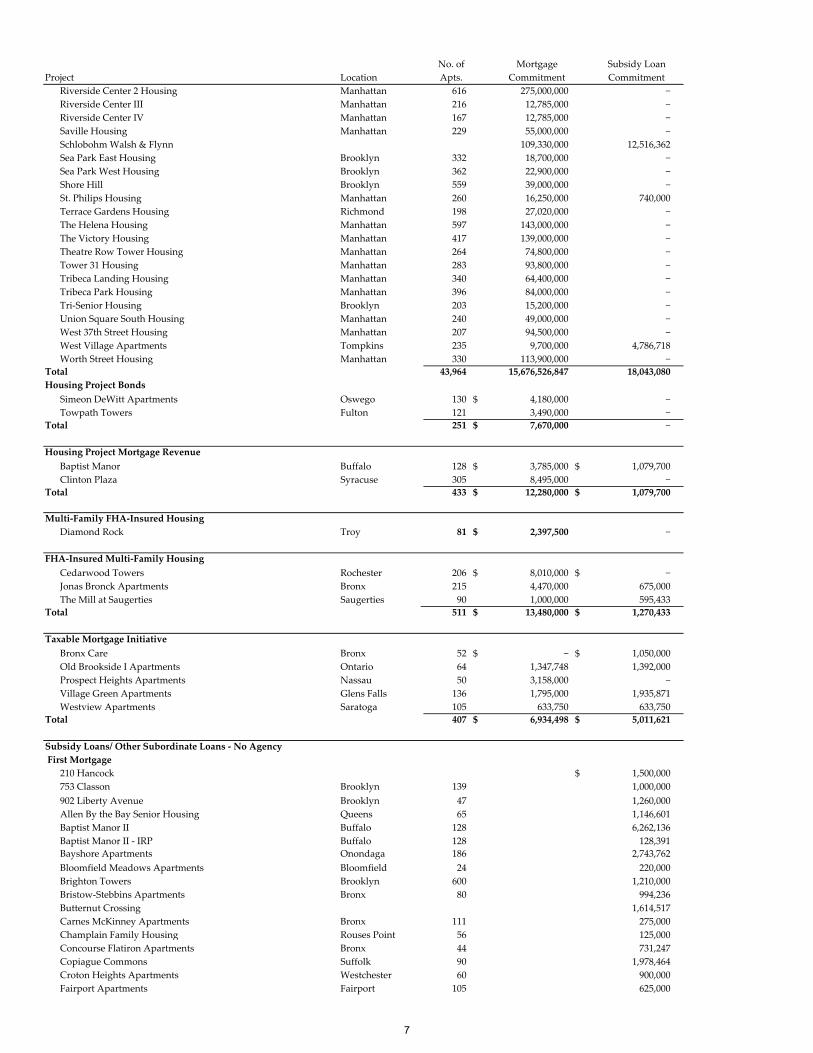
Riverside Center 2 Housing Manhattan 616 275,000,000 −
Riverside Center III Manhattan 216 12,785,000 −
Riverside Center IV Manhattan 167 12,785,000 −
Saville Housing Manhattan 229 55,000,000 −
Schlobohm Walsh & Flynn 109,330,000 12,516,362
Sea Park East Housing Brooklyn 332 18,700,000 −
Sea Park West Housing Brooklyn 362 22,900,000 −
Shore Hill Brooklyn 559 39,000,000 −
St. Philips Housing Manhattan 260 16,250,000 740,000
Terrace Gardens Housing Richmond 198 27,020,000 −
The Helena Housing Manhattan 597 143,000,000 −
The Victory Housing Manhattan 417 139,000,000 −
Theatre Row Tower Housing Manhattan 264 74,800,000 −
Tower 31 Housing Manhattan 283 93,800,000 −
Tribeca Landing Housing Manhattan 340 64,400,000 −
Tribeca Park Housing Manhattan 396 84,000,000 −
Tri‐Senior Housing Brooklyn 203 15,200,000 −
Union Square South Housing Manhattan 240 49,000,000 −
West 37th Street Housing Manhattan 207 94,500,000 −
West Village Apartments Tompkins 235 9,700,000 4,786,718
Worth Street Housing Manhattan 330 113,900,000 −
Total 43,964 15,676,526,847 18,043,080
Housing Project Bonds
Simeon DeWitt Apartments Oswego 130 $ 4,180,000 −
Towpath Towers Fulton 121 3,490,000 −
Total 251 $ 7,670,000 −
Housing Project Mortgage Revenue
Baptist Manor Buffalo 128 $ 3,785,000 $ 1,079,700
Clinton Plaza Syracuse 305 8,495,000 −
Total 433 $ 12,280,000 $ 1,079,700
Multi‐Family FHA‐Insured Housing
Diamond Rock Troy 81 $ 2,397,500 −
FHA‐Insured Multi‐Family Housing
Cedarwood Towers Rochester 206 $ 8,010,000 $ −
Jonas Bronck Apartments Bronx 215 4,470,000 675,000
The Mill at Saugerties Saugerties 90 1,000,000 595,433
Total 511 $ 13,480,000 $ 1,270,433
Taxable Mortgage Initiative
Bronx Care Bronx 52 $ − $ 1,050,000
Old Brookside I Apartments Ontario 64 1,347,748 1,392,000
Prospect Heights Apartments Nassau 50 3,158,000 −
Village Green Apartments Glens Falls 136 1,795,000 1,935,871
Westview Apartments Saratoga 105 633,750 633,750
Total 407 $ 6,934,498 $ 5,011,621
Subsidy Loans/ Other Subordinate Loans ‐ No Agency
First Mortgage
210 Hancock $ 1,500,000
753 Classon Brooklyn 139 1,000,000
902 Liberty Avenue Brooklyn 47 1,260,000
Allen By the Bay Senior Housing Queens 65 1,146,601
Baptist Manor II Buffalo 128 6,262,136
Baptist Manor II ‐ IRP Buffalo 128 128,391
Bayshore Apartments Onondaga 186 2,743,762
Bloomfield Meadows Apartments Bloomfield 24 220,000
Brighton Towers Brooklyn 600 1,210,000
Bristow‐Stebbins Apartments Bronx 80 994,236
Butternut Crossing 1,614,517
Carnes McKinney Apartments Bronx 111 275,000
Champlain Family Housing Rouses Point 56 125,000
Concourse Flatiron Apartments Bronx 44 731,247
Copiague Commons Suffolk 90 1,978,464
Croton Heights Apartments Westchester 60 900,000
Fairport Apartments Fairport 105 625,000
7
No. of Mortgage Subsidy Loan
Project Location Apts. Commitment Commitment
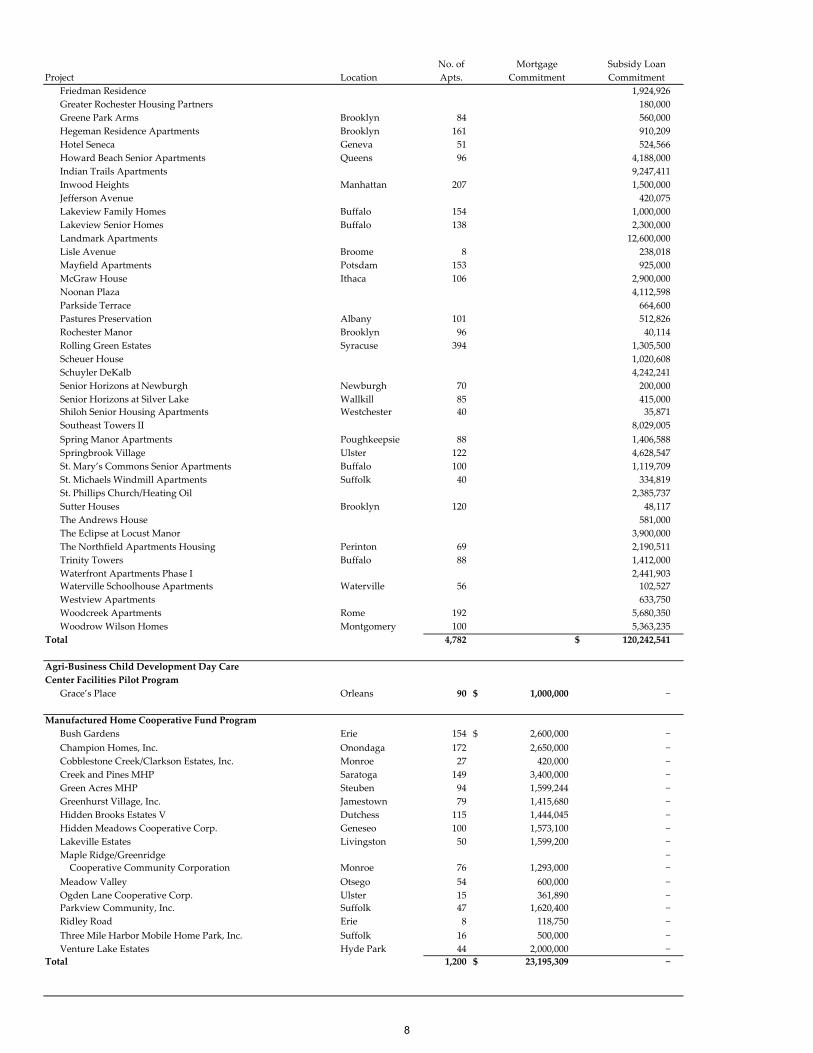
Friedman Residence 1,924,926
Greater Rochester Housing Partners 180,000
Greene Park Arms Brooklyn 84 560,000
Hegeman Residence Apartments Brooklyn 161 910,209
Hotel Seneca Geneva 51 524,566
Howard Beach Senior Apartments Queens 96 4,188,000
Indian Trails Apartments 9,247,411
Inwood Heights Manhattan 207 1,500,000
Jefferson Avenue 420,075
Lakeview Family Homes Buffalo 154 1,000,000
Lakeview Senior Homes Buffalo 138 2,300,000
Landmark Apartments 12,600,000
Lisle Avenue Broome 8 238,018
Mayfield Apartments Potsdam 153 925,000
McGraw House Ithaca 106 2,900,000
Noonan Plaza 4,112,598
Parkside Terrace 664,600
Pastures Preservation Albany 101 512,826
Rochester Manor Brooklyn 96 40,114
Rolling Green Estates Syracuse 394 1,305,500
Scheuer House 1,020,608
Schuyler DeKalb 4,242,241
Senior Horizons at Newburgh Newburgh 70 200,000
Senior Horizons at Silver Lake Wallkill 85 415,000
Shiloh Senior Housing Apartments Westchester 40 35,871
Southeast Towers II 8,029,005
Spring Manor Apartments Poughkeepsie 88 1,406,588
Springbrook Village Ulster 122 4,628,547
St. Mary’s Commons Senior Apartments Buffalo 100 1,119,709
St. Michaels Windmill Apartments Suffolk 40 334,819
St. Phillips Church/Heating Oil 2,385,737
Sutter Houses Brooklyn 120 48,117
The Andrews House 581,000
The Eclipse at Locust Manor 3,900,000
The Northfield Apartments Housing Perinton 69 2,190,511
Trinity Towers Buffalo 88 1,412,000
Waterfront Apartments Phase I 2,441,903
Waterville Schoolhouse Apartments Waterville 56 102,527
Westview Apartments 633,750
Woodcreek Apartments Rome 192 5,680,350
Woodrow Wilson Homes Montgomery 100 5,363,235
Total 4,782 $ 120,242,541
Agri‐Business Child Development Day Care
Center Facilities Pilot Program
Grace’s Place Orleans 90 $ 1,000,000 −
Manufactured Home Cooperative Fund Program
Bush Gardens Erie 154 $ 2,600,000 −
Champion Homes, Inc. Onondaga 172 2,650,000 −
Cobblestone Creek/Clarkson Estates, Inc. Monroe 27 420,000 −
Creek and Pines MHP Saratoga 149 3,400,000 −
Green Acres MHP Steuben 94 1,599,244 −
Greenhurst Village, Inc. Jamestown 79 1,415,680 −
Hidden Brooks Estates V Dutchess 115 1,444,045 −
Hidden Meadows Cooperative Corp. Geneseo 100 1,573,100 −
Lakeville Estates Livingston 50 1,599,200 −
Maple Ridge/Greenridge −
Cooperative Community Corporation Monroe 76 1,293,000 −
Meadow Valley Otsego 54 600,000 −
Ogden Lane Cooperative Corp. Ulster 15 361,890 −
Parkview Community, Inc. Suffolk 47 1,620,400 −
Ridley Road Erie 8 118,750 −
Three Mile Harbor Mobile Home Park, Inc. Suffolk 16 500,000 −
Venture Lake Estates Hyde Park 44 2,000,000 −
Total 1,200 $ 23,195,309 −
8
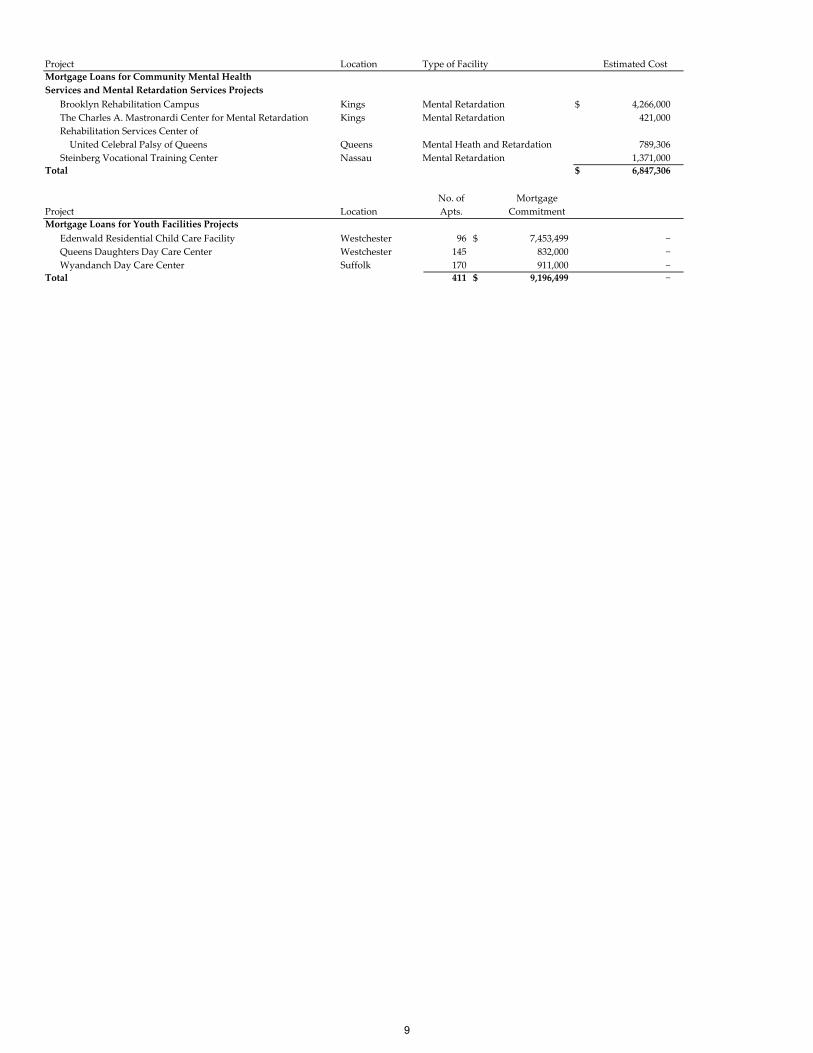
Project Location Type of Facility Estimated Cost
Mortgage Loans for Community Mental Health
Services and Mental Retardation Services Projects
Brooklyn Rehabilitation Campus Kings Mental Retardation $ 4,266,000
The Charles A. Mastronardi Center for Mental Retardation Kings Mental Retardation 421,000
Rehabilitation Services Center of
United Celebral Palsy of Queens Queens Mental Heath and Retardation 789,306
Steinberg Vocational Training Center Nassau Mental Retardation 1,371,000
Total $ 6,847,306
No. of Mortgage
Project Location Apts. Commitment
Mortgage Loans for Youth Facilities Projects
Edenwald Residential Child Care Facility Westchester 96 $ 7,453,499 −
Queens Daughters Day Care Center Westchester 145 832,000 −
Wyandanch Day Care Center Suffolk 170 911,000 −
Total 411 $ 9,196,499 −
9
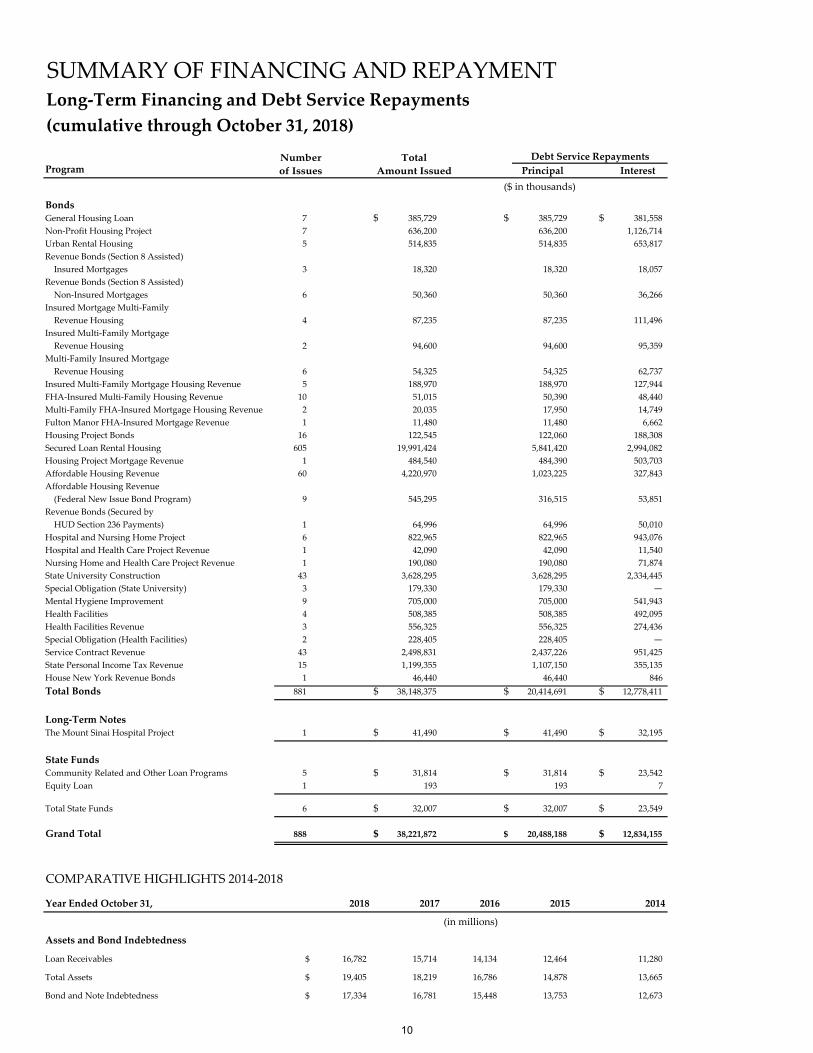
SUMMARY OF FINANCING AND REPAYMENTLong‐Term Financing and Debt Service Repayments
(cumulative through October 31, 2018)
Program Principal Interest
($ in thousands)
Bonds
General Housing Loan 7 $ 385,729 $ 385,729 $ 381,558
Non‐Profit Housing Project 7 636,200 636,200 1,126,714
Urban Rental Housing 5 514,835 514,835 653,817
Revenue Bonds (Section 8 Assisted)
Insured Mortgages 3 18,320 18,320 18,057
Revenue Bonds (Section 8 Assisted)
Non‐Insured Mortgages 6 50,360 50,360 36,266
Insured Mortgage Multi‐Family
Revenue Housing 4 87,235 87,235 111,496
Insured Multi‐Family Mortgage
Revenue Housing 2 94,600 94,600 95,359
Multi‐Family Insured Mortgage
Revenue Housing 6 54,325 54,325 62,737
Insured Multi‐Family Mortgage Housing Revenue 5 188,970 188,970 127,944
FHA‐Insured Multi‐Family Housing Revenue 10 51,015 50,390 48,440
Multi‐Family FHA‐Insured Mortgage Housing Revenue 2 20,035 17,950 14,749
Fulton Manor FHA‐Insured Mortgage Revenue 1 11,480 11,480 6,662
Housing Project Bonds 16 122,545 122,060 188,308
Secured Loan Rental Housing 605 19,991,424 5,841,420 2,994,082
Housing Project Mortgage Revenue 1 484,540 484,390 503,703
Affordable Housing Revenue 60 4,220,970 1,023,225 327,843
Affordable Housing Revenue
(Federal New Issue Bond Program) 9 545,295 316,515 53,851
Revenue Bonds (Secured by
HUD Section 236 Payments) 1 64,996 64,996 50,010
Hospital and Nursing Home Project 6 822,965 822,965 943,076
Hospital and Health Care Project Revenue 1 42,090 42,090 11,540
Nursing Home and Health Care Project Revenue 1 190,080 190,080 71,874
State University Construction 43 3,628,295 3,628,295 2,334,445
Special Obligation (State University) 3 179,330 179,330 —
Mental Hygiene Improvement 9 705,000 705,000 541,943
Health Facilities 4 508,385 508,385 492,095
Health Facilities Revenue 3 556,325 556,325 274,436
Special Obligation (Health Facilities) 2 228,405 228,405 —
Service Contract Revenue 43 2,498,831 2,437,226 951,425
State Personal Income Tax Revenue 15 1,199,355 1,107,150 355,135
House New York Revenue Bonds 1 46,440 46,440 846
Total Bonds 881 $ 38,148,375 $ 20,414,691 $ 12,778,411
Long‐Term Notes
The Mount Sinai Hospital Project 1 $ 41,490 $ 41,490 $ 32,195
State Funds
Community Related and Other Loan Programs 5 $ 31,814 $ 31,814 $ 23,542
Equity Loan 1 193 193 7
Total State Funds 6 $ 32,007 $ 32,007 $ 23,549
Grand Total 888 $ 38,221,872 $ 20,488,188 $ 12,834,155
COMPARATIVE HIGHLIGHTS 2014‐2018
Year Ended October 31, 2018 2017 2016 2015 2014
(in millions)
Assets and Bond Indebtedness
Loan Receivables $ 16,782 15,714 14,134 12,464 11,280
Total Assets $ 19,405 18,219 16,786 14,878 13,665
Bond and Note Indebtedness $ 17,334 16,781 15,448 13,753 12,673
Debt Service RepaymentsNumber
of Issues
Total
Amount Issued
10
11
A member firm of Ernst & Young Global Limited
Ernst & Young LLP 5 Times Square New York, NY 10036-6530
Tel: +1 212 773 3000 Fax: +1 212 773 6350 ey.com
Report of Independent Auditors
Management and Members of the Board New York State Housing Finance Agency
New York, New York
Report on the Financial Statements
We have audited the accompanying financial statements of the New York State Housing Finance Agency (the Agency), a component unit of the State of New York, as of and for the years ended October 31, 2018 and 2017, and the related notes to the financial statements, which collectively comprise the Agency’s basic financial statements as listed in the table of contents.
Management’s Responsibility for the Financial Statements
Management is responsible for the preparation and fair presentation of these financial statements in conformity with U.S. generally accepted accounting principles; this includes the design, implementation, and maintenance of internal control relevant to the preparation and fair presentation of financial statements that are free of material misstatement, whether due to fraud or error.
Auditor’s Responsibility
Our responsibility is to express an opinion on these financial statements based on our audits. We conducted our audits in accordance with auditing standards generally accepted in the United States and the standards applicable to financial audits contained in Government Auditing Standards, issued by the Comptroller General of the United States. Those standards require that we plan and perform the audits to obtain reasonable assurance about whether the financial statements are free of material misstatement.
An audit involves performing procedures to obtain audit evidence about the amounts and disclosures in the financial statements. The procedures selected depend on the auditor’s judgment, including the assessment of the risks of material misstatement of the financial statements, whether due to fraud or error. In making those risk assessments, the auditor considers internal control relevant to the entity’s preparation and fair presentation of the financial statements in order to design audit procedures that are appropriate in the circumstances, but not for the purpose of expressing an opinion on the effectiveness of the entity’s internal control. Accordingly, we express no such opinion. An audit also includes evaluating the appropriateness of accounting policies used and the reasonableness of significant accounting estimates made by management, as well as evaluating the overall presentation of the financial statements.
12
A member firm of Ernst & Young Global Limited
We believe that the audit evidence we have obtained is sufficient and appropriate to provide a basis for our audit opinion.
Opinion
In our opinion, the financial statements referred to above present fairly, in all material respects, the financial position of the Agency as of October 31, 2018 and 2017, and the changes in its financial position and its cash flows for the years then ended in conformity with U.S. generally accepted accounting principles.
Adoption of New Accounting Pronouncement
As discussed in Note 3 to the financial statements, as of November 1, 2016, the Agency adopted Governmental Accounting Standards Board Statement No, 75, Accounting and Financial Reporting for Postemployment Plans Other Than Pension Plans. Our opinion is not modified with respect to this matter.
Required Supplementary Information
U.S. generally accepted accounting principles require that Management’s Discussion and Analysis, the Schedule of Changes in Total OPEB Liability and Related Ratios, the Schedule of Contributions to the NYSLRS, and the Schedule of the New York State Housing Finance Agency’s Proportionate Share of the NYSLRS Net Pension Liability, as listed in the table of contents, be presented to supplement the basic financial statements. Such information, although not a part of the basic financial statements, is required by the Governmental Accounting Standards Board which considers it to be an essential part of financial reporting for placing the basic financial statements in an appropriate operational, economic or historical context. We have applied certain limited procedures to the required supplementary information in accordance with auditing standards generally accepted in the United States, which consisted of inquiries of management about the methods of preparing the information and comparing the information for consistency with management’s responses to our inquiries, the basic financial statements, and other knowledge we obtained during our audits of the basic financial statements. We do not express an opinion or provide any assurance on the information because the limited procedures do not provide us with sufficient evidence to express an opinion or provide any assurance.
Supplementary and Other Information
Our audits were conducted for the purpose of forming an opinion on the financial statements that collectively comprise the Agency’s basic financial statements. The Supplementary Section is presented for purposes of additional analysis and is not a required part of the basic financial statements.
13
A member firm of Ernst & Young Global Limited
The Supplementary Section is the responsibility of management and was derived from and relates directly to the underlying accounting and other records used to prepare the basic financial statements. Such information has been subjected to the auditing procedures applied in the audit of the basic financial statements and certain additional procedures, including comparing and reconciling such information directly to the underlying accounting and other records used to prepare the basic financial statements or to the basic financial statements themselves, and other additional procedures in accordance with auditing standards generally accepted in the United States. In our opinion, the Supplementary Section is fairly stated, in all material respects, in relation to the basic financial statements as a whole.
The Introductory Section has not been subjected to the auditing procedures applied in the audit of the basic financial statements, and, accordingly, we do not express an opinion or provide any assurance on it.
Other Reporting Required by Government Auditing Standards
In accordance with Government Auditing Standards, we also have issued our report dated January 28, 2019 on our consideration of the Agency’s internal control over financial reporting and on our tests of its compliance with certain provisions of laws, regulations, contracts, and grant agreements and other matters. The purpose of that report is solely to describe the scope of our testing of internal control over financial reporting and compliance and the results of that testing, and not to provide an opinion on of effectiveness of the Agency’s internal control over financial reporting or on compliance. That report is an integral part of an audit performed in accordance with Government Auditing Standards in considering the Agency’s internal control over financial reporting and compliance.
ey January 28, 2019
14
NEW YORK STATE HOUSING FINANCE AGENCY(A COMPONENT UNIT OF THE STATE OF NEW YORK)
MANAGEMENTʹS DISCUSSION AND ANALYSIS
FISCAL YEARS ENDED OCTOBER 31, 2018 AND 2017
Overview of the Financial Statements
The following is a narrative overview of the financial performance of the New York State Housing Finance Agency
(the “Agency”) for the fiscal years ended October 31, 2018 (“fiscal 2018”) and October 31, 2017 (“fiscal 2017”) with
selected comparative information for the fiscal year ended October 31, 2016 (“fiscal 2016”). Please read this analysis
in conjunction with the financial statements.
The annual financial statements consist of five parts: (1) management’s discussion and analysis (this section); (2) the
financial statements; (3) the notes to the financial statements; (4) required supplementary information and (5) the
supplemental schedules that report programs of the Agency individually.
The Agency’s financial statements are prepared using the accrual basis of accounting in conformity with U.S.
generally accepted accounting principles.
Management’s Discussion and Analysis
This section of the Agency’s financial statements, Management’s Discussion and Analysis (the “MD&A”),
presents an overview of the Agency’s financial performance during fiscal 2018 and fiscal 2017. It provides a
discussion of financial highlights and an assessment of how the Agency’s financial position has changed from
the past years. It identifies the factors that, in management’s view, significantly affected the Agency’s overall
financial position. It may contain opinions, assumptions or conclusions by the Agency’s management that
should not be considered a replacement for, and must be read in conjunction with, the financial statements
and other information described below.
The Financial Statements
The Statement of Net Position provides information about the liquidity and solvency of the Agency by
presenting the assets, deferred inflows and outflows of resources, liabilities and net position.
The Statement of Revenues, Expenses and Changes in Net Position accounts for all of the current year’s
revenues and expenses in order to measure the success of the Agency’s operations over the past year. It can be
used to determine how the Agency has funded its costs. By presenting the financial performance of the
Agency, the change in net position is similar to net profit or loss for a business.
The Statement of Cash Flows is presented on the direct method of reporting. It provides information about the
Agency’s cash receipts, cash payments, and net changes in cash resulting from operations, investing, and
financing activities. Cash collections and payments are presented in this statement to arrive at the net
increases or decreases in cash for each year.
The Notes to the Financial Statements
The notes provide information that is essential to understanding the financial statements, such as the Agency’s
accounting methods and policies;
Details include contractual obligations, future commitments and contingencies of the Agency when applicable;
Information is given regarding any other events or developing situations that could materially affect the
Agency’s financial position.
15
Required Supplementary Information (“RSI”)
The RSI schedules present information regarding the Agency’s (1) progress in funding its obligation to provide
postemployment benefits other than pensions to its employees, (2) Schedule of Contributions to the New York
State and Local Retirement System (“NYSLRS”) Pension Plan and (3) Schedule of the Proportionate Share of
the NYSLRS Net Pension Liability.
Supplementary Information
Presentations of the Agency’s financial information by program are listed in accordance with the requirements
of the various bond resolutions.
Background
The Agency was created as a public benefit corporation in 1960, under Article III of the Private Housing Finance
Law, to finance low and moderate income housing, primarily through the issuance of municipal securities and the
making of mortgage loans to eligible borrowers. Since its inception, the Agency has issued over $29.1 billion in
bonds to finance low and moderate income housing. The Agency administers finance programs which, combined
with other federal, state, and local resources, benefit the families and communities of New York State (the “State”).
During its 58 year history, the Agency’s mandate has been legislatively expanded to allow for the financing of
housing which meets a variety of needs of the people of New York. As a result, the Agency is authorized to issue
bonds to reimburse the State for appropriated expenditures for various housing capital programs.
The Agency and its corporate existence shall continue until terminated by law; provided, however that no such law
shall take effect so long as the Agency has bonds, notes or other obligations outstanding.
16
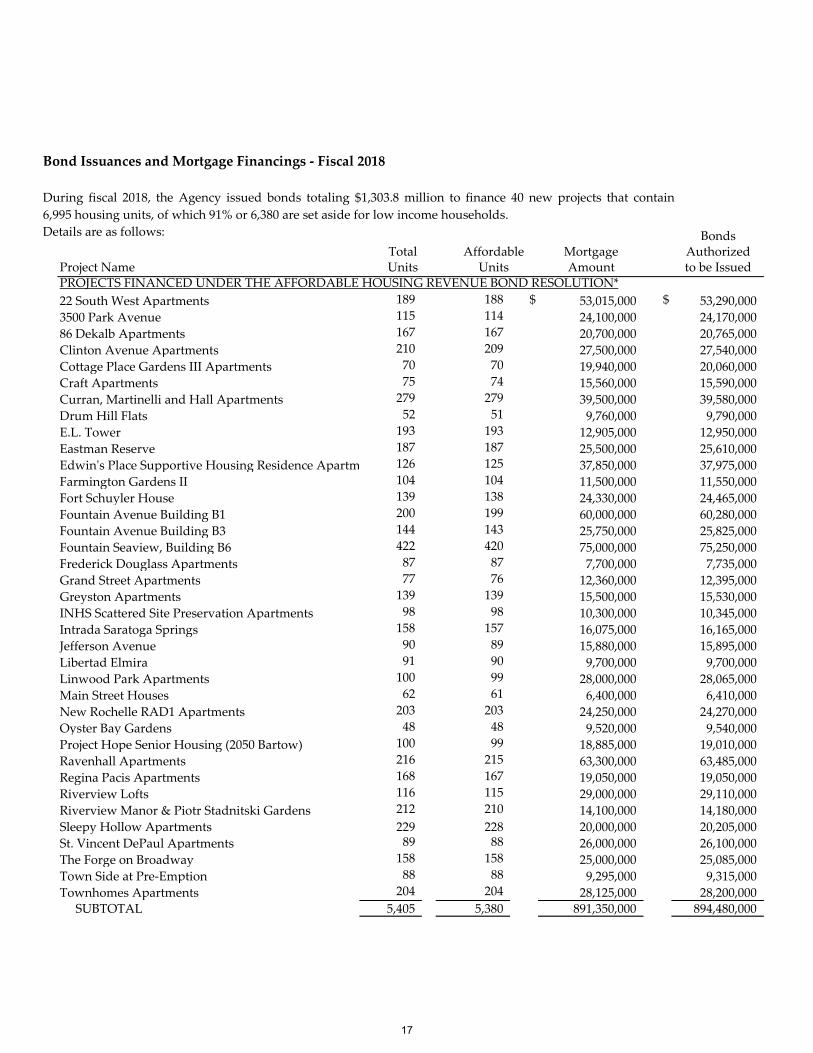
BondsMortgage Authorized
Project Name Amount to be IssuedPROJECTS FINANCED UNDER THE AFFORDABLE HOUSING REVENUE BOND RESOLUTION*
22 South West Apartments 189 188 $ 53,015,000 $ 53,290,000
3500 Park Avenue 115 114 24,100,000 24,170,000
86 Dekalb Apartments 167 167 20,700,000 20,765,000
Clinton Avenue Apartments 210 209 27,500,000 27,540,000
Cottage Place Gardens III Apartments 70 70 19,940,000 20,060,000
Craft Apartments 75 74 15,560,000 15,590,000
Curran, Martinelli and Hall Apartments 279 279 39,500,000 39,580,000
Drum Hill Flats 52 51 9,760,000 9,790,000
E.L. Tower 193 193 12,905,000 12,950,000
Eastman Reserve 187 187 25,500,000 25,610,000
Edwinʹs Place Supportive Housing Residence Apartm 126 125 37,850,000 37,975,000
Farmington Gardens II 104 104 11,500,000 11,550,000
Fort Schuyler House 139 138 24,330,000 24,465,000
Fountain Avenue Building B1 200 199 60,000,000 60,280,000
Fountain Avenue Building B3 144 143 25,750,000 25,825,000
Fountain Seaview, Building B6 422 420 75,000,000 75,250,000
Frederick Douglass Apartments 87 87 7,700,000 7,735,000
Grand Street Apartments 77 76 12,360,000 12,395,000
Greyston Apartments 139 139 15,500,000 15,530,000
INHS Scattered Site Preservation Apartments 98 98 10,300,000 10,345,000
Intrada Saratoga Springs 158 157 16,075,000 16,165,000
Jefferson Avenue 90 89 15,880,000 15,895,000
Libertad Elmira 91 90 9,700,000 9,700,000
Linwood Park Apartments 100 99 28,000,000 28,065,000
Main Street Houses 62 61 6,400,000 6,410,000
New Rochelle RAD1 Apartments 203 203 24,250,000 24,270,000
Oyster Bay Gardens 48 48 9,520,000 9,540,000
Project Hope Senior Housing (2050 Bartow) 100 99 18,885,000 19,010,000
Ravenhall Apartments 216 215 63,300,000 63,485,000
Regina Pacis Apartments 168 167 19,050,000 19,050,000
Riverview Lofts 116 115 29,000,000 29,110,000
Riverview Manor & Piotr Stadnitski Gardens 212 210 14,100,000 14,180,000
Sleepy Hollow Apartments 229 228 20,000,000 20,205,000
St. Vincent DePaul Apartments 89 88 26,000,000 26,100,000
The Forge on Broadway 158 158 25,000,000 25,085,000
Town Side at Pre‐Emption 88 88 9,295,000 9,315,000
Townhomes Apartments 204 204 28,125,000 28,200,000 SUBTOTAL 5,405 5,380 891,350,000 894,480,000
Total Affordable Units Units
Bond Issuances and Mortgage Financings ‐ Fiscal 2018
During fiscal 2018, the Agency issued bonds totaling $1,303.8 million to finance 40 new projects that contain
6,995 housing units, of which 91% or 6,380 are set aside for low income households.
Details are as follows:
17
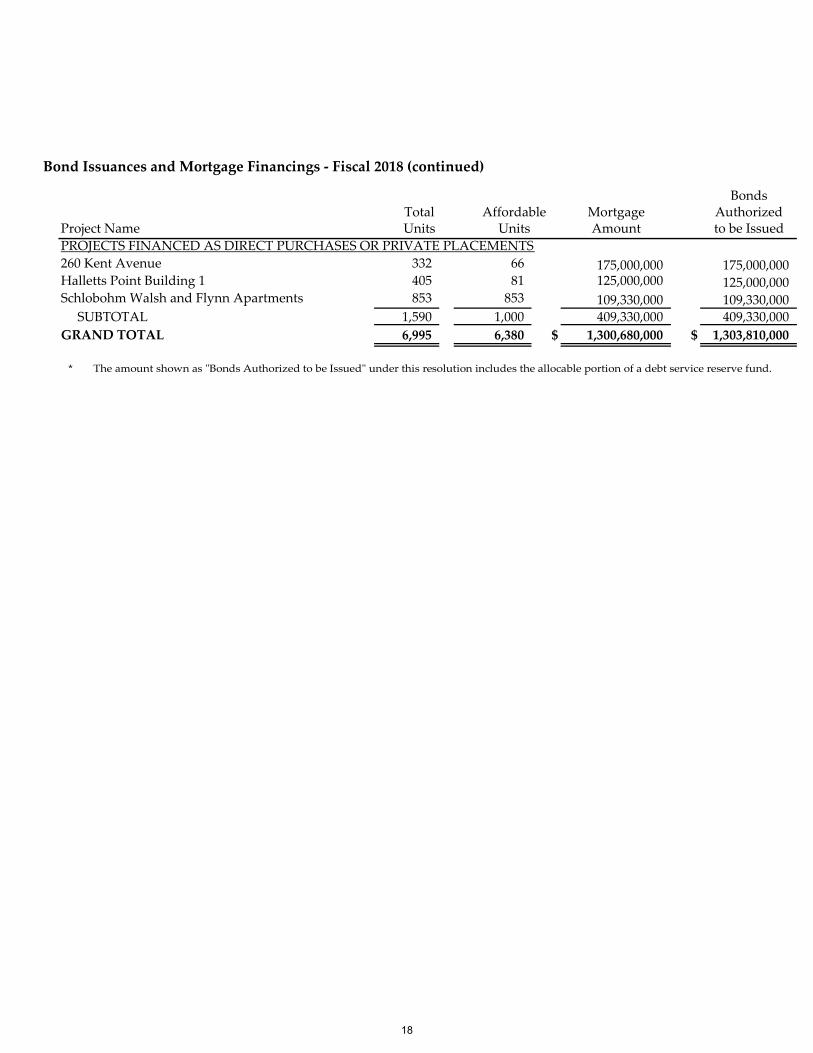
BondsMortgage Authorized
Project Name Amount to be Issued
PROJECTS FINANCED AS DIRECT PURCHASES OR PRIVATE PLACEMENTS
260 Kent Avenue 332 66 175,000,000 175,000,000 Halletts Point Building 1 405 81 125,000,000 125,000,000 Schlobohm Walsh and Flynn Apartments 853 853 109,330,000 109,330,000
SUBTOTAL 1,590 1,000 409,330,000 409,330,000
GRAND TOTAL 6,995 6,380 $ 1,300,680,000 $ 1,303,810,000
Total Affordable Units Units
Bond Issuances and Mortgage Financings ‐ Fiscal 2018 (continued)
* The amount shown as ʺBonds Authorized to be Issuedʺ under this resolution includes the allocable portion of a debt service reserve fund.
18
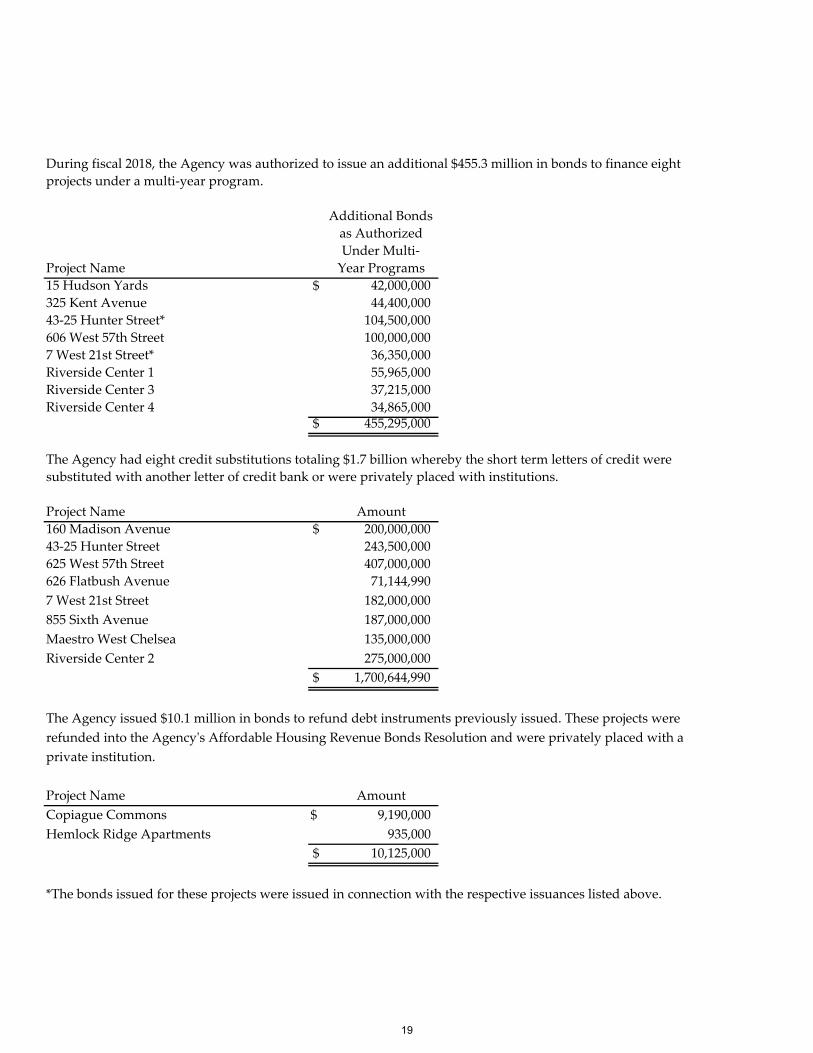
Additional Bonds
as Authorized
Under Multi‐
Project Name Year Programs
15 Hudson Yards $ 42,000,000
325 Kent Avenue 44,400,000
43‐25 Hunter Street* 104,500,000
606 West 57th Street 100,000,000
7 West 21st Street* 36,350,000
Riverside Center 1 55,965,000
Riverside Center 3 37,215,000
Riverside Center 4 34,865,000$ 455,295,000
The Agency had eight credit substitutions totaling $1.7 billion whereby the short term letters of credit were
Project Name Amount
160 Madison Avenue $ 200,000,000
43‐25 Hunter Street 243,500,000
625 West 57th Street 407,000,000
626 Flatbush Avenue 71,144,990
7 West 21st Street 182,000,000
855 Sixth Avenue 187,000,000
Maestro West Chelsea 135,000,000
Riverside Center 2 275,000,000
$ 1,700,644,990
The Agency issued $10.1 million in bonds to refund debt instruments previously issued. These projects were
refunded into the Agencyʹs Affordable Housing Revenue Bonds Resolution and were privately placed with a
Project Name Amount
Copiague Commons $ 9,190,000
Hemlock Ridge Apartments 935,000
$ 10,125,000
*The bonds issued for these projects were issued in connection with the respective issuances listed above.
During fiscal 2018, the Agency was authorized to issue an additional $455.3 million in bonds to finance eight
projects under a multi‐year program.
substituted with another letter of credit bank or were privately placed with institutions.
private institution.
19
BondsMortgage Authorized
Project Name Amount to be Issued
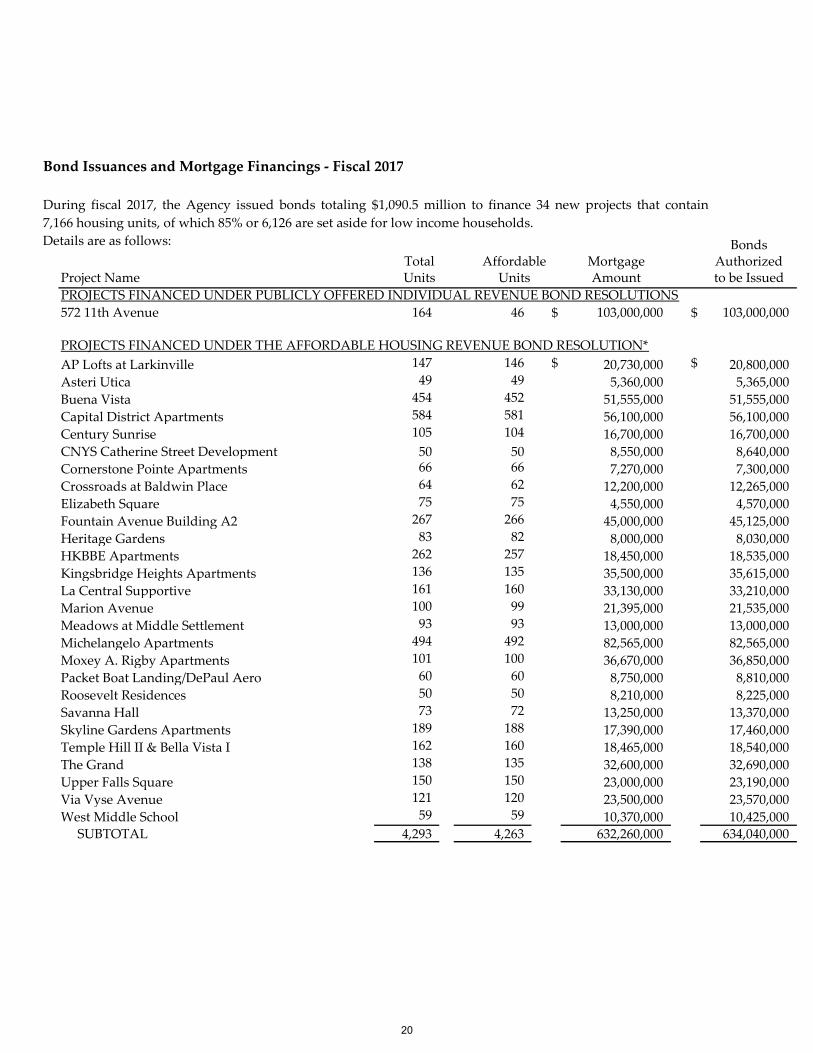
PROJECTS FINANCED UNDER PUBLICLY OFFERED INDIVIDUAL REVENUE BOND RESOLUTIONS
572 11th Avenue 164 46 $ 103,000,000 $ 103,000,000
PROJECTS FINANCED UNDER THE AFFORDABLE HOUSING REVENUE BOND RESOLUTION*
AP Lofts at Larkinville 147 146 $ 20,730,000 $ 20,800,000
Asteri Utica 49 49 5,360,000 5,365,000
Buena Vista 454 452 51,555,000 51,555,000
Capital District Apartments 584 581 56,100,000 56,100,000
Century Sunrise 105 104 16,700,000 16,700,000
CNYS Catherine Street Development 50 50 8,550,000 8,640,000
Cornerstone Pointe Apartments 66 66 7,270,000 7,300,000
Crossroads at Baldwin Place 64 62 12,200,000 12,265,000
Elizabeth Square 75 75 4,550,000 4,570,000
Fountain Avenue Building A2 267 266 45,000,000 45,125,000
Heritage Gardens 83 82 8,000,000 8,030,000
HKBBE Apartments 262 257 18,450,000 18,535,000
Kingsbridge Heights Apartments 136 135 35,500,000 35,615,000
La Central Supportive 161 160 33,130,000 33,210,000
Marion Avenue 100 99 21,395,000 21,535,000
Meadows at Middle Settlement 93 93 13,000,000 13,000,000
Michelangelo Apartments 494 492 82,565,000 82,565,000
Moxey A. Rigby Apartments 101 100 36,670,000 36,850,000
Packet Boat Landing/DePaul Aero 60 60 8,750,000 8,810,000
Roosevelt Residences 50 50 8,210,000 8,225,000
Savanna Hall 73 72 13,250,000 13,370,000
Skyline Gardens Apartments 189 188 17,390,000 17,460,000
Temple Hill II & Bella Vista I 162 160 18,465,000 18,540,000
The Grand 138 135 32,600,000 32,690,000
Upper Falls Square 150 150 23,000,000 23,190,000
Via Vyse Avenue 121 120 23,500,000 23,570,000
West Middle School 59 59 10,370,000 10,425,000
SUBTOTAL 4,293 4,263 632,260,000 634,040,000
Total Affordable Units Units
Bond Issuances and Mortgage Financings ‐ Fiscal 2017
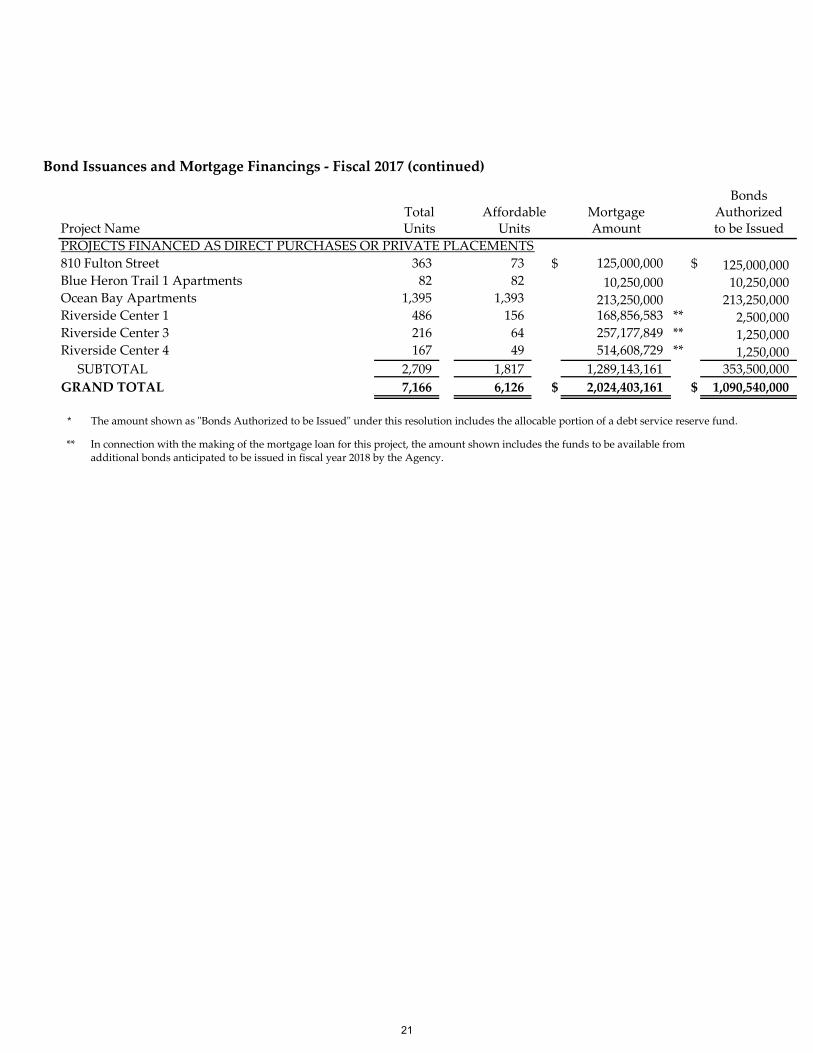
During fiscal 2017, the Agency issued bonds totaling $1,090.5 million to finance 34 new projects that contain
7,166 housing units, of which 85% or 6,126 are set aside for low income households.
Details are as follows:
20
BondsMortgage Authorized
Project Name Amount to be Issued
PROJECTS FINANCED AS DIRECT PURCHASES OR PRIVATE PLACEMENTS
810 Fulton Street 363 73 $ 125,000,000 $ 125,000,000 Blue Heron Trail 1 Apartments 82 82 10,250,000 10,250,000 Ocean Bay Apartments 1,395 1,393 213,250,000 213,250,000 Riverside Center 1 486 156 168,856,583 ** 2,500,000 Riverside Center 3 216 64 257,177,849 ** 1,250,000 Riverside Center 4 167 49 514,608,729 ** 1,250,000
SUBTOTAL 2,709 1,817 1,289,143,161 353,500,000
GRAND TOTAL 7,166 6,126 $ 2,024,403,161 $ 1,090,540,000
Total Affordable Units Units
Bond Issuances and Mortgage Financings ‐ Fiscal 2017 (continued)
* The amount shown as ʺBonds Authorized to be Issuedʺ under this resolution includes the allocable portion of a debt service reserve fund.
** In connection with the making of the mortgage loan for this project, the amount shown includes the funds to be available from additional bonds anticipated to be issued in fiscal year 2018 by the Agency.
21
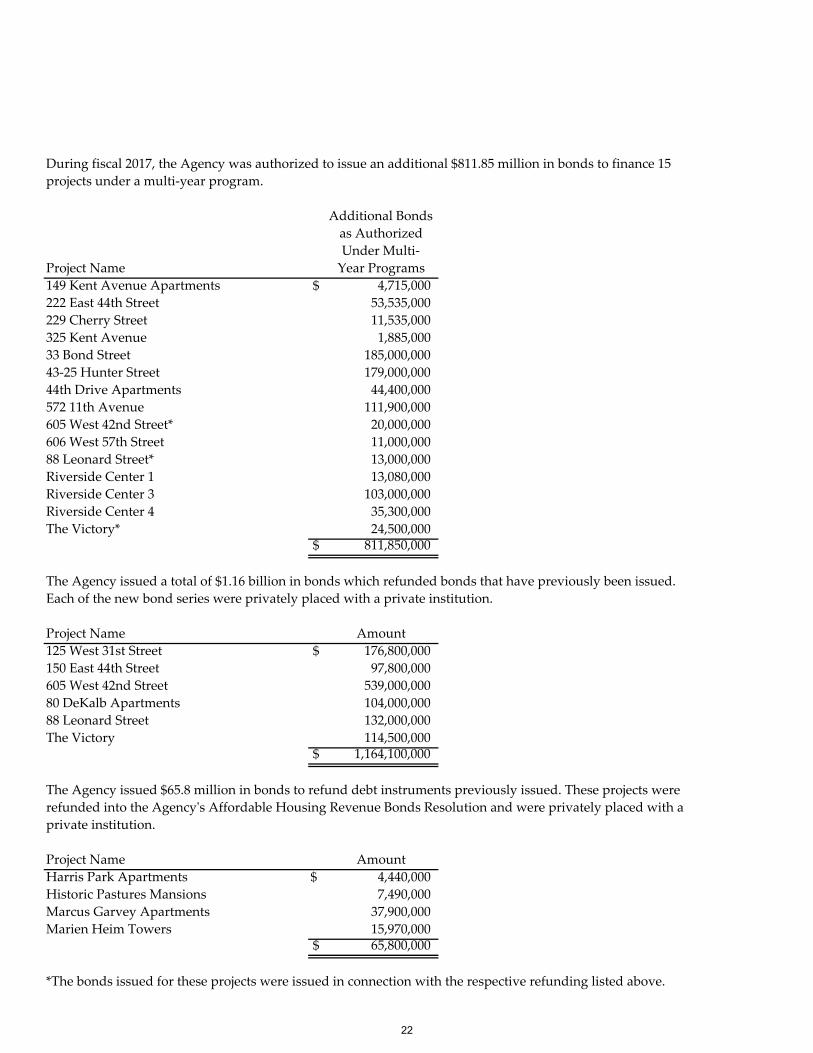
Additional Bonds
as Authorized
Under Multi‐
Project Name Year Programs
149 Kent Avenue Apartments $ 4,715,000
222 East 44th Street 53,535,000
229 Cherry Street 11,535,000
325 Kent Avenue 1,885,000
33 Bond Street 185,000,000
43‐25 Hunter Street 179,000,000
44th Drive Apartments 44,400,000
572 11th Avenue 111,900,000
605 West 42nd Street* 20,000,000
606 West 57th Street 11,000,000
88 Leonard Street* 13,000,000
Riverside Center 1 13,080,000
Riverside Center 3 103,000,000
Riverside Center 4 35,300,000
The Victory* 24,500,000$ 811,850,000
The Agency issued a total of $1.16 billion in bonds which refunded bonds that have previously been issued.
Project Name Amount
125 West 31st Street $ 176,800,000
150 East 44th Street 97,800,000
605 West 42nd Street 539,000,000
80 DeKalb Apartments 104,000,000
88 Leonard Street 132,000,000
The Victory 114,500,000$ 1,164,100,000
The Agency issued $65.8 million in bonds to refund debt instruments previously issued. These projects were
refunded into the Agencyʹs Affordable Housing Revenue Bonds Resolution and were privately placed with a
Project Name Amount
Harris Park Apartments $ 4,440,000
Historic Pastures Mansions 7,490,000
Marcus Garvey Apartments 37,900,000
Marien Heim Towers 15,970,000$ 65,800,000
*The bonds issued for these projects were issued in connection with the respective refunding listed above.
During fiscal 2017, the Agency was authorized to issue an additional $811.85 million in bonds to finance 15
projects under a multi‐year program.
Each of the new bond series were privately placed with a private institution.
private institution.
22
October 31,
2018 2017 2016
(Restated)
Assets:
Cash $ 216,989 $ 268,633 $ 331,113 (19%) (19%)
Mortgage loans receivable ‐ net 16,782,114 15,713,871 14,134,407 7% 11%
Investments including accrued
interest receivable 2,325,267 2,162,416 2,254,695 8% (4%)
Other assets 80,434 74,524 65,533 8% 14%
Total assets 19,404,804 18,219,444 16,785,748 7% 9%
Deferred outflows of resources:
Deferred outflows relating to other
postemployment benefits 2,359 2,696 — (13%) N/A
Accumulated decrease in fair value
of hedging derivatives 10,521 18,369 27,552 (43%) (33%)
Deferred outflows relating to pension 2,794 1,840 3,829 52% (52%)
Total deferred outflows of resources 15,674 22,905 31,381 (32%) (27%)
Liabilities:
Bonds payable and other debt obligations 17,733,852 16,780,581 15,448,200 6% 9%
Derivative instruments ‐ interest rate swaps 10,521 18,369 27,552 (43%) (33%)
Interest payable 78,598 60,553 44,802 30% 35%
Accounts payable and other 19,419 17,806 14,826 9% 20%
Amounts received in advance and other 458,898 437,017 469,256 5% (7%)
Other postemployment benefits 40,136 41,212 47,112 (3%) (13%)
Total liabilities 18,341,424 17,355,538 16,051,748 6% 8%
Deferred inflows of resources:
Deferred inflows relating to other
postemployment benefits 2,523 134 — 1,783% N/A
Gain on defeasance ‐ net 823 789 1,306 4% (40%)
Deferred inflows relating to pension 2,712 348 456 679% (24%)
Total deferred inflows of resources 6,058 1,271 1,762 377% (28%)
Net position $ 1,072,996 $ 885,540 $ 763,619 21% 16%
2018‐2017 2017‐2016
% Change
Condensed Financial Information
NEW YORK STATE HOUSING FINANCE AGENCY
Statements of Net Position
(in thousands)
23
Assets
Mortgage Loans Receivable ‐ Net
Mortgage loans receivable – net increased by approximately $1.068 billion, or 7% from $15.714 billion (86% of total
assets) at October 31, 2017 to $16.782 billion (86% of total assets) at October 31, 2018. This compares with an increase
of approximately $1.579 billion, or 11% from $14.134 billion (84% of total assets) at October 31, 2016 to $15.714 billion
(86% of total assets) at October 31, 2017. The increase in each period was a result of increased lending activity.
Cash and Investments
Restricted cash and investments are held principally by a bond trustee or a depository. These funds are held for the
following purposes:
Bond proceeds held to fund construction loans for projects with mortgage commitments remaining to be
funded. Such funds are invested until disbursed to borrowers and constitute the largest portion of restricted
investments held.
As reserves for debt held under the specific requirements of bond resolutions.
To fund debt service on bonds when such payments are due.
Funds received from governmental entities to be disbursed to projects on whose behalf such funds were
received.
Escrow and reserve funds held for the benefit of the projects on whose behalf such funds were remitted.
Funds available to be advanced for subsidy loans.
Unrestricted cash and investments are held principally by a depository. These assets are held to fund the operating
costs of the Agency. When unrestricted funds are committed to be advanced as subsidy loans, the funds are
transferred to restricted assets.
Primarily as a result of fluctuations in the amount of bond proceeds remaining on deposit, investments (including
accrued interest receivable thereon) increased from $2.162 billion at October 31, 2017 to $2.325 billion at October 31,
2018, an increase of approximately $163 million, or 8%, as compared with a decrease from $2.255 billion at October
31, 2016 to $2.162 billion at October 31, 2017, a decrease of approximately $93 million, or 4%.
Other Assets
Other assets primarily represent interest receivable due on mortgage loans. Other assets increased from $74.5
million at October 31, 2017 to $80.4 million at October 31, 2018, an increase of approximately $5.9 million, or 8%.
This compares with the increase from $65.5 million at October 31, 2016 to $74.5 million at October 31, 2017, an
increase of approximately $9.0 million, or 14%. The increases in each year were primarily a result of the continued
rise in interest rates which resulted in higher rates on new loans closed and also higher rates on variable rate loans.
Additionally, the State has committed additional resources to fund subsidy loans.
24
Deferred Outflows of Resources
The Agency has entered into various interest rate swap contracts in order to manage risk associated with interest on
its State Revenue Bond Program portfolio. In accordance with Governmental Accounting Standards Board
(“GASB”) Statement No. 53, Accounting and Financial Reporting for Derivative Instruments (“GASB No. 53”), the
Agency recognizes the fair value of all derivative instruments as either an asset or liability on its statements of net
position with the offsetting gains or losses recognized in earnings or as either deferred inflows or outflows, if
deemed an effective hedge (see note 11). For fiscal 2018, 2017 and 2016, all of the Agency’s interest rate swaps were
determined to be effective hedges. Therefore, the Agency recorded the decrease in the fair value of these interest
rate swaps as a liability along with a corresponding deferred outflow of resources.
Due to the aforementioned continued rise in interest rates, the liability position of the interest rate swaps decreased
from approximately $18.4 million at October 31, 2017 to $10.5 million at October 31, 2018, a decrease of
approximately $7.9 million, or 43%. This compares with a decrease from approximately $27.6 million at October 31,
2016 to $18.4 million at October 31, 2017, a decrease of approximately $9.2 million, or 33%.
Liabilities
Bonds Payable and Other Debt Obligations
At approximately 97% of total liabilities as of October 31, 2018 and 2017 and at approximately 96% of total liabilities
as of October 31, 2016, bonds payable and other debt obligations comprise the largest component of the Agency’s
liabilities over the aforementioned periods. Funds generated by the sale of bonds are used to fund mortgage loans.
The payments due on mortgage loans receivable, together with interest earnings, are used to fund the debt service
payments due on bonds payable and other debt obligations.
Bonds payable and other debt obligations increased from $16.781 billion at October 31, 2017 to $17.734 billion at
October 31, 2018, an increase of approximately $953 million, or 6%. This was a result of the activity during fiscal
2018 in which bonds were issued in the amount of approximately $2.711 billion and retired or redeemed, in the
amount of approximately $1.758 billion. This compares with the increase from $15.448 billion at October 31, 2016 to
$16.781 billion at October 31, 2017, an increase of approximately $1.333 billion, or 9%.
Interest Payable
Primarily as a result of continued bond issuance activity and the continued rise in interest rates, interest payable
increased from $60.6 million at October 31, 2017 to $78.6 million at October 31, 2018, an increase of approximately
$18.0 million, or 30%. This compares with the increase from $44.8 million at October 31, 2016 to $60.6 million at
October 31, 2017, an increase of approximately $15.8 million, or 35%.
25
Accounts Payable and Other
Accounts payable and other increased from $17.8 million in fiscal 2017 to $19.4 million in fiscal 2018, an increase of
approximately $1.6 million, or 9%, primarily as a result of a delay in the payment of certain funds due to the State
and the accrual of certain expenses relating to new Agency lease which was signed in December 2018. This
compares with the increase from $14.8 million in fiscal 2016 to $17.8 million in fiscal 2017, an increase of
approximately $3.0 million, or 20%.
Amounts Received in Advance and Other
Amounts received in advance and other increased from $437.0 million in fiscal 2017 to $458.9 million in fiscal 2018,
an increase of approximately $21.9 million, or 5%, primarily as a result of the receipt of additional principal reserve
payments which are held on mortgages financed by variable rate debt until such time as the bonds are amortized.
At that time, the funds are applied to the related mortgage balance. This compares with the decrease from $469.3
million in fiscal 2016 to $437.0 million in fiscal 2017, a decrease of approximately $32.3 million, or 7%. The decrease
was primarily due to the release of funds on deposit held as principal reserve funds, as instructed by Fannie Mae for
bond restructure.
Other Postemployment Benefits
The Agency provides certain group health care benefits to eligible retirees (and for eligible dependents and survivors
of such retirees). The balance in other postemployment benefits represents the accumulated unfunded actuarial
liability required to pay the cost of retiree health care benefits. An actuarial calculation is performed on a bi‐annual
basis and is rolled forward to the next fiscal year. The accumulated amount of other postemployment benefits
decreased from $41.2 million in fiscal 2017 to $40.1 million in fiscal 2018, a decrease of approximately $1.1 million, or
3%. The decline was a result of the change in the discount rate of 3.65% per annum as of October 31, 2017, 3.32% per
annum as of October 31, 2016 and 3.66% per annum as of October 31, 2015. Additionally, the balance was affected
by the implementation of GASB Statement No. 75, Accounting and Financial Reporting for Postemployment Benefits Other
Than Pensions (“GASB No. 75”) in fiscal 2018, effective in fiscal 2017. This compares with a decrease from $47.1
million in fiscal 2016 to $41.2 million in fiscal 2017, a decrease of approximately $5.9 million, or 13%, which was
calculated under GASB Statement No. 45, Accounting and Financial Reporting by Employers for Postemployment Benefits
Other Than Pensions (“GASB No. 45”) which was superseded by GASB No. 75 (see note 12 for detail).
26
2018 2017 2016
(Restated)
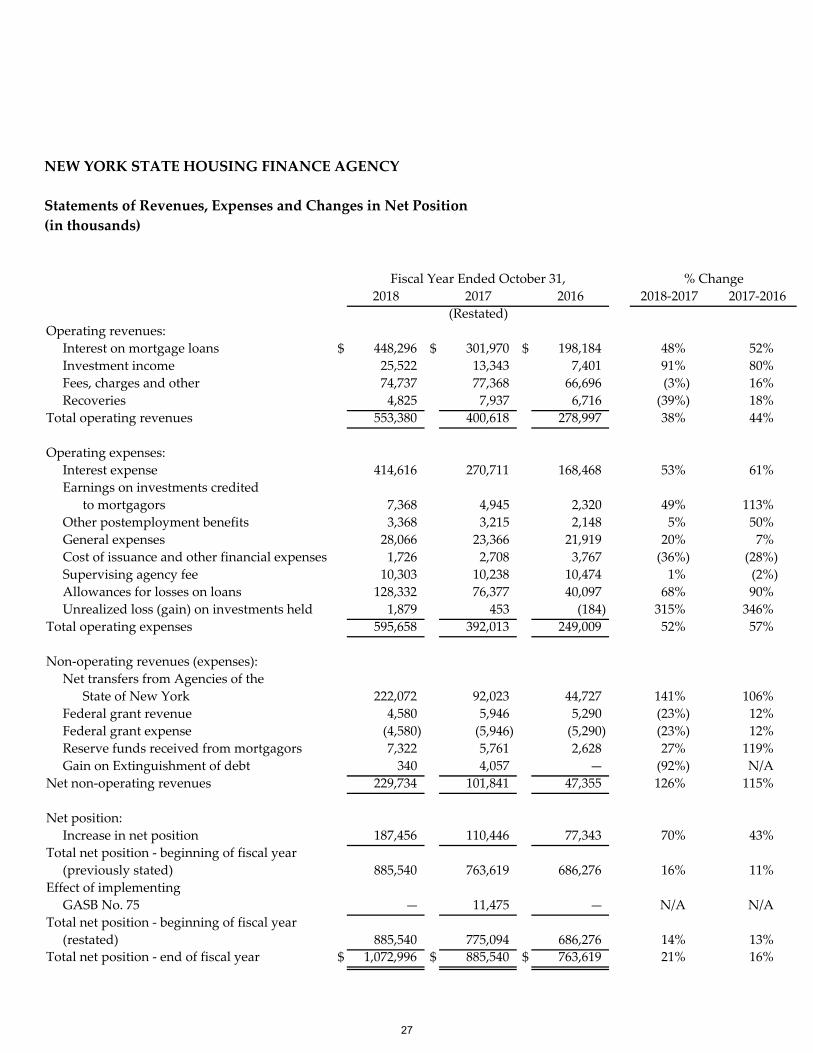
Operating revenues:
Interest on mortgage loans $ 448,296 $ 301,970 $ 198,184 48% 52%
Investment income 25,522 13,343 7,401 91% 80%
Fees, charges and other 74,737 77,368 66,696 (3%) 16%
Recoveries 4,825 7,937 6,716 (39%) 18%
Total operating revenues 553,380 400,618 278,997 38% 44%
Operating expenses:
Interest expense 414,616 270,711 168,468 53% 61%
Earnings on investments credited
to mortgagors 7,368 4,945 2,320 49% 113%
Other postemployment benefits 3,368 3,215 2,148 5% 50%
General expenses 28,066 23,366 21,919 20% 7%
Cost of issuance and other financial expenses 1,726 2,708 3,767 (36%) (28%)
Supervising agency fee 10,303 10,238 10,474 1% (2%)
Allowances for losses on loans 128,332 76,377 40,097 68% 90%
Unrealized loss (gain) on investments held 1,879 453 (184) 315% 346%
Total operating expenses 595,658 392,013 249,009 52% 57%
Non‐operating revenues (expenses):
Net transfers from Agencies of the
State of New York 222,072 92,023 44,727 141% 106%
Federal grant revenue 4,580 5,946 5,290 (23%) 12%
Federal grant expense (4,580) (5,946) (5,290) (23%) 12%
Reserve funds received from mortgagors 7,322 5,761 2,628 27% 119%
Gain on Extinguishment of debt 340 4,057 — (92%) N/A
Net non‐operating revenues 229,734 101,841 47,355 126% 115%
Net position:
Increase in net position 187,456 110,446 77,343 70% 43%
Total net position ‐ beginning of fiscal year
(previously stated) 885,540 763,619 686,276 16% 11%
Effect of implementing
GASB No. 75 — 11,475 — N/A N/A
Total net position ‐ beginning of fiscal year
(restated) 885,540 775,094 686,276 14% 13%
Total net position ‐ end of fiscal year $ 1,072,996 $ 885,540 $ 763,619 21% 16%
Fiscal Year Ended October 31,
2018‐2017 2017‐2016
% Change
NEW YORK STATE HOUSING FINANCE AGENCY
Statements of Revenues, Expenses and Changes in Net Position
(in thousands)
27
Operating revenues
Interest on Mortgage Loans
Interest on mortgage loans increased from $302.0 million in fiscal 2017 to $448.3 million in fiscal 2018, an increase of
approximately $146.3 million, or 48%, as compared with an increase from $198.2 million in fiscal 2016 to $302.0
million in fiscal 2017, an increase of approximately $103.8 million, or 52%. The increases were the result of increased
lending activity and the continued rise in interest rates. Interest on mortgage loans represents the Agency’s primary
source of funds available to pay interest expense due on bonds payable.
Investment Income
Primarily as a result of the fluctuations in interest rates on invested funds and additional investments held due to the
timing of bond sales and the timing of the advance of mortgage funds, investment income increased from $13.3
million in fiscal 2017 to $25.5 million in fiscal 2018, an increase of approximately $12.2 million, or 91%. This
compares with an increase from $7.4 million in fiscal 2016 to $13.3 million in fiscal 2017, an increase of approximately
$5.9 million, or 80%.
Fees, Charges and Other
Fees, charges and other represent revenues earned from borrowers relating to outstanding mortgage loans, in
addition to charges for tax credit monitoring and mortgage origination fees. It also includes various one‐time
payments due to the Agency, including public purpose fees due under certain conditions, in accordance with the
terms of various regulatory agreements. Primarily as a result of the Agency’s greater focus on all affordable
mortgage lending, fees, charges and other decreased from $77.4 million in fiscal 2017 to $74.7 million in fiscal 2018, a
decrease of approximately $2.7 million, or 3%. This compares with an increase from $66.7 million in fiscal 2016 to
$77.4 million in fiscal 2017, an increase of approximately $10.7 million, or 16%.
Recoveries
Recoveries represent payments received relating to mortgages for which an allowance had previously been
established. Primarily as a result of the refinancings of certain mortgages in the Mitchell Lama mortgage portfolio,
other mortgage loan payoffs throughout the periods and the repayment of subsidy loans, the Agency received
recovery amounts relating to loans for which an allowance had been established in prior fiscal years. Recoveries
decreased from $7.9 million in 2017 to $4.8 million in fiscal 2018, a decrease of approximately $3.1 million, or 39%.
This compares with the increase from $6.7 million in 2016 to $7.9 million in fiscal 2017, an increase of approximately
$1.2 million, or 18%. The amounts fluctuate due to the volume and specific components of various refinancings and
other loan payoffs.
28
Operating expenses
Interest Expense
Interest expense increased from $270.7 million in fiscal 2017 to $414.6 million in fiscal 2018, an increase of
approximately $143.9 million, or 53%. This compares with an increase from $168.5 million in fiscal 2016 to $270.7
million in fiscal 2017, an increase of approximately $102.2 million, or 61%. The increase in interest expense from
fiscal 2016 to fiscal 2017 and from fiscal 2017 to fiscal 2018 is primarily due to the increase in outstanding bonds and
the rise in interest rates.
Earnings on Investments Credited to Mortgagors
During the construction period, certain mortgages are credited with the earnings on unadvanced bond proceeds
held in the construction financing accounts and the capitalized interest accounts. Fluctuations result from the timing
of the granting of credits to mortgagors and interest earned on investments during the period. Earnings on
investments credited to mortgagors increased from $4.9 million in fiscal 2017 to $7.4 million in fiscal 2018,
representing an increase of approximately $2.5 million, or 49%. This compares with an increase from $2.3 million in
fiscal 2016 to $4.9 million in fiscal 2017, representing an increase of approximately $2.6 million, or 113%.
General Expenses
General expenses include certain administrative expenses in addition to other financial expenses. General expenses
increased from $23.4 million in fiscal 2017 to $28.1 million in fiscal 2018, an increase of approximately $4.7 million, or
20%, as compared with an increase from $21.9 million in fiscal 2016 to $23.4 million in fiscal 2017, an increase of
approximately $1.5 million, or 7%. The changes were primarily the result of increases in staffing, the cost of the
Agency’s upcoming move and other personnel services expenses relating to the Governor’s housing plan initiative.
Cost of Issuance and Other Financial Expenses
Cost of issuance and other financial expenses represent the following: cost of issuance expenses associated with
issuing bonds, letter of credit fees and remarketing fees. Cost of issuance and other financial expenses decreased
from $2.7 million in fiscal 2017 to $1.7 million in fiscal 2018, a decrease of approximately $1.0 million, or 36% as a
result of decreased arbitrage costs incurred in fiscal 2017. This compares with a decrease from $3.8 million in fiscal
2016 to $2.7 million in fiscal 2017, a decrease of approximately $1.1 million, or 28%.
Supervising Agency Fee
Supervising Agency Fee includes amounts due to the State and certain State agencies, including the New York State
Division of Housing and Community Renewal (“DHCR”). Supervising Agency Fees amounts due to the State
increased by approximately $100 thousand, or 1% from $10.2 million in fiscal 2017 to $10.3 million in fiscal 2018.
This compares with a decrease from $10.5 million in fiscal 2016 to $10.2 million in fiscal 2017, a decrease of
approximately $300 thousand, or 2%.
29
Allowance for Losses on Loans On an annual basis, the Agency analyzes its mortgage loans balances to determine their collectability. A
determination is made by management to establish or adjust the allowance for losses on loans previously established
based on this analysis.
Included in the allowance for losses on loans are subsidy loans made by the Agency using Agency funds. Such loans
are made in the form of subordinate mortgage loans and are recorded as mortgage loans receivable. The balance of
such loans is included in the allowance for losses on loans because they are not secured by credit enhancement and
their terms require scheduled payments which are deferred until other obligations are satisfied. Therefore, an
allowance is established for the full amount of each of these subsidy loans. When payments are made relating to
subsidy mortgages, the amount received is recorded as recovery income.
Allowance for losses on loans increased from $76.4 million in fiscal 2017 to $128.3 million in fiscal 2018, an increase
of approximately $51.9 million, or 68%. This compares with an increase from $40.1 million in fiscal 2016 to $76.4
million in fiscal 2017, an increase of approximately $36.3 million, or 90%. Each year’s increase primarily relates to
the increased use of Agency funds to finance subsidy loans and the restructuring of certain Mitchell Lama first
mortgage loans to subordinate debt.
Non‐operating revenues (expenses)
Net Transfers from Agencies of the State of New York
Net Transfers from Agencies of the State of New York increased from $92.0 million in fiscal 2017 to $222.1 million in
fiscal 2018, an increase of approximately $130.1 million, or 141%. This compares with an increase from $44.7 million
in fiscal 2016 to $92.0 million in fiscal 2017, an increase of approximately $47.3 million, or 106%. The increases
represent the increased receipt of funds from state sources, received by the Agency to fund subsidy loans.
In addition, during fiscal 2018, 2017 and 2016, the Agency transferred $2.3 million, $1.8 million and $1.0 million,
respectively, to its subsidiary The Affordable Housing Corporation (“AHC”) in order to contribute to the cost of its
administrative salaries and other direct expenses.
Federal Grants
Federal Grants represent funds received from the federal government which are then remitted to various housing
developments. Federal Grants decreased from $5.9 million in fiscal 2017 to $4.6 million in fiscal 2018, a decrease of
approximately $1.3 million, or 23%. This compares with an increase from $5.3 million in fiscal 2016 to $5.9 million in
fiscal 2017, an increase of approximately $600 thousand, or 12%. Federal Grants represent Housing Assistance
Payments received from the U.S. Department of Housing and Urban Development to subsidize a portion of the rent
paid by eligible tenants in two housing projects. The amounts vary based on the eligible tenant’s family income
during the period.
30

****
Gain on Extinguishment of Debt
Gain on extinguishment of debt decreased from $4.1 million in fiscal 2017 to $340 thousand in fiscal 2018, a decrease
of approximately $3.7 million, or 92%. This compares with an increase from $0 in fiscal 2016 to $4.1 million in fiscal
2017 as a result of the write‐off of the bond premium relating to the State Personal Income Tax Revenue Bonds: 2007
Series C, 2008 Series B and 2009 Series A which were refunded in fiscal 2017. In fiscal 2018, bonds were redeemed
due to a mortgage payoff in the Affordable Housing Revenue Bond Program which resulted in the reported gain of
$345 thousand.
31
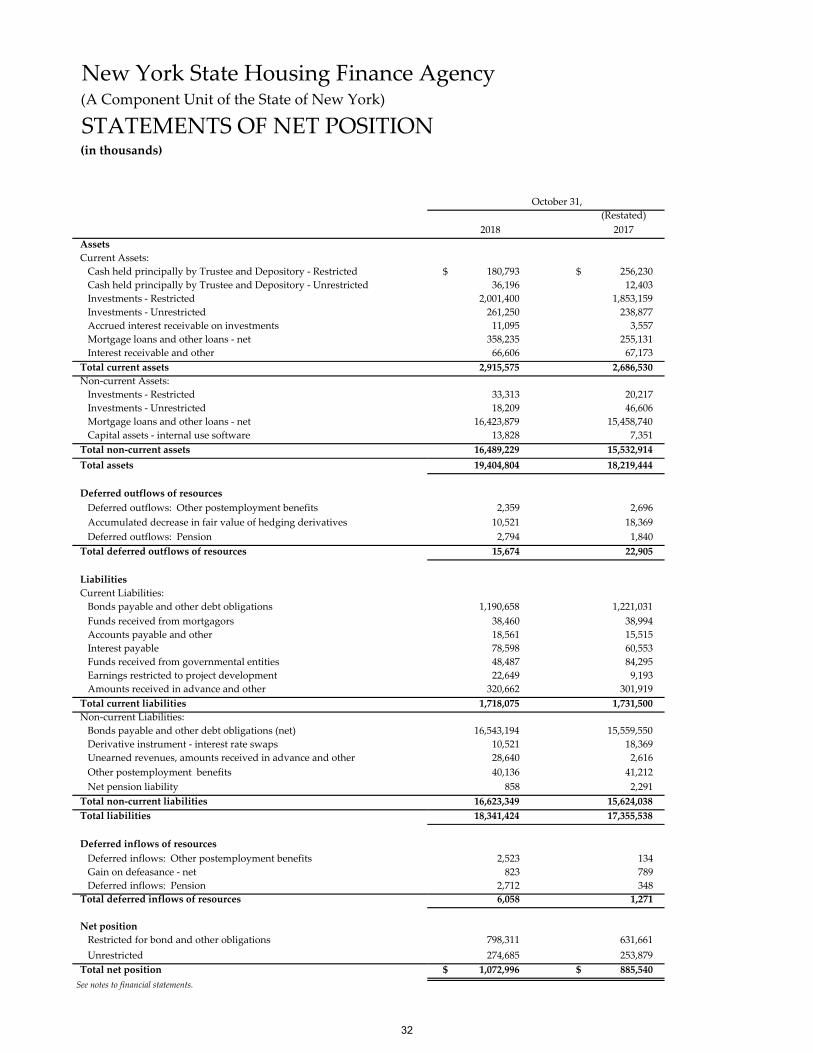
New York State Housing Finance Agency(A Component Unit of the State of New York)
STATEMENTS OF NET POSITION(in thousands)
(Restated)
2018 2017
Assets
Current Assets:
Cash held principally by Trustee and Depository ‐ Restricted $ 180,793 $ 256,230
Cash held principally by Trustee and Depository ‐ Unrestricted 36,196 12,403
Investments ‐ Restricted 2,001,400 1,853,159
Investments ‐ Unrestricted 261,250 238,877
Accrued interest receivable on investments 11,095 3,557
Mortgage loans and other loans ‐ net 358,235 255,131
Interest receivable and other 66,606 67,173
Total current assets 2,915,575 2,686,530
Non‐current Assets:
Investments ‐ Restricted 33,313 20,217
Investments ‐ Unrestricted 18,209 46,606
Mortgage loans and other loans ‐ net 16,423,879 15,458,740
Capital assets ‐ internal use software 13,828 7,351
Total non‐current assets 16,489,229 15,532,914
Total assets 19,404,804 18,219,444
Deferred outflows of resources
Deferred outflows: Other postemployment benefits 2,359 2,696
Accumulated decrease in fair value of hedging derivatives 10,521 18,369
Deferred outflows: Pension 2,794 1,840
Total deferred outflows of resources 15,674 22,905
Liabilities
Current Liabilities:
Bonds payable and other debt obligations 1,190,658 1,221,031
Funds received from mortgagors 38,460 38,994
Accounts payable and other 18,561 15,515
Interest payable 78,598 60,553
Funds received from governmental entities 48,487 84,295
Earnings restricted to project development 22,649 9,193
Amounts received in advance and other 320,662 301,919
Total current liabilities 1,718,075 1,731,500
Non‐current Liabilities:
Bonds payable and other debt obligations (net) 16,543,194 15,559,550
Derivative instrument ‐ interest rate swaps 10,521 18,369
Unearned revenues, amounts received in advance and other 28,640 2,616
Other postemployment benefits 40,136 41,212
Net pension liability 858 2,291
Total non‐current liabilities 16,623,349 15,624,038
Total liabilities 18,341,424 17,355,538
Deferred inflows of resources
Deferred inflows: Other postemployment benefits 2,523 134
Gain on defeasance ‐ net 823 789
Deferred inflows: Pension 2,712 348
Total deferred inflows of resources 6,058 1,271
Net position
Restricted for bond and other obligations 798,311 631,661
Unrestricted 274,685 253,879
Total net position $ 1,072,996 $ 885,540
See notes to financial statements.
October 31,
32
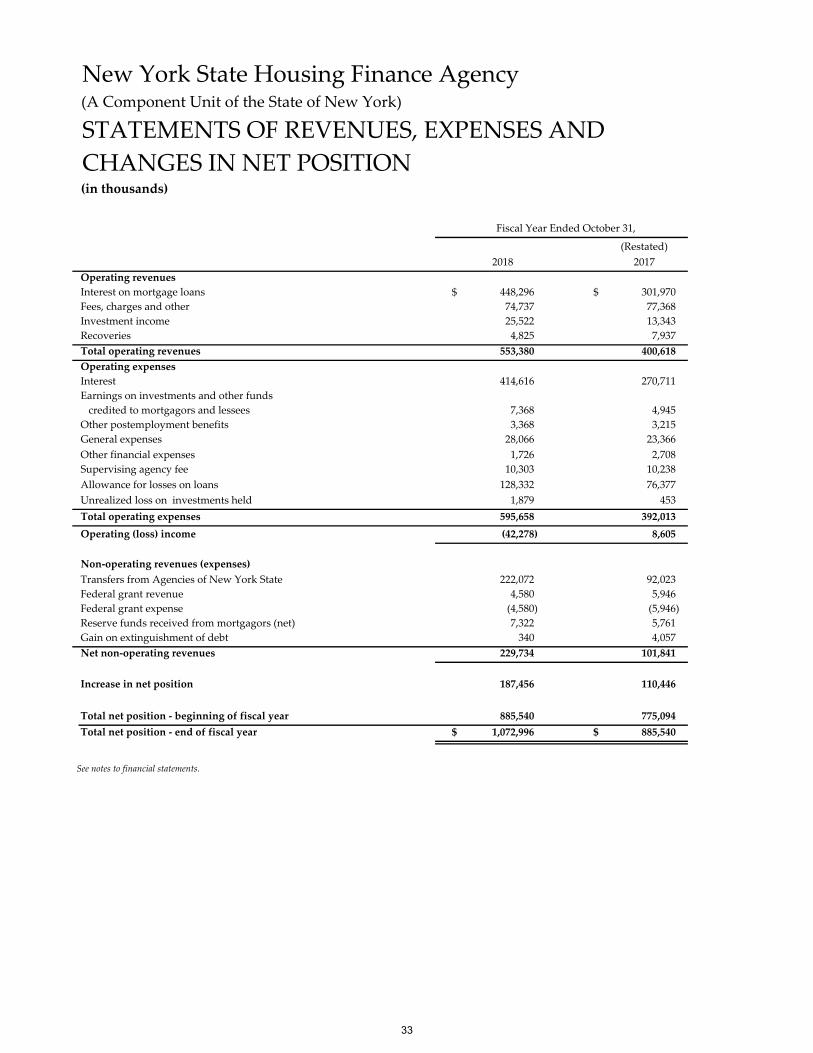
New York State Housing Finance Agency(A Component Unit of the State of New York)
STATEMENTS OF REVENUES, EXPENSES AND
CHANGES IN NET POSITION(in thousands)
Fiscal Year Ended October 31,
(Restated)
2018 2017
Operating revenues
Interest on mortgage loans $ 448,296 $ 301,970
Fees, charges and other 74,737 77,368
Investment income 25,522 13,343
Recoveries 4,825 7,937
Total operating revenues 553,380 400,618
Operating expenses
Interest 414,616 270,711
Earnings on investments and other funds
credited to mortgagors and lessees 7,368 4,945
Other postemployment benefits 3,368 3,215
General expenses 28,066 23,366
Other financial expenses 1,726 2,708
Supervising agency fee 10,303 10,238
Allowance for losses on loans 128,332 76,377
Unrealized loss on investments held 1,879 453
Total operating expenses 595,658 392,013
Operating (loss) income (42,278) 8,605
Non‐operating revenues (expenses)
Transfers from Agencies of New York State 222,072 92,023
Federal grant revenue 4,580 5,946
Federal grant expense (4,580) (5,946)
Reserve funds received from mortgagors (net) 7,322 5,761
Gain on extinguishment of debt 340 4,057
Net non‐operating revenues 229,734 101,841
Increase in net position 187,456 110,446
Total net position ‐ beginning of fiscal year 885,540 775,094
Total net position ‐ end of fiscal year $ 1,072,996 $ 885,540
See notes to financial statements.
33
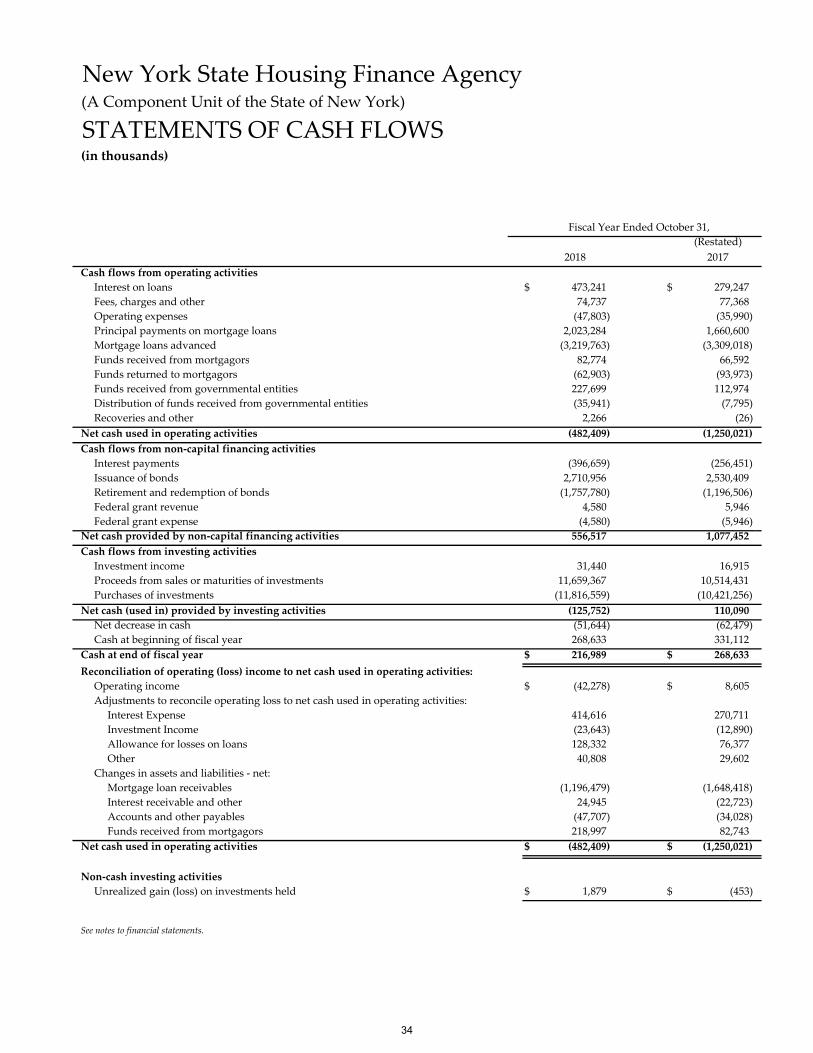
New York State Housing Finance Agency(A Component Unit of the State of New York)
STATEMENTS OF CASH FLOWS(in thousands)
Fiscal Year Ended October 31,
(Restated)
2018 2017
Cash flows from operating activities
Interest on loans $ 473,241 $ 279,247
Fees, charges and other 74,737 77,368
Operating expenses (47,803) (35,990)
Principal payments on mortgage loans 2,023,284 1,660,600
Mortgage loans advanced (3,219,763) (3,309,018)
Funds received from mortgagors 82,774 66,592
Funds returned to mortgagors (62,903) (93,973)
Funds received from governmental entities 227,699 112,974
Distribution of funds received from governmental entities (35,941) (7,795)
Recoveries and other 2,266 (26)
Net cash used in operating activities (482,409) (1,250,021)
Cash flows from non‐capital financing activities
Interest payments (396,659) (256,451)
Issuance of bonds 2,710,956 2,530,409
Retirement and redemption of bonds (1,757,780) (1,196,506)
Federal grant revenue 4,580 5,946
Federal grant expense (4,580) (5,946)
Net cash provided by non‐capital financing activities 556,517 1,077,452
Cash flows from investing activities
Investment income 31,440 16,915
Proceeds from sales or maturities of investments 11,659,367 10,514,431
Purchases of investments (11,816,559) (10,421,256)
Net cash (used in) provided by investing activities (125,752) 110,090
Net decrease in cash (51,644) (62,479)
Cash at beginning of fiscal year 268,633 331,112
Cash at end of fiscal year $ 216,989 $ 268,633
Reconciliation of operating (loss) income to net cash used in operating activities:
Operating income $ (42,278) $ 8,605
Adjustments to reconcile operating loss to net cash used in operating activities:
Interest Expense 414,616 270,711
Investment Income (23,643) (12,890)
Allowance for losses on loans 128,332 76,377
Other 40,808 29,602
Changes in assets and liabilities ‐ net:
Mortgage loan receivables (1,196,479) (1,648,418)
Interest receivable and other 24,945 (22,723)
Accounts and other payables (47,707) (34,028)
Funds received from mortgagors 218,997 82,743
Net cash used in operating activities $ (482,409) $ (1,250,021)
Non‐cash investing activities
Unrealized gain (loss) on investments held $ 1,879 $ (453)
See notes to financial statements.
34
NEW YORK STATE HOUSING FINANCE AGENCY(A COMPONENT UNIT OF THE STATE OF NEW YORK)
NOTES TO THE FINANCIAL STATEMENTS
FISCAL YEARS ENDED OCTOBER 31, 2018 AND 2017
NOTE 1 – THE AGENCY
The New York State Housing Finance Agency (“Agency”), a component unit of the State of New York (“State”), is a
corporate governmental agency constituted as a public benefit corporation under the provisions of the State Private
Housing Finance Law. The Agency is empowered to finance or contract for the financing of the construction,
acquisition or refinancing of loans for: (a) housing units for sale or rent to low and moderate income persons,
families, and senior citizens, (b) municipal health facilities, (c) non‐profit health care facilities, (d) community related
facilities and (e) to provide funds to repay the State for amounts advanced to finance the cost of various housing
assistance programs. The Agency is also empowered, through its Capital Grant Low Rent Assistance Program, to
provide rental housing to low and middle income persons or families. Additionally, the Agency participates in the
federal government’s housing assistance programs, principally those established by Section 236 of the National
Housing Act and Section 8 of the U.S. Housing Act of 1937. These federal programs provide interest reduction and
rental assistance subsidies, respectively, to eligible projects and tenants.
The Agency administers the State’s Housing Project Repair and Infrastructure Trust Fund Programs. The Housing
Project Repair Program is to be used to correct construction‐related and energy, health and safety problems or
deficiencies at Mitchell‐Lama housing projects that are at current economic rent or that enter into mortgage
modification agreements with the Agency. The Infrastructure Trust Fund Programs provide grants for the
development of affordable housing throughout New York State.
The Agency finances most of its activities through the issuance of bonds. As of October 31, 2018 and 2017, the
Agency is authorized to issue bonds up to the amount of approximately $26.78 billion to finance housing projects.
Additionally, as of October 31, 2018, the Agency is authorized to issue Service Contract Obligation Revenue Bonds,
Service Contract Revenue Bonds and Personal Income Tax Revenue Bonds in the amount of approximately $5.98
billion (approximately $5.38 billion as of October 31, 2017).
In accordance with section 2100 of the Codification of Governmental Accounting and Financial Reporting Standards,
the Agency’s financial statements are included in the State of New York’s annual financial statements as a
component unit of the State.
The Private Housing Finance Law, as amended in 1985, established the New York State Housing Trust Fund
Corporation (“HTFC”) and the New York State Affordable Housing Corporation (“AHC”), both public benefit
corporations, as subsidiary corporations of the Agency. In addition, as amended through 1990, such law established
the New York State Homeless Housing and Assistance Corporation (“HHAC”). These corporations are component
units of the State; accordingly, they are not component units of the Agency in accordance with the requirements of
the Governmental Accounting Standards Board (“GASB”) Statement No. 61 (GASB Statement No. 61), Financial
Reporting Entity: Omnibus. Therefore, the financial activities of these corporations are not included in the
accompanying financial statements.
35
NOTE 2 – SUMMARY OF SIGNIFICANT ACCOUNTING POLICIES
A. BASIS OF ACCOUNTING: The Agency utilizes the accrual basis of accounting wherein revenues are recognized
when earned and expenses when incurred. The financial statements are prepared in accordance with generally
accepted accounting principles as prescribed by GASB. The Agency’s operating revenues consist of interest on
loans, fees and charges associated with bond financing and loans and investment income. All other revenue,
which primarily consist of transfers between the Agency and other Agencies of the State of New York and grant
revenue are considered non‐operating. Operating expenses include interest expense, expenses for administering
the various bond programs, Agency administration expenses, bond issuance and financing costs and allowance
for loan losses. All other expenses are considered non‐operating.
B. INVESTMENTS: Investments, other than collateralized investment agreements, are recorded at fair value,
which are based on quoted market prices or matrix pricing for securities that are not traded actively.
Collateralized investment agreements are reported at cost plus accrued interest. For the purpose of financial
statement presentation, the Agency does not consider any of its investments to be cash equivalents.
C. INTEREST AND INVESTMENT REVENUE: Interest and investment revenue is accrued and recognized as
revenue when earned.
D. FEES, CHARGES AND OTHER REVENUE: Servicing fees, mortgage origination fees, commitment fees and
other fees due to the Agency, are recognized as revenue in the period in which they are earned.
E. ADMINISTRATIVE EXPENSES: Administrative and other expenses are recognized as expense in the period
incurred.
F. INTERAGENCY SERVICES: The Agency has agreements with related public benefit corporations to provide
managerial, administrative and financial functions for these organizations. Pursuant to these agreements, the
Agency’s general expenses are allocated to reflect the services utilized by each of the respective related public
benefit corporations. The Agency is reimbursed for such expenses, to the extent the related public benefit
corporations have funds available.
G. COSTS OF ISSUANCE EXPENSE: The costs of issuing bonds are expensed in the period incurred.
H. FEDERAL GRANTS: Grants received from the Federal government are recognized as non‐operating revenue
when eligibility requirements are met.
I. ACCRUED VACATION BENEFITS: Vacation benefits are recorded in the period earned.
J. BOND PREMIUM: Bond premium is amortized over the life of the related bonds using the effective interest
method.
K. RESTRICTED ASSETS: The assets governed by bond or note resolutions are restricted. Cash and investments
included in restricted fund accounts are held by trustee banks. Additionally, restricted assets include funds
available to be advanced as subsidy loans which were committed but not yet disbursed.
L. USE OF NET POSITION: When both restricted and unrestricted resources are available for a particular
restricted use, it is the Agency’s policy to use restricted resources first, and then unrestricted as needed.
36
NOTE 2 – SUMMARY OF SIGNIFICANT ACCOUNTING POLICIES (continued)
M. USE OF ESTIMATES: The preparation of the financial statements in accordance with U.S. generally accepted
accounting principles requires management to make estimates and assumptions that affect the amounts and
disclosures included in the Agency’s financial statements during the reporting periods. Actual amounts could
differ from these estimates.
N. ALLOWANCE FOR POTENTIAL LOSSES ON LOANS: An allowance has been established for possible
uncollectible mortgage loans and accrued interest (see note 3). Annually, the allowance is reviewed for
reasonableness. Provisions for uncollectible receivables are recorded when it has been determined that a
probable loss has occurred.
O. NET POSITION: The Agency’s Net Position represents the excess of assets and deferred outflows of resources
over liabilities and deferred inflows of resources. It consists largely of mortgage loans and investments. The
Agency’s net position is categorized as follows:
Restricted Net Position: Represents assets that have been restricted in use in accordance with the terms of bond
indentures, grant awards, agreements or by State law, reduced by the outstanding balance of any debt that is
attributable to those assets. This includes mortgage loan assets, bond proceeds and reserve funds that are
pledged to bondholders and funds held pursuant to contractual obligations with New York State.
Unrestricted Net Position: Represent assets that do not meet the definition of restricted.
P. REFUNDING OF DEBT: Gains or losses in connection with advanced refundings are recorded as either a
deferred inflow (gain) or deferred outflow (loss) of resources and amortized as an adjustment to interest expense
over the original life of the refunded bonds or the life of the refunding bonds, whichever is shorter.
Q. DERIVATIVE INSTRUMENTS: The Agency has entered into various interest rate swap contracts in order to
manage the risks associated with interest due on its State Revenue Bond Program portfolio. The Agency
recognizes the fair value of all derivative instruments as either an asset or liability on its statements of net
position with the offsetting gains or losses recognized in earnings or as either deferred inflows or outflows if
deemed an effective hedge.
R. CAPITAL ASSETS – INTERNAL USE SOFTWARE: Expenditures for the purchase, development or licensing of
computer software having a cost greater than $500 thousand are capitalized and amortized on a straight‐line
basis, generally over the license term (if applicable) or the estimated useful life of the software.
S. RECENTLY ADOPTED ACCOUNTING PRONOUNCEMENTS: In June 2015, GASB issued Statement No. 75,
Accounting and Financial Reporting for Postemployment Benefits Other Than Pensions (“GASB No. 75”). The objective
of this Statement is to improve accounting and financial reporting by state and local governments for OPEB. It
also improves information provided by state and local governmental employers about financial support for
OPEB that is provided by other entities. The provisions of this statement are effective for fiscal years beginning
after June 15, 2017. Refer to Note 3 “Impact of the Adoption of GASB No. 75” for further information regarding
the impact of the adoption of GASB No. 75 on the financial statements.
37
NOTE 2 – SUMMARY OF SIGNIFICANT ACCOUNTING POLICIES (continued)
In March 2017, GASB issued Statement No. 85, Omnibus 2017 (“GASB No. 85”). The objective of this Statement is
to address practice issues that have been identified during implementation and application of certain GASB
Statements. This Statement addresses a variety of topics including issues related to blending component units,
goodwill, fair value measurement and application, and postemployment benefits (pensions and other
postemployment benefits (“OPEB”)). The provisions of this statement are effective for fiscal years beginning
after June 15, 2017. The adoption of this standard did not have an impact on the Agency’s financial statements.
In May 2017, GASB issued Statement No. 86, Certain Debt Extinguishment Issues (“GASB No. 86”). The primary
objective of this Statement is to improve consistency in accounting and financial reporting for in‐substance
defeasance of debt by providing guidance for transactions in which cash and other monetary assets acquired
with only existing resources—resources other than the proceeds of refunding debt—are placed in an irrevocable
trust for the sole purpose of extinguishing debt. This Statement also improves accounting and financial
reporting for prepaid insurance on debt that is extinguished and notes to financial statements for debt that is
defeased in substance. The provisions of this statement are effective for fiscal years beginning after June 15,
2017. The adoption of this standard did not have an impact on the Agency’s financial statements.
T. ACCOUNTING PRONOUNCEMENTS ISSUED BUT NOT YET ADOPTED: In March 2016, GASB issued
Statement No. 83, Certain Asset Retirement Obligations (“GASB No. 83”). The primary objective of this Statement
is to provide financial statement users with information about asset retirement obligations (ARO’s) that were not
addressed in GASB standards by establishing uniform accounting and financial reporting requirements for those
obligations. The requirements of this statement apply to financial statements of all state and local governments.
For purposes of applying this statement, an ARO is a legally enforceable liability associated with the retirement
of a tangible capital asset (that is, the tangible capital asset is permanently removed from service). The
retirement of a tangible capital asset encompasses its sale, abandonment, recycling, or disposal in some other
manner; however, it does not encompass the temporary idling of a tangible capital asset. This statement also
applies to legally enforceable liabilities of a lessor in connection with the retirement of its leased property if those
liabilities meet the definition of an ARO. The provisions of this statement are effective for fiscal years beginning
after June 15, 2018. The Agency is currently evaluating the impact this standard will have on its financial
statements.
In January 2017, GASB issued Statement No. 84, Fiduciary Activities (“GASB No. 84”). The primary objective of
this Statement is to improve guidance regarding the identification of fiduciary activities for accounting and
financial reporting purposes and how those activities should be reported. This statement establishes criteria for
identifying fiduciary activities of all state and local governments. The focus of the criteria generally is on (1)
whether a government is controlling the assets of the fiduciary activity and (2) the beneficiaries with whom a
fiduciary relationship exists. Separate criteria are included to identify fiduciary component units and
postemployment benefit arrangements that are fiduciary activities. The provisions of this statement are effective
for fiscal years beginning after December 15, 2018. The Agency is currently evaluating the impact this standard
will have on its financial statements.
In June 2017, GASB issued Statement No. 87, Leases (“GASB No. 87”). The primary objective of this Statement is
to better meet the information needs of financial statement users by improving accounting and financial
reporting for leases by governments. This statement increases the usefulness of governments’ financial
statements by requiring recognition of certain lease assets and liabilities for leases that previously were classified
as operating leases and recognized as inflows of resources or outflows of resources based on the payment
38
NOTE 2 – SUMMARY OF SIGNIFICANT ACCOUNTING POLICIES (continued)
provisions of the contract. It establishes a single model for lease accounting based on the foundational principle
that leases are financings of the right to use an underlying asset. Under this statement, a lessee is required to
recognize a lease liability and an intangible right‐to‐use lease asset, and a lessor is required to recognize a lease
receivable and a deferred inflow of resources, thereby enhancing the relevance and consistency of information
about governments’ leasing activities. The provisions of this statement are effective for fiscal years beginning
after December 15, 2019. The Agency is currently evaluating the impact this standard will have on its financial
statements.
In March 2018, GASB issued Statement No. 88, Certain Disclosures Related to Debt, including Direct Borrowings and
Direct Placements (“GASB No. 88”). The primary objective of this Statement is to improve the information that is
disclosed in notes to government financial statements related to debt, including direct borrowings and direct
placements. It also clarifies which liabilities governments should include when disclosing information related to
debt. This Statement defines debt for purposes of disclosure in notes to financial statements as a liability that
arises from a contractual obligation to pay cash (or other assets that may be used in lieu of cash) in one or more
payments to settle an amount that is fixed at the date the contractual obligation is established. This Statement
requires that additional essential information related to debt be disclosed in notes to financial statements,
including unused lines of credit; assets pledged as collateral for the debt; and terms specified in debt agreements
related to significant events of default with finance‐related consequences, significant termination events with
finance‐related consequences, and significant subjective acceleration clauses. For notes to financial statements
related to debt, this Statement also requires that existing and additional information be provided for direct
borrowings and direct placements of debt separately from other debt. The provisions of this statement are
effective for fiscal years beginning after June 15, 2018. The Agency is currently evaluating the impact this
standard will have on its financial statements.
In June 2018, GASB issued Statement No. 89, Accounting for Interest Cost Incurred Before the End of a Construction
Period (“GASB No. 89”). The objectives of this Statement are (1) to enhance the relevance and comparability of
information about capital assets and the cost of borrowing for a reporting period and (2) to simplify accounting
for interest cost incurred before the end of a construction period. This Statement establishes accounting
requirements for interest cost incurred before the end of a construction period. Such interest cost includes all
interest that previously was accounted for in accordance with the requirements of paragraphs 5−22 of Statement
No. 62, Codification of Accounting and Financial Reporting Guidance Contained in Pre‐November 30, 1989 FASB and
AICPA Pronouncements (“GASB No. 62”), which are superseded by this Statement. This Statement requires that
interest cost incurred before the end of a construction period be recognized as an expense in the period in which
the cost is incurred for financial statements prepared using the economic resources measurement focus. As a
result, interest cost incurred before the end of a construction period will not be included in the historical cost of a
capital asset reported in a business‐type activity or enterprise fund. This Statement also reiterates that in
financial statements prepared using the current financial resources measurement focus, interest cost incurred
before the end of a construction period should be recognized as an expenditure on a basis consistent with
governmental fund accounting principles. The provisions of this statement are effective for fiscal years
beginning after December 15, 2019. The Agency is currently evaluating the impact this standard will have on its
financial statements.
In August 2018, GASB issued Statement No. 90, Majority Equity Interests (“GASB No. 90”). The primary
objectives of this Statement are to improve the consistency and comparability of reporting a government’s
majority equity interest in a legally separate organization and to improve the relevance of financial statement
39
NOTE 2 – SUMMARY OF SIGNIFICANT ACCOUNTING POLICIES (continued)
information for certain component units. It defines a majority equity interest and specifies that a majority equity
interest in a legally separate organization should be reported as an investment if a government’s holding of the
equity interest meets the definition of an investment. A majority equity interest that meets the definition of an
investment should be measured using the equity method, unless it is held by a special‐purpose government
engaged only in fiduciary activities, a fiduciary fund, or an endowment (including permanent and term
endowments) or permanent fund. Those governments and funds should measure the majority equity interest at
fair value. For all other holdings of a majority equity interest in a legally separate organization, a government
should report the legally separate organization as a component unit, and the government or fund that holds the
equity interest should report an asset related to the majority equity interest using the equity method. This
Statement establishes that ownership of a majority equity interest in a legally separate organization results in the
government being financially accountable for the legally separate organization and, therefore, the government
should report that organization as a component unit. This Statement also requires that a component unit in
which a government has a 100 percent equity interest account for its assets, deferred outflows of resources,
liabilities, and deferred inflows of resources at acquisition value at the date the government acquired a 100
percent equity interest in the component unit. Transactions presented in flows statements of the component unit
in that circumstance should include only transactions that occurred subsequent to the acquisition. The
provisions of this statement are effective for fiscal years beginning after December 15, 2018. The Agency is
currently evaluating the impact this standard will have on its financial statements.
U. RECLASSIFICATIONS: Certain reclassifications have been made to prior year balances in order to conform to
current year presentation.
40
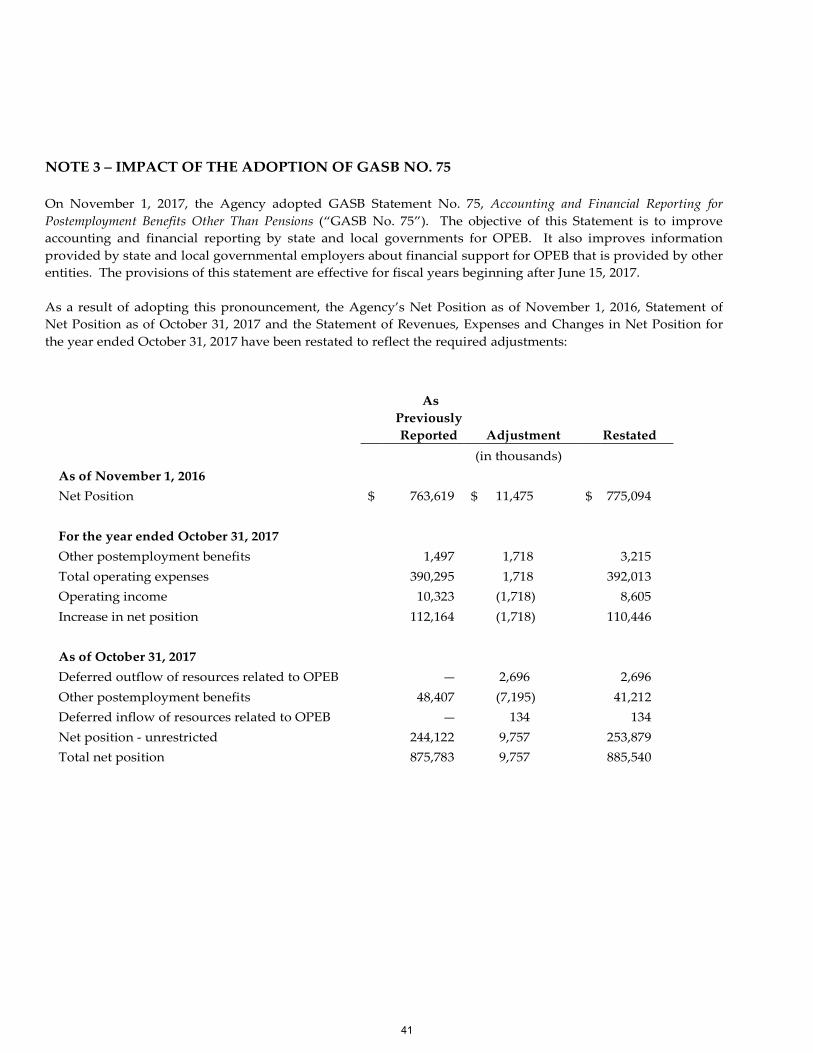
NOTE 3 – IMPACT OF THE ADOPTION OF GASB NO. 75
On November 1, 2017, the Agency adopted GASB Statement No. 75, Accounting and Financial Reporting for
Postemployment Benefits Other Than Pensions (“GASB No. 75”). The objective of this Statement is to improve
accounting and financial reporting by state and local governments for OPEB. It also improves information
provided by state and local governmental employers about financial support for OPEB that is provided by other
entities. The provisions of this statement are effective for fiscal years beginning after June 15, 2017.
As a result of adopting this pronouncement, the Agency’s Net Position as of November 1, 2016, Statement of
Net Position as of October 31, 2017 and the Statement of Revenues, Expenses and Changes in Net Position for
the year ended October 31, 2017 have been restated to reflect the required adjustments:
As
Previously
Reported Adjustment Restated
(in thousands)
As of November 1, 2016 Net Position $ 763,619 $ 11,475 $ 775,094
For the year ended October 31, 2017 Other postemployment benefits 1,497 1,718 3,215
Total operating expenses 390,295 1,718 392,013
Operating income 10,323 (1,718) 8,605
Increase in net position 112,164 (1,718) 110,446
As of October 31, 2017 Deferred outflow of resources related to OPEB — 2,696 2,696
Other postemployment benefits 48,407 (7,195) 41,212
Deferred inflow of resources related to OPEB — 134 134
Net position ‐ unrestricted 244,122 9,757 253,879
Total net position 875,783 9,757 885,540
41
NOTE 4 – RECEIVABLES
MORTGAGE LOANS
Mortgage loans, which are financed by long‐term indebtedness, are collectible through monthly payments. The
Agency’s bond resolutions, with respect to such mortgages, generally require among other provisions that:
A. The Agency’s mortgage is a first mortgage lien on the real property of the project;
B. The mortgage loan shall not exceed the then established project cost or, for certain programs, a certain
percentage thereof; and
C. Mortgage repayments, together with other available monies, shall be sufficient to pay debt service on the bonds
issued to finance the mortgage.
The Agency had outstanding, under various loan programs, mortgage loans receivable (net of the allowances for
potential losses on loans) in the amounts of $16.782 billion and $15.714 billion at October 31, 2018 and 2017,
respectively. The allowances for potential loan losses amounted to $808.5 million and $668.5 million at October 31,
2018 and 2017, respectively as described below.
While the New York State Division of Housing and Community Renewal (“DHCR”) is required to set rental
schedules for certain of the housing projects financed by the Agency at rates sufficient to meet current operating
costs, including debt service and required reserves, mortgagors of certain projects (as described below) have
experienced difficulty in collecting increased rents. The failure of a project to generate sufficient revenues may result
in the inability of the mortgagor to meet its mortgage repayments, required reserves and, in certain cases, real estate
taxes. The failure of a mortgagor to pay its real estate taxes could result in the Agency’s mortgage lien being
extinguished in foreclosure unless the Agency is able to apply its own funds or State appropriations to cure the
default.
SUBORDINATE MORTGAGE LOANS
Subordinate mortgage loans are not secured by credit enhancement and their terms require payments which are
deferred until other obligations are satisfied. Subordinate loans are made in the form of subsidy mortgage loans and
are recorded as mortgage loans receivable. Therefore, an allowance is established for the full amount of such loans
on those not making current payments. As of October 31, 2018, subsidy loans were outstanding in the amount of
$520.0 million, with an allowance established in the amount of $517.9 million. As of October 31, 2017, subsidy loans
were outstanding in the amount of $395.8 million, with an allowance established in the amount of $393.5 million.
In addition, subordinate loans were issued in connection with the refinancing of certain Mitchell Lama loans. Those
loans are fully reserved against and amounted to $283.1 million and $266.9 million as of October 31, 2018 and 2017,
respectively.
OTHER PROGRAMS Allowances have been established in certain other programs in the amount of $8.1 million as of both fiscal 2018 and
2017.
42
NOTE 5 – DEPOSITS AND INVESTMENTS The Agency may become exposed to custodial credit risk in the event of bank failure which may result in deposits
being encumbered and not available when needed. To mitigate this risk, Agency guidelines and policies establish a
minimum capitalization of $50.0 million for banks and $250.0 million for trustees; ratings requirements of at least
within the second highest rating category without regard to gradations by Moody’s Investor Services or Standard &
Poor’s for banks and at least within the third highest ratings category without regards to gradations by Moody’s
Investor Services and Standard & Poor’s for trustees. Certain deposits held in HFA’s bank accounts are insured by
federal depository insurance and certain are collateralized with securities held by custodian banks. The uninsured
cash balances were primarily amounts temporarily held by trustees and paying agents pending debt service
payments, disbursements or investments.
CREDIT RISK Investment guidelines and policies are designed to protect principal by limiting credit risk. Therefore, the Agency
has a formal investment policy which governs the investment of all Agency monies. The Agency investment
guidelines require that all bond proceeds and revenues can only be invested in securities [defined as (i) bonds,
debentures or other obligations issued by the Federal National Mortgage Association; (ii) obligations the principal of
and interest on which are guaranteed by the United States of America; (iii) obligations of the United States of
America; (iv) obligations the principal of and interest on which are guaranteed by the State; (v) obligations of the
State; (vi) obligations of any agency of the United States of America; (vii) obligations of any agency of the State; and
(viii) obligations the principal of and interest on which are guaranteed by an agency or instrumentality of the United
States of America; provided, however, that notwithstanding anything to the contrary herein, the Agency shall not be
authorized to invest in Securities set forth in clauses (i), (vi) and (vii) hereof, unless specifically authorized under
authority of Section 98 of the State Finance Law]; Collateralized Investment Agreements; Repurchase Agreements;
and obligations which the Comptroller is authorized to invest in under Section 98 of the State Finance Law.
Securities are only purchased on a delivery versus payment basis from Primary Dealers and Broker/Dealers
approved by the CFO and are delivered to the applicable Custodian/Trustee who records the interest of the Agency.
Collateralized Investment Agreements may only be entered into with institutions rated at least within the second
highest rating category without regard to gradations within such category by Moody’s Investors Service or Standard & Poor’s. Collateralized Investment Agreements are collateralized at a minimum of 103% of the principal amount of
the agreement and marked to market bi‐weekly. Short‐term repurchase agreements may only be entered into with
primary dealers with whom the Agency has executed a Security Industry Financial Market Association (SIFMA)
Master Repurchase Agreement, and are collateralized at a minimum of 100% of principal. The collateral consists of
United States government obligations, other securities the principal of and interest on which are guaranteed by the
United States, Government National Mortgage Association obligations and obligations of agencies and
instrumentalities of the Congress of the United States. The collateral shall be delivered to the Trustee/Custodian and
held for the benefit of the Agency. Agency funds are invested in accordance with the investment guidelines
approved by the Agency’s board, which are in compliance with the New York State Comptroller’s Investment
Guidelines.
All of the above investments that are securities are in registered form, and are held by agents of the Agency or by the
trustee under the applicable bond resolution, in the Agency’s name. The agents or their custodians take possession
of the securities.
43
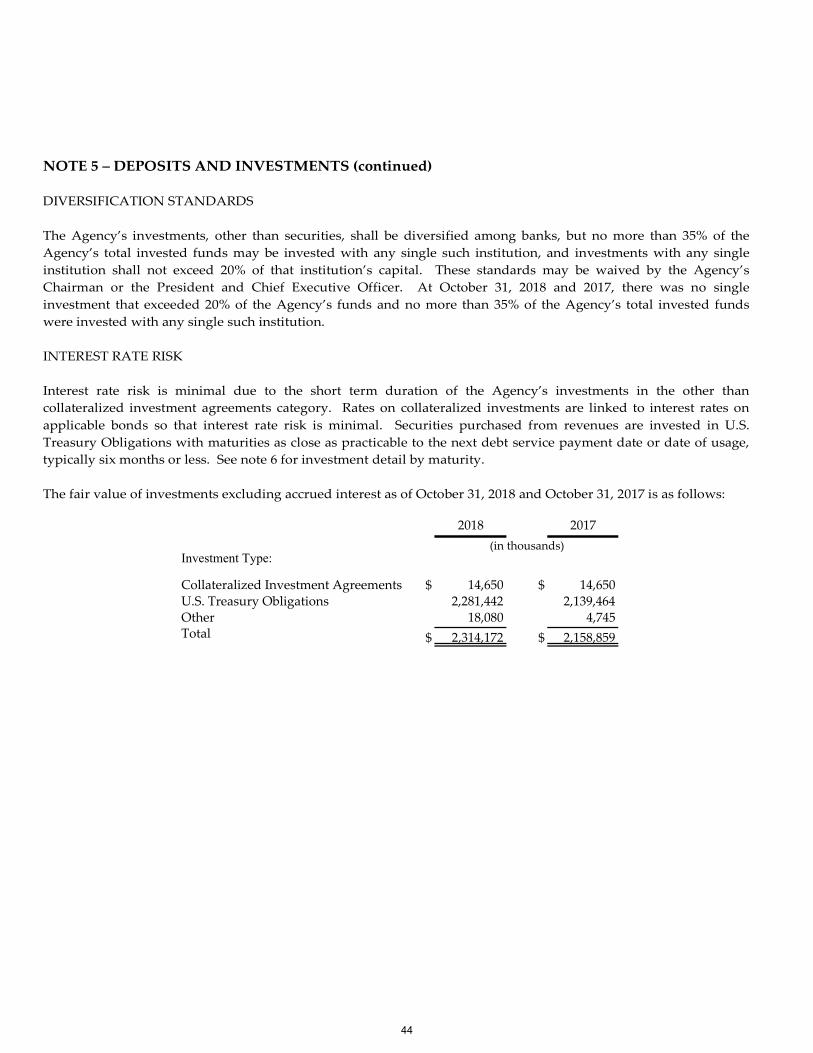
2018 2017
Investment Type:
Collateralized Investment Agreements $ 14,650 $ 14,650U.S. Treasury Obligations 2,281,442 2,139,464Other 18,080 4,745Total $ 2,314,172 $ 2,158,859
(in thousands)
NOTE 5 – DEPOSITS AND INVESTMENTS (continued)
DIVERSIFICATION STANDARDS
The Agency’s investments, other than securities, shall be diversified among banks, but no more than 35% of the
Agency’s total invested funds may be invested with any single such institution, and investments with any single
institution shall not exceed 20% of that institution’s capital. These standards may be waived by the Agency’s
Chairman or the President and Chief Executive Officer. At October 31, 2018 and 2017, there was no single
investment that exceeded 20% of the Agency’s funds and no more than 35% of the Agency’s total invested funds
were invested with any single such institution.
INTEREST RATE RISK
Interest rate risk is minimal due to the short term duration of the Agency’s investments in the other than
collateralized investment agreements category. Rates on collateralized investments are linked to interest rates on
applicable bonds so that interest rate risk is minimal. Securities purchased from revenues are invested in U.S.
Treasury Obligations with maturities as close as practicable to the next debt service payment date or date of usage,
typically six months or less. See note 6 for investment detail by maturity.
The fair value of investments excluding accrued interest as of October 31, 2018 and October 31, 2017 is as follows:
44
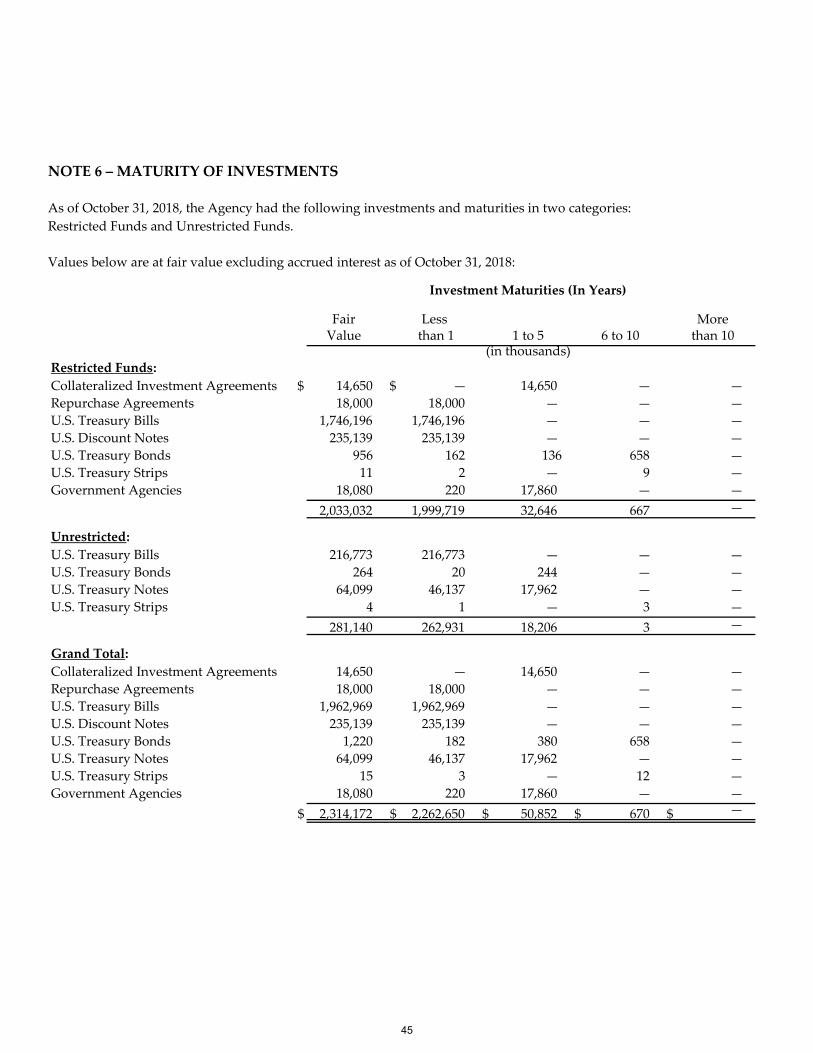
Investment Maturities (In Years)
Fair Less MoreValue than 1 1 to 5 6 to 10 than 10
Restricted Funds:
Collateralized Investment Agreements $ 14,650 $ — 14,650 — —
Repurchase Agreements 18,000 18,000 — — —
U.S. Treasury Bills 1,746,196 1,746,196 — — —
U.S. Discount Notes 235,139 235,139 — — —
U.S. Treasury Bonds 956 162 136 658 —
U.S. Treasury Strips 11 2 — 9 —
Government Agencies 18,080 220 17,860 — —
2,033,032 1,999,719 32,646 667 —
Unrestricted:
U.S. Treasury Bills 216,773 216,773 — — —
U.S. Treasury Bonds 264 20 244 — —
U.S. Treasury Notes 64,099 46,137 17,962 — —
U.S. Treasury Strips 4 1 — 3 —
281,140 262,931 18,206 3 —
Grand Total:
Collateralized Investment Agreements 14,650 — 14,650 — —
Repurchase Agreements 18,000 18,000 — — —
U.S. Treasury Bills 1,962,969 1,962,969 — — —
U.S. Discount Notes 235,139 235,139 — — —
U.S. Treasury Bonds 1,220 182 380 658 —
U.S. Treasury Notes 64,099 46,137 17,962 — —
U.S. Treasury Strips 15 3 — 12 —
Government Agencies 18,080 220 17,860 — —
$ 2,314,172 $ 2,262,650 $ 50,852 $ 670 $ —
(in thousands)
NOTE 6 – MATURITY OF INVESTMENTS
As of October 31, 2018, the Agency had the following investments and maturities in two categories:
Restricted Funds and Unrestricted Funds.
Values below are at fair value excluding accrued interest as of October 31, 2018:
45
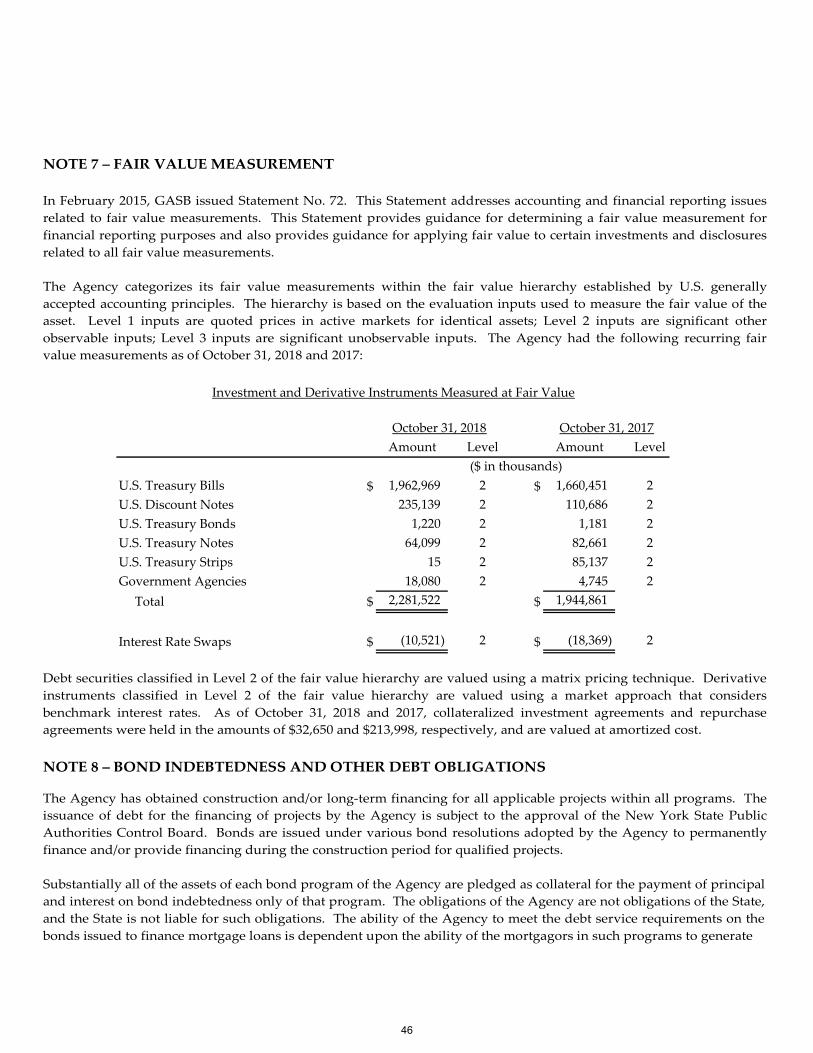
Amount Level Amount Level
$ 1,962,969 2 $ 1,660,451 2
235,139 2 110,686 2
1,220 2 1,181 2
64,099 2 82,661 2
15 2 85,137 2
18,080 2 4,745 2
Total $ 2,281,522 $ 1,944,861
Interest Rate Swaps $ (10,521) 2 $ (18,369) 2
Investment and Derivative Instruments Measured at Fair Value
October 31, 2018 October 31, 2017
($ in thousands)
Government Agencies
U.S. Treasury Bills
U.S. Discount Notes
U.S. Treasury Bonds
U.S. Treasury Notes
U.S. Treasury Strips
NOTE 7 – FAIR VALUE MEASUREMENT
In February 2015, GASB issued Statement No. 72. This Statement addresses accounting and financial reporting issues
related to fair value measurements. This Statement provides guidance for determining a fair value measurement for
financial reporting purposes and also provides guidance for applying fair value to certain investments and disclosures
related to all fair value measurements.
The Agency categorizes its fair value measurements within the fair value hierarchy established by U.S. generally
accepted accounting principles. The hierarchy is based on the evaluation inputs used to measure the fair value of the
asset. Level 1 inputs are quoted prices in active markets for identical assets; Level 2 inputs are significant other
observable inputs; Level 3 inputs are significant unobservable inputs. The Agency had the following recurring fair
value measurements as of October 31, 2018 and 2017:
Debt securities classified in Level 2 of the fair value hierarchy are valued using a matrix pricing technique. Derivative
instruments classified in Level 2 of the fair value hierarchy are valued using a market approach that considers
benchmark interest rates. As of October 31, 2018 and 2017, collateralized investment agreements and repurchase
agreements were held in the amounts of $32,650 and $213,998, respectively, and are valued at amortized cost.
NOTE 8 – BOND INDEBTEDNESS AND OTHER DEBT OBLIGATIONS The Agency has obtained construction and/or long‐term financing for all applicable projects within all programs. The
issuance of debt for the financing of projects by the Agency is subject to the approval of the New York State Public
Authorities Control Board. Bonds are issued under various bond resolutions adopted by the Agency to permanently
finance and/or provide financing during the construction period for qualified projects.
Substantially all of the assets of each bond program of the Agency are pledged as collateral for the payment of principal
and interest on bond indebtedness only of that program. The obligations of the Agency are not obligations of the State,
and the State is not liable for such obligations. The ability of the Agency to meet the debt service requirements on the
bonds issued to finance mortgage loans is dependent upon the ability of the mortgagors in such programs to generate
46
NOTE 8 – BOND INDEBTEDNESS AND OTHER DEBT OBLIGATIONS (continued)
sufficient funds to meet their respective mortgage payments as well as to meet the operating and maintenance costs
of the applicable projects.
At October 31, 2018 and 2017, the total debt service reserve requirements were $38.1 million and $36.0 million,
respectively. The Agency has sufficient funds on deposit within the debt service reserve funds to fully satisfy these
requirements. In addition, as of both October 31, 2018 and 2017, the Agency has funded the amount of
approximately $8.0 million in a dedicated Risk Sharing account which is included in the FHA‐Insured Multi‐Family
Housing Revenue Bond Program. This deposit is required by an agreement with HUD.
Included in the bond indebtedness of the Secured Loan Rental Housing Bond Program, the Service Contract
Revenue Bonds Program, and the State Personal Income Tax Revenue Bond Program are variable debt as of October
31, 2018 and 2017.
The balance of the variable rate bonds outstanding are as follows:
Secured Loan Rental Housing ‐ $14.0 billion and $13.7 billion at October 31, 2018 and 2017, respectively;
Service Contract Revenue ‐ $57.3 million and $81.2 million at October 31, 2018 and 2017, respectively;
State Personal Income Tax Revenue – $79.6 and $80.0 million at October 31, 2018 and 2017, respectively.
The variable rate demand bonds are subject to purchase on the demand of the holder, at a price equal to par plus
accrued interest, on seven days notice and delivery of the bonds to the respective tender agents. For each variable
rate financing, there is a remarketing agent which is authorized to use its best effort to sell the repurchased bonds at
par and a liquidity provider in the form of an irrevocable letter of credit or credit instrument, issued by a major bank,
or government sponsored entity, on behalf of the project being financed. The letters of credit are valid with
termination dates ranging from February 15, 2019 to May 6, 2049. The tender agent/trustee is entitled to draw on the
liquidity facility in an amount sufficient to pay the par value of and accrued interest on bonds delivered to it in the
event bonds are not remarketed to, or monies are not received from, a new bondholder in a timely manner.
As of October 31, 2018, the Agency had seven separate funding loan agreements (“Agreements”) with Citibank N.A.
(“Citibank”) to finance mortgage loans under its Secured Loan Program. Under the Agreements, Citibank provides
the Agency funds which the Agency then advances as loan proceeds to the projects. This is also referred to as “Back
to Back” loan restructuring. This debt obligation is subject to private activity bond volume cap. At October 31, 2018
and 2017, the aggregate principal amount outstanding under this program was $412.1 million and $253.8 million,
respectively.
In fiscal year 2017, the Agency entered into a financing agreement with the Federal Financing Bank (“FFB”) for
selling beneficial ownership interests in mortgage loans originated by the Agency and insured with the Federal
Housing Authority (“FHA”)/HFA Risk Sharing mortgage insurance. This federal initiative reduces costs of the
capital for affordable housing. The Agency has sold beneficial ownership interest in its mortgage to FFB. Beneficial
ownership interest in mortgage loans that the Agency sells to the FFB are evidenced by certificates of participation
from the Agency. The participation proceeds are recorded as payable to the FFB and included in Bonds Payable and
Other Debt Obligations on the Statements of Net Position. The monthly mortgage payments from the borrower will
be used to repay the interest to the FFB and principal payments will reflect the schedule mortgage principal
payments. The FFB Loan Participation Certificate Payable balance as of October 31, 2018 and October 31, 2017 was
$2.2 million and $2.3 million, respectively.
47
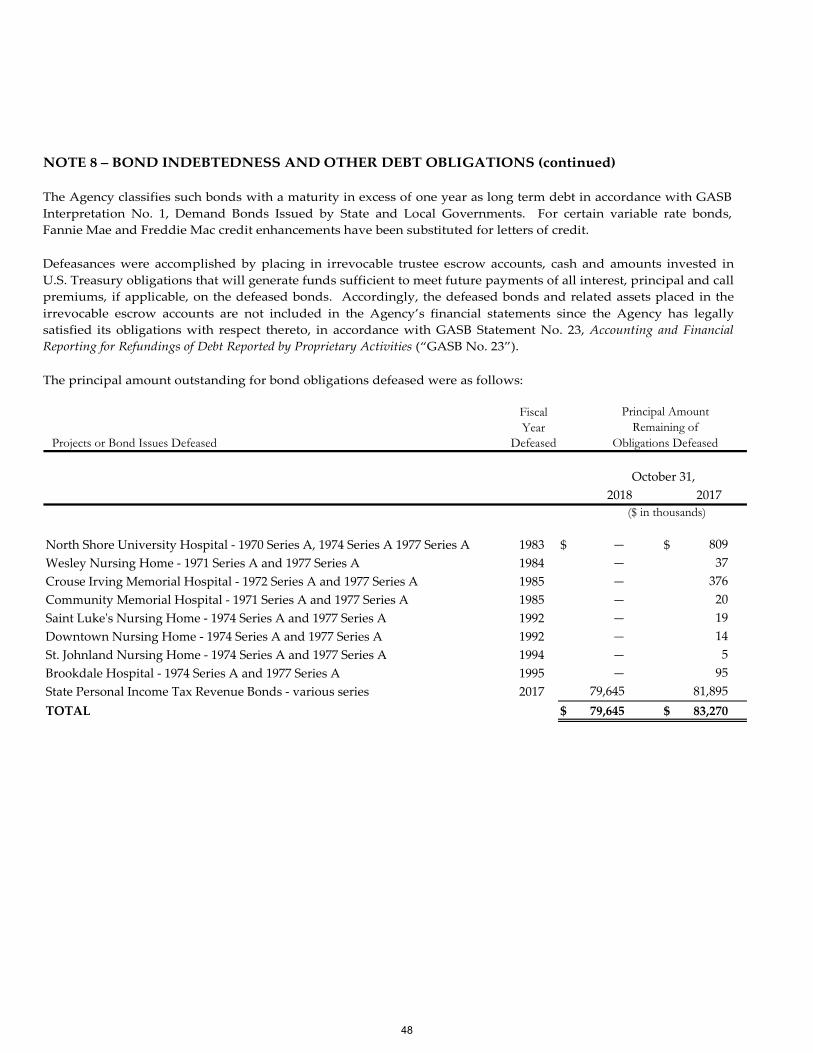
Fiscal Year
Projects or Bond Issues Defeased Defeased
North Shore University Hospital ‐ 1970 Series A, 1974 Series A 1977 Series A 1983 $ — $ 809
Wesley Nursing Home ‐ 1971 Series A and 1977 Series A 1984 — 37
Crouse Irving Memorial Hospital ‐ 1972 Series A and 1977 Series A 1985 — 376
Community Memorial Hospital ‐ 1971 Series A and 1977 Series A 1985 — 20
Saint Lukeʹs Nursing Home ‐ 1974 Series A and 1977 Series A 1992 — 19
Downtown Nursing Home ‐ 1974 Series A and 1977 Series A 1992 — 14
St. Johnland Nursing Home ‐ 1974 Series A and 1977 Series A 1994 — 5
Brookdale Hospital ‐ 1974 Series A and 1977 Series A 1995 — 95
State Personal Income Tax Revenue Bonds ‐ various series 2017 79,645 81,895
TOTAL $ 79,645 $ 83,270
($ in thousands)
Principal Amount Remaining of
Obligations Defeased
October 31,
2018 2017
NOTE 8 – BOND INDEBTEDNESS AND OTHER DEBT OBLIGATIONS (continued)
The Agency classifies such bonds with a maturity in excess of one year as long term debt in accordance with GASB
Interpretation No. 1, Demand Bonds Issued by State and Local Governments. For certain variable rate bonds,
Fannie Mae and Freddie Mac credit enhancements have been substituted for letters of credit.
Defeasances were accomplished by placing in irrevocable trustee escrow accounts, cash and amounts invested in
U.S. Treasury obligations that will generate funds sufficient to meet future payments of all interest, principal and call
premiums, if applicable, on the defeased bonds. Accordingly, the defeased bonds and related assets placed in the
irrevocable escrow accounts are not included in the Agency’s financial statements since the Agency has legally
satisfied its obligations with respect thereto, in accordance with GASB Statement No. 23, Accounting and Financial
Reporting for Refundings of Debt Reported by Proprietary Activities (“GASB No. 23”).
The principal amount outstanding for bond obligations defeased were as follows:
48
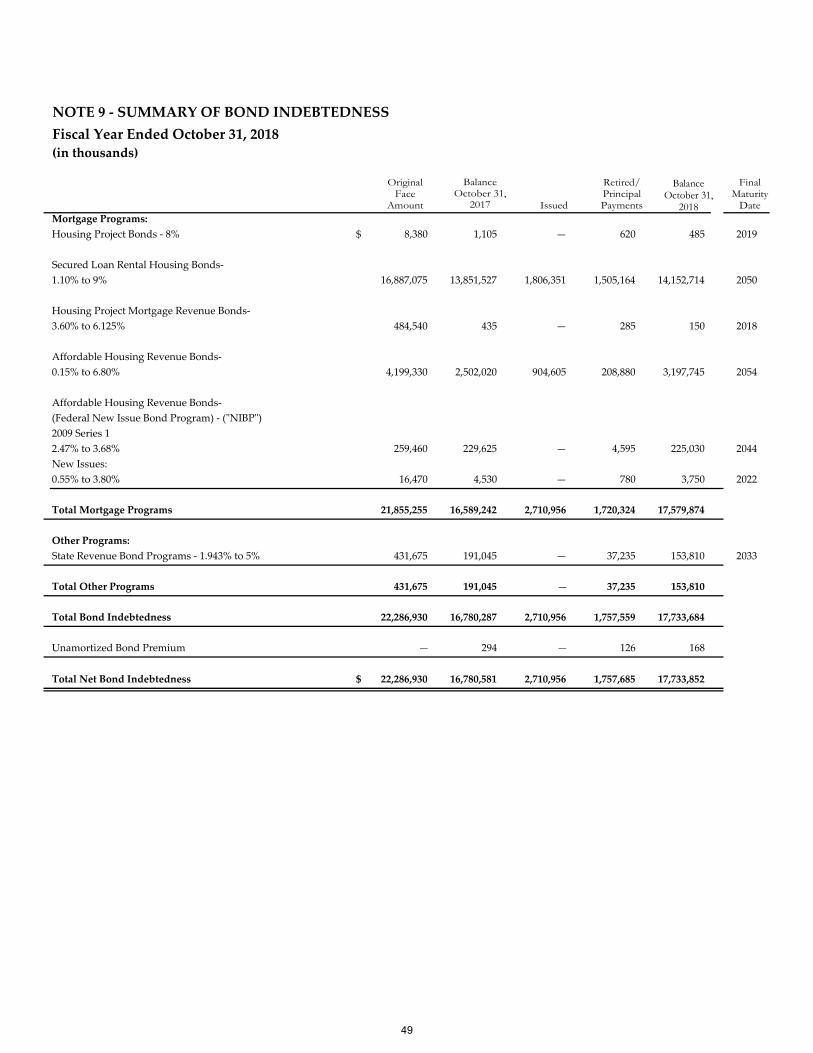
NOTE 9 ‐ SUMMARY OF BOND INDEBTEDNESS
Fiscal Year Ended October 31, 2018(in thousands)
Mortgage Programs:
Housing Project Bonds ‐ 8% $ 8,380 1,105 — 620 485 2019
Secured Loan Rental Housing Bonds‐
1.10% to 9% 16,887,075 13,851,527 1,806,351 1,505,164 14,152,714 2050
Housing Project Mortgage Revenue Bonds‐
3.60% to 6.125% 484,540 435 — 285 150 2018
Affordable Housing Revenue Bonds‐
0.15% to 6.80% 4,199,330 2,502,020 904,605 208,880 3,197,745 2054
Affordable Housing Revenue Bonds‐
(Federal New Issue Bond Program) ‐ (ʺNIBPʺ)
2009 Series 1
2.47% to 3.68% 259,460 229,625 — 4,595 225,030 2044
New Issues:
0.55% to 3.80% 16,470 4,530 — 780 3,750 2022
Total Mortgage Programs 21,855,255 16,589,242 2,710,956 1,720,324 17,579,874
Other Programs:
State Revenue Bond Programs ‐ 1.943% to 5% 431,675 191,045 — 37,235 153,810 2033
Total Other Programs 431,675 191,045 — 37,235 153,810
Total Bond Indebtedness 22,286,930 16,780,287 2,710,956 1,757,559 17,733,684
Unamortized Bond Premium — 294 — 126 168
Total Net Bond Indebtedness $ 22,286,930 16,780,581 2,710,956 1,757,685 17,733,852
OriginalFace
Amount
BalanceOctober 31,
2017 Issued
Final Maturity
Date
Retired/ Principal Payments
BalanceOctober 31,
2018
49
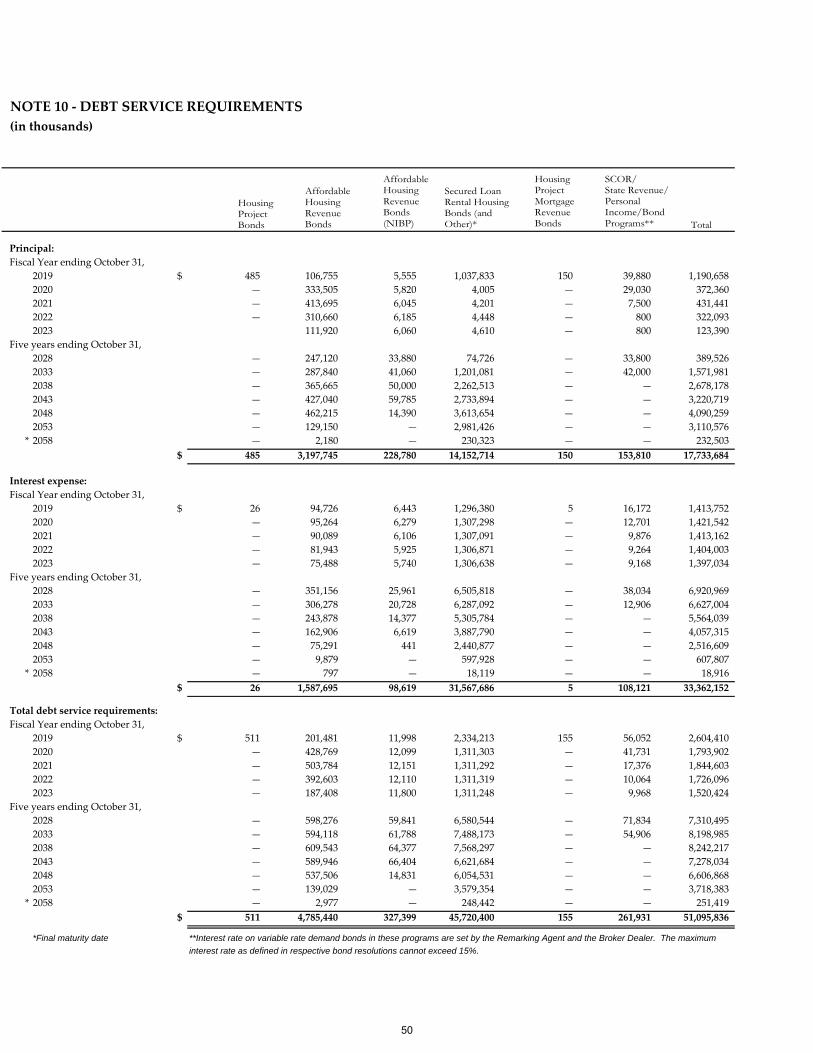
NOTE 10 ‐ DEBT SERVICE REQUIREMENTS
(in thousands)
Total
Principal:
Fiscal Year ending October 31,
2019 $ 485 106,755 5,555 1,037,833 150 39,880 1,190,658
2020 — 333,505 5,820 4,005 — 29,030 372,360
2021 — 413,695 6,045 4,201 — 7,500 431,441
2022 — 310,660 6,185 4,448 — 800 322,093
2023 111,920 6,060 4,610 — 800 123,390
Five years ending October 31,
2028 — 247,120 33,880 74,726 — 33,800 389,526
2033 — 287,840 41,060 1,201,081 — 42,000 1,571,981
2038 — 365,665 50,000 2,262,513 — — 2,678,178
2043 — 427,040 59,785 2,733,894 — — 3,220,719
2048 — 462,215 14,390 3,613,654 — — 4,090,259
2053 — 129,150 — 2,981,426 — — 3,110,576
* 2058 — 2,180 — 230,323 — — 232,503
$ 485 3,197,745 228,780 14,152,714 150 153,810 17,733,684
Interest expense:
Fiscal Year ending October 31,
2019 $ 26 94,726 6,443 1,296,380 5 16,172 1,413,752
2020 — 95,264 6,279 1,307,298 — 12,701 1,421,542
2021 — 90,089 6,106 1,307,091 — 9,876 1,413,162
2022 — 81,943 5,925 1,306,871 — 9,264 1,404,003
2023 — 75,488 5,740 1,306,638 — 9,168 1,397,034
Five years ending October 31,
2028 — 351,156 25,961 6,505,818 — 38,034 6,920,969
2033 — 306,278 20,728 6,287,092 — 12,906 6,627,004
2038 — 243,878 14,377 5,305,784 — — 5,564,039
2043 — 162,906 6,619 3,887,790 — — 4,057,315
2048 — 75,291 441 2,440,877 — — 2,516,609
2053 — 9,879 — 597,928 — — 607,807
* 2058 — 797 — 18,119 — — 18,916
$ 26 1,587,695 98,619 31,567,686 5 108,121 33,362,152
Total debt service requirements:
Fiscal Year ending October 31,
2019 $ 511 201,481 11,998 2,334,213 155 56,052 2,604,410
2020 — 428,769 12,099 1,311,303 — 41,731 1,793,902
2021 — 503,784 12,151 1,311,292 — 17,376 1,844,603
2022 — 392,603 12,110 1,311,319 — 10,064 1,726,096
2023 — 187,408 11,800 1,311,248 — 9,968 1,520,424
Five years ending October 31,
2028 — 598,276 59,841 6,580,544 — 71,834 7,310,495
2033 — 594,118 61,788 7,488,173 — 54,906 8,198,985
2038 — 609,543 64,377 7,568,297 — — 8,242,217
2043 — 589,946 66,404 6,621,684 — — 7,278,034
2048 — 537,506 14,831 6,054,531 — — 6,606,868
2053 — 139,029 — 3,579,354 — — 3,718,383
* 2058 — 2,977 — 248,442 — — 251,419
$ 511 4,785,440 327,399 45,720,400 155 261,931 51,095,836
*Final maturity date **Interest rate on variable rate demand bonds in these programs are set by the Remarking Agent and the Broker Dealer. The maximum
interest rate as defined in respective bond resolutions cannot exceed 15%.
Housing Project Bonds
Affordable Housing Revenue Bonds
Secured Loan Rental Housing Bonds (and Other)*
Housing Project Mortgage Revenue Bonds
SCOR/ State Revenue/ Personal Income/Bond Programs**
Affordable Housing Revenue Bonds (NIBP)
50
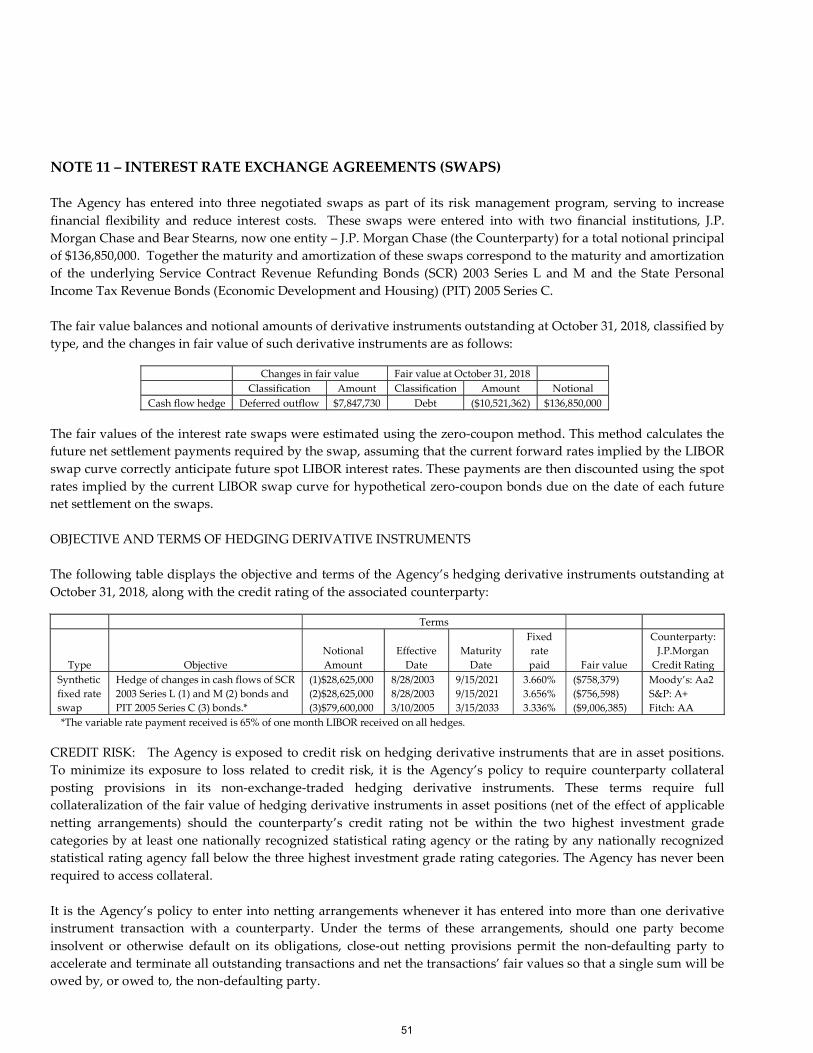
NOTE 11 – INTEREST RATE EXCHANGE AGREEMENTS (SWAPS)
The Agency has entered into three negotiated swaps as part of its risk management program, serving to increase
financial flexibility and reduce interest costs. These swaps were entered into with two financial institutions, J.P.
Morgan Chase and Bear Stearns, now one entity – J.P. Morgan Chase (the Counterparty) for a total notional principal
of $136,850,000. Together the maturity and amortization of these swaps correspond to the maturity and amortization
of the underlying Service Contract Revenue Refunding Bonds (SCR) 2003 Series L and M and the State Personal
Income Tax Revenue Bonds (Economic Development and Housing) (PIT) 2005 Series C.
The fair value balances and notional amounts of derivative instruments outstanding at October 31, 2018, classified by
type, and the changes in fair value of such derivative instruments are as follows:
Changes in fair value Fair value at October 31, 2018
Classification Amount Classification Amount Notional
Cash flow hedge Deferred outflow $7,847,730 Debt ($10,521,362) $136,850,000
The fair values of the interest rate swaps were estimated using the zero‐coupon method. This method calculates the
future net settlement payments required by the swap, assuming that the current forward rates implied by the LIBOR
swap curve correctly anticipate future spot LIBOR interest rates. These payments are then discounted using the spot
rates implied by the current LIBOR swap curve for hypothetical zero‐coupon bonds due on the date of each future
net settlement on the swaps.
OBJECTIVE AND TERMS OF HEDGING DERIVATIVE INSTRUMENTS
The following table displays the objective and terms of the Agency’s hedging derivative instruments outstanding at
October 31, 2018, along with the credit rating of the associated counterparty:
Terms
Type Objective
Notional
Amount
Effective
Date
Maturity
Date
Fixed
rate
paid Fair value
Counterparty:
J.P.Morgan
Credit Rating
Synthetic
fixed rate
swap
Hedge of changes in cash flows of SCR
2003 Series L (1) and M (2) bonds and
PIT 2005 Series C (3) bonds.*
(1)$28,625,000
(2)$28,625,000
(3)$79,600,000
8/28/2003
8/28/2003
3/10/2005
9/15/2021
9/15/2021
3/15/2033
3.660%
3.656%
3.336%
($758,379)
($756,598)
($9,006,385)
Moody’s: Aa2
S&P: A+
Fitch: AA
*The variable rate payment received is 65% of one month LIBOR received on all hedges.
CREDIT RISK: The Agency is exposed to credit risk on hedging derivative instruments that are in asset positions.
To minimize its exposure to loss related to credit risk, it is the Agency’s policy to require counterparty collateral
posting provisions in its non‐exchange‐traded hedging derivative instruments. These terms require full
collateralization of the fair value of hedging derivative instruments in asset positions (net of the effect of applicable
netting arrangements) should the counterparty’s credit rating not be within the two highest investment grade
categories by at least one nationally recognized statistical rating agency or the rating by any nationally recognized
statistical rating agency fall below the three highest investment grade rating categories. The Agency has never been
required to access collateral.
It is the Agency’s policy to enter into netting arrangements whenever it has entered into more than one derivative
instrument transaction with a counterparty. Under the terms of these arrangements, should one party become
insolvent or otherwise default on its obligations, close‐out netting provisions permit the non‐defaulting party to
accelerate and terminate all outstanding transactions and net the transactions’ fair values so that a single sum will be
owed by, or owed to, the non‐defaulting party.
51
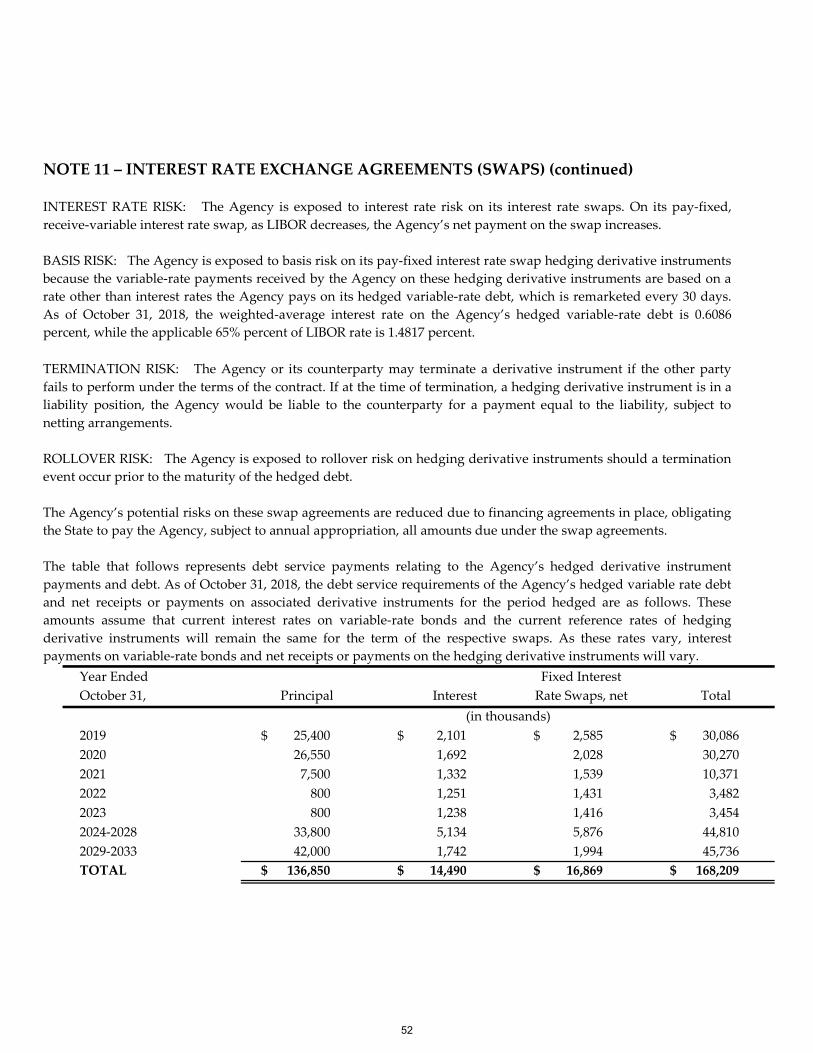
Year Ended Fixed Interest
October 31, Principal Interest Rate Swaps, net Total
2019 $ 25,400 $ 2,101 $ 2,585 $ 30,086
2020 26,550 1,692 2,028 30,270
2021 7,500 1,332 1,539 10,371
2022 800 1,251 1,431 3,482
2023 800 1,238 1,416 3,454
2024‐2028 33,800 5,134 5,876 44,810
2029‐2033 42,000 1,742 1,994 45,736
TOTAL $ 136,850 $ 14,490 $ 16,869 $ 168,209
(in thousands)
NOTE 11 – INTEREST RATE EXCHANGE AGREEMENTS (SWAPS) (continued)
INTEREST RATE RISK: The Agency is exposed to interest rate risk on its interest rate swaps. On its pay‐fixed,
receive‐variable interest rate swap, as LIBOR decreases, the Agency’s net payment on the swap increases.
BASIS RISK: The Agency is exposed to basis risk on its pay‐fixed interest rate swap hedging derivative instruments
because the variable‐rate payments received by the Agency on these hedging derivative instruments are based on a
rate other than interest rates the Agency pays on its hedged variable‐rate debt, which is remarketed every 30 days.
As of October 31, 2018, the weighted‐average interest rate on the Agency’s hedged variable‐rate debt is 0.6086
percent, while the applicable 65% percent of LIBOR rate is 1.4817 percent.
TERMINATION RISK: The Agency or its counterparty may terminate a derivative instrument if the other party
fails to perform under the terms of the contract. If at the time of termination, a hedging derivative instrument is in a
liability position, the Agency would be liable to the counterparty for a payment equal to the liability, subject to
netting arrangements.
ROLLOVER RISK: The Agency is exposed to rollover risk on hedging derivative instruments should a termination
event occur prior to the maturity of the hedged debt.
The Agency’s potential risks on these swap agreements are reduced due to financing agreements in place, obligating
the State to pay the Agency, subject to annual appropriation, all amounts due under the swap agreements.
The table that follows represents debt service payments relating to the Agency’s hedged derivative instrument
payments and debt. As of October 31, 2018, the debt service requirements of the Agency’s hedged variable rate debt
and net receipts or payments on associated derivative instruments for the period hedged are as follows. These
amounts assume that current interest rates on variable‐rate bonds and the current reference rates of hedging
derivative instruments will remain the same for the term of the respective swaps. As these rates vary, interest
payments on variable‐rate bonds and net receipts or payments on the hedging derivative instruments will vary.
52
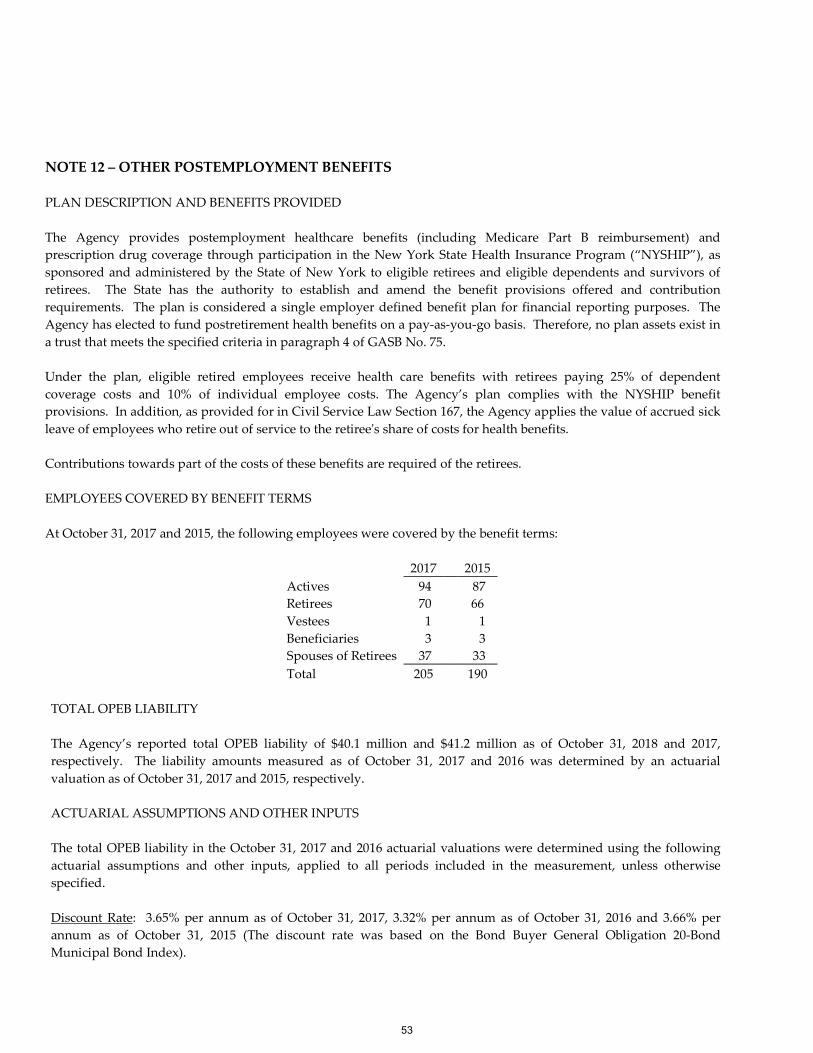
NOTE 12 – OTHER POSTEMPLOYMENT BENEFITS
PLAN DESCRIPTION AND BENEFITS PROVIDED
The Agency provides postemployment healthcare benefits (including Medicare Part B reimbursement) and
prescription drug coverage through participation in the New York State Health Insurance Program (“NYSHIP”), as
sponsored and administered by the State of New York to eligible retirees and eligible dependents and survivors of
retirees. The State has the authority to establish and amend the benefit provisions offered and contribution
requirements. The plan is considered a single employer defined benefit plan for financial reporting purposes. The
Agency has elected to fund postretirement health benefits on a pay‐as‐you‐go basis. Therefore, no plan assets exist in
a trust that meets the specified criteria in paragraph 4 of GASB No. 75.
Under the plan, eligible retired employees receive health care benefits with retirees paying 25% of dependent
coverage costs and 10% of individual employee costs. The Agency’s plan complies with the NYSHIP benefit
provisions. In addition, as provided for in Civil Service Law Section 167, the Agency applies the value of accrued sick
leave of employees who retire out of service to the retireeʹs share of costs for health benefits.
Contributions towards part of the costs of these benefits are required of the retirees.
EMPLOYEES COVERED BY BENEFIT TERMS
At October 31, 2017 and 2015, the following employees were covered by the benefit terms:
2017 2015
Actives 94 87
Retirees 70 66
Vestees 1 1
Beneficiaries 3 3
Spouses of Retirees 37 33
Total 205 190
TOTAL OPEB LIABILITY
The Agency’s reported total OPEB liability of $40.1 million and $41.2 million as of October 31, 2018 and 2017,
respectively. The liability amounts measured as of October 31, 2017 and 2016 was determined by an actuarial
valuation as of October 31, 2017 and 2015, respectively.
ACTUARIAL ASSUMPTIONS AND OTHER INPUTS
The total OPEB liability in the October 31, 2017 and 2016 actuarial valuations were determined using the following
actuarial assumptions and other inputs, applied to all periods included in the measurement, unless otherwise
specified.
Discount Rate: 3.65% per annum as of October 31, 2017, 3.32% per annum as of October 31, 2016 and 3.66% per
annum as of October 31, 2015 (The discount rate was based on the Bond Buyer General Obligation 20‐Bond
Municipal Bond Index).
53
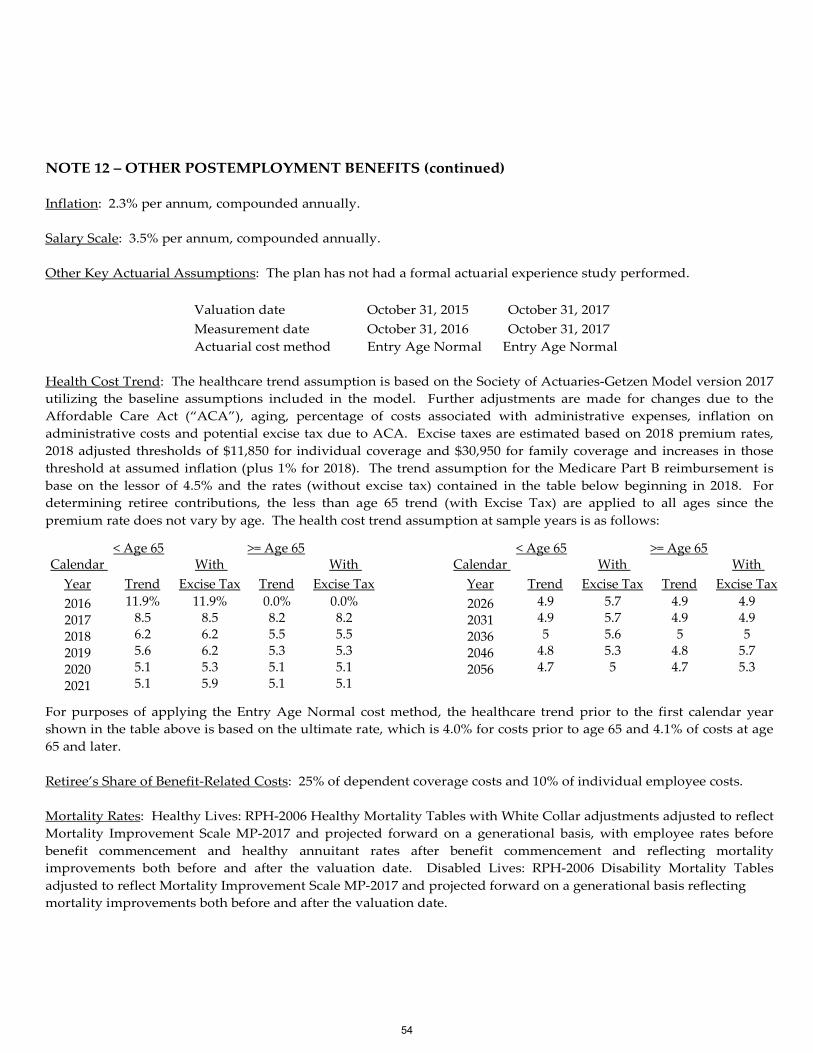
< Age 65 >= Age 65 < Age 65 >= Age 65Calendar
Year Trend
With
Excise Tax Trend
With
Excise Tax
Calendar
Year Trend
With
Excise Tax Trend
With
Excise Tax
2016 11.9% 11.9% 0.0% 0.0% 2026 4.9 5.7 4.9 4.9
2017 8.5 8.5 8.2 8.2 2031 4.9 5.7 4.9 4.9
2018 6.2 6.2 5.5 5.5 2036 5 5.6 5 5
2019 5.6 6.2 5.3 5.3 2046 4.8 5.3 4.8 5.7
2020 5.1 5.3 5.1 5.1 2056 4.7 5 4.7 5.3
2021 5.1 5.9 5.1 5.1
NOTE 12 – OTHER POSTEMPLOYMENT BENEFITS (continued)
Inflation: 2.3% per annum, compounded annually.
Salary Scale: 3.5% per annum, compounded annually.
Other Key Actuarial Assumptions: The plan has not had a formal actuarial experience study performed.
Valuation date October 31, 2015 October 31, 2017
Measurement date October 31, 2016 October 31, 2017
Actuarial cost method Entry Age Normal Entry Age Normal
Health Cost Trend: The healthcare trend assumption is based on the Society of Actuaries‐Getzen Model version 2017
utilizing the baseline assumptions included in the model. Further adjustments are made for changes due to the
Affordable Care Act (“ACA”), aging, percentage of costs associated with administrative expenses, inflation on
administrative costs and potential excise tax due to ACA. Excise taxes are estimated based on 2018 premium rates,
2018 adjusted thresholds of $11,850 for individual coverage and $30,950 for family coverage and increases in those
threshold at assumed inflation (plus 1% for 2018). The trend assumption for the Medicare Part B reimbursement is
base on the lessor of 4.5% and the rates (without excise tax) contained in the table below beginning in 2018. For
determining retiree contributions, the less than age 65 trend (with Excise Tax) are applied to all ages since the
premium rate does not vary by age. The health cost trend assumption at sample years is as follows:
For purposes of applying the Entry Age Normal cost method, the healthcare trend prior to the first calendar year
shown in the table above is based on the ultimate rate, which is 4.0% for costs prior to age 65 and 4.1% of costs at age
65 and later.
Retiree’s Share of Benefit‐Related Costs: 25% of dependent coverage costs and 10% of individual employee costs.
Mortality Rates: Healthy Lives: RPH‐2006 Healthy Mortality Tables with White Collar adjustments adjusted to reflect
Mortality Improvement Scale MP‐2017 and projected forward on a generational basis, with employee rates before
benefit commencement and healthy annuitant rates after benefit commencement and reflecting mortality
improvements both before and after the valuation date. Disabled Lives: RPH‐2006 Disability Mortality Tables
adjusted to reflect Mortality Improvement Scale MP‐2017 and projected forward on a generational basis reflecting
mortality improvements both before and after the valuation date.
54
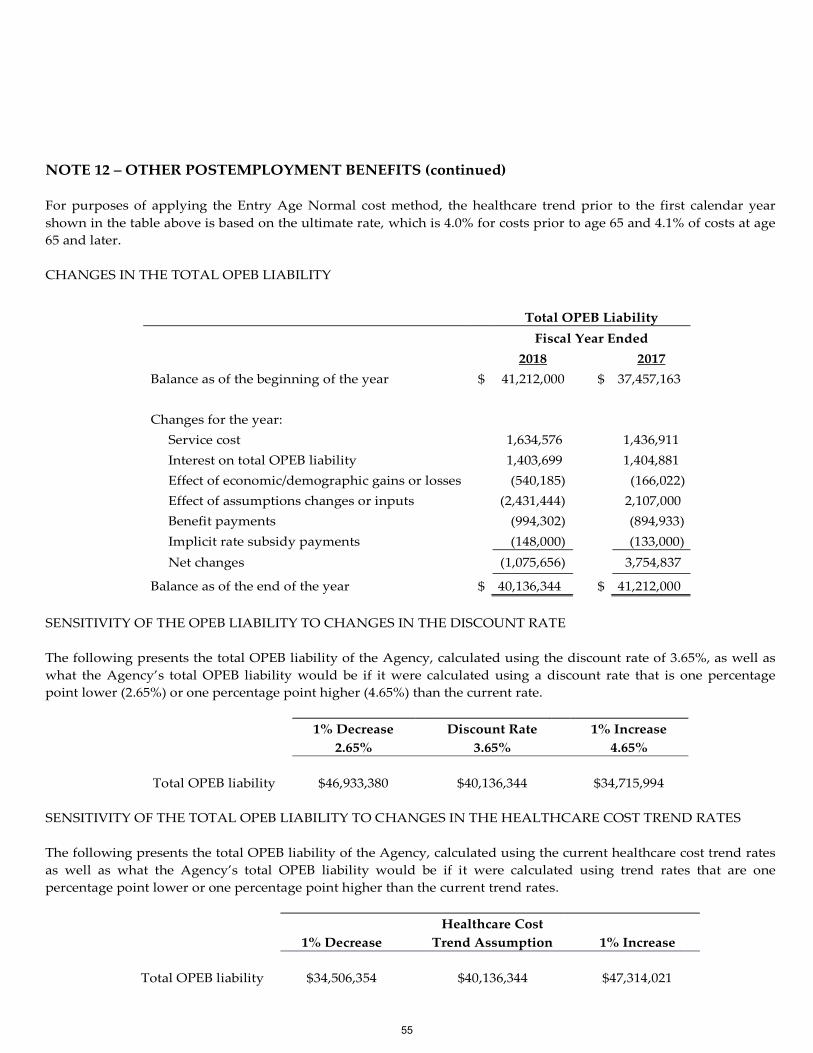
NOTE 12 – OTHER POSTEMPLOYMENT BENEFITS (continued)
For purposes of applying the Entry Age Normal cost method, the healthcare trend prior to the first calendar year
shown in the table above is based on the ultimate rate, which is 4.0% for costs prior to age 65 and 4.1% of costs at age
65 and later.
CHANGES IN THE TOTAL OPEB LIABILITY
Total OPEB Liability
Fiscal Year Ended
2018 2017
Balance as of the beginning of the year $ 41,212,000 $ 37,457,163
Changes for the year: Service cost 1,634,576 1,436,911
Interest on total OPEB liability 1,403,699 1,404,881
Effect of economic/demographic gains or losses (540,185) (166,022)
Effect of assumptions changes or inputs (2,431,444) 2,107,000
Benefit payments (994,302) (894,933)
Implicit rate subsidy payments (148,000) (133,000)
Net changes (1,075,656) 3,754,837
Balance as of the end of the year $ 40,136,344 $ 41,212,000
SENSITIVITY OF THE OPEB LIABILITY TO CHANGES IN THE DISCOUNT RATE
The following presents the total OPEB liability of the Agency, calculated using the discount rate of 3.65%, as well as
what the Agency’s total OPEB liability would be if it were calculated using a discount rate that is one percentage
point lower (2.65%) or one percentage point higher (4.65%) than the current rate.
1% Decrease Discount Rate 1% Increase
2.65% 3.65% 4.65%
Total OPEB liability $46,933,380 $40,136,344 $34,715,994
SENSITIVITY OF THE TOTAL OPEB LIABILITY TO CHANGES IN THE HEALTHCARE COST TREND RATES
The following presents the total OPEB liability of the Agency, calculated using the current healthcare cost trend rates
as well as what the Agency’s total OPEB liability would be if it were calculated using trend rates that are one
percentage point lower or one percentage point higher than the current trend rates.
Healthcare Cost
1% Decrease Trend Assumption 1% Increase
Total OPEB liability $34,506,354 $40,136,344 $47,314,021
55
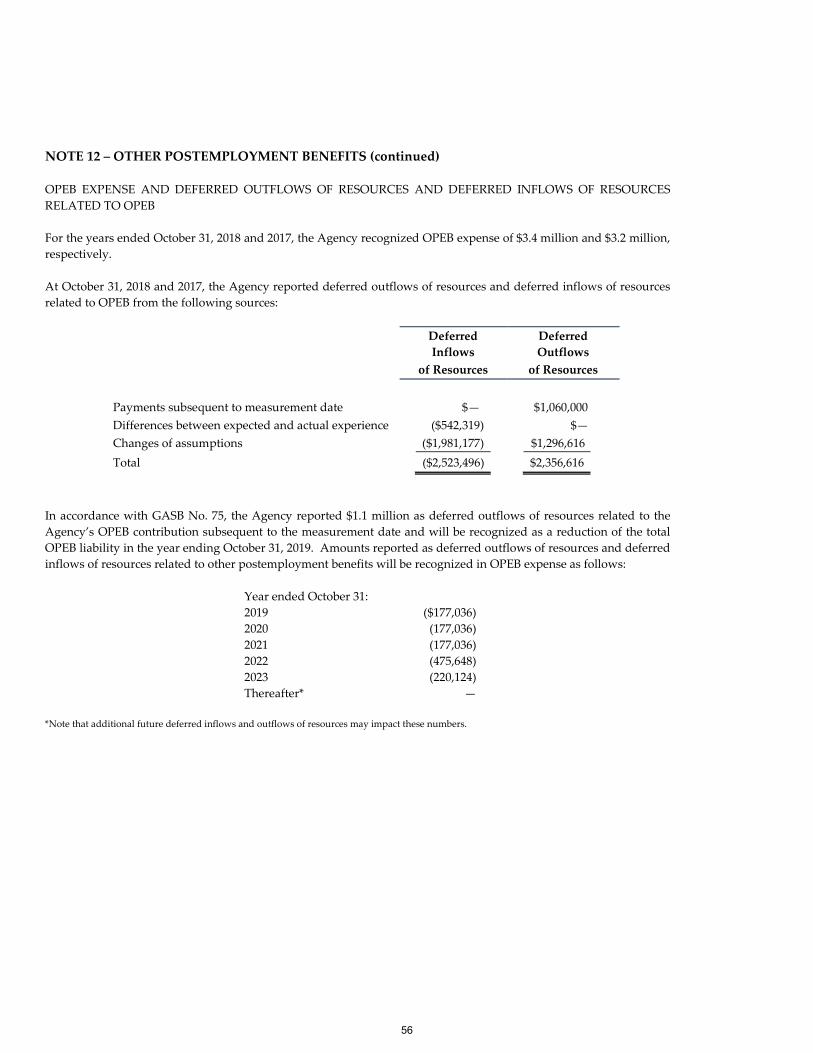
NOTE 12 – OTHER POSTEMPLOYMENT BENEFITS (continued)
OPEB EXPENSE AND DEFERRED OUTFLOWS OF RESOURCES AND DEFERRED INFLOWS OF RESOURCES
RELATED TO OPEB
For the years ended October 31, 2018 and 2017, the Agency recognized OPEB expense of $3.4 million and $3.2 million,
respectively.
At October 31, 2018 and 2017, the Agency reported deferred outflows of resources and deferred inflows of resources
related to OPEB from the following sources:
Deferred
Inflows
Deferred
Outflows
of Resources of Resources
Payments subsequent to measurement date $— $1,060,000
Differences between expected and actual experience ($542,319) $—
Changes of assumptions ($1,981,177) $1,296,616
Total ($2,523,496) $2,356,616
In accordance with GASB No. 75, the Agency reported $1.1 million as deferred outflows of resources related to the
Agency’s OPEB contribution subsequent to the measurement date and will be recognized as a reduction of the total
OPEB liability in the year ending October 31, 2019. Amounts reported as deferred outflows of resources and deferred
inflows of resources related to other postemployment benefits will be recognized in OPEB expense as follows:
Year ended October 31:
2019 ($177,036)
2020 (177,036)
2021 (177,036)
2022 (475,648)
2023 (220,124)
Thereafter* —
*Note that additional future deferred inflows and outflows of resources may impact these numbers.
56
NOTE 13 – PENSION PLANS
NEW YORK STATE AND LOCAL EMPLOYEES’ RETIREMENT SYSTEM
PLAN DESCRIPTION & BENEFITS PROVIDED The Agency, together with its subsidiary AHC, participate in the New York State and Local Employees’ Retirement
System (“ERS”) which together with the New York State and Local Police and Fire Retirement System (“PFRS”) is
collectively referred to as New York State and Local Retirement System (“NYSLRS”). These are cost‐sharing
multiple‐employer retirement systems. The NYSLRS provides retirement benefits as well as death and disability
benefits. The net position of the NYSLRS is held in the New York State Common Retirement Fund (the “Fund”),
which was established to hold all net assets and record changes in plan net position allocated to the NYSLRS. The
Comptroller of the State of New York serves as the trustee of the Fund and is the administrative head of the System.
The Comptroller is an elected official determined in a direct statewide election and serves a four year term. Thomas
P. DiNapoli has served as Comptroller since February 7, 2007. In November, 2018, he was elected for a new term
commencing January 1, 2019. NYSLRS benefits are established under the provisions of the New York State
Retirement and Social Security Law (“RSSL”). Once a public employer elects to participate in the NYSLRS, the
election is irrevocable. The New York State Constitution provides that pension membership is a contractual
relationship and plan benefits cannot be diminished or impaired. Benefits can be changed for future members only
by enactment of a State statute. The Agency also participates in the Public Employees’ Group Life Insurance Plan
(“GLIP”), which provides death benefits in the form of life insurance. The NYSLRS is included in the State’s
financial report as a pension trust fund. That report, including information with regard to benefits provided, may be
found at www.osc.state.ny.us/retire/publications/index.php or obtained by writing to the New York State and Local
Retirement System, 110 State Street, Albany, NY 12244.
The amount the Agency is billed by NYSLRS for pension costs also include pension costs relating to AHC. As a
result, the Agencyʹs deferred amount for pensions and net pension liability includes the portion relating to AHC.
The service agreement between the Agency and AHC provides for an allocation of these costs to AHC, representing
its share of these amounts. EMPLOYEE CONTRIBUTIONS Pension legislation enacted in 1973, 1976, 1983, 2009 and 2012 established distinct classes of membership. For
convenience, the system uses a tier concept, ranging from Tier 1 to 6, to distinguish these groups. Generally, Tier 3,
4, and 5 members must contribute 3% of their salary to the System. As a result of Article 19 of the RSSL, eligible Tier
3 and 4 employees, with a membership date on or after July 27, 1976, who have ten or more years of membership or
credited service with the System, are not required to contribute. Members cannot be required to begin making
contributions or to make increased contributions beyond what was required when membership began. For Tier 6
members, the contribution rate varies from 3% to 6% depending on salary. Generally, Tier 5 and 6 members are
required to contribute for all years of service.
Employee contributions for employees of the Agency and AHC for the current year and two preceding years were
equal to 100 percent of the contributions required, and were as follows:
Year 2018 $197,483
Year 2017 $140,488
Year 2016 $120,414
57
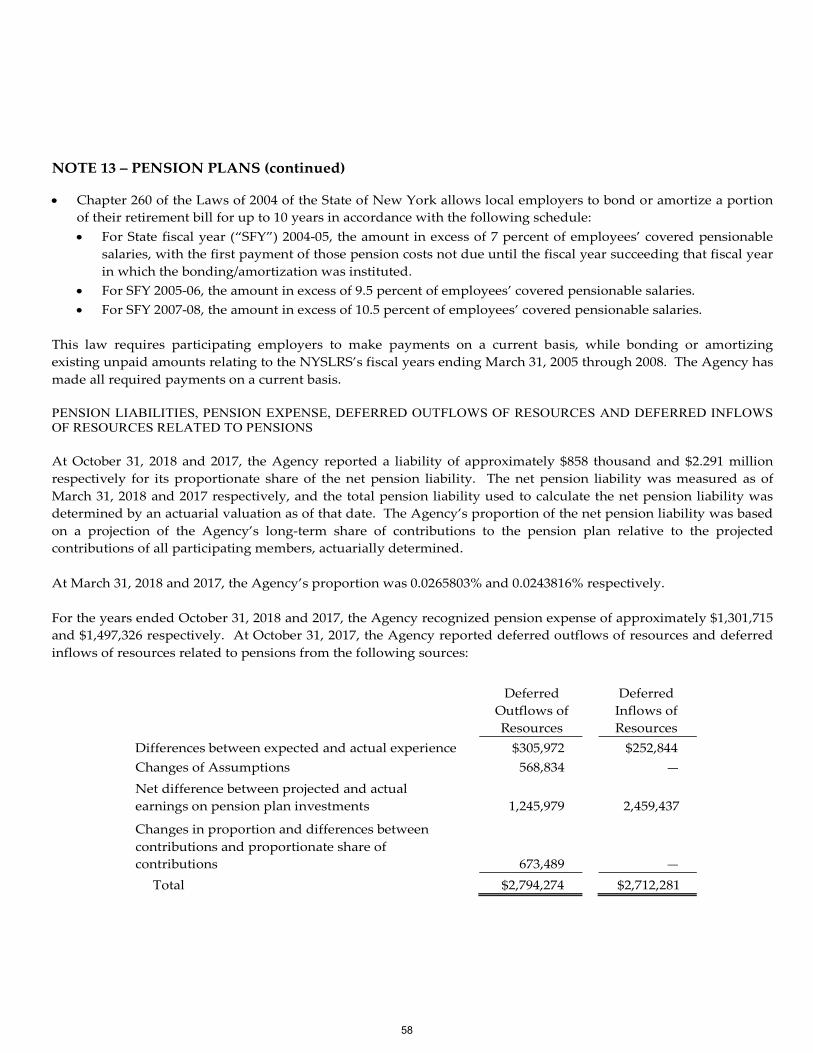
NOTE 13 – PENSION PLANS (continued)
Chapter 260 of the Laws of 2004 of the State of New York allows local employers to bond or amortize a portion
of their retirement bill for up to 10 years in accordance with the following schedule:
For State fiscal year (“SFY”) 2004‐05, the amount in excess of 7 percent of employees’ covered pensionable
salaries, with the first payment of those pension costs not due until the fiscal year succeeding that fiscal year
in which the bonding/amortization was instituted.
For SFY 2005‐06, the amount in excess of 9.5 percent of employees’ covered pensionable salaries.
For SFY 2007‐08, the amount in excess of 10.5 percent of employees’ covered pensionable salaries.
This law requires participating employers to make payments on a current basis, while bonding or amortizing
existing unpaid amounts relating to the NYSLRS’s fiscal years ending March 31, 2005 through 2008. The Agency has
made all required payments on a current basis.
PENSION LIABILITIES, PENSION EXPENSE, DEFERRED OUTFLOWS OF RESOURCES AND DEFERRED INFLOWS OF RESOURCES RELATED TO PENSIONS
At October 31, 2018 and 2017, the Agency reported a liability of approximately $858 thousand and $2.291 million
respectively for its proportionate share of the net pension liability. The net pension liability was measured as of
March 31, 2018 and 2017 respectively, and the total pension liability used to calculate the net pension liability was
determined by an actuarial valuation as of that date. The Agency’s proportion of the net pension liability was based
on a projection of the Agency’s long‐term share of contributions to the pension plan relative to the projected
contributions of all participating members, actuarially determined.
At March 31, 2018 and 2017, the Agency’s proportion was 0.0265803% and 0.0243816% respectively.
For the years ended October 31, 2018 and 2017, the Agency recognized pension expense of approximately $1,301,715
and $1,497,326 respectively. At October 31, 2017, the Agency reported deferred outflows of resources and deferred
inflows of resources related to pensions from the following sources:
Deferred
Outflows of
Resources
Deferred
Inflows of
Resources
Differences between expected and actual experience $305,972 $252,844
Changes of Assumptions 568,834 —
Net difference between projected and actual
earnings on pension plan investments 1,245,979 2,459,437
Changes in proportion and differences between
contributions and proportionate share of
contributions 673,489 —
Total $2,794,274 $2,712,281
58
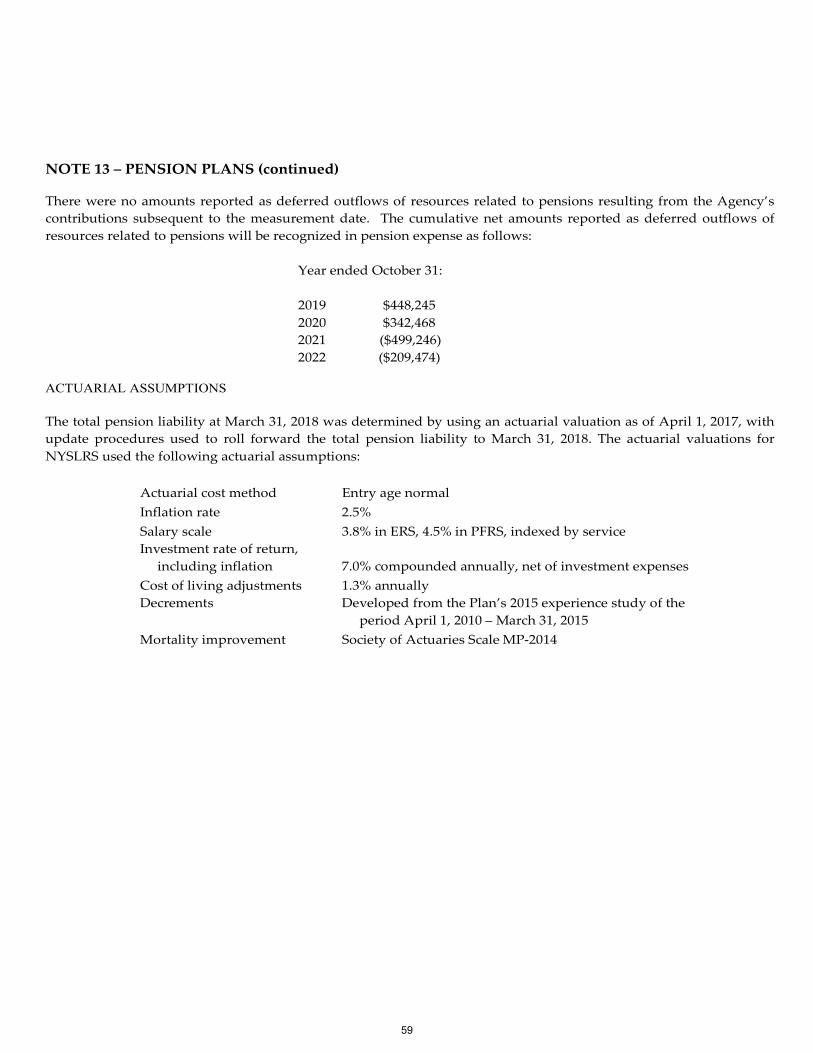
NOTE 13 – PENSION PLANS (continued)
There were no amounts reported as deferred outflows of resources related to pensions resulting from the Agency’s
contributions subsequent to the measurement date. The cumulative net amounts reported as deferred outflows of
resources related to pensions will be recognized in pension expense as follows:
Year ended October 31:
2019 $448,245
2020 $342,468
2021
2022
($499,246)
($209,474) ACTUARIAL ASSUMPTIONS The total pension liability at March 31, 2018 was determined by using an actuarial valuation as of April 1, 2017, with
update procedures used to roll forward the total pension liability to March 31, 2018. The actuarial valuations for
NYSLRS used the following actuarial assumptions:
Actuarial cost method Entry age normal
Inflation rate 2.5%
Salary scale 3.8% in ERS, 4.5% in PFRS, indexed by service
Investment rate of return,
including inflation 7.0% compounded annually, net of investment expenses
Cost of living adjustments 1.3% annually
Decrements
Developed from the Plan’s 2015 experience study of the
period April 1, 2010 – March 31, 2015
Mortality improvement Society of Actuaries Scale MP‐2014
59
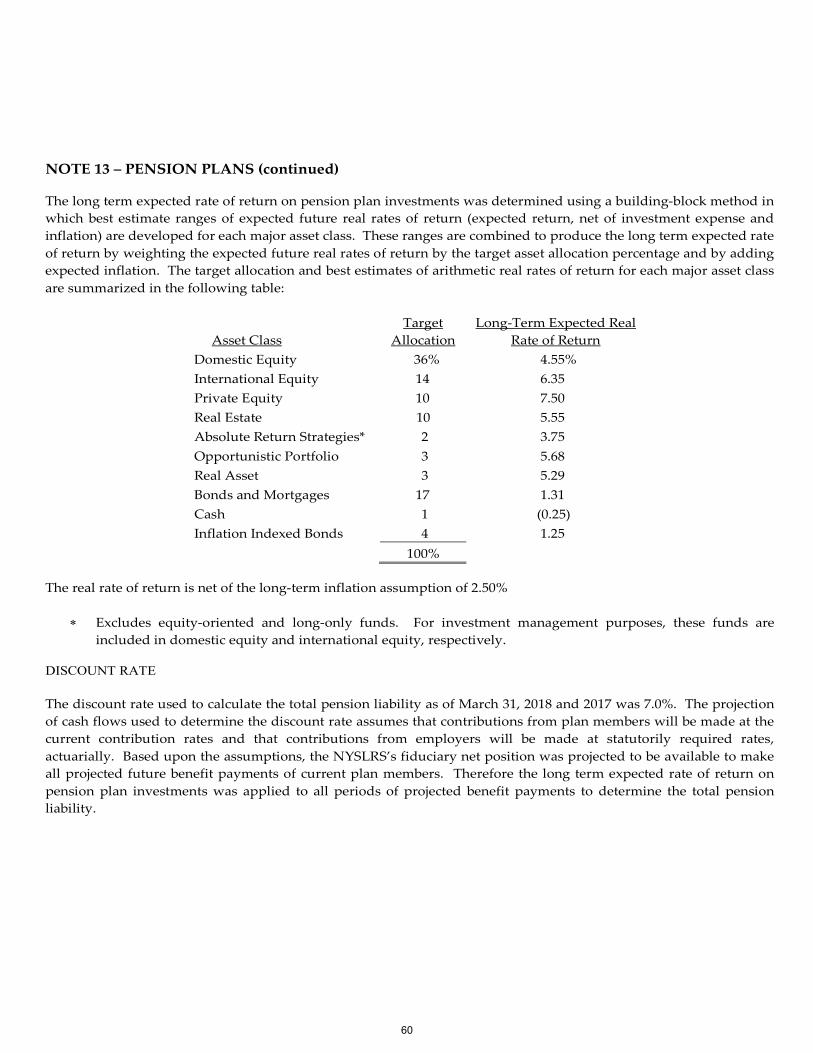
NOTE 13 – PENSION PLANS (continued)
The long term expected rate of return on pension plan investments was determined using a building‐block method in
which best estimate ranges of expected future real rates of return (expected return, net of investment expense and
inflation) are developed for each major asset class. These ranges are combined to produce the long term expected rate
of return by weighting the expected future real rates of return by the target asset allocation percentage and by adding
expected inflation. The target allocation and best estimates of arithmetic real rates of return for each major asset class
are summarized in the following table:
Asset Class
Target
Allocation
Long‐Term Expected Real
Rate of Return
Domestic Equity 36% 4.55%
International Equity 14 6.35
Private Equity 10 7.50
Real Estate 10 5.55
Absolute Return Strategies* 2 3.75
Opportunistic Portfolio 3 5.68
Real Asset 3 5.29
Bonds and Mortgages 17 1.31
Cash 1 (0.25)
Inflation Indexed Bonds 4 1.25
100%
The real rate of return is net of the long‐term inflation assumption of 2.50%
Excludes equity‐oriented and long‐only funds. For investment management purposes, these funds are
included in domestic equity and international equity, respectively. DISCOUNT RATE The discount rate used to calculate the total pension liability as of March 31, 2018 and 2017 was 7.0%. The projection
of cash flows used to determine the discount rate assumes that contributions from plan members will be made at the
current contribution rates and that contributions from employers will be made at statutorily required rates,
actuarially. Based upon the assumptions, the NYSLRS’s fiduciary net position was projected to be available to make
all projected future benefit payments of current plan members. Therefore the long term expected rate of return on
pension plan investments was applied to all periods of projected benefit payments to determine the total pension
liability.
60
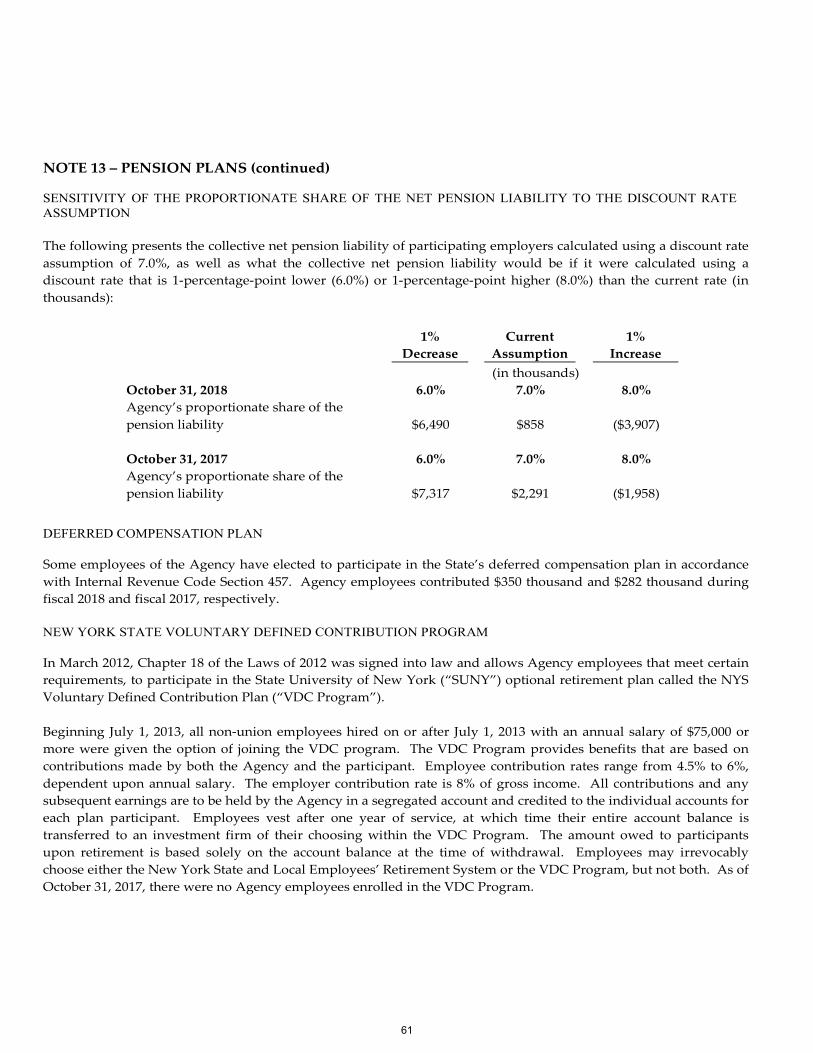
NOTE 13 – PENSION PLANS (continued)
SENSITIVITY OF THE PROPORTIONATE SHARE OF THE NET PENSION LIABILITY TO THE DISCOUNT RATE ASSUMPTION The following presents the collective net pension liability of participating employers calculated using a discount rate
assumption of 7.0%, as well as what the collective net pension liability would be if it were calculated using a
discount rate that is 1‐percentage‐point lower (6.0%) or 1‐percentage‐point higher (8.0%) than the current rate (in
thousands): DEFERRED COMPENSATION PLAN Some employees of the Agency have elected to participate in the State’s deferred compensation plan in accordance
with Internal Revenue Code Section 457. Agency employees contributed $350 thousand and $282 thousand during
fiscal 2018 and fiscal 2017, respectively.
NEW YORK STATE VOLUNTARY DEFINED CONTRIBUTION PROGRAM In March 2012, Chapter 18 of the Laws of 2012 was signed into law and allows Agency employees that meet certain
requirements, to participate in the State University of New York (“SUNY”) optional retirement plan called the NYS
Voluntary Defined Contribution Plan (“VDC Program”).
Beginning July 1, 2013, all non‐union employees hired on or after July 1, 2013 with an annual salary of $75,000 or
more were given the option of joining the VDC program. The VDC Program provides benefits that are based on
contributions made by both the Agency and the participant. Employee contribution rates range from 4.5% to 6%,
dependent upon annual salary. The employer contribution rate is 8% of gross income. All contributions and any
subsequent earnings are to be held by the Agency in a segregated account and credited to the individual accounts for
each plan participant. Employees vest after one year of service, at which time their entire account balance is
transferred to an investment firm of their choosing within the VDC Program. The amount owed to participants
upon retirement is based solely on the account balance at the time of withdrawal. Employees may irrevocably
choose either the New York State and Local Employees’ Retirement System or the VDC Program, but not both. As of
October 31, 2017, there were no Agency employees enrolled in the VDC Program.
1%
Decrease
Current
Assumption
1%
Increase
(in thousands)
October 31, 2018
Agency’s proportionate share of the
pension liability
6.0%
$6,490
7.0%
$858
8.0%
($3,907)
October 31, 2017
Agency’s proportionate share of the
pension liability
6.0%
$7,317
7.0%
$2,291
8.0%
($1,958)
61

NOTE 14 – COMMITMENTS AND CONTINGENCIES
LOANS
The Agency originates commitments to lend mortgage funds to borrowers in the normal course of business to meet
the financing needs of developers providing affordable housing in the State of New York. Commitments to advance
such funds are contractual obligations to lend to developers so long as all established contractual conditions are
satisfied. As of October 31, 2018 and 2017, the Agency held undistributed bond proceeds which will be used to fund its
outstanding loan commitments in the amounts of $970.5 million and $2.26 billion, respectively.
OFFICE LEASES
The Agency is obligated under leases for office locations in the City of New York (the “City”) and Buffalo. The
Agency and the State of New York Mortgage Agency (“SONYMA”) entered into an operating lease for office space
in the City which commenced in fiscal year 1994 for a term of fifteen years. The lease was renewed during the fiscal
year ended October 31, 2007, effective January 1, 2009 for a term of ten years, and expires on January 31, 2019.
During fiscal 2019, the Agency will make its final payments on the city office lease, totaling $591 thousand.
Rental expense for all office locations for both fiscal years ended October 31, 2018 and October 31, 2017 was
$2.9 million, net of allocations to certain State‐related agencies.
Subsequent to the end of fiscal 2018, the Agency entered into a new lease agreement for the 641 Lexington location.
LITIGATION
In the ordinary course of business, the Agency is party to various administrative and legal proceedings. While the
ultimate outcome of these matters cannot presently be determined, it is the Agency’s opinion that the resolution of
these matters will not have a material effect on its financial condition.
RISK MANAGEMENT
The Agency is subject to normal risks associated with its operations, including property damage, general liability
and crime. Such risks are managed through the purchase of commercial insurance. There have been no decreases in
coverage in the last three years.
62

****
NOTE 15 – SUBSEQUENT EVENTS
Subsequent to October 31, 2018, a total of $440.3 million of bonds were issued to finance various housing projects in
the course of the Agency’s normal business activities.
63

RequiredSupplemental
Schedules
64
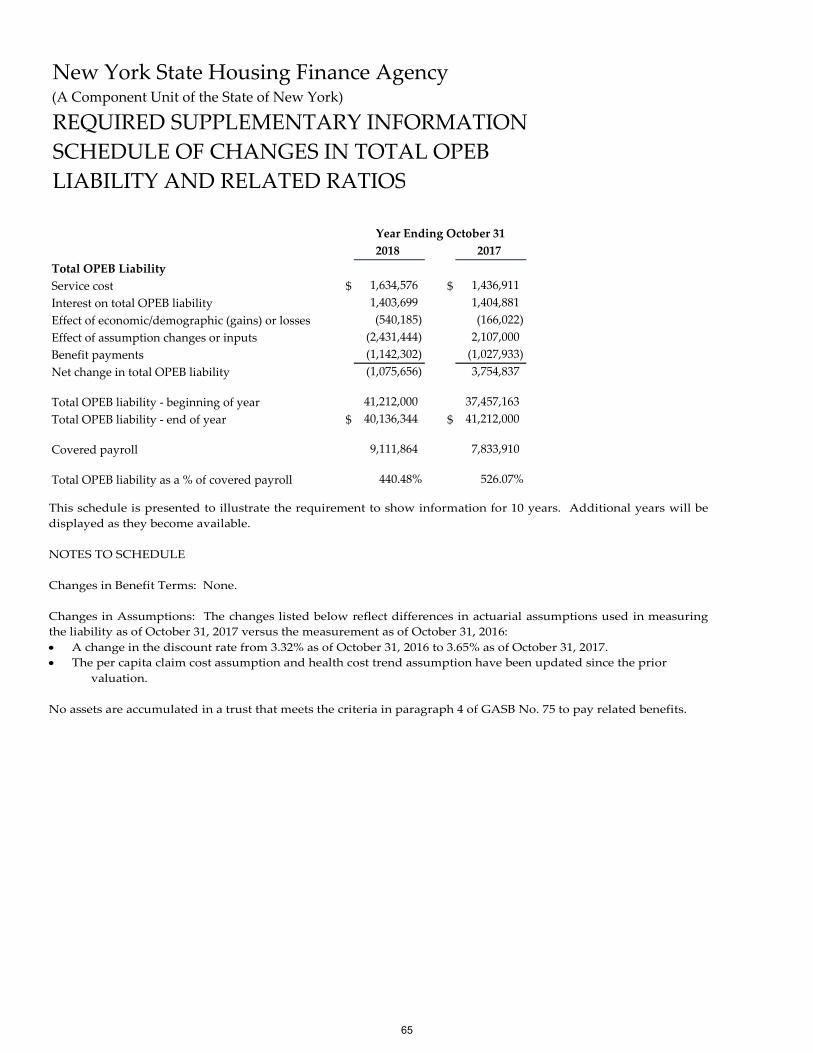
New York State Housing Finance Agency(A Component Unit of the State of New York)
REQUIRED SUPPLEMENTARY INFORMATION
SCHEDULE OF CHANGES IN TOTAL OPEB
LIABILITY AND RELATED RATIOS
Year Ending October 31
2018 2017
Total OPEB Liability
Service cost $ 1,634,576 $ 1,436,911
Interest on total OPEB liability 1,403,699 1,404,881
Effect of economic/demographic (gains) or losses (540,185) (166,022)
Effect of assumption changes or inputs (2,431,444) 2,107,000
Benefit payments (1,142,302) (1,027,933)
Net change in total OPEB liability (1,075,656) 3,754,837
Total OPEB liability ‐ beginning of year 41,212,000 37,457,163
Total OPEB liability ‐ end of year $ 40,136,344 $ 41,212,000
Covered payroll 9,111,864 7,833,910
Total OPEB liability as a % of covered payroll 440.48% 526.07%
This schedule is presented to illustrate the requirement to show information for 10 years. Additional years will be
displayed as they become available.
NOTES TO SCHEDULE
Changes in Benefit Terms: None.
Changes in Assumptions: The changes listed below reflect differences in actuarial assumptions used in measuring
the liability as of October 31, 2017 versus the measurement as of October 31, 2016:
A change in the discount rate from 3.32% as of October 31, 2016 to 3.65% as of October 31, 2017.
The per capita claim cost assumption and health cost trend assumption have been updated since the prior
valuation.
No assets are accumulated in a trust that meets the criteria in paragraph 4 of GASB No. 75 to pay related benefits.
65
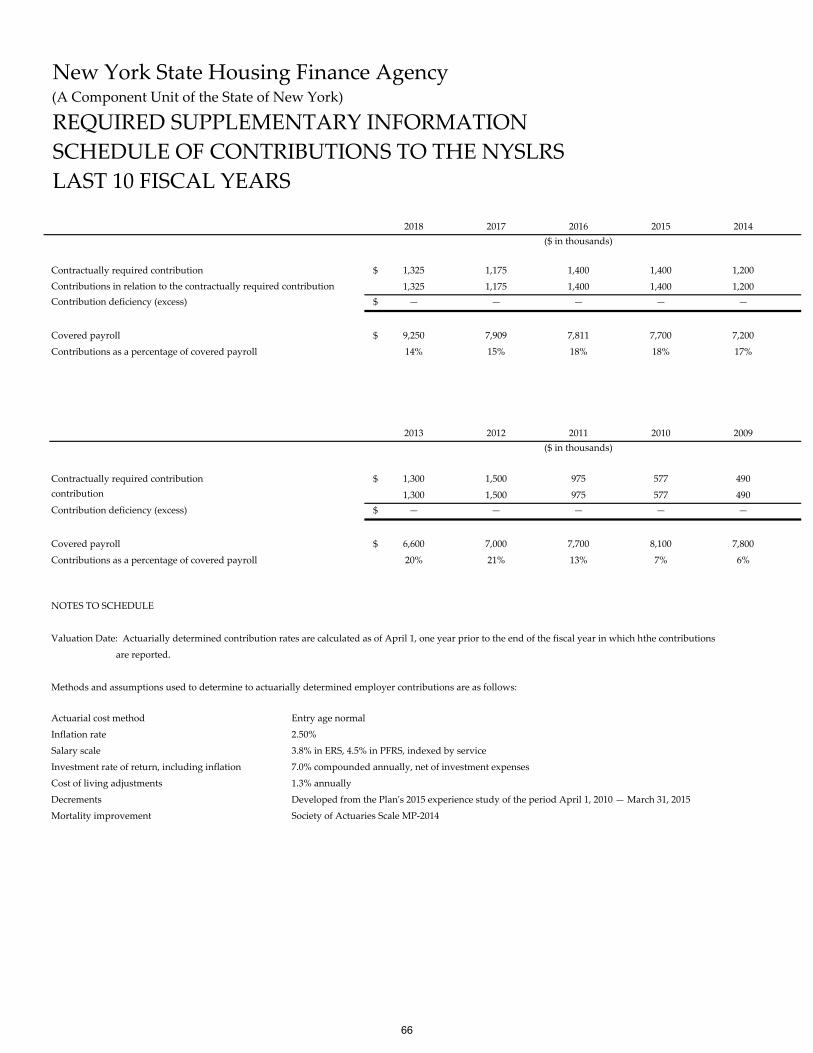
New York State Housing Finance Agency(A Component Unit of the State of New York)
REQUIRED SUPPLEMENTARY INFORMATION
SCHEDULE OF CONTRIBUTIONS TO THE NYSLRS
LAST 10 FISCAL YEARS
2018 2017 2016 2015 2014
Contractually required contribution $ 1,325 1,175 1,400 1,400 1,200
1,325 1,175 1,400 1,400 1,200
Contribution deficiency (excess) $ — — — — —
Covered payroll $ 9,250 7,909 7,811 7,700 7,200
Contributions as a percentage of covered payroll 14% 15% 18% 18% 17%
2013 2012 2011 2010 2009
Contractually required contribution $ 1,300 1,500 975 577 490
contribution 1,300 1,500 975 577 490
Contribution deficiency (excess) $ — — — — —
Covered payroll $ 6,600 7,000 7,700 8,100 7,800
Contributions as a percentage of covered payroll 20% 21% 13% 7% 6%
NOTES TO SCHEDULE
Valuation Date: Actuarially determined contribution rates are calculated as of April 1, one year prior to the end of the fiscal year in which hthe contributions
are reported.
Methods and assumptions used to determine to actuarially determined employer contributions are as follows:
Actuarial cost method Entry age normal
Inflation rate 2.50%
Salary scale 3.8% in ERS, 4.5% in PFRS, indexed by service
Investment rate of return, including inflation 7.0% compounded annually, net of investment expenses
Cost of living adjustments 1.3% annually
Decrements Developed from the Planʹs 2015 experience study of the period April 1, 2010 — March 31, 2015
Mortality improvement Society of Actuaries Scale MP‐2014
($ in thousands)
($ in thousands)
Contributions in relation to the contractually required contribution
66
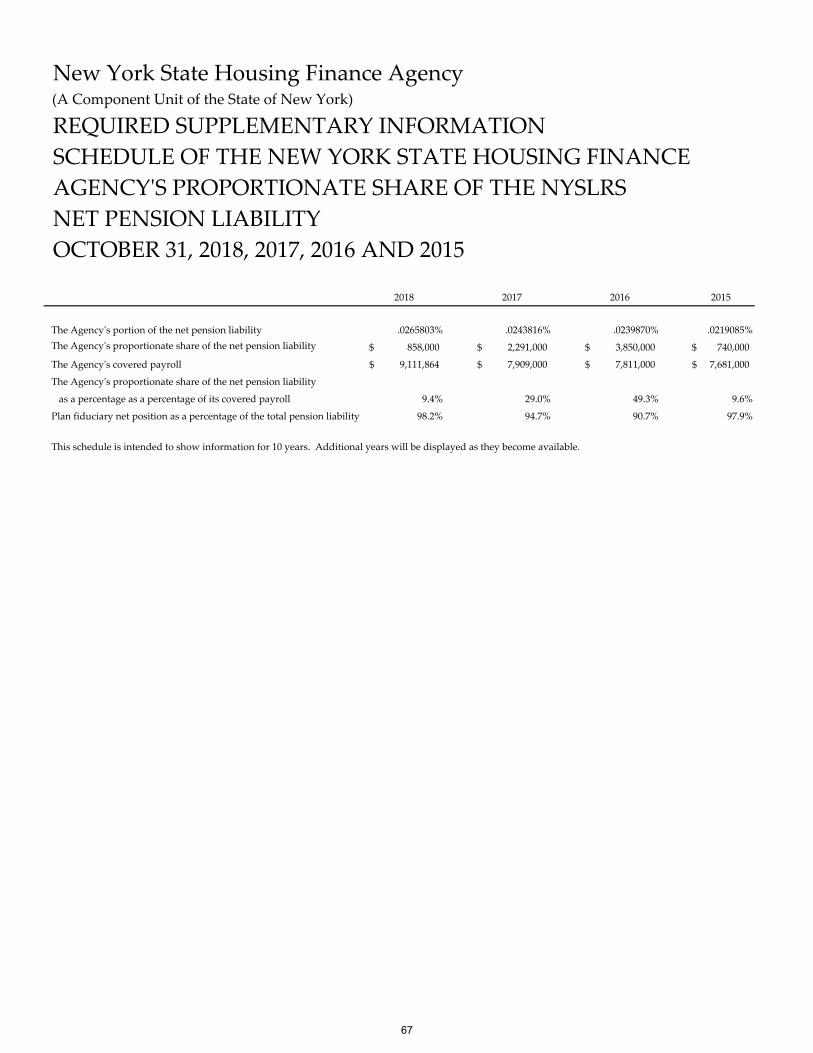
New York State Housing Finance Agency(A Component Unit of the State of New York)
REQUIRED SUPPLEMENTARY INFORMATION
SCHEDULE OF THE NEW YORK STATE HOUSING FINANCE
AGENCYʹS PROPORTIONATE SHARE OF THE NYSLRS
NET PENSION LIABILITY
OCTOBER 31, 2018, 2017, 2016 AND 2015
2018 2017 2016 2015
The Agencyʹs portion of the net pension liability .0265803% .0243816% .0239870% .0219085%
The Agencyʹs proportionate share of the net pension liability 858,000$ 2,291,000$ 3,850,000$ 740,000$
The Agencyʹs covered payroll 9,111,864$ 7,909,000$ 7,811,000$ 7,681,000$
The Agencyʹs proportionate share of the net pension liability
as a percentage as a percentage of its covered payroll 9.4% 29.0% 49.3% 9.6%
Plan fiduciary net position as a percentage of the total pension liability 98.2% 94.7% 90.7% 97.9%
This schedule is intended to show information for 10 years. Additional years will be displayed as they become available.
67

SupplementarySection
68

This Page Deliberately Left Blank
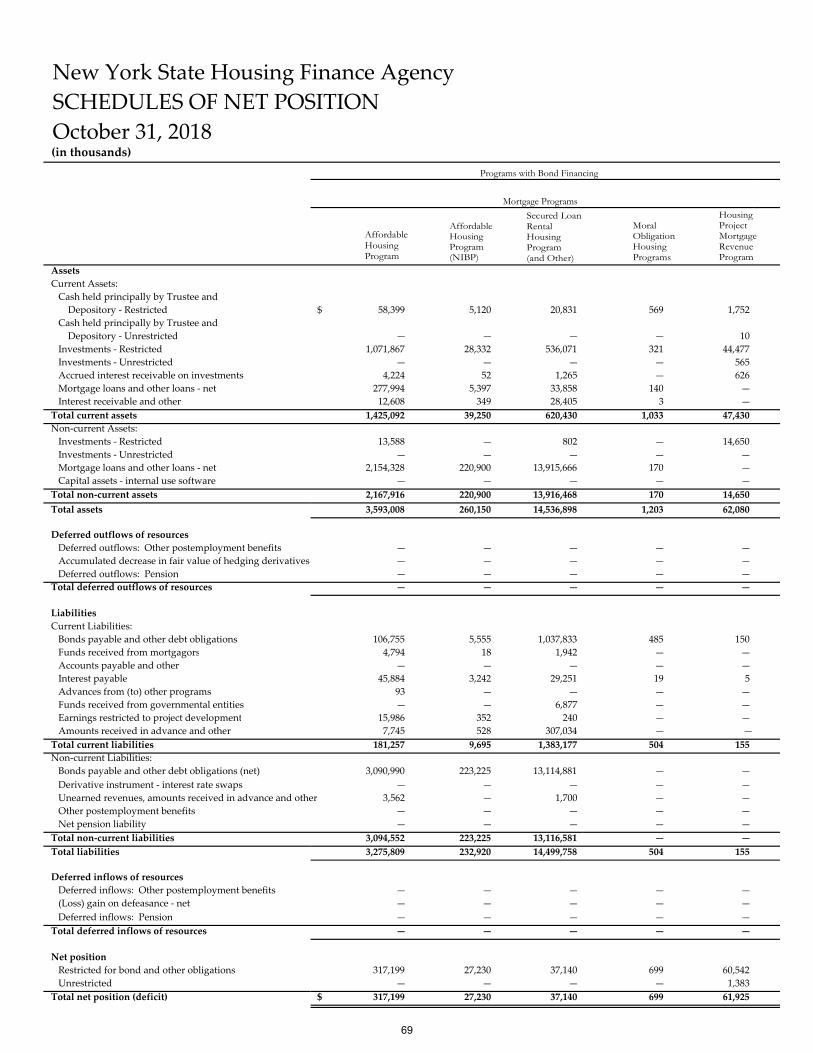
New York State Housing Finance Agency
SCHEDULES OF NET POSITION
October 31, 2018(in thousands)
Assets
Current Assets:
Cash held principally by Trustee and
Depository ‐ Restricted $ 58,399 5,120 20,831 569 1,752
Cash held principally by Trustee and
Depository ‐ Unrestricted — — — — 10
Investments ‐ Restricted 1,071,867 28,332 536,071 321 44,477
Investments ‐ Unrestricted — — — — 565
Accrued interest receivable on investments 4,224 52 1,265 — 626
Mortgage loans and other loans ‐ net 277,994 5,397 33,858 140 —
Interest receivable and other 12,608 349 28,405 3 —
Total current assets 1,425,092 39,250 620,430 1,033 47,430
Non‐current Assets:
Investments ‐ Restricted 13,588 — 802 — 14,650
Investments ‐ Unrestricted — — — — —
Mortgage loans and other loans ‐ net 2,154,328 220,900 13,915,666 170 —
Capital assets ‐ internal use software — — — — —
Total non‐current assets 2,167,916 220,900 13,916,468 170 14,650
Total assets 3,593,008 260,150 14,536,898 1,203 62,080
Deferred outflows of resources
Deferred outflows: Other postemployment benefits — — — — —
Accumulated decrease in fair value of hedging derivatives — — — — —
Deferred outflows: Pension — — — — —
Total deferred outflows of resources — — — — —
Liabilities
Current Liabilities:
Bonds payable and other debt obligations 106,755 5,555 1,037,833 485 150
Funds received from mortgagors 4,794 18 1,942 — —
Accounts payable and other — — — — —
Interest payable 45,884 3,242 29,251 19 5
Advances from (to) other programs 93 — — — —
Funds received from governmental entities — — 6,877 — —
Earnings restricted to project development 15,986 352 240 — —
Amounts received in advance and other 7,745 528 307,034 — —
Total current liabilities 181,257 9,695 1,383,177 504 155
Non‐current Liabilities:
Bonds payable and other debt obligations (net) 3,090,990 223,225 13,114,881 — —
Derivative instrument ‐ interest rate swaps — — — — —
Unearned revenues, amounts received in advance and other 3,562 — 1,700 — —
Other postemployment benefits — — — — —
Net pension liability — — — — —
Total non‐current liabilities 3,094,552 223,225 13,116,581 — —
Total liabilities 3,275,809 232,920 14,499,758 504 155
Deferred inflows of resources
Deferred inflows: Other postemployment benefits — — — — —
(Loss) gain on defeasance ‐ net — — — — —
Deferred inflows: Pension — — — — —
Total deferred inflows of resources — — — — —
Net position
Restricted for bond and other obligations 317,199 27,230 37,140 699 60,542
Unrestricted — — — — 1,383
Total net position (deficit) $ 317,199 27,230 37,140 699 61,925
Mortgage Programs
Programs with Bond Financing
Affordable Housing Program
Affordable Housing Program (NIBP)
Secured Loan Rental Housing Program (and Other)
Moral Obligation Housing Programs
Housing Project Mortgage Revenue Program
69
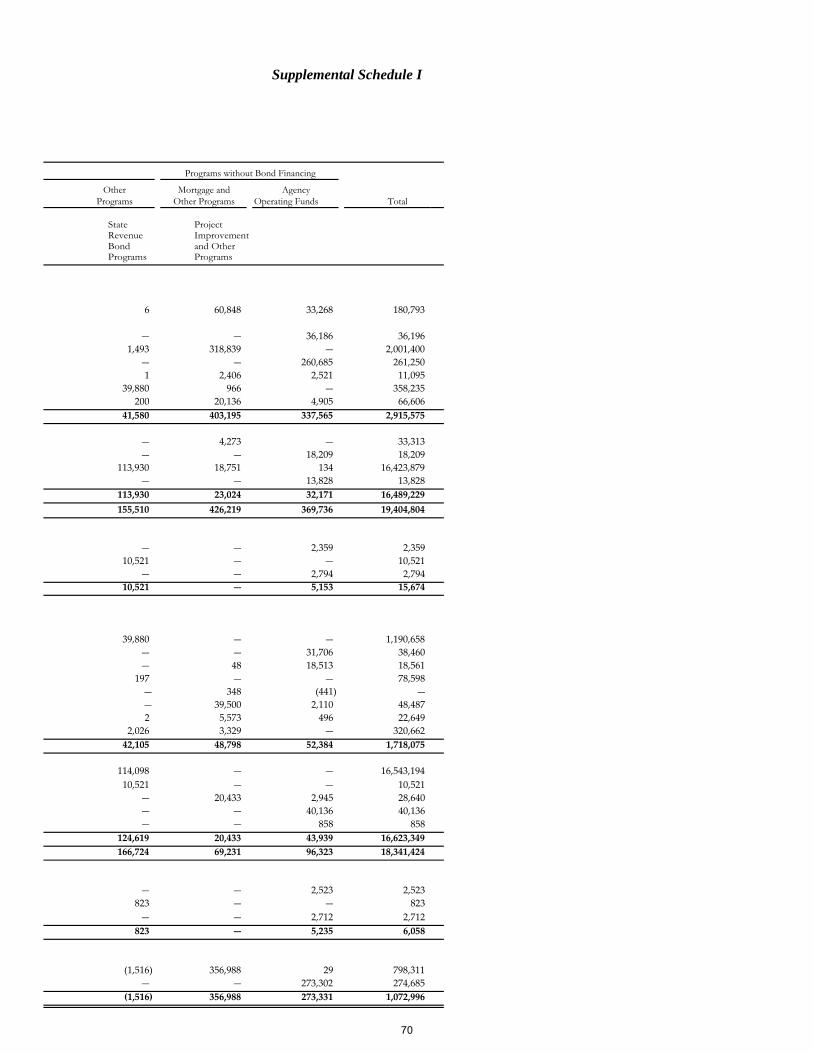
Other Mortgage and Agency Programs Other Programs Operating Funds Total
6 60,848 33,268 180,793
— — 36,186 36,196
1,493 318,839 — 2,001,400
— — 260,685 261,250
1 2,406 2,521 11,095
39,880 966 — 358,235
200 20,136 4,905 66,606
41,580 403,195 337,565 2,915,575
— 4,273 — 33,313
— — 18,209 18,209
113,930 18,751 134 16,423,879
— — 13,828 13,828
113,930 23,024 32,171 16,489,229
155,510 426,219 369,736 19,404,804
— — 2,359 2,359
10,521 — — 10,521
— — 2,794 2,794
10,521 — 5,153 15,674
39,880 — — 1,190,658
— — 31,706 38,460
— 48 18,513 18,561
197 — — 78,598
— 348 (441) —
— 39,500 2,110 48,487
2 5,573 496 22,649
2,026 3,329 — 320,662
42,105 48,798 52,384 1,718,075
114,098 — — 16,543,194
10,521 — — 10,521
— 20,433 2,945 28,640
— — 40,136 40,136
— — 858 858
124,619 20,433 43,939 16,623,349
166,724 69,231 96,323 18,341,424
— — 2,523 2,523
823 — — 823
— — 2,712 2,712
823 — 5,235 6,058
(1,516) 356,988 29 798,311
— — 273,302 274,685
(1,516) 356,988 273,331 1,072,996
Supplemental Schedule I
Programs without Bond Financing
State Revenue Bond Programs
Project Improvement and Other Programs
70
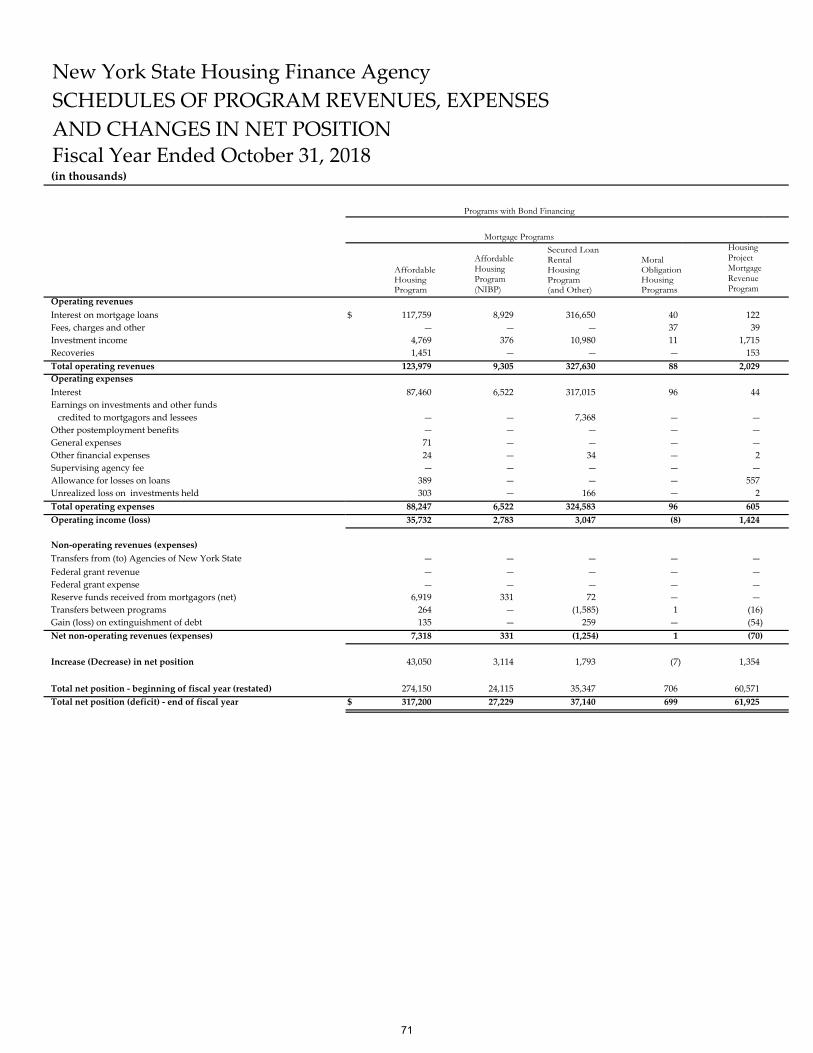
New York State Housing Finance Agency
SCHEDULES OF PROGRAM REVENUES, EXPENSES
AND CHANGES IN NET POSITION
Fiscal Year Ended October 31, 2018(in thousands)
Operating revenues
Interest on mortgage loans $ 117,759 8,929 316,650 40 122
Fees, charges and other — — — 37 39
Investment income 4,769 376 10,980 11 1,715
Recoveries 1,451 — — — 153
Total operating revenues 123,979 9,305 327,630 88 2,029
Operating expenses
Interest 87,460 6,522 317,015 96 44
Earnings on investments and other funds
credited to mortgagors and lessees — — 7,368 — —
Other postemployment benefits — — — — —
General expenses 71 — — — —
Other financial expenses 24 — 34 — 2
Supervising agency fee — — — — —
Allowance for losses on loans 389 — — — 557
Unrealized loss on investments held 303 — 166 — 2
Total operating expenses 88,247 6,522 324,583 96 605
Operating income (loss) 35,732 2,783 3,047 (8) 1,424
Non‐operating revenues (expenses)
Transfers from (to) Agencies of New York State — — — — —
Federal grant revenue — — — — —
Federal grant expense — — — — —
Reserve funds received from mortgagors (net) 6,919 331 72 — —
Transfers between programs 264 — (1,585) 1 (16)
Gain (loss) on extinguishment of debt 135 — 259 — (54)
Net non‐operating revenues (expenses) 7,318 331 (1,254) 1 (70)
Increase (Decrease) in net position 43,050 3,114 1,793 (7) 1,354
Total net position ‐ beginning of fiscal year (restated) 274,150 24,115 35,347 706 60,571
Total net position (deficit) ‐ end of fiscal year $ 317,200 27,229 37,140 699 61,925
Programs with Bond Financing
Mortgage Programs
Affordable Housing Program
Affordable Housing Program (NIBP)
Secured Loan Rental Housing Program (and Other)
Moral Obligation Housing Programs
HousingProject Mortgage Revenue Program
71
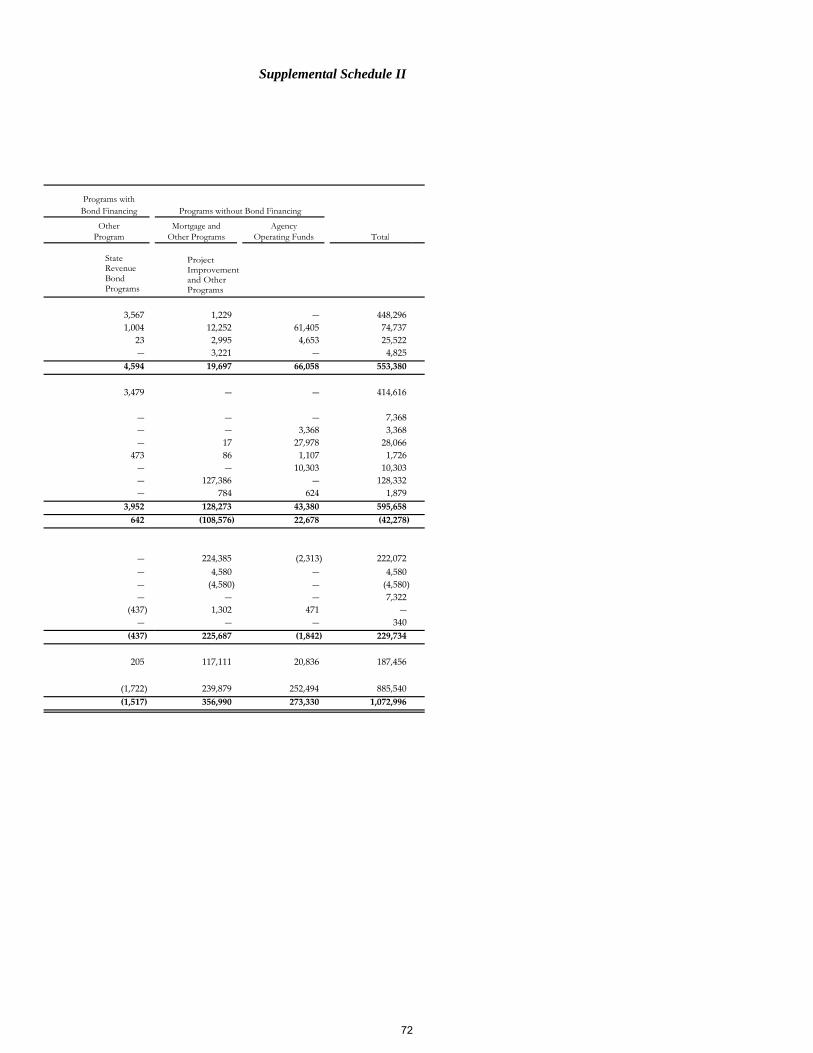
Programs withBond Financing
Other Mortgage and AgencyProgram Other Programs Operating Funds Total
3,567 1,229 — 448,296
1,004 12,252 61,405 74,737
23 2,995 4,653 25,522
— 3,221 — 4,825
4,594 19,697 66,058 553,380
3,479 — — 414,616
— — — 7,368
— — 3,368 3,368
— 17 27,978 28,066
473 86 1,107 1,726
— — 10,303 10,303
— 127,386 — 128,332
— 784 624 1,879
3,952 128,273 43,380 595,658
642 (108,576) 22,678 (42,278)
— 224,385 (2,313) 222,072
— 4,580 — 4,580
— (4,580) — (4,580)
— — — 7,322
(437) 1,302 471 —
— — — 340
(437) 225,687 (1,842) 229,734
205 117,111 20,836 187,456
(1,722) 239,879 252,494 885,540
(1,517) 356,990 273,330 1,072,996
Supplemental Schedule II
Programs without Bond Financing
State Revenue Bond Programs
Project Improvement and Other Programs
72
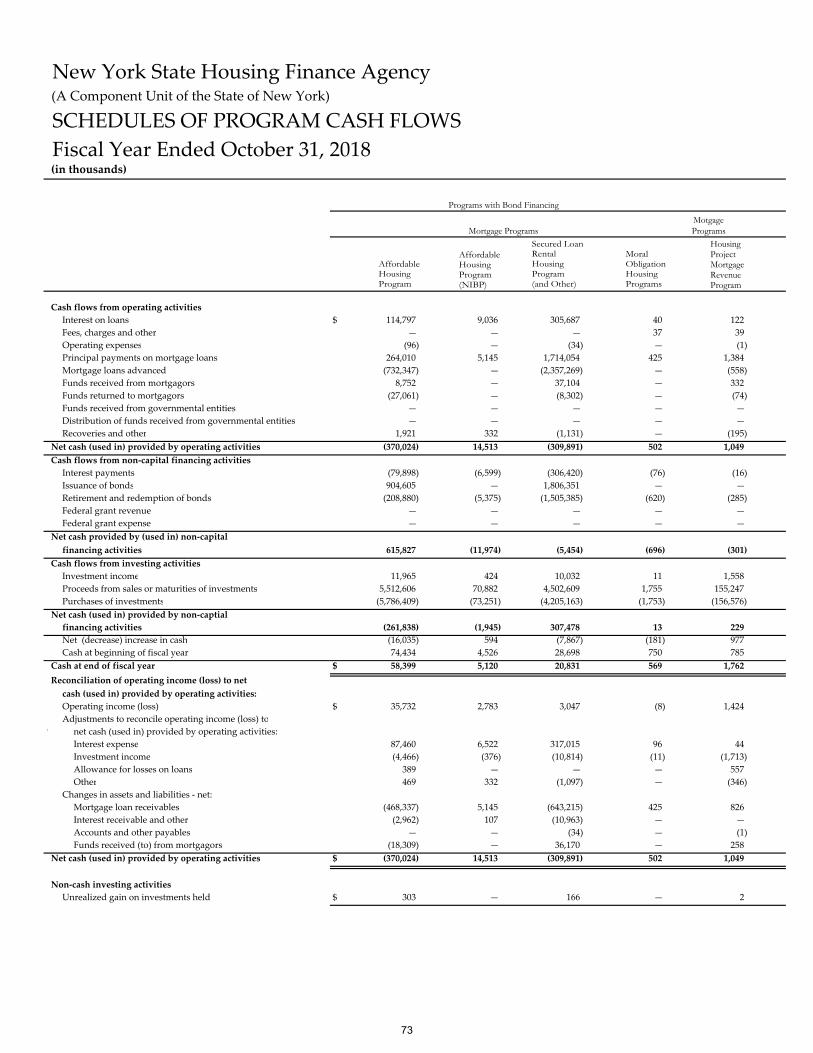
New York State Housing Finance Agency(A Component Unit of the State of New York)
SCHEDULES OF PROGRAM CASH FLOWS
Fiscal Year Ended October 31, 2018(in thousands)
MotgagePrograms
Cash flows from operating activities
Interest on loans $ 114,797 9,036 305,687 40 122
Fees, charges and other — — — 37 39
Operating expenses (96) — (34) — (1)
Principal payments on mortgage loans 264,010 5,145 1,714,054 425 1,384
Mortgage loans advanced (732,347) — (2,357,269) — (558)
Funds received from mortgagors 8,752 — 37,104 — 332
Funds returned to mortgagors (27,061) — (8,302) — (74)
Funds received from governmental entities — — — — —
Distribution of funds received from governmental entities — — — — —
Recoveries and other 1,921 332 (1,131) — (195)
Net cash (used in) provided by operating activities (370,024) 14,513 (309,891) 502 1,049
Cash flows from non‐capital financing activities
Interest payments (79,898) (6,599) (306,420) (76) (16)
Issuance of bonds 904,605 — 1,806,351 — —
Retirement and redemption of bonds (208,880) (5,375) (1,505,385) (620) (285)
Federal grant revenue — — — — —
Federal grant expense — — — — —
Net cash provided by (used in) non‐capital
financing activities 615,827 (11,974) (5,454) (696) (301)
Cash flows from investing activities
Investment income 11,965 424 10,032 11 1,558
Proceeds from sales or maturities of investments 5,512,606 70,882 4,502,609 1,755 155,247
Purchases of investments (5,786,409) (73,251) (4,205,163) (1,753) (156,576)
Net cash (used in) provided by non‐captial
financing activities (261,838) (1,945) 307,478 13 229
Net (decrease) increase in cash (16,035) 594 (7,867) (181) 977
Cash at beginning of fiscal year 74,434 4,526 28,698 750 785
Cash at end of fiscal year $ 58,399 5,120 20,831 569 1,762
Reconciliation of operating income (loss) to net
cash (used in) provided by operating activities:
Operating income (loss) $ 35,732 2,783 3,047 (8) 1,424
Adjustments to reconcile operating income (loss) to
* net cash (used in) provided by operating activities:
Interest expense 87,460 6,522 317,015 96 44
Investment income (4,466) (376) (10,814) (11) (1,713)
Allowance for losses on loans 389 — — — 557
Other 469 332 (1,097) — (346)
Changes in assets and liabilities ‐ net:
Mortgage loan receivables (468,337) 5,145 (643,215) 425 826
Interest receivable and other (2,962) 107 (10,963) — —
Accounts and other payables — — (34) — (1)
Funds received (to) from mortgagors (18,309) — 36,170 — 258
Net cash (used in) provided by operating activities $ (370,024) 14,513 (309,891) 502 1,049
Non‐cash investing activities
Unrealized gain on investments held $ 303 — 166 — 2
Mortgage Programs
Programs with Bond Financing
Affordable Housing Program
Affordable Housing Program (NIBP)
Secured Loan Rental Housing Program (and Other)
Moral Obligation Housing Programs
HousingProject Mortgage Revenue Program
73
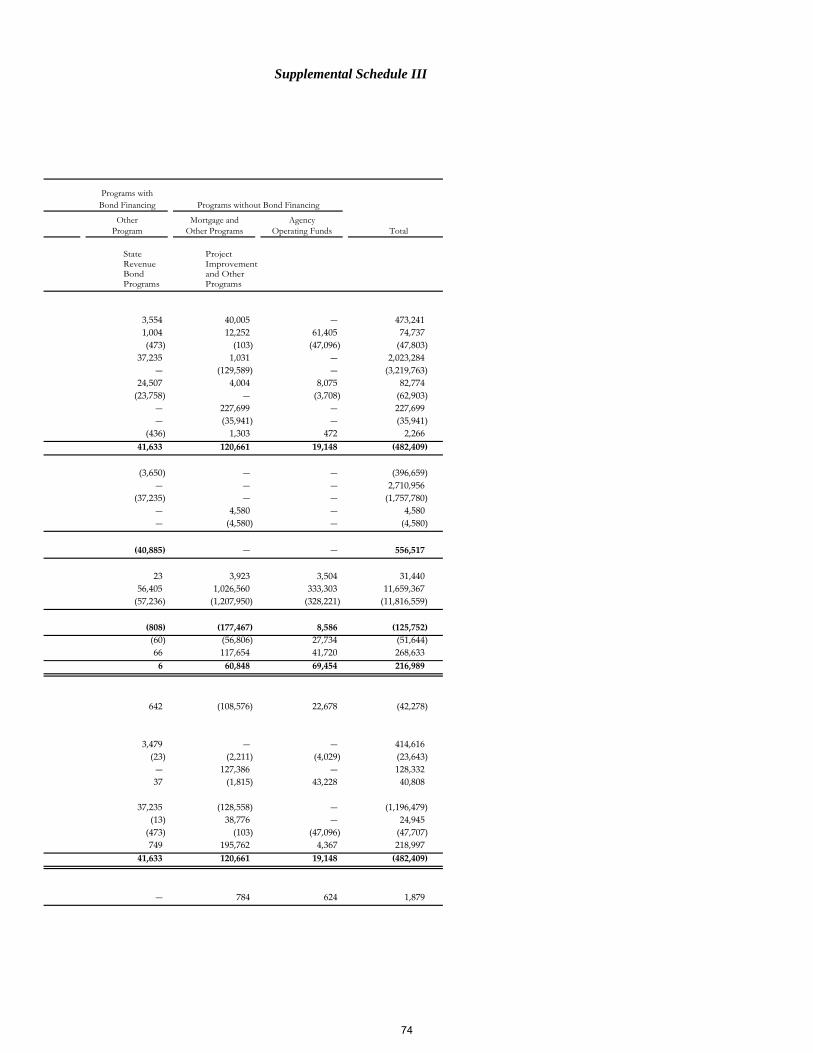
Programs withBond Financing
Other Mortgage and AgencyProgram Other Programs Operating Funds Total
3,554 40,005 — 473,241
1,004 12,252 61,405 74,737
(473) (103) (47,096) (47,803)
37,235 1,031 — 2,023,284
— (129,589) — (3,219,763)
24,507 4,004 8,075 82,774
(23,758) — (3,708) (62,903)
— 227,699 — 227,699
— (35,941) — (35,941)
(436) 1,303 472 2,266
41,633 120,661 19,148 (482,409)
(3,650) — — (396,659)
— — — 2,710,956
(37,235) — — (1,757,780)
— 4,580 — 4,580
— (4,580) — (4,580)
(40,885) — — 556,517
23 3,923 3,504 31,440
56,405 1,026,560 333,303 11,659,367
(57,236) (1,207,950) (328,221) (11,816,559)
(808) (177,467) 8,586 (125,752)
(60) (56,806) 27,734 (51,644)
66 117,654 41,720 268,633
6 60,848 69,454 216,989
642 (108,576) 22,678 (42,278)
3,479 — — 414,616
(23) (2,211) (4,029) (23,643)
— 127,386 — 128,332
37 (1,815) 43,228 40,808
37,235 (128,558) — (1,196,479)
(13) 38,776 — 24,945
(473) (103) (47,096) (47,707)
749 195,762 4,367 218,997
41,633 120,661 19,148 (482,409)
— 784 624 1,879
Supplemental Schedule III
Programs without Bond Financing
State Revenue Bond Programs
Project Improvement and Other Programs
74
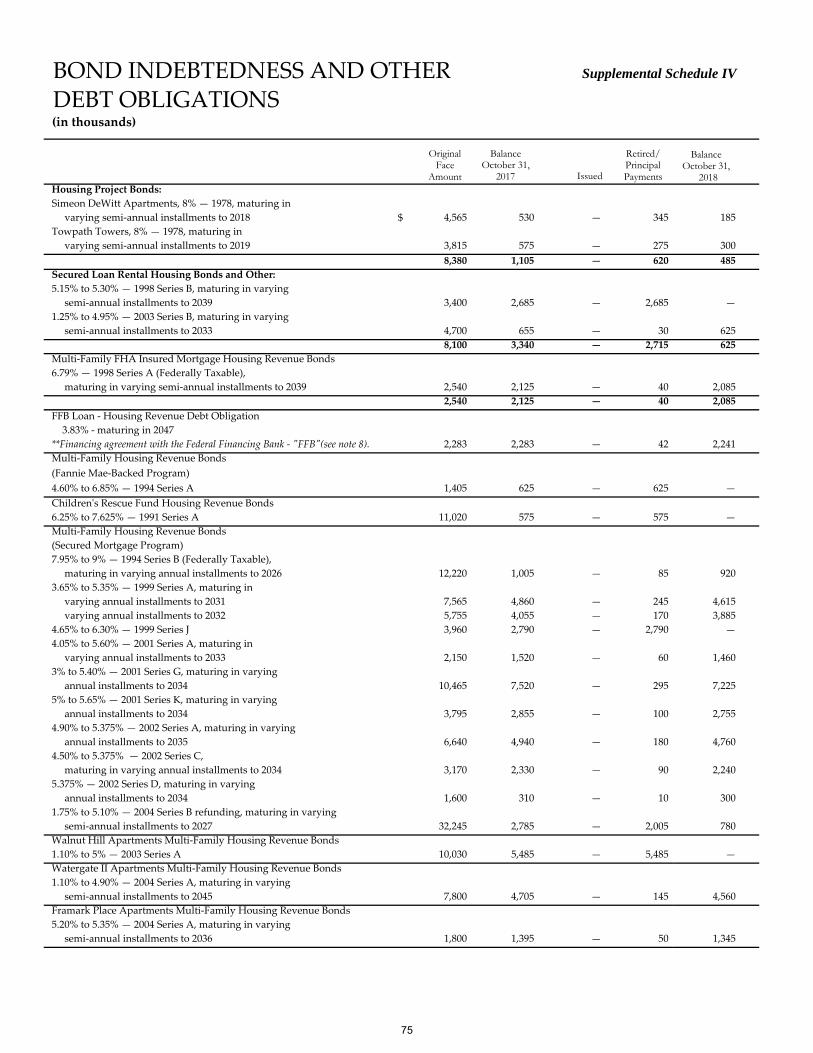
BOND INDEBTEDNESS AND OTHERDEBT OBLIGATIONS(in thousands)
Housing Project Bonds:
Simeon DeWitt Apartments, 8% — 1978, maturing in
varying semi‐annual installments to 2018 $ 4,565 530 — 345 185
Towpath Towers, 8% — 1978, maturing in
varying semi‐annual installments to 2019 3,815 575 — 275 300
8,380 1,105 — 620 485
Secured Loan Rental Housing Bonds and Other:
5.15% to 5.30% — 1998 Series B, maturing in varying
semi‐annual installments to 2039 3,400 2,685 — 2,685 —
1.25% to 4.95% — 2003 Series B, maturing in varying
semi‐annual installments to 2033 4,700 655 — 30 625
8,100 3,340 — 2,715 625
Multi‐Family FHA Insured Mortgage Housing Revenue Bonds
6.79% — 1998 Series A (Federally Taxable),
maturing in varying semi‐annual installments to 2039 2,540 2,125 — 40 2,085
2,540 2,125 — 40 2,085
FFB Loan ‐ Housing Revenue Debt Obligation
3.83% ‐ maturing in 2047
**Financing agreement with the Federal Financing Bank ‐ ʺFFBʺ(see note 8). 2,283 2,283 — 42 2,241
Multi‐Family Housing Revenue Bonds
(Fannie Mae‐Backed Program)
4.60% to 6.85% — 1994 Series A 1,405 625 — 625 —
Childrenʹs Rescue Fund Housing Revenue Bonds
6.25% to 7.625% — 1991 Series A 11,020 575 — 575 —
Multi‐Family Housing Revenue Bonds
(Secured Mortgage Program)
7.95% to 9% — 1994 Series B (Federally Taxable),
maturing in varying annual installments to 2026 12,220 1,005 — 85 920
3.65% to 5.35% — 1999 Series A, maturing in
varying annual installments to 2031 7,565 4,860 — 245 4,615
varying annual installments to 2032 5,755 4,055 — 170 3,885
4.65% to 6.30% — 1999 Series J 3,960 2,790 — 2,790 —
4.05% to 5.60% — 2001 Series A, maturing in
varying annual installments to 2033 2,150 1,520 — 60 1,460
3% to 5.40% — 2001 Series G, maturing in varying
annual installments to 2034 10,465 7,520 — 295 7,225
5% to 5.65% — 2001 Series K, maturing in varying
annual installments to 2034 3,795 2,855 — 100 2,755
4.90% to 5.375% — 2002 Series A, maturing in varying
annual installments to 2035 6,640 4,940 — 180 4,760
4.50% to 5.375% — 2002 Series C,
maturing in varying annual installments to 2034 3,170 2,330 — 90 2,240
5.375% — 2002 Series D, maturing in varying
annual installments to 2034 1,600 310 — 10 300
1.75% to 5.10% — 2004 Series B refunding, maturing in varying
semi‐annual installments to 2027 32,245 2,785 — 2,005 780
Walnut Hill Apartments Multi‐Family Housing Revenue Bonds
1.10% to 5% — 2003 Series A 10,030 5,485 — 5,485 —
Watergate II Apartments Multi‐Family Housing Revenue Bonds
1.10% to 4.90% — 2004 Series A, maturing in varying
semi‐annual installments to 2045 7,800 4,705 — 145 4,560
Framark Place Apartments Multi‐Family Housing Revenue Bonds
5.20% to 5.35% — 2004 Series A, maturing in varying
semi‐annual installments to 2036 1,800 1,395 — 50 1,345
Supplemental Schedule IV
OriginalFace
Amount
Retired/Principal Payments Issued
Balance October 31,
2017
BalanceOctober 31, 2018
75
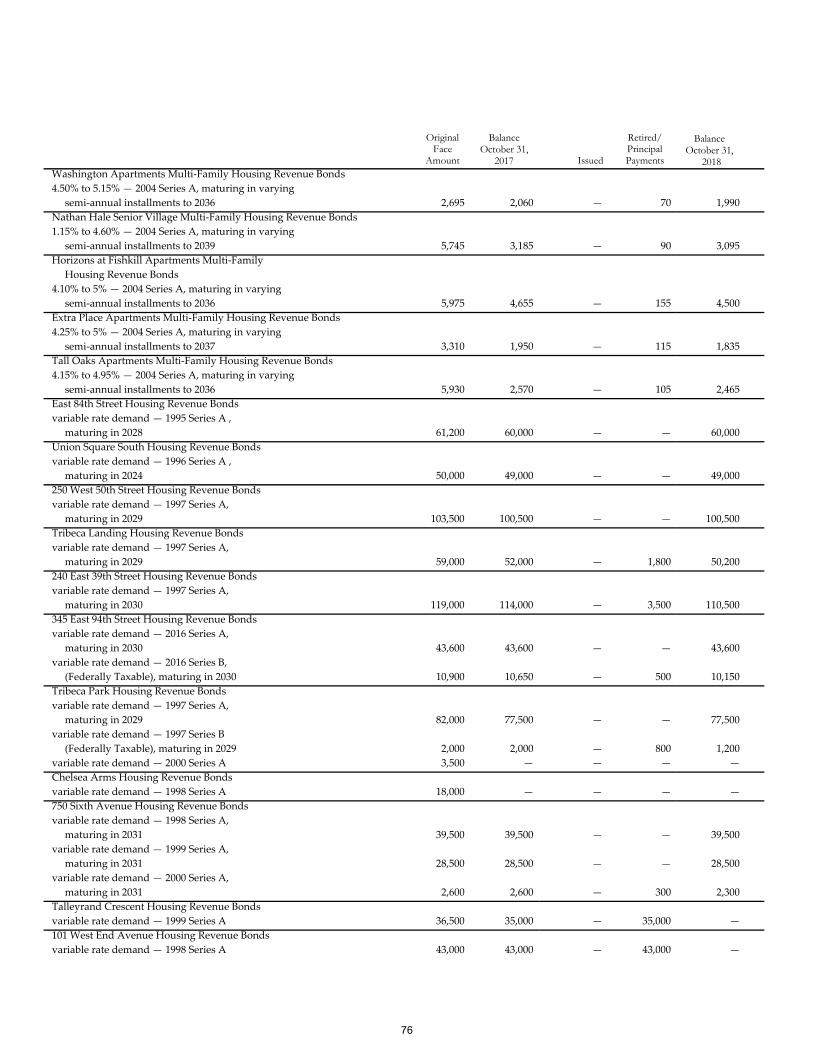
Washington Apartments Multi‐Family Housing Revenue Bonds
4.50% to 5.15% — 2004 Series A, maturing in varying
semi‐annual installments to 2036 2,695 2,060 — 70 1,990
Nathan Hale Senior Village Multi‐Family Housing Revenue Bonds
1.15% to 4.60% — 2004 Series A, maturing in varying
semi‐annual installments to 2039 5,745 3,185 — 90 3,095
Horizons at Fishkill Apartments Multi‐Family
Housing Revenue Bonds
4.10% to 5% — 2004 Series A, maturing in varying
semi‐annual installments to 2036 5,975 4,655 — 155 4,500
Extra Place Apartments Multi‐Family Housing Revenue Bonds
4.25% to 5% — 2004 Series A, maturing in varying
semi‐annual installments to 2037 3,310 1,950 — 115 1,835
Tall Oaks Apartments Multi‐Family Housing Revenue Bonds
4.15% to 4.95% — 2004 Series A, maturing in varying
semi‐annual installments to 2036 5,930 2,570 — 105 2,465
East 84th Street Housing Revenue Bonds
variable rate demand — 1995 Series A ,
maturing in 2028 61,200 60,000 — — 60,000
Union Square South Housing Revenue Bonds
variable rate demand — 1996 Series A ,
maturing in 2024 50,000 49,000 — — 49,000
250 West 50th Street Housing Revenue Bonds
variable rate demand — 1997 Series A,
maturing in 2029 103,500 100,500 — — 100,500
Tribeca Landing Housing Revenue Bonds
variable rate demand — 1997 Series A,
maturing in 2029 59,000 52,000 — 1,800 50,200
240 East 39th Street Housing Revenue Bonds
variable rate demand — 1997 Series A,
maturing in 2030 119,000 114,000 — 3,500 110,500
345 East 94th Street Housing Revenue Bonds
variable rate demand — 2016 Series A,
maturing in 2030 43,600 43,600 — — 43,600
variable rate demand — 2016 Series B,
(Federally Taxable), maturing in 2030 10,900 10,650 — 500 10,150
Tribeca Park Housing Revenue Bonds
variable rate demand — 1997 Series A,
maturing in 2029 82,000 77,500 — — 77,500
variable rate demand — 1997 Series B
(Federally Taxable), maturing in 2029 2,000 2,000 — 800 1,200
variable rate demand — 2000 Series A 3,500 — — — —
Chelsea Arms Housing Revenue Bonds
variable rate demand — 1998 Series A 18,000 — — — —
750 Sixth Avenue Housing Revenue Bonds
variable rate demand — 1998 Series A,
maturing in 2031 39,500 39,500 — — 39,500
variable rate demand — 1999 Series A,
maturing in 2031 28,500 28,500 — — 28,500
variable rate demand — 2000 Series A,
maturing in 2031 2,600 2,600 — 300 2,300
Talleyrand Crescent Housing Revenue Bonds
variable rate demand — 1999 Series A 36,500 35,000 — 35,000 —
101 West End Avenue Housing Revenue Bonds
variable rate demand — 1998 Series A 43,000 43,000 — 43,000 —
Original Face
Amount
Retired/ Principal Payments Issued
Balance October 31,
2017
Balance October 31, 2018
76
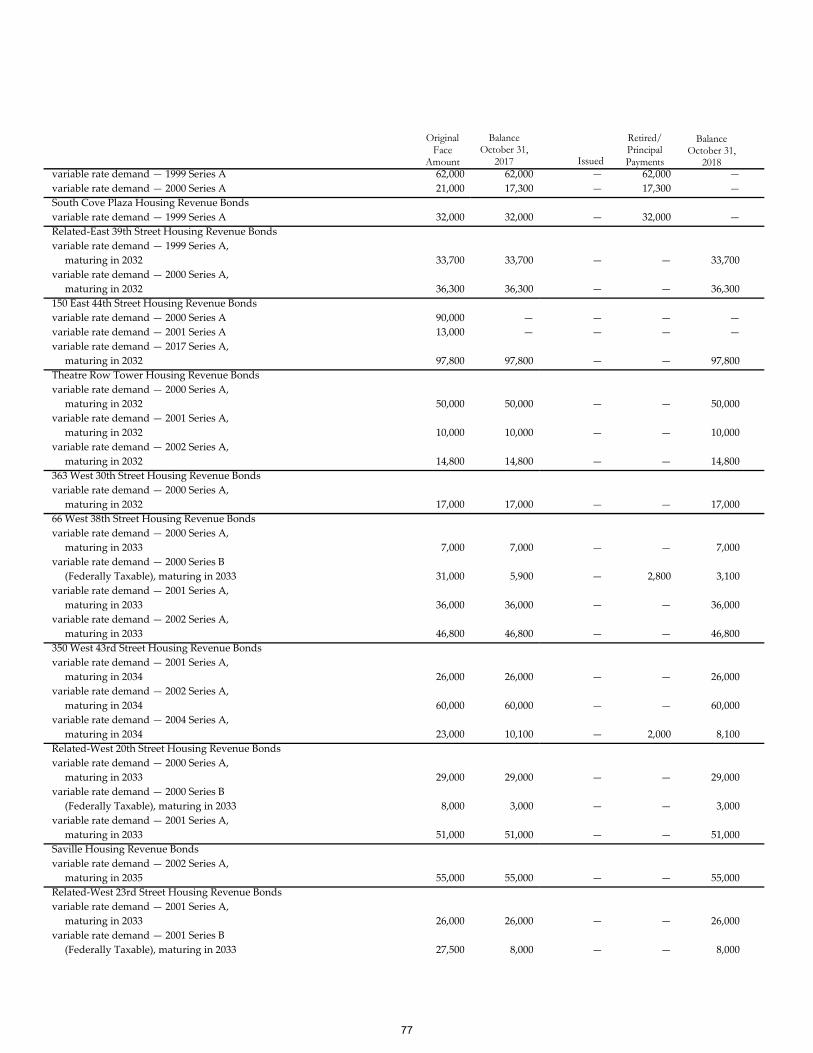
variable rate demand — 1999 Series A 62,000 62,000 — 62,000 —
variable rate demand — 2000 Series A 21,000 17,300 — 17,300 —
South Cove Plaza Housing Revenue Bonds
variable rate demand — 1999 Series A 32,000 32,000 — 32,000 —
Related‐East 39th Street Housing Revenue Bonds
variable rate demand — 1999 Series A,
maturing in 2032 33,700 33,700 — — 33,700
variable rate demand — 2000 Series A,
maturing in 2032 36,300 36,300 — — 36,300
150 East 44th Street Housing Revenue Bonds
variable rate demand — 2000 Series A 90,000 — — — —
variable rate demand — 2001 Series A 13,000 — — — —
variable rate demand — 2017 Series A,
maturing in 2032 97,800 97,800 — — 97,800
Theatre Row Tower Housing Revenue Bonds
variable rate demand — 2000 Series A,
maturing in 2032 50,000 50,000 — — 50,000
variable rate demand — 2001 Series A,
maturing in 2032 10,000 10,000 — — 10,000
variable rate demand — 2002 Series A,
maturing in 2032 14,800 14,800 — — 14,800
363 West 30th Street Housing Revenue Bonds
variable rate demand — 2000 Series A,
maturing in 2032 17,000 17,000 — — 17,000
66 West 38th Street Housing Revenue Bonds
variable rate demand — 2000 Series A,
maturing in 2033 7,000 7,000 — — 7,000
variable rate demand — 2000 Series B
(Federally Taxable), maturing in 2033 31,000 5,900 — 2,800 3,100
variable rate demand — 2001 Series A,
maturing in 2033 36,000 36,000 — — 36,000
variable rate demand — 2002 Series A,
maturing in 2033 46,800 46,800 — — 46,800
350 West 43rd Street Housing Revenue Bonds
variable rate demand — 2001 Series A,
maturing in 2034 26,000 26,000 — — 26,000
variable rate demand — 2002 Series A,
maturing in 2034 60,000 60,000 — — 60,000
variable rate demand — 2004 Series A,
maturing in 2034 23,000 10,100 — 2,000 8,100
Related‐West 20th Street Housing Revenue Bonds
variable rate demand — 2000 Series A,
maturing in 2033 29,000 29,000 — — 29,000
variable rate demand — 2000 Series B
(Federally Taxable), maturing in 2033 8,000 3,000 — — 3,000
variable rate demand — 2001 Series A,
maturing in 2033 51,000 51,000 — — 51,000
Saville Housing Revenue Bonds
variable rate demand — 2002 Series A,
maturing in 2035 55,000 55,000 — — 55,000
Related‐West 23rd Street Housing Revenue Bonds
variable rate demand — 2001 Series A,
maturing in 2033 26,000 26,000 — — 26,000
variable rate demand — 2001 Series B
(Federally Taxable), maturing in 2033 27,500 8,000 — — 8,000
Original Face
Amount
Retired/ Principal Payments Issued
Balance October 31,
2017
Balance October 31, 2018
77
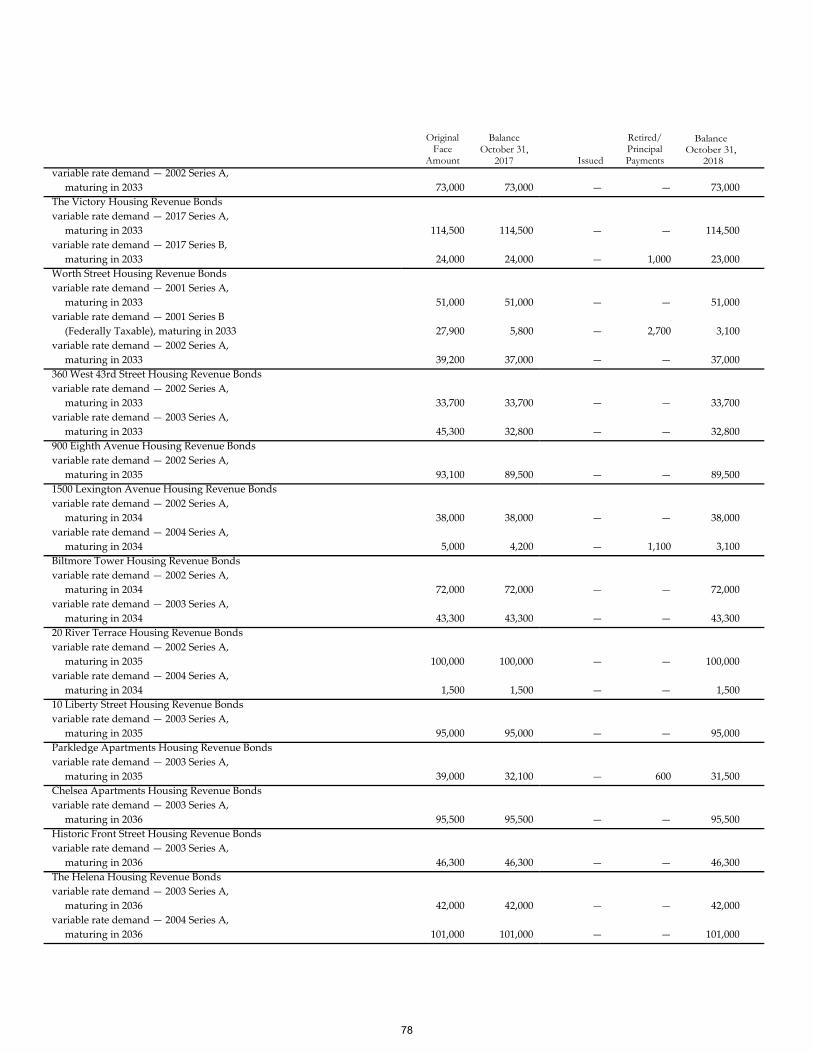
variable rate demand — 2002 Series A,
maturing in 2033 73,000 73,000 — — 73,000
The Victory Housing Revenue Bonds
variable rate demand — 2017 Series A,
maturing in 2033 114,500 114,500 — — 114,500
variable rate demand — 2017 Series B,
maturing in 2033 24,000 24,000 — 1,000 23,000
Worth Street Housing Revenue Bonds
variable rate demand — 2001 Series A,
maturing in 2033 51,000 51,000 — — 51,000
variable rate demand — 2001 Series B
(Federally Taxable), maturing in 2033 27,900 5,800 — 2,700 3,100
variable rate demand — 2002 Series A,
maturing in 2033 39,200 37,000 — — 37,000
360 West 43rd Street Housing Revenue Bonds
variable rate demand — 2002 Series A,
maturing in 2033 33,700 33,700 — — 33,700
variable rate demand — 2003 Series A,
maturing in 2033 45,300 32,800 — — 32,800
900 Eighth Avenue Housing Revenue Bonds
variable rate demand — 2002 Series A,
maturing in 2035 93,100 89,500 — — 89,500
1500 Lexington Avenue Housing Revenue Bonds
variable rate demand — 2002 Series A,
maturing in 2034 38,000 38,000 — — 38,000
variable rate demand — 2004 Series A,
maturing in 2034 5,000 4,200 — 1,100 3,100
Biltmore Tower Housing Revenue Bonds
variable rate demand — 2002 Series A,
maturing in 2034 72,000 72,000 — — 72,000
variable rate demand — 2003 Series A,
maturing in 2034 43,300 43,300 — — 43,300
20 River Terrace Housing Revenue Bonds
variable rate demand — 2002 Series A,
maturing in 2035 100,000 100,000 — — 100,000
variable rate demand — 2004 Series A,
maturing in 2034 1,500 1,500 — — 1,500
10 Liberty Street Housing Revenue Bonds
variable rate demand — 2003 Series A,
maturing in 2035 95,000 95,000 — — 95,000
Parkledge Apartments Housing Revenue Bonds
variable rate demand — 2003 Series A,
maturing in 2035 39,000 32,100 — 600 31,500
Chelsea Apartments Housing Revenue Bonds
variable rate demand — 2003 Series A,
maturing in 2036 95,500 95,500 — — 95,500
Historic Front Street Housing Revenue Bonds
variable rate demand — 2003 Series A,
maturing in 2036 46,300 46,300 — — 46,300
The Helena Housing Revenue Bonds
variable rate demand — 2003 Series A,
maturing in 2036 42,000 42,000 — — 42,000
variable rate demand — 2004 Series A,
maturing in 2036 101,000 101,000 — — 101,000
Original Face
Amount
Retired/ Principal Payments
Balance October 31,
2017
BalanceOctober 31, 2018
Issued
78
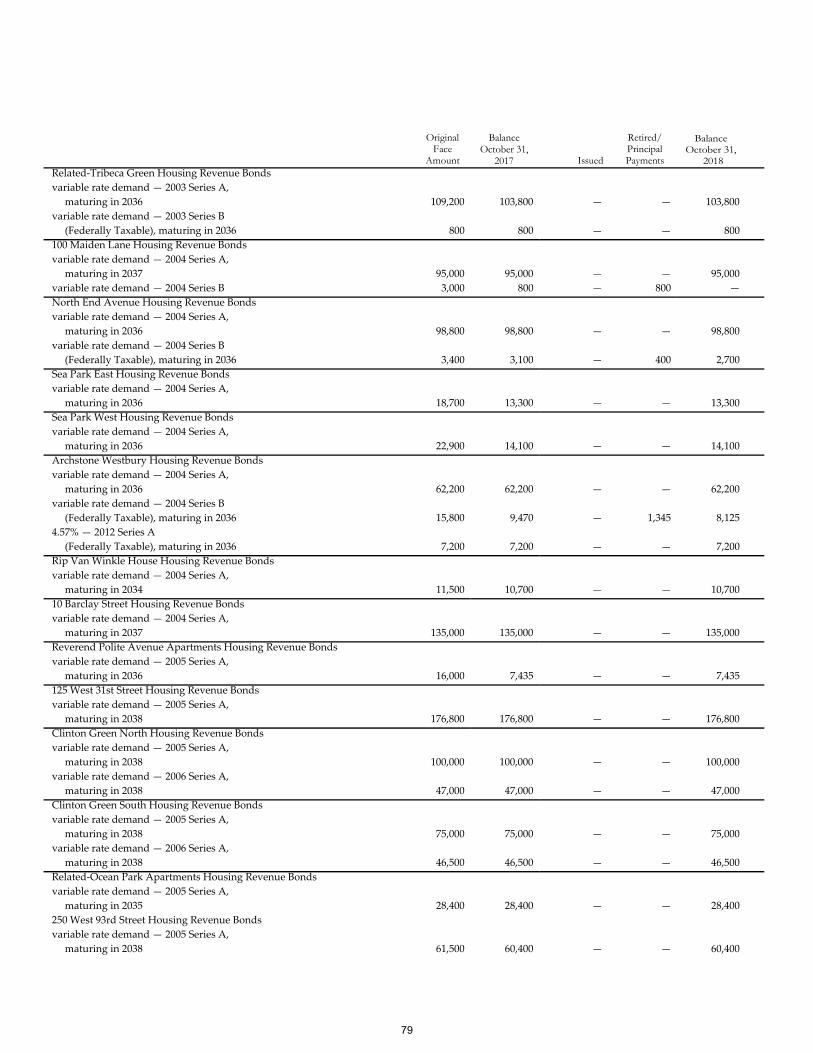
Related‐Tribeca Green Housing Revenue Bonds
variable rate demand — 2003 Series A,
maturing in 2036 109,200 103,800 — — 103,800
variable rate demand — 2003 Series B
(Federally Taxable), maturing in 2036 800 800 — — 800
100 Maiden Lane Housing Revenue Bonds
variable rate demand — 2004 Series A,
maturing in 2037 95,000 95,000 — — 95,000
variable rate demand — 2004 Series B 3,000 800 — 800 —
North End Avenue Housing Revenue Bonds
variable rate demand — 2004 Series A,
maturing in 2036 98,800 98,800 — — 98,800
variable rate demand — 2004 Series B
(Federally Taxable), maturing in 2036 3,400 3,100 — 400 2,700
Sea Park East Housing Revenue Bonds
variable rate demand — 2004 Series A,
maturing in 2036 18,700 13,300 — — 13,300
Sea Park West Housing Revenue Bonds
variable rate demand — 2004 Series A,
maturing in 2036 22,900 14,100 — — 14,100
Archstone Westbury Housing Revenue Bonds
variable rate demand — 2004 Series A,
maturing in 2036 62,200 62,200 — — 62,200
variable rate demand — 2004 Series B
(Federally Taxable), maturing in 2036 15,800 9,470 — 1,345 8,125
4.57% — 2012 Series A
(Federally Taxable), maturing in 2036 7,200 7,200 — — 7,200
Rip Van Winkle House Housing Revenue Bonds
variable rate demand — 2004 Series A,
maturing in 2034 11,500 10,700 — — 10,700
10 Barclay Street Housing Revenue Bonds
variable rate demand — 2004 Series A,
maturing in 2037 135,000 135,000 — — 135,000
Reverend Polite Avenue Apartments Housing Revenue Bonds
variable rate demand — 2005 Series A,
maturing in 2036 16,000 7,435 — — 7,435
125 West 31st Street Housing Revenue Bonds
variable rate demand — 2005 Series A,
maturing in 2038 176,800 176,800 — — 176,800
Clinton Green North Housing Revenue Bonds
variable rate demand — 2005 Series A,
maturing in 2038 100,000 100,000 — — 100,000
variable rate demand — 2006 Series A,
maturing in 2038 47,000 47,000 — — 47,000
Clinton Green South Housing Revenue Bonds
variable rate demand — 2005 Series A,
maturing in 2038 75,000 75,000 — — 75,000
variable rate demand — 2006 Series A,
maturing in 2038 46,500 46,500 — — 46,500
Related‐Ocean Park Apartments Housing Revenue Bonds
variable rate demand — 2005 Series A,
maturing in 2035 28,400 28,400 — — 28,400
250 West 93rd Street Housing Revenue Bonds
variable rate demand — 2005 Series A,
maturing in 2038 61,500 60,400 — — 60,400
Original Face
Amount
Retired/ Principal Payments
Balance October 31,
2017
BalanceOctober 31, 2018
Issued
79
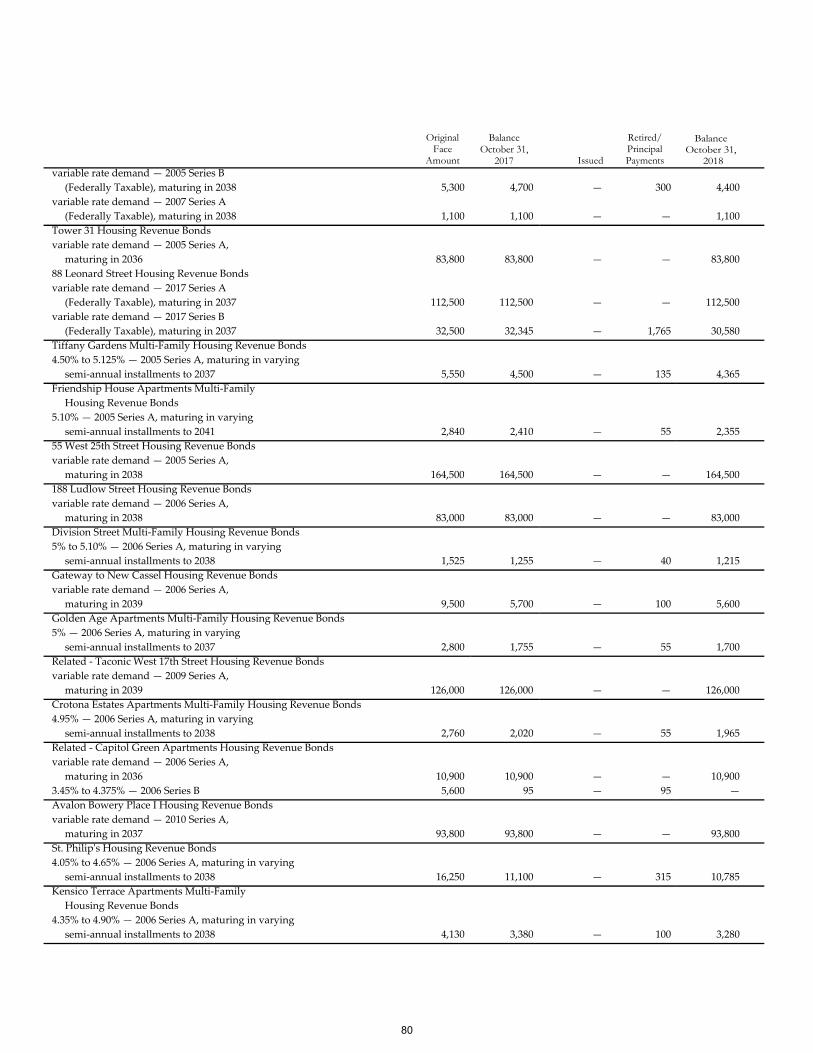
variable rate demand — 2005 Series B
(Federally Taxable), maturing in 2038 5,300 4,700 — 300 4,400
variable rate demand — 2007 Series A
(Federally Taxable), maturing in 2038 1,100 1,100 — — 1,100
Tower 31 Housing Revenue Bonds
variable rate demand — 2005 Series A,
maturing in 2036 83,800 83,800 — — 83,800
88 Leonard Street Housing Revenue Bonds
variable rate demand — 2017 Series A
(Federally Taxable), maturing in 2037 112,500 112,500 — — 112,500
variable rate demand — 2017 Series B
(Federally Taxable), maturing in 2037 32,500 32,345 — 1,765 30,580
Tiffany Gardens Multi‐Family Housing Revenue Bonds
4.50% to 5.125% — 2005 Series A, maturing in varying
semi‐annual installments to 2037 5,550 4,500 — 135 4,365
Friendship House Apartments Multi‐Family
Housing Revenue Bonds
5.10% — 2005 Series A, maturing in varying
semi‐annual installments to 2041 2,840 2,410 — 55 2,355
55 West 25th Street Housing Revenue Bonds
variable rate demand — 2005 Series A,
maturing in 2038 164,500 164,500 — — 164,500
188 Ludlow Street Housing Revenue Bonds
variable rate demand — 2006 Series A,
maturing in 2038 83,000 83,000 — — 83,000
Division Street Multi‐Family Housing Revenue Bonds
5% to 5.10% — 2006 Series A, maturing in varying
semi‐annual installments to 2038 1,525 1,255 — 40 1,215
Gateway to New Cassel Housing Revenue Bonds
variable rate demand — 2006 Series A,
maturing in 2039 9,500 5,700 — 100 5,600
Golden Age Apartments Multi‐Family Housing Revenue Bonds
5% — 2006 Series A, maturing in varying
semi‐annual installments to 2037 2,800 1,755 — 55 1,700
Related ‐ Taconic West 17th Street Housing Revenue Bonds
variable rate demand — 2009 Series A,
maturing in 2039 126,000 126,000 — — 126,000
Crotona Estates Apartments Multi‐Family Housing Revenue Bonds
4.95% — 2006 Series A, maturing in varying
semi‐annual installments to 2038 2,760 2,020 — 55 1,965
Related ‐ Capitol Green Apartments Housing Revenue Bonds
variable rate demand — 2006 Series A,
maturing in 2036 10,900 10,900 — — 10,900
3.45% to 4.375% — 2006 Series B 5,600 95 — 95 —
Avalon Bowery Place I Housing Revenue Bonds
variable rate demand — 2010 Series A,
maturing in 2037 93,800 93,800 — — 93,800
St. Philipʹs Housing Revenue Bonds
4.05% to 4.65% — 2006 Series A, maturing in varying
semi‐annual installments to 2038 16,250 11,100 — 315 10,785
Kensico Terrace Apartments Multi‐Family
Housing Revenue Bonds
4.35% to 4.90% — 2006 Series A, maturing in varying
semi‐annual installments to 2038 4,130 3,380 — 100 3,280
Original Face
Amount
Retired/ Principal Payments
Balance October 31,
2017
BalanceOctober 31, 2018
Issued
80
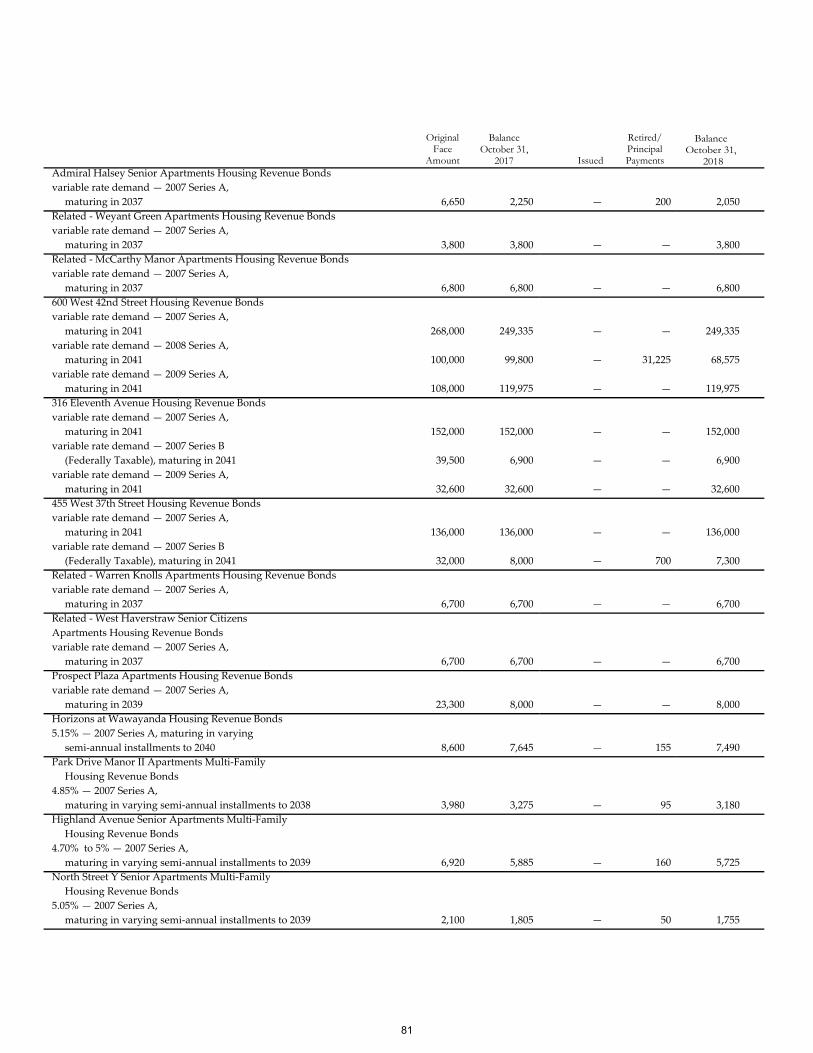
Admiral Halsey Senior Apartments Housing Revenue Bonds
variable rate demand — 2007 Series A,
maturing in 2037 6,650 2,250 — 200 2,050
Related ‐ Weyant Green Apartments Housing Revenue Bonds
variable rate demand — 2007 Series A,
maturing in 2037 3,800 3,800 — — 3,800
Related ‐ McCarthy Manor Apartments Housing Revenue Bonds
variable rate demand — 2007 Series A,
maturing in 2037 6,800 6,800 — — 6,800
600 West 42nd Street Housing Revenue Bonds
variable rate demand — 2007 Series A,
maturing in 2041 268,000 249,335 — — 249,335
variable rate demand — 2008 Series A,
maturing in 2041 100,000 99,800 — 31,225 68,575
variable rate demand — 2009 Series A,
maturing in 2041 108,000 119,975 — — 119,975
316 Eleventh Avenue Housing Revenue Bonds
variable rate demand — 2007 Series A,
maturing in 2041 152,000 152,000 — — 152,000
variable rate demand — 2007 Series B
(Federally Taxable), maturing in 2041 39,500 6,900 — — 6,900
variable rate demand — 2009 Series A,
maturing in 2041 32,600 32,600 — — 32,600
455 West 37th Street Housing Revenue Bonds
variable rate demand — 2007 Series A,
maturing in 2041 136,000 136,000 — — 136,000
variable rate demand — 2007 Series B
(Federally Taxable), maturing in 2041 32,000 8,000 — 700 7,300
Related ‐ Warren Knolls Apartments Housing Revenue Bonds
variable rate demand — 2007 Series A,
maturing in 2037 6,700 6,700 — — 6,700
Related ‐ West Haverstraw Senior Citizens
Apartments Housing Revenue Bonds
variable rate demand — 2007 Series A,
maturing in 2037 6,700 6,700 — — 6,700
Prospect Plaza Apartments Housing Revenue Bonds
variable rate demand — 2007 Series A,
maturing in 2039 23,300 8,000 — — 8,000
Horizons at Wawayanda Housing Revenue Bonds
5.15% — 2007 Series A, maturing in varying
semi‐annual installments to 2040 8,600 7,645 — 155 7,490
Park Drive Manor II Apartments Multi‐Family
Housing Revenue Bonds
4.85% — 2007 Series A,
maturing in varying semi‐annual installments to 2038 3,980 3,275 — 95 3,180
Highland Avenue Senior Apartments Multi‐Family
Housing Revenue Bonds
4.70% to 5% — 2007 Series A,
maturing in varying semi‐annual installments to 2039 6,920 5,885 — 160 5,725
North Street Y Senior Apartments Multi‐Family
Housing Revenue Bonds
5.05% — 2007 Series A,
maturing in varying semi‐annual installments to 2039 2,100 1,805 — 50 1,755
Original Face
Amount
Retired/ Principal Payments
Balance October 31,
2017
Balance October 31, 2018
Issued
81
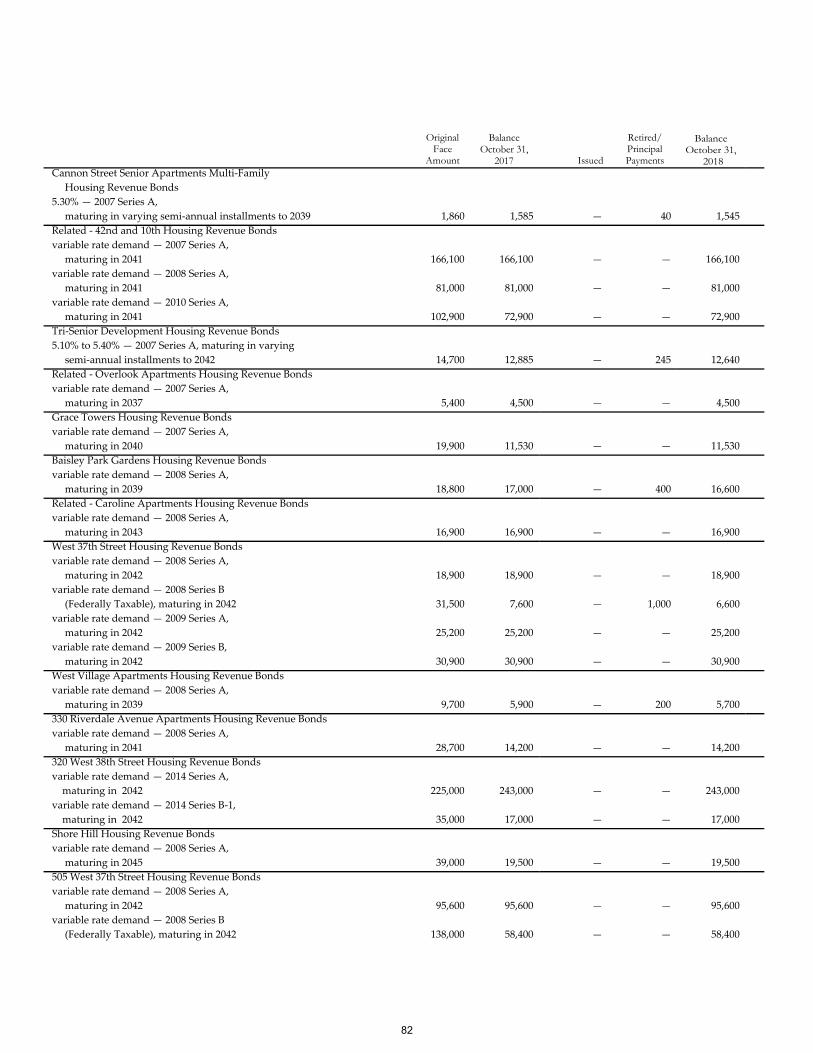
Cannon Street Senior Apartments Multi‐Family
Housing Revenue Bonds
5.30% — 2007 Series A,
maturing in varying semi‐annual installments to 2039 1,860 1,585 — 40 1,545
Related ‐ 42nd and 10th Housing Revenue Bonds
variable rate demand — 2007 Series A,
maturing in 2041 166,100 166,100 — — 166,100
variable rate demand — 2008 Series A,
maturing in 2041 81,000 81,000 — — 81,000
variable rate demand — 2010 Series A,
maturing in 2041 102,900 72,900 — — 72,900
Tri‐Senior Development Housing Revenue Bonds
5.10% to 5.40% — 2007 Series A, maturing in varying
semi‐annual installments to 2042 14,700 12,885 — 245 12,640
Related ‐ Overlook Apartments Housing Revenue Bonds
variable rate demand — 2007 Series A,
maturing in 2037 5,400 4,500 — — 4,500
Grace Towers Housing Revenue Bonds
variable rate demand — 2007 Series A,
maturing in 2040 19,900 11,530 — — 11,530
Baisley Park Gardens Housing Revenue Bonds
variable rate demand — 2008 Series A,
maturing in 2039 18,800 17,000 — 400 16,600
Related ‐ Caroline Apartments Housing Revenue Bonds
variable rate demand — 2008 Series A,
maturing in 2043 16,900 16,900 — — 16,900
West 37th Street Housing Revenue Bonds
variable rate demand — 2008 Series A,
maturing in 2042 18,900 18,900 — — 18,900
variable rate demand — 2008 Series B
(Federally Taxable), maturing in 2042 31,500 7,600 — 1,000 6,600
variable rate demand — 2009 Series A,
maturing in 2042 25,200 25,200 — — 25,200
variable rate demand — 2009 Series B,
maturing in 2042 30,900 30,900 — — 30,900
West Village Apartments Housing Revenue Bonds
variable rate demand — 2008 Series A,
maturing in 2039 9,700 5,900 — 200 5,700
330 Riverdale Avenue Apartments Housing Revenue Bonds
variable rate demand — 2008 Series A,
maturing in 2041 28,700 14,200 — — 14,200
320 West 38th Street Housing Revenue Bonds
variable rate demand — 2014 Series A,
maturing in 2042 225,000 243,000 — — 243,000
variable rate demand — 2014 Series B‐1,
maturing in 2042 35,000 17,000 — — 17,000
Shore Hill Housing Revenue Bonds
variable rate demand — 2008 Series A,
maturing in 2045 39,000 19,500 — — 19,500
505 West 37th Street Housing Revenue Bonds
variable rate demand — 2008 Series A,
maturing in 2042 95,600 95,600 — — 95,600
variable rate demand — 2008 Series B
(Federally Taxable), maturing in 2042 138,000 58,400 — — 58,400
Original Face
Amount
Retired/ Principal Payments
Balance October 31,
2017
Balance October 31, 2018
Issued
82
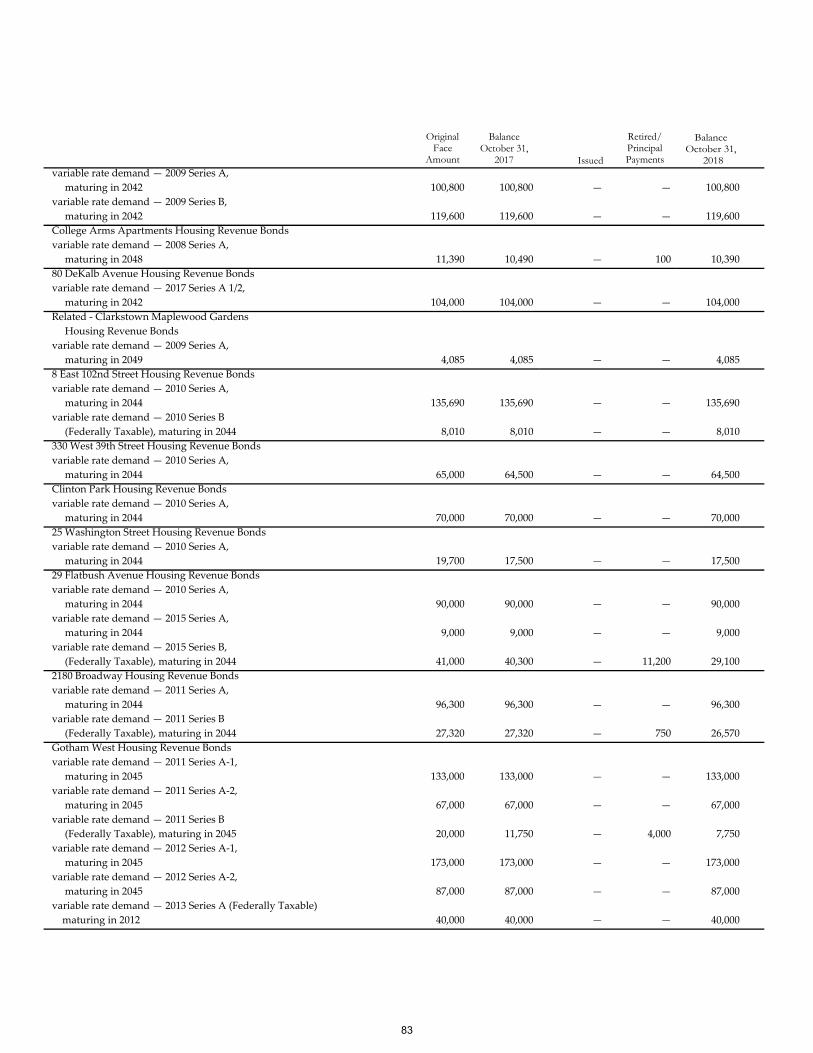
variable rate demand — 2009 Series A,
maturing in 2042 100,800 100,800 — — 100,800
variable rate demand — 2009 Series B,
maturing in 2042 119,600 119,600 — — 119,600
College Arms Apartments Housing Revenue Bonds
variable rate demand — 2008 Series A,
maturing in 2048 11,390 10,490 — 100 10,390
80 DeKalb Avenue Housing Revenue Bonds
variable rate demand — 2017 Series A 1/2,
maturing in 2042 104,000 104,000 — — 104,000
Related ‐ Clarkstown Maplewood Gardens
Housing Revenue Bonds
variable rate demand — 2009 Series A,
maturing in 2049 4,085 4,085 — — 4,085
8 East 102nd Street Housing Revenue Bonds
variable rate demand — 2010 Series A,
maturing in 2044 135,690 135,690 — — 135,690
variable rate demand — 2010 Series B
(Federally Taxable), maturing in 2044 8,010 8,010 — — 8,010
330 West 39th Street Housing Revenue Bonds
variable rate demand — 2010 Series A,
maturing in 2044 65,000 64,500 — — 64,500
Clinton Park Housing Revenue Bonds
variable rate demand — 2010 Series A,
maturing in 2044 70,000 70,000 — — 70,000
25 Washington Street Housing Revenue Bonds
variable rate demand — 2010 Series A,
maturing in 2044 19,700 17,500 — — 17,500
29 Flatbush Avenue Housing Revenue Bonds
variable rate demand — 2010 Series A,
maturing in 2044 90,000 90,000 — — 90,000
variable rate demand — 2015 Series A,
maturing in 2044 9,000 9,000 — — 9,000
variable rate demand — 2015 Series B,
(Federally Taxable), maturing in 2044 41,000 40,300 — 11,200 29,100
2180 Broadway Housing Revenue Bonds
variable rate demand — 2011 Series A,
maturing in 2044 96,300 96,300 — — 96,300
variable rate demand — 2011 Series B
(Federally Taxable), maturing in 2044 27,320 27,320 — 750 26,570
Gotham West Housing Revenue Bonds
variable rate demand — 2011 Series A‐1,
maturing in 2045 133,000 133,000 — — 133,000
variable rate demand — 2011 Series A‐2,
maturing in 2045 67,000 67,000 — — 67,000
variable rate demand — 2011 Series B
(Federally Taxable), maturing in 2045 20,000 11,750 — 4,000 7,750
variable rate demand — 2012 Series A‐1,
maturing in 2045 173,000 173,000 — — 173,000
variable rate demand — 2012 Series A‐2,
maturing in 2045 87,000 87,000 — — 87,000
variable rate demand — 2013 Series A (Federally Taxable)
maturing in 2012 40,000 40,000 — — 40,000
Original Face
Amount
Retired/ Principal Payments
Balance October 31,
2017
Balance October 31, 2018
Issued
83
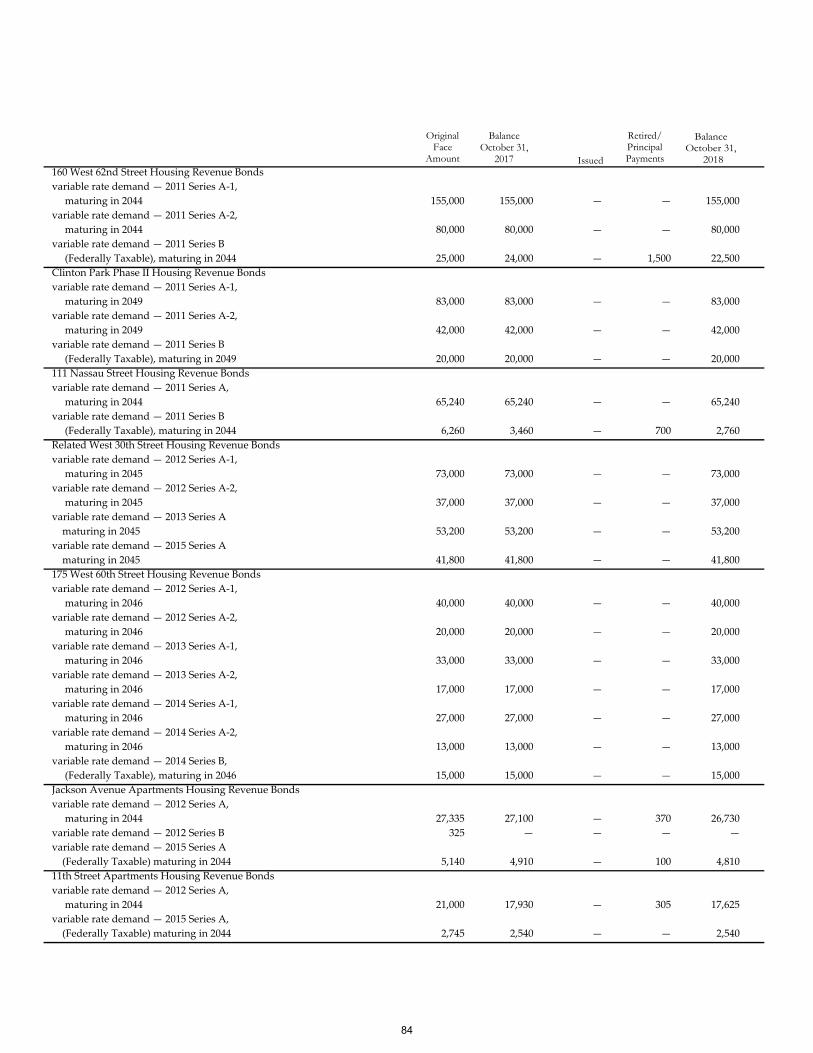
160 West 62nd Street Housing Revenue Bonds
variable rate demand — 2011 Series A‐1,
maturing in 2044 155,000 155,000 — — 155,000
variable rate demand — 2011 Series A‐2,
maturing in 2044 80,000 80,000 — — 80,000
variable rate demand — 2011 Series B
(Federally Taxable), maturing in 2044 25,000 24,000 — 1,500 22,500
Clinton Park Phase II Housing Revenue Bonds
variable rate demand — 2011 Series A‐1,
maturing in 2049 83,000 83,000 — — 83,000
variable rate demand — 2011 Series A‐2,
maturing in 2049 42,000 42,000 — — 42,000
variable rate demand — 2011 Series B
(Federally Taxable), maturing in 2049 20,000 20,000 — — 20,000
111 Nassau Street Housing Revenue Bonds
variable rate demand — 2011 Series A,
maturing in 2044 65,240 65,240 — — 65,240
variable rate demand — 2011 Series B
(Federally Taxable), maturing in 2044 6,260 3,460 — 700 2,760
Related West 30th Street Housing Revenue Bonds
variable rate demand — 2012 Series A‐1,
maturing in 2045 73,000 73,000 — — 73,000
variable rate demand — 2012 Series A‐2,
maturing in 2045 37,000 37,000 — — 37,000
variable rate demand — 2013 Series A
maturing in 2045 53,200 53,200 — — 53,200
variable rate demand — 2015 Series A
maturing in 2045 41,800 41,800 — — 41,800
175 West 60th Street Housing Revenue Bonds
variable rate demand — 2012 Series A‐1,
maturing in 2046 40,000 40,000 — — 40,000
variable rate demand — 2012 Series A‐2,
maturing in 2046 20,000 20,000 — — 20,000
variable rate demand — 2013 Series A‐1,
maturing in 2046 33,000 33,000 — — 33,000
variable rate demand — 2013 Series A‐2,
maturing in 2046 17,000 17,000 — — 17,000
variable rate demand — 2014 Series A‐1,
maturing in 2046 27,000 27,000 — — 27,000
variable rate demand — 2014 Series A‐2,
maturing in 2046 13,000 13,000 — — 13,000
variable rate demand — 2014 Series B,
(Federally Taxable), maturing in 2046 15,000 15,000 — — 15,000
Jackson Avenue Apartments Housing Revenue Bonds
variable rate demand — 2012 Series A,
maturing in 2044 27,335 27,100 — 370 26,730
variable rate demand — 2012 Series B 325 — — — —
variable rate demand — 2015 Series A
(Federally Taxable) maturing in 2044 5,140 4,910 — 100 4,810
11th Street Apartments Housing Revenue Bonds
variable rate demand — 2012 Series A,
maturing in 2044 21,000 17,930 — 305 17,625
variable rate demand — 2015 Series A,
(Federally Taxable) maturing in 2044 2,745 2,540 — — 2,540
Original Face
Amount
Retired/ Principal Payments
Balance October 31,
2017
Balance October 31, 2018
Issued
84
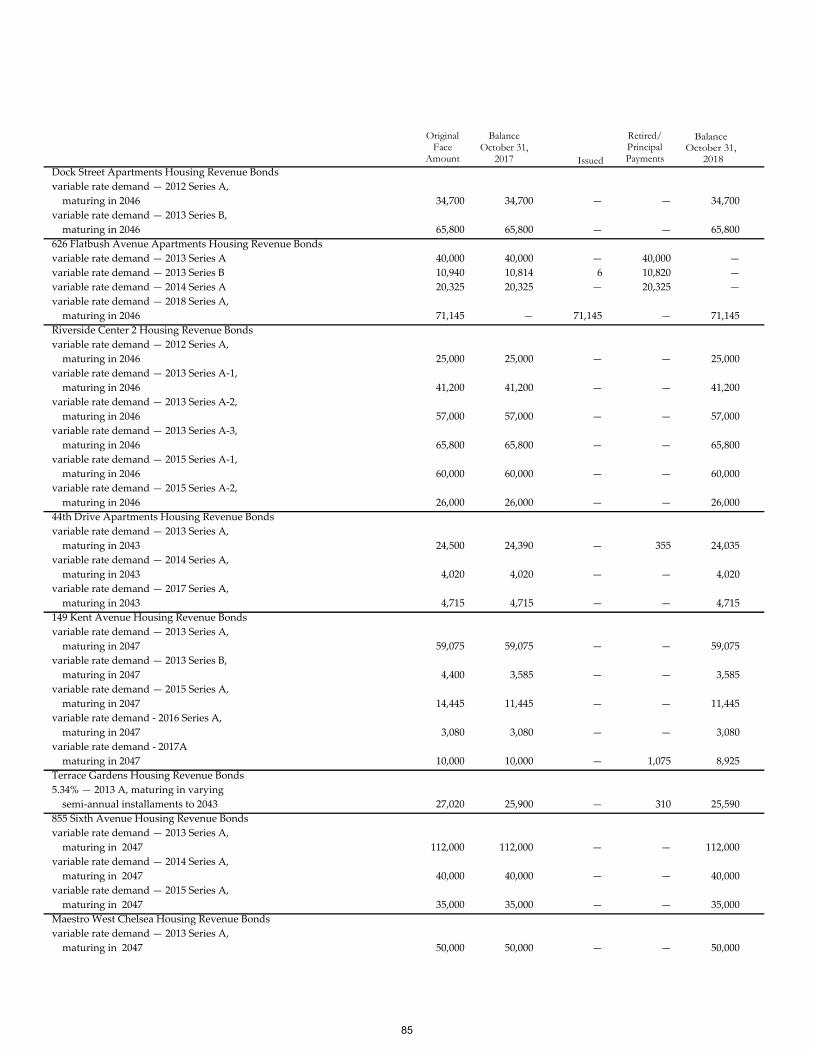
Dock Street Apartments Housing Revenue Bonds
variable rate demand — 2012 Series A,
maturing in 2046 34,700 34,700 — — 34,700
variable rate demand — 2013 Series B,
maturing in 2046 65,800 65,800 — — 65,800
626 Flatbush Avenue Apartments Housing Revenue Bonds
variable rate demand — 2013 Series A 40,000 40,000 — 40,000 —
variable rate demand — 2013 Series B 10,940 10,814 6 10,820 —
variable rate demand — 2014 Series A 20,325 20,325 — 20,325 —
variable rate demand — 2018 Series A,
maturing in 2046 71,145 — 71,145 — 71,145
Riverside Center 2 Housing Revenue Bonds
variable rate demand — 2012 Series A,
maturing in 2046 25,000 25,000 — — 25,000
variable rate demand — 2013 Series A‐1,
maturing in 2046 41,200 41,200 — — 41,200
variable rate demand — 2013 Series A‐2,
maturing in 2046 57,000 57,000 — — 57,000
variable rate demand — 2013 Series A‐3,
maturing in 2046 65,800 65,800 — — 65,800
variable rate demand — 2015 Series A‐1,
maturing in 2046 60,000 60,000 — — 60,000
variable rate demand — 2015 Series A‐2,
maturing in 2046 26,000 26,000 — — 26,000
44th Drive Apartments Housing Revenue Bonds
variable rate demand — 2013 Series A,
maturing in 2043 24,500 24,390 — 355 24,035
variable rate demand — 2014 Series A,
maturing in 2043 4,020 4,020 — — 4,020
variable rate demand — 2017 Series A,
maturing in 2043 4,715 4,715 — — 4,715
149 Kent Avenue Housing Revenue Bonds
variable rate demand — 2013 Series A,
maturing in 2047 59,075 59,075 — — 59,075
variable rate demand — 2013 Series B,
maturing in 2047 4,400 3,585 — — 3,585
variable rate demand — 2015 Series A,
maturing in 2047 14,445 11,445 — — 11,445
variable rate demand ‐ 2016 Series A,
maturing in 2047 3,080 3,080 — — 3,080
variable rate demand ‐ 2017A
maturing in 2047 10,000 10,000 — 1,075 8,925
Terrace Gardens Housing Revenue Bonds
5.34% — 2013 A, maturing in varying
semi‐annual installaments to 2043 27,020 25,900 — 310 25,590
855 Sixth Avenue Housing Revenue Bonds
variable rate demand — 2013 Series A,
maturing in 2047 112,000 112,000 — — 112,000
variable rate demand — 2014 Series A,
maturing in 2047 40,000 40,000 — — 40,000
variable rate demand — 2015 Series A,
maturing in 2047 35,000 35,000 — — 35,000
Maestro West Chelsea Housing Revenue Bonds
variable rate demand — 2013 Series A,
maturing in 2047 50,000 50,000 — — 50,000
Original Face
Amount
Retired/ Principal Payments
Balance October 31,
2017
BalanceOctober 31, 2018
Issued
85
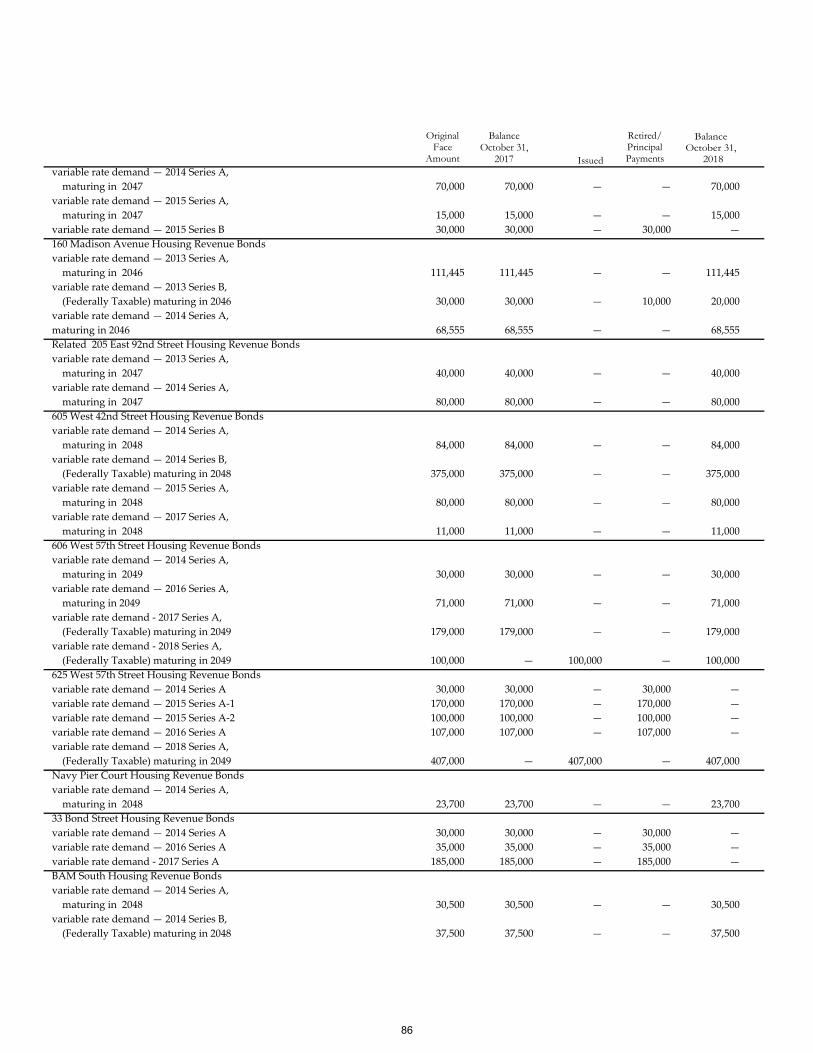
variable rate demand — 2014 Series A,
maturing in 2047 70,000 70,000 — — 70,000
variable rate demand — 2015 Series A,
maturing in 2047 15,000 15,000 — — 15,000
variable rate demand — 2015 Series B 30,000 30,000 — 30,000 —
160 Madison Avenue Housing Revenue Bonds
variable rate demand — 2013 Series A,
maturing in 2046 111,445 111,445 — — 111,445
variable rate demand — 2013 Series B,
(Federally Taxable) maturing in 2046 30,000 30,000 — 10,000 20,000
variable rate demand — 2014 Series A,
maturing in 2046 68,555 68,555 — — 68,555
Related 205 East 92nd Street Housing Revenue Bonds
variable rate demand — 2013 Series A,
maturing in 2047 40,000 40,000 — — 40,000
variable rate demand — 2014 Series A,
maturing in 2047 80,000 80,000 — — 80,000
605 West 42nd Street Housing Revenue Bonds
variable rate demand — 2014 Series A,
maturing in 2048 84,000 84,000 — — 84,000
variable rate demand — 2014 Series B,
(Federally Taxable) maturing in 2048 375,000 375,000 — — 375,000
variable rate demand — 2015 Series A,
maturing in 2048 80,000 80,000 — — 80,000
variable rate demand — 2017 Series A,
maturing in 2048 11,000 11,000 — — 11,000
606 West 57th Street Housing Revenue Bonds
variable rate demand — 2014 Series A,
maturing in 2049 30,000 30,000 — — 30,000
variable rate demand — 2016 Series A,
maturing in 2049 71,000 71,000 — — 71,000
variable rate demand ‐ 2017 Series A,
(Federally Taxable) maturing in 2049 179,000 179,000 — — 179,000
variable rate demand ‐ 2018 Series A,
(Federally Taxable) maturing in 2049 100,000 — 100,000 — 100,000
625 West 57th Street Housing Revenue Bonds
variable rate demand — 2014 Series A 30,000 30,000 — 30,000 —
variable rate demand — 2015 Series A‐1 170,000 170,000 — 170,000 —
variable rate demand — 2015 Series A‐2 100,000 100,000 — 100,000 —
variable rate demand — 2016 Series A 107,000 107,000 — 107,000 —
variable rate demand — 2018 Series A,
(Federally Taxable) maturing in 2049 407,000 — 407,000 — 407,000
Navy Pier Court Housing Revenue Bonds
variable rate demand — 2014 Series A,
maturing in 2048 23,700 23,700 — — 23,700
33 Bond Street Housing Revenue Bonds
variable rate demand — 2014 Series A 30,000 30,000 — 30,000 —
variable rate demand — 2016 Series A 35,000 35,000 — 35,000 —
variable rate demand ‐ 2017 Series A 185,000 185,000 — 185,000 —
BAM South Housing Revenue Bonds
variable rate demand — 2014 Series A,
maturing in 2048 30,500 30,500 — — 30,500
variable rate demand — 2014 Series B,
(Federally Taxable) maturing in 2048 37,500 37,500 — — 37,500
Original Face
Amount
Retired/ Principal Payments
Balance October 31,
2017
BalanceOctober 31, 2018
Issued
86
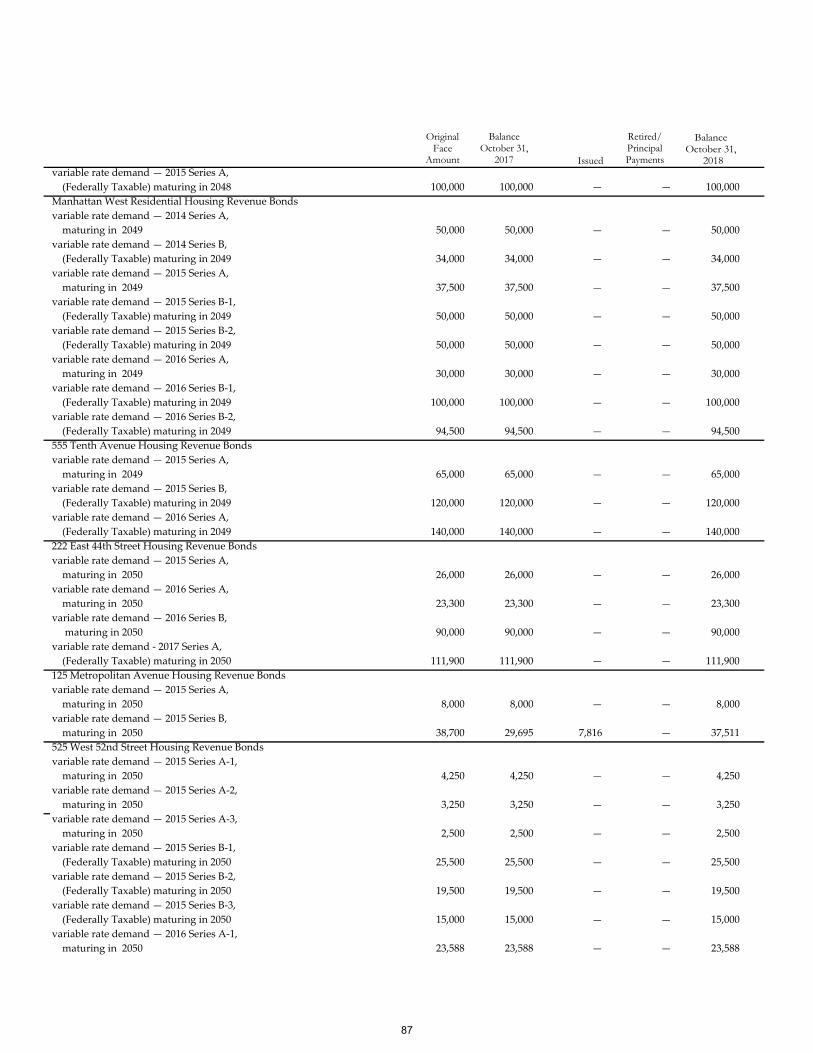
variable rate demand — 2015 Series A,
(Federally Taxable) maturing in 2048 100,000 100,000 — — 100,000
Manhattan West Residential Housing Revenue Bonds
variable rate demand — 2014 Series A,
maturing in 2049 50,000 50,000 — — 50,000
variable rate demand — 2014 Series B,
(Federally Taxable) maturing in 2049 34,000 34,000 — — 34,000
variable rate demand — 2015 Series A,
maturing in 2049 37,500 37,500 — — 37,500
variable rate demand — 2015 Series B‐1,
(Federally Taxable) maturing in 2049 50,000 50,000 — — 50,000
variable rate demand — 2015 Series B‐2,
(Federally Taxable) maturing in 2049 50,000 50,000 — — 50,000
variable rate demand — 2016 Series A,
maturing in 2049 30,000 30,000 — — 30,000
variable rate demand — 2016 Series B‐1,
(Federally Taxable) maturing in 2049 100,000 100,000 — — 100,000
variable rate demand — 2016 Series B‐2,
(Federally Taxable) maturing in 2049 94,500 94,500 — — 94,500
555 Tenth Avenue Housing Revenue Bonds
variable rate demand — 2015 Series A,
maturing in 2049 65,000 65,000 — — 65,000
variable rate demand — 2015 Series B,
(Federally Taxable) maturing in 2049 120,000 120,000 — — 120,000
variable rate demand — 2016 Series A,
(Federally Taxable) maturing in 2049 140,000 140,000 — — 140,000
222 East 44th Street Housing Revenue Bonds
variable rate demand — 2015 Series A,
maturing in 2050 26,000 26,000 — — 26,000
variable rate demand — 2016 Series A,
maturing in 2050 23,300 23,300 — — 23,300
variable rate demand — 2016 Series B,
maturing in 2050 90,000 90,000 — — 90,000
variable rate demand ‐ 2017 Series A,
(Federally Taxable) maturing in 2050 111,900 111,900 — — 111,900
125 Metropolitan Avenue Housing Revenue Bonds
variable rate demand — 2015 Series A,
maturing in 2050 8,000 8,000 — — 8,000
variable rate demand — 2015 Series B,
maturing in 2050 38,700 29,695 7,816 — 37,511
525 West 52nd Street Housing Revenue Bonds
variable rate demand — 2015 Series A‐1,
maturing in 2050 4,250 4,250 — — 4,250
variable rate demand — 2015 Series A‐2,
maturing in 2050 3,250 3,250 — — 3,250
variable rate demand — 2015 Series A‐3,
maturing in 2050 2,500 2,500 — — 2,500
variable rate demand — 2015 Series B‐1,
(Federally Taxable) maturing in 2050 25,500 25,500 — — 25,500
variable rate demand — 2015 Series B‐2,
(Federally Taxable) maturing in 2050 19,500 19,500 — — 19,500
variable rate demand — 2015 Series B‐3,
(Federally Taxable) maturing in 2050 15,000 15,000 — — 15,000
variable rate demand — 2016 Series A‐1,
maturing in 2050 23,588 23,588 — — 23,588
Original Face
Amount
Retired/Principal Payments
BalanceOctober 31,
2017
BalanceOctober 31, 2018
Issued
87
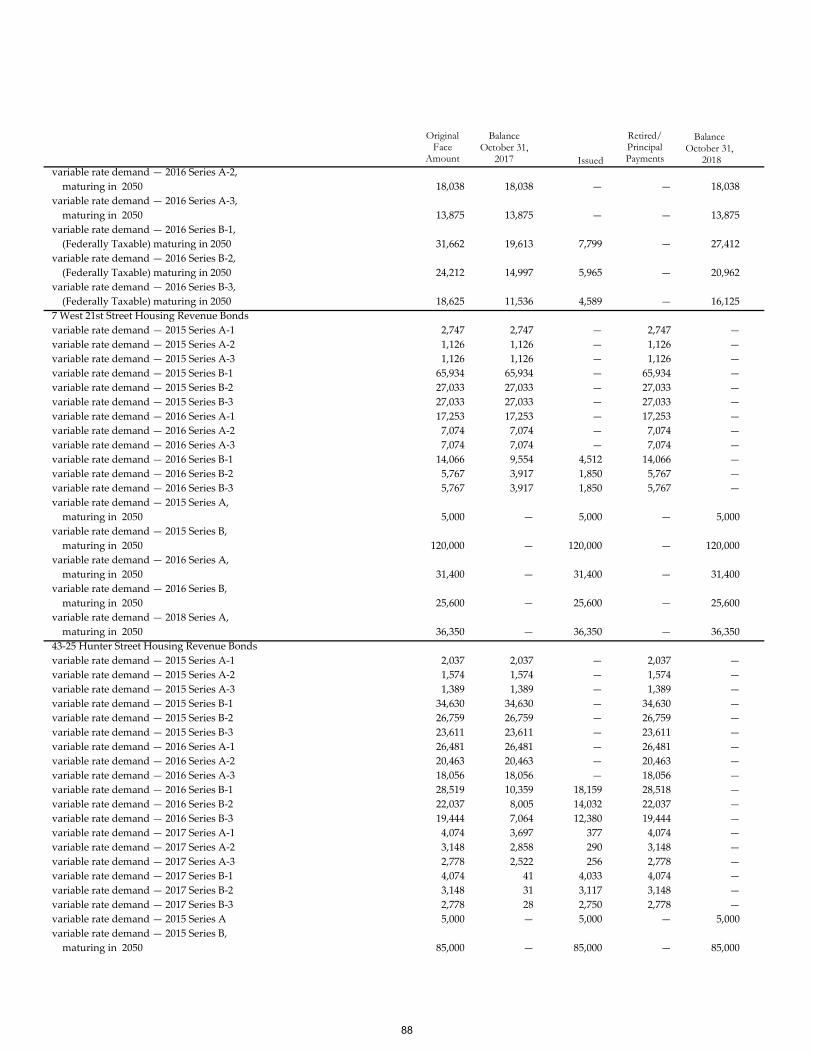
variable rate demand — 2016 Series A‐2,
maturing in 2050 18,038 18,038 — — 18,038
variable rate demand — 2016 Series A‐3,
maturing in 2050 13,875 13,875 — — 13,875
variable rate demand — 2016 Series B‐1,
(Federally Taxable) maturing in 2050 31,662 19,613 7,799 — 27,412
variable rate demand — 2016 Series B‐2,
(Federally Taxable) maturing in 2050 24,212 14,997 5,965 — 20,962
variable rate demand — 2016 Series B‐3,
(Federally Taxable) maturing in 2050 18,625 11,536 4,589 — 16,125
7 West 21st Street Housing Revenue Bonds
variable rate demand — 2015 Series A‐1 2,747 2,747 — 2,747 —
variable rate demand — 2015 Series A‐2 1,126 1,126 — 1,126 —
variable rate demand — 2015 Series A‐3 1,126 1,126 — 1,126 —
variable rate demand — 2015 Series B‐1 65,934 65,934 — 65,934 —
variable rate demand — 2015 Series B‐2 27,033 27,033 — 27,033 —
variable rate demand — 2015 Series B‐3 27,033 27,033 — 27,033 —
variable rate demand — 2016 Series A‐1 17,253 17,253 — 17,253 —
variable rate demand — 2016 Series A‐2 7,074 7,074 — 7,074 —
variable rate demand — 2016 Series A‐3 7,074 7,074 — 7,074 —
variable rate demand — 2016 Series B‐1 14,066 9,554 4,512 14,066 —
variable rate demand — 2016 Series B‐2 5,767 3,917 1,850 5,767 —
variable rate demand — 2016 Series B‐3 5,767 3,917 1,850 5,767 —
variable rate demand — 2015 Series A,
maturing in 2050 5,000 — 5,000 — 5,000
variable rate demand — 2015 Series B,
maturing in 2050 120,000 — 120,000 — 120,000
variable rate demand — 2016 Series A,
maturing in 2050 31,400 — 31,400 — 31,400
variable rate demand — 2016 Series B,
maturing in 2050 25,600 — 25,600 — 25,600
variable rate demand — 2018 Series A,
maturing in 2050 36,350 — 36,350 — 36,350
43‐25 Hunter Street Housing Revenue Bonds
variable rate demand — 2015 Series A‐1 2,037 2,037 — 2,037 —
variable rate demand — 2015 Series A‐2 1,574 1,574 — 1,574 —
variable rate demand — 2015 Series A‐3 1,389 1,389 — 1,389 —
variable rate demand — 2015 Series B‐1 34,630 34,630 — 34,630 —
variable rate demand — 2015 Series B‐2 26,759 26,759 — 26,759 —
variable rate demand — 2015 Series B‐3 23,611 23,611 — 23,611 —
variable rate demand — 2016 Series A‐1 26,481 26,481 — 26,481 —
variable rate demand — 2016 Series A‐2 20,463 20,463 — 20,463 —
variable rate demand — 2016 Series A‐3 18,056 18,056 — 18,056 —
variable rate demand — 2016 Series B‐1 28,519 10,359 18,159 28,518 —
variable rate demand — 2016 Series B‐2 22,037 8,005 14,032 22,037 —
variable rate demand — 2016 Series B‐3 19,444 7,064 12,380 19,444 —
variable rate demand — 2017 Series A‐1 4,074 3,697 377 4,074 —
variable rate demand — 2017 Series A‐2 3,148 2,858 290 3,148 —
variable rate demand — 2017 Series A‐3 2,778 2,522 256 2,778 —
variable rate demand — 2017 Series B‐1 4,074 41 4,033 4,074 —
variable rate demand — 2017 Series B‐2 3,148 31 3,117 3,148 —
variable rate demand — 2017 Series B‐3 2,778 28 2,750 2,778 —
variable rate demand — 2015 Series A 5,000 — 5,000 — 5,000
variable rate demand — 2015 Series B,
maturing in 2050 85,000 — 85,000 — 85,000
Original Face
Amount
Retired/ Principal Payments
Balance October 31,
2017
Balance October 31, 2018
Issued
88
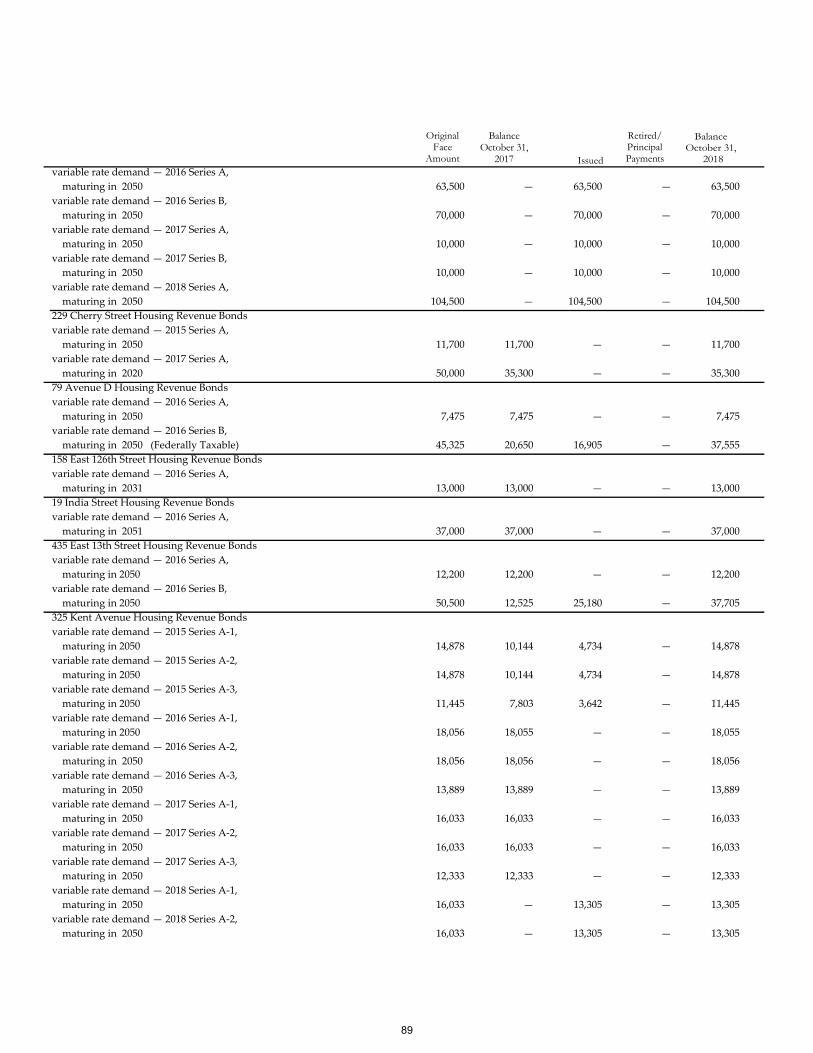
variable rate demand — 2016 Series A,
maturing in 2050 63,500 — 63,500 — 63,500
variable rate demand — 2016 Series B,
maturing in 2050 70,000 — 70,000 — 70,000
variable rate demand — 2017 Series A,
maturing in 2050 10,000 — 10,000 — 10,000
variable rate demand — 2017 Series B,
maturing in 2050 10,000 — 10,000 — 10,000
variable rate demand — 2018 Series A,
maturing in 2050 104,500 — 104,500 — 104,500
229 Cherry Street Housing Revenue Bonds
variable rate demand — 2015 Series A,
maturing in 2050 11,700 11,700 — — 11,700
variable rate demand — 2017 Series A,
maturing in 2020 50,000 35,300 — — 35,300
79 Avenue D Housing Revenue Bonds
variable rate demand — 2016 Series A,
maturing in 2050 7,475 7,475 — — 7,475
variable rate demand — 2016 Series B,
maturing in 2050 (Federally Taxable) 45,325 20,650 16,905 — 37,555
158 East 126th Street Housing Revenue Bonds
variable rate demand — 2016 Series A,
maturing in 2031 13,000 13,000 — — 13,000
19 India Street Housing Revenue Bonds
variable rate demand — 2016 Series A,
maturing in 2051 37,000 37,000 — — 37,000
435 East 13th Street Housing Revenue Bonds
variable rate demand — 2016 Series A,
maturing in 2050 12,200 12,200 — — 12,200
variable rate demand — 2016 Series B,
maturing in 2050 50,500 12,525 25,180 — 37,705
325 Kent Avenue Housing Revenue Bonds
variable rate demand — 2015 Series A‐1,
maturing in 2050 14,878 10,144 4,734 — 14,878
variable rate demand — 2015 Series A‐2,
maturing in 2050 14,878 10,144 4,734 — 14,878
variable rate demand — 2015 Series A‐3,
maturing in 2050 11,445 7,803 3,642 — 11,445
variable rate demand — 2016 Series A‐1,
maturing in 2050 18,056 18,055 — — 18,055
variable rate demand — 2016 Series A‐2,
maturing in 2050 18,056 18,056 — — 18,056
variable rate demand — 2016 Series A‐3,
maturing in 2050 13,889 13,889 — — 13,889
variable rate demand — 2017 Series A‐1,
maturing in 2050 16,033 16,033 — — 16,033
variable rate demand — 2017 Series A‐2,
maturing in 2050 16,033 16,033 — — 16,033
variable rate demand — 2017 Series A‐3,
maturing in 2050 12,333 12,333 — — 12,333
variable rate demand — 2018 Series A‐1,
maturing in 2050 16,033 — 13,305 — 13,305
variable rate demand — 2018 Series A‐2,
maturing in 2050 16,033 — 13,305 — 13,305
Original Face
Amount
Retired/ Principal Payments
Balance October 31,
2017
BalanceOctober 31, 2018
Issued
89
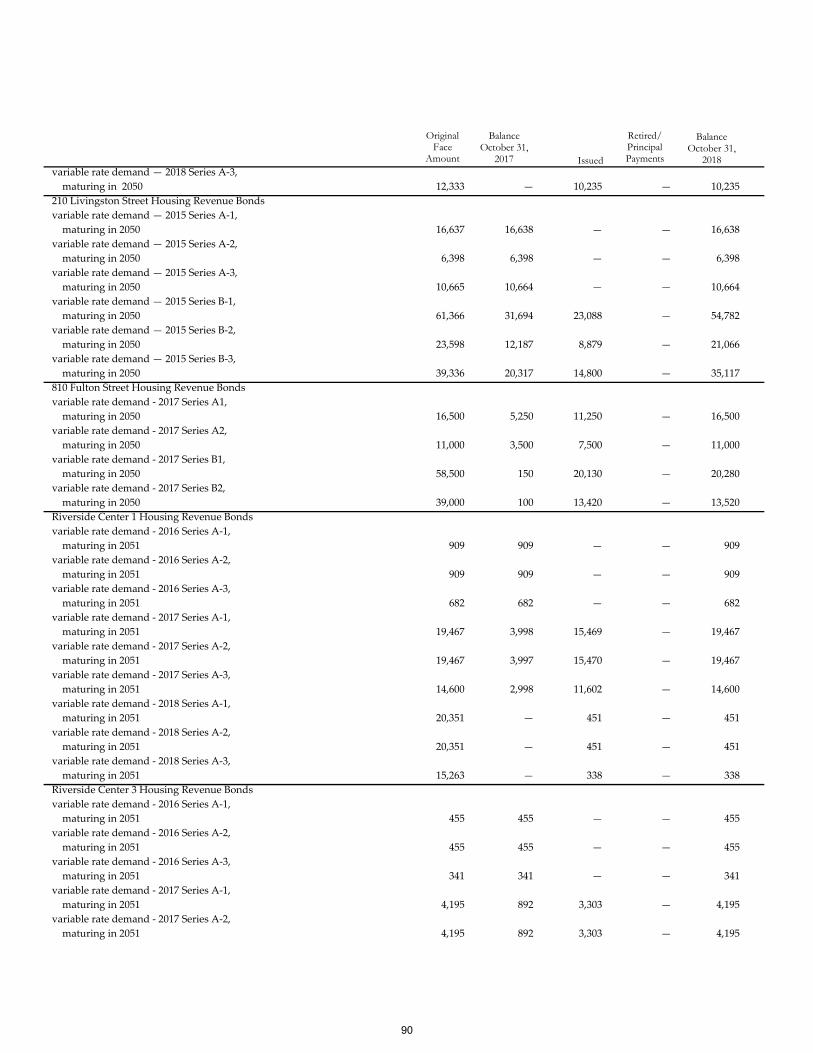
variable rate demand — 2018 Series A‐3,
maturing in 2050 12,333 — 10,235 — 10,235
210 Livingston Street Housing Revenue Bonds
variable rate demand — 2015 Series A‐1,
maturing in 2050 16,637 16,638 — — 16,638
variable rate demand — 2015 Series A‐2,
maturing in 2050 6,398 6,398 — — 6,398
variable rate demand — 2015 Series A‐3,
maturing in 2050 10,665 10,664 — — 10,664
variable rate demand — 2015 Series B‐1,
maturing in 2050 61,366 31,694 23,088 — 54,782
variable rate demand — 2015 Series B‐2,
maturing in 2050 23,598 12,187 8,879 — 21,066
variable rate demand — 2015 Series B‐3,
maturing in 2050 39,336 20,317 14,800 — 35,117
810 Fulton Street Housing Revenue Bonds
variable rate demand ‐ 2017 Series A1,
maturing in 2050 16,500 5,250 11,250 — 16,500
variable rate demand ‐ 2017 Series A2,
maturing in 2050 11,000 3,500 7,500 — 11,000
variable rate demand ‐ 2017 Series B1,
maturing in 2050 58,500 150 20,130 — 20,280
variable rate demand ‐ 2017 Series B2,
maturing in 2050 39,000 100 13,420 — 13,520
Riverside Center 1 Housing Revenue Bonds
variable rate demand ‐ 2016 Series A‐1,
maturing in 2051 909 909 — — 909
variable rate demand ‐ 2016 Series A‐2,
maturing in 2051 909 909 — — 909
variable rate demand ‐ 2016 Series A‐3,
maturing in 2051 682 682 — — 682
variable rate demand ‐ 2017 Series A‐1,
maturing in 2051 19,467 3,998 15,469 — 19,467
variable rate demand ‐ 2017 Series A‐2,
maturing in 2051 19,467 3,997 15,470 — 19,467
variable rate demand ‐ 2017 Series A‐3,
maturing in 2051 14,600 2,998 11,602 — 14,600
variable rate demand ‐ 2018 Series A‐1,
maturing in 2051 20,351 — 451 — 451
variable rate demand ‐ 2018 Series A‐2,
maturing in 2051 20,351 — 451 — 451
variable rate demand ‐ 2018 Series A‐3,
maturing in 2051 15,263 — 338 — 338
Riverside Center 3 Housing Revenue Bonds
variable rate demand ‐ 2016 Series A‐1,
maturing in 2051 455 455 — — 455
variable rate demand ‐ 2016 Series A‐2,
maturing in 2051 455 455 — — 455
variable rate demand ‐ 2016 Series A‐3,
maturing in 2051 341 341 — — 341
variable rate demand ‐ 2017 Series A‐1,
maturing in 2051 4,195 892 3,303 — 4,195
variable rate demand ‐ 2017 Series A‐2,
maturing in 2051 4,195 892 3,303 — 4,195
Original Face
Amount
Retired/ Principal Payments
Balance October 31,
2017
Balance October 31, 2018
Issued
90
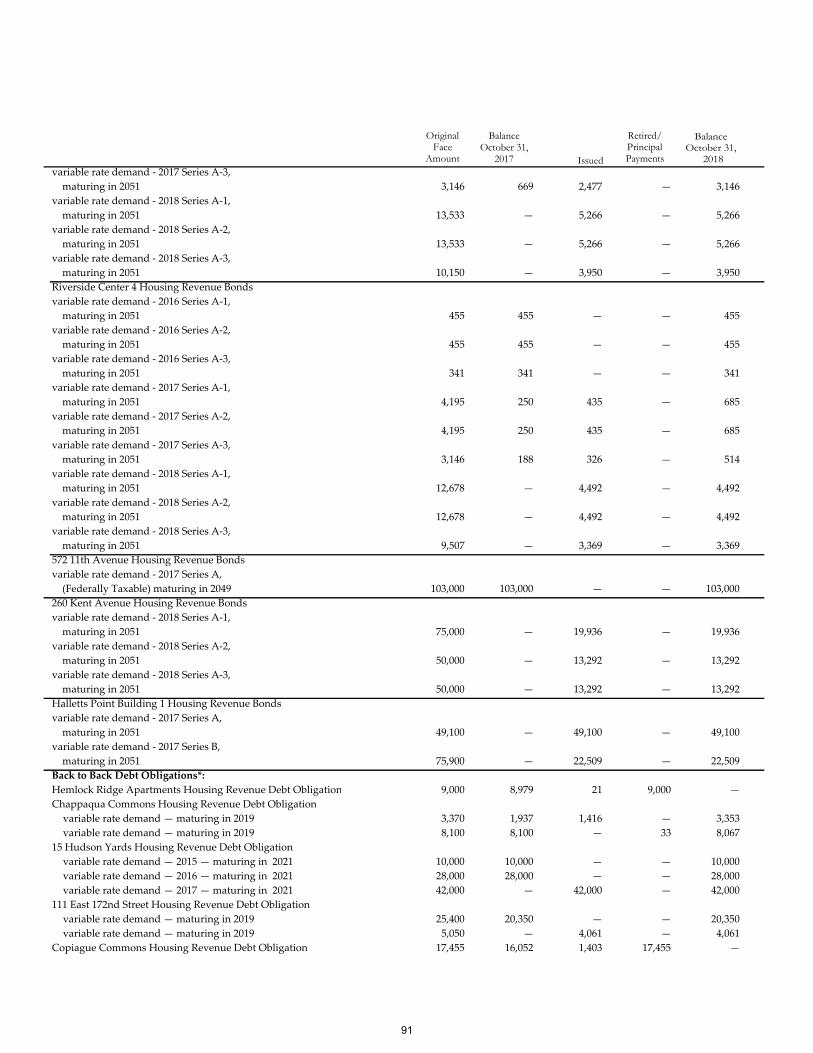
variable rate demand ‐ 2017 Series A‐3,
maturing in 2051 3,146 669 2,477 — 3,146
variable rate demand ‐ 2018 Series A‐1,
maturing in 2051 13,533 — 5,266 — 5,266
variable rate demand ‐ 2018 Series A‐2,
maturing in 2051 13,533 — 5,266 — 5,266
variable rate demand ‐ 2018 Series A‐3,
maturing in 2051 10,150 — 3,950 — 3,950
Riverside Center 4 Housing Revenue Bonds
variable rate demand ‐ 2016 Series A‐1,
maturing in 2051 455 455 — — 455
variable rate demand ‐ 2016 Series A‐2,
maturing in 2051 455 455 — — 455
variable rate demand ‐ 2016 Series A‐3,
maturing in 2051 341 341 — — 341
variable rate demand ‐ 2017 Series A‐1,
maturing in 2051 4,195 250 435 — 685
variable rate demand ‐ 2017 Series A‐2,
maturing in 2051 4,195 250 435 — 685
variable rate demand ‐ 2017 Series A‐3,
maturing in 2051 3,146 188 326 — 514
variable rate demand ‐ 2018 Series A‐1,
maturing in 2051 12,678 — 4,492 — 4,492
variable rate demand ‐ 2018 Series A‐2,
maturing in 2051 12,678 — 4,492 — 4,492
variable rate demand ‐ 2018 Series A‐3,
maturing in 2051 9,507 — 3,369 — 3,369
572 11th Avenue Housing Revenue Bonds
variable rate demand ‐ 2017 Series A,
(Federally Taxable) maturing in 2049 103,000 103,000 — — 103,000
260 Kent Avenue Housing Revenue Bonds
variable rate demand ‐ 2018 Series A‐1,
maturing in 2051 75,000 — 19,936 — 19,936
variable rate demand ‐ 2018 Series A‐2,
maturing in 2051 50,000 — 13,292 — 13,292
variable rate demand ‐ 2018 Series A‐3,
maturing in 2051 50,000 — 13,292 — 13,292
Halletts Point Building 1 Housing Revenue Bonds
variable rate demand ‐ 2017 Series A,
maturing in 2051 49,100 — 49,100 — 49,100
variable rate demand ‐ 2017 Series B,
maturing in 2051 75,900 — 22,509 — 22,509
Back to Back Debt Obligations*:
Hemlock Ridge Apartments Housing Revenue Debt Obligation 9,000 8,979 21 9,000 —
Chappaqua Commons Housing Revenue Debt Obligation
variable rate demand — maturing in 2019 3,370 1,937 1,416 — 3,353
variable rate demand — maturing in 2019 8,100 8,100 — 33 8,067
15 Hudson Yards Housing Revenue Debt Obligation
variable rate demand — 2015 — maturing in 2021 10,000 10,000 — — 10,000
variable rate demand — 2016 — maturing in 2021 28,000 28,000 — — 28,000
variable rate demand — 2017 — maturing in 2021 42,000 — 42,000 — 42,000
111 East 172nd Street Housing Revenue Debt Obligation
variable rate demand — maturing in 2019 25,400 20,350 — — 20,350
variable rate demand — maturing in 2019 5,050 — 4,061 — 4,061
Copiague Commons Housing Revenue Debt Obligation 17,455 16,052 1,403 17,455 —
Original Face
Amount
Retired/ Principal Payments
Balance October 31,
2017
BalanceOctober 31, 2018
Issued
91
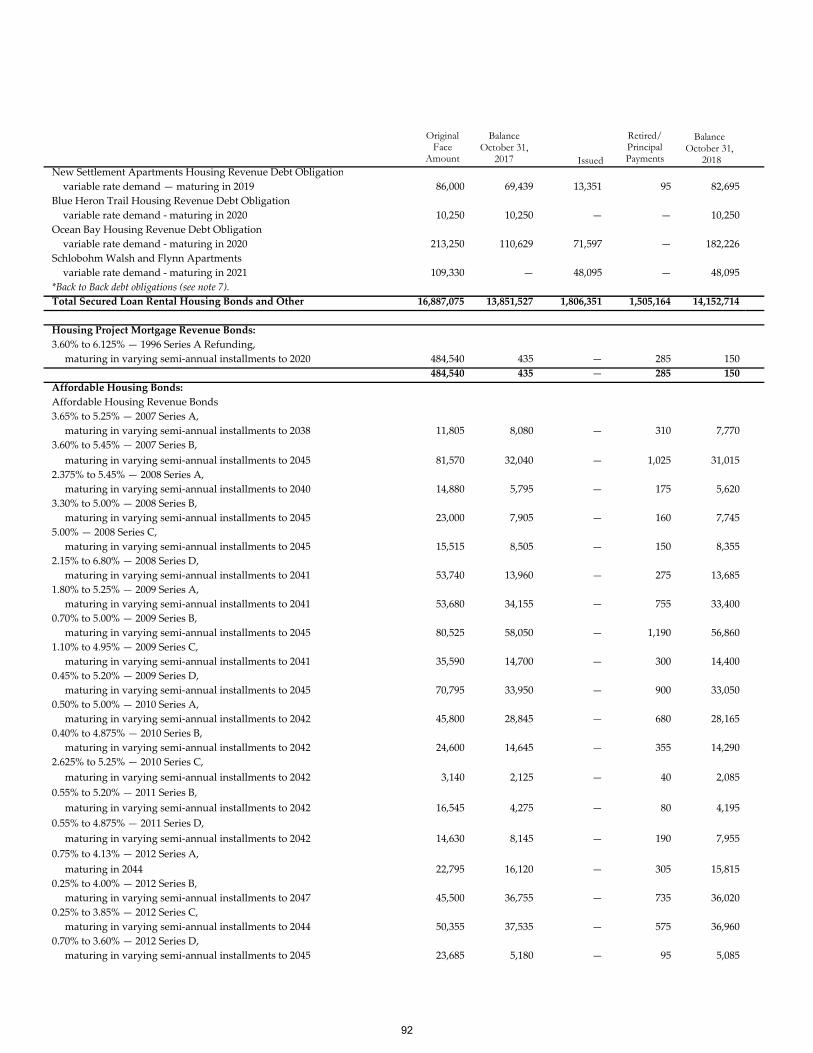
New Settlement Apartments Housing Revenue Debt Obligation
variable rate demand — maturing in 2019 86,000 69,439 13,351 95 82,695
Blue Heron Trail Housing Revenue Debt Obligation
variable rate demand ‐ maturing in 2020 10,250 10,250 — — 10,250
Ocean Bay Housing Revenue Debt Obligation
variable rate demand ‐ maturing in 2020 213,250 110,629 71,597 — 182,226
Schlobohm Walsh and Flynn Apartments
variable rate demand ‐ maturing in 2021 109,330 — 48,095 — 48,095
*Back to Back debt obligations (see note 7).
Total Secured Loan Rental Housing Bonds and Other 16,887,075 13,851,527 1,806,351 1,505,164 14,152,714
Housing Project Mortgage Revenue Bonds:
3.60% to 6.125% — 1996 Series A Refunding,
maturing in varying semi‐annual installments to 2020 484,540 435 — 285 150
484,540 435 — 285 150
Affordable Housing Bonds:
Affordable Housing Revenue Bonds
3.65% to 5.25% — 2007 Series A,
maturing in varying semi‐annual installments to 2038 11,805 8,080 — 310 7,770
3.60% to 5.45% — 2007 Series B,
maturing in varying semi‐annual installments to 2045 81,570 32,040 — 1,025 31,015
2.375% to 5.45% — 2008 Series A,
maturing in varying semi‐annual installments to 2040 14,880 5,795 — 175 5,620
3.30% to 5.00% — 2008 Series B,
maturing in varying semi‐annual installments to 2045 23,000 7,905 — 160 7,745
5.00% — 2008 Series C,
maturing in varying semi‐annual installments to 2045 15,515 8,505 — 150 8,355
2.15% to 6.80% — 2008 Series D,
maturing in varying semi‐annual installments to 2041 53,740 13,960 — 275 13,685
1.80% to 5.25% — 2009 Series A,
maturing in varying semi‐annual installments to 2041 53,680 34,155 — 755 33,400
0.70% to 5.00% — 2009 Series B,
maturing in varying semi‐annual installments to 2045 80,525 58,050 — 1,190 56,860
1.10% to 4.95% — 2009 Series C,
maturing in varying semi‐annual installments to 2041 35,590 14,700 — 300 14,400
0.45% to 5.20% — 2009 Series D,
maturing in varying semi‐annual installments to 2045 70,795 33,950 — 900 33,050
0.50% to 5.00% — 2010 Series A,
maturing in varying semi‐annual installments to 2042 45,800 28,845 — 680 28,165
0.40% to 4.875% — 2010 Series B,
maturing in varying semi‐annual installments to 2042 24,600 14,645 — 355 14,290
2.625% to 5.25% — 2010 Series C,
maturing in varying semi‐annual installments to 2042 3,140 2,125 — 40 2,085
0.55% to 5.20% — 2011 Series B,
maturing in varying semi‐annual installments to 2042 16,545 4,275 — 80 4,195
0.55% to 4.875% — 2011 Series D,
maturing in varying semi‐annual installments to 2042 14,630 8,145 — 190 7,955
0.75% to 4.13% — 2012 Series A,
maturing in 2044 22,795 16,120 — 305 15,815
0.25% to 4.00% — 2012 Series B,
maturing in varying semi‐annual installments to 2047 45,500 36,755 — 735 36,020
0.25% to 3.85% — 2012 Series C,
maturing in varying semi‐annual installments to 2044 50,355 37,535 — 575 36,960
0.70% to 3.60% — 2012 Series D,
maturing in varying semi‐annual installments to 2045 23,685 5,180 — 95 5,085
Original Face
Amount
Retired/ Principal Payments
Balance October 31,
2017
Balance October 31, 2018
Issued
92
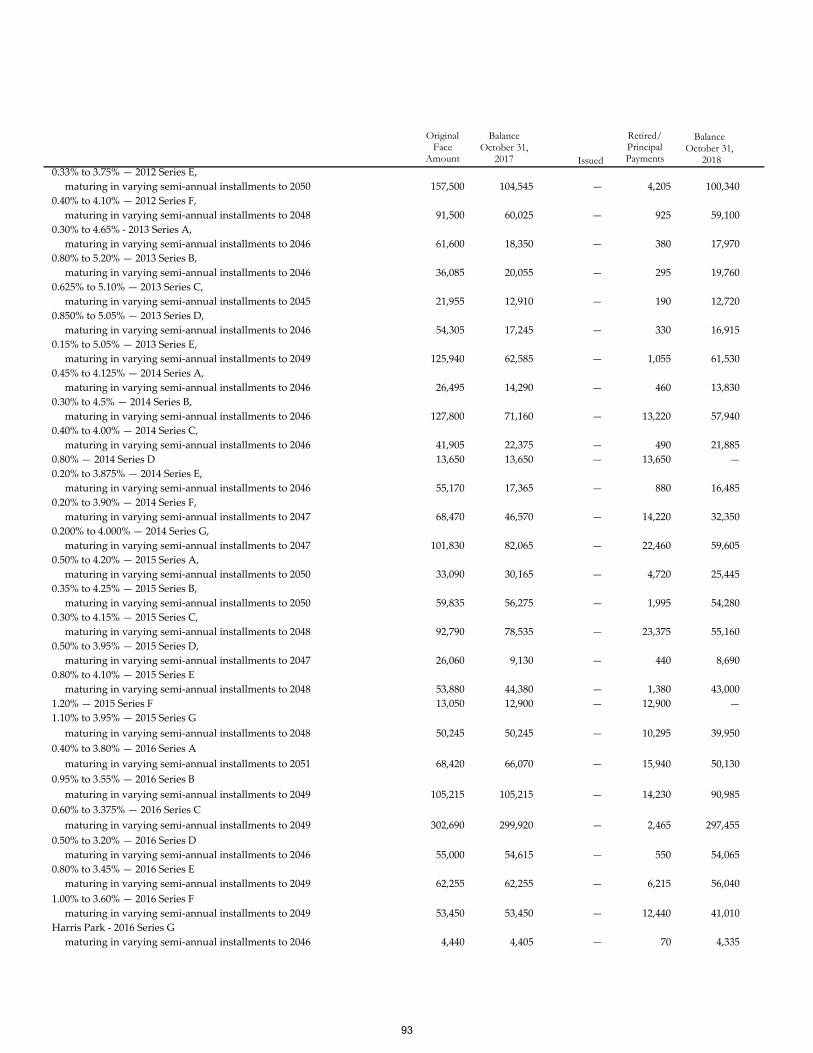
0.33% to 3.75% — 2012 Series E,
maturing in varying semi‐annual installments to 2050 157,500 104,545 — 4,205 100,340
0.40% to 4.10% — 2012 Series F,
maturing in varying semi‐annual installments to 2048 91,500 60,025 — 925 59,100
0.30% to 4.65% ‐ 2013 Series A,
maturing in varying semi‐annual installments to 2046 61,600 18,350 — 380 17,970
0.80% to 5.20% — 2013 Series B,
maturing in varying semi‐annual installments to 2046 36,085 20,055 — 295 19,760
0.625% to 5.10% — 2013 Series C,
maturing in varying semi‐annual installments to 2045 21,955 12,910 — 190 12,720
0.850% to 5.05% — 2013 Series D,
maturing in varying semi‐annual installments to 2046 54,305 17,245 — 330 16,915
0.15% to 5.05% — 2013 Series E,
maturing in varying semi‐annual installments to 2049 125,940 62,585 — 1,055 61,530
0.45% to 4.125% — 2014 Series A,
maturing in varying semi‐annual installments to 2046 26,495 14,290 — 460 13,830
0.30% to 4.5% — 2014 Series B,
maturing in varying semi‐annual installments to 2046 127,800 71,160 — 13,220 57,940
0.40% to 4.00% — 2014 Series C,
maturing in varying semi‐annual installments to 2046 41,905 22,375 — 490 21,885
0.80% — 2014 Series D 13,650 13,650 — 13,650 —
0.20% to 3.875% — 2014 Series E,
maturing in varying semi‐annual installments to 2046 55,170 17,365 — 880 16,485
0.20% to 3.90% — 2014 Series F,
maturing in varying semi‐annual installments to 2047 68,470 46,570 — 14,220 32,350
0.200% to 4.000% — 2014 Series G,
maturing in varying semi‐annual installments to 2047 101,830 82,065 — 22,460 59,605
0.50% to 4.20% — 2015 Series A,
maturing in varying semi‐annual installments to 2050 33,090 30,165 — 4,720 25,445
0.35% to 4.25% — 2015 Series B,
maturing in varying semi‐annual installments to 2050 59,835 56,275 — 1,995 54,280
0.30% to 4.15% — 2015 Series C,
maturing in varying semi‐annual installments to 2048 92,790 78,535 — 23,375 55,160
0.50% to 3.95% — 2015 Series D,
maturing in varying semi‐annual installments to 2047 26,060 9,130 — 440 8,690
0.80% to 4.10% — 2015 Series E
maturing in varying semi‐annual installments to 2048 53,880 44,380 — 1,380 43,000
1.20% — 2015 Series F 13,050 12,900 — 12,900 —
1.10% to 3.95% — 2015 Series G
maturing in varying semi‐annual installments to 2048 50,245 50,245 — 10,295 39,950
0.40% to 3.80% — 2016 Series A
maturing in varying semi‐annual installments to 2051 68,420 66,070 — 15,940 50,130
0.95% to 3.55% — 2016 Series B
maturing in varying semi‐annual installments to 2049 105,215 105,215 — 14,230 90,985
0.60% to 3.375% — 2016 Series C
maturing in varying semi‐annual installments to 2049 302,690 299,920 — 2,465 297,455
0.50% to 3.20% — 2016 Series D
maturing in varying semi‐annual installments to 2046 55,000 54,615 — 550 54,065
0.80% to 3.45% — 2016 Series E
maturing in varying semi‐annual installments to 2049 62,255 62,255 — 6,215 56,040
1.00% to 3.60% — 2016 Series F
maturing in varying semi‐annual installments to 2049 53,450 53,450 — 12,440 41,010
Harris Park ‐ 2016 Series G
maturing in varying semi‐annual installments to 2046 4,440 4,405 — 70 4,335
Original Face
Amount
Retired/ Principal Payments
Balance October 31,
2017
Balance October 31, 2018
Issued
93
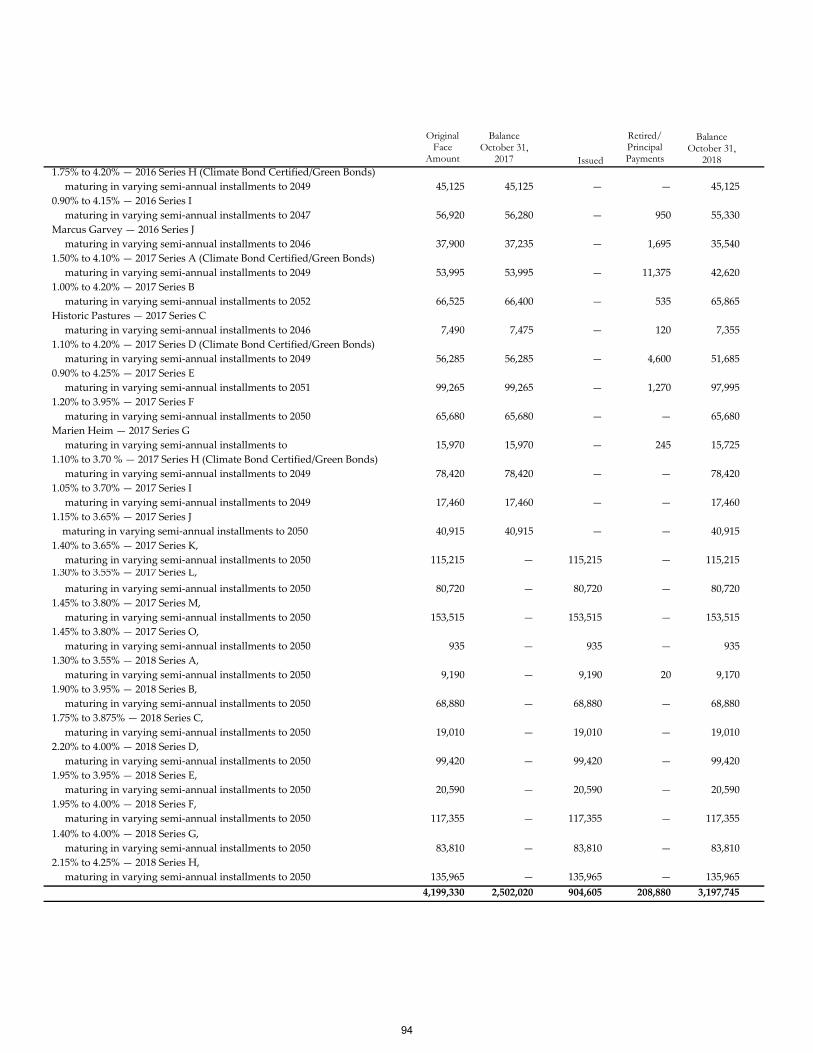
1.75% to 4.20% — 2016 Series H (Climate Bond Certified/Green Bonds)
maturing in varying semi‐annual installments to 2049 45,125 45,125 — — 45,125
0.90% to 4.15% — 2016 Series I
maturing in varying semi‐annual installments to 2047 56,920 56,280 — 950 55,330
Marcus Garvey — 2016 Series J
maturing in varying semi‐annual installments to 2046 37,900 37,235 — 1,695 35,540
1.50% to 4.10% — 2017 Series A (Climate Bond Certified/Green Bonds)
maturing in varying semi‐annual installments to 2049 53,995 53,995 — 11,375 42,620
1.00% to 4.20% — 2017 Series B
maturing in varying semi‐annual installments to 2052 66,525 66,400 — 535 65,865
Historic Pastures — 2017 Series C
maturing in varying semi‐annual installments to 2046 7,490 7,475 — 120 7,355
1.10% to 4.20% — 2017 Series D (Climate Bond Certified/Green Bonds)
maturing in varying semi‐annual installments to 2049 56,285 56,285 — 4,600 51,685
0.90% to 4.25% — 2017 Series E
maturing in varying semi‐annual installments to 2051 99,265 99,265 — 1,270 97,995
1.20% to 3.95% — 2017 Series F
maturing in varying semi‐annual installments to 2050 65,680 65,680 — — 65,680
Marien Heim — 2017 Series G
maturing in varying semi‐annual installments to 15,970 15,970 — 245 15,725
1.10% to 3.70 % — 2017 Series H (Climate Bond Certified/Green Bonds)
maturing in varying semi‐annual installments to 2049 78,420 78,420 — — 78,420
1.05% to 3.70% — 2017 Series I
maturing in varying semi‐annual installments to 2049 17,460 17,460 — — 17,460
1.15% to 3.65% — 2017 Series J
maturing in varying semi‐annual installments to 2050 40,915 40,915 — — 40,915
1.40% to 3.65% — 2017 Series K,
maturing in varying semi‐annual installments to 2050 115,215 — 115,215 — 115,215 1.30% to 3.55% — 2017 Series L,
maturing in varying semi‐annual installments to 2050 80,720 — 80,720 — 80,720
1.45% to 3.80% — 2017 Series M,
maturing in varying semi‐annual installments to 2050 153,515 — 153,515 — 153,515
1.45% to 3.80% — 2017 Series O,
maturing in varying semi‐annual installments to 2050 935 — 935 — 935
1.30% to 3.55% — 2018 Series A,
maturing in varying semi‐annual installments to 2050 9,190 — 9,190 20 9,170
1.90% to 3.95% — 2018 Series B,
maturing in varying semi‐annual installments to 2050 68,880 — 68,880 — 68,880
1.75% to 3.875% — 2018 Series C,
maturing in varying semi‐annual installments to 2050 19,010 — 19,010 — 19,010
2.20% to 4.00% — 2018 Series D,
maturing in varying semi‐annual installments to 2050 99,420 — 99,420 — 99,420
1.95% to 3.95% — 2018 Series E,
maturing in varying semi‐annual installments to 2050 20,590 — 20,590 — 20,590
1.95% to 4.00% — 2018 Series F,
maturing in varying semi‐annual installments to 2050 117,355 — 117,355 — 117,355
1.40% to 4.00% — 2018 Series G,
maturing in varying semi‐annual installments to 2050 83,810 — 83,810 — 83,810
2.15% to 4.25% — 2018 Series H,
maturing in varying semi‐annual installments to 2050 135,965 — 135,965 — 135,965
4,199,330 2,502,020 904,605 208,880 3,197,745
Original Face
Amount
Retired/ Principal Payments
Balance October 31,
2017
Balance October 31, 2018
Issued
94
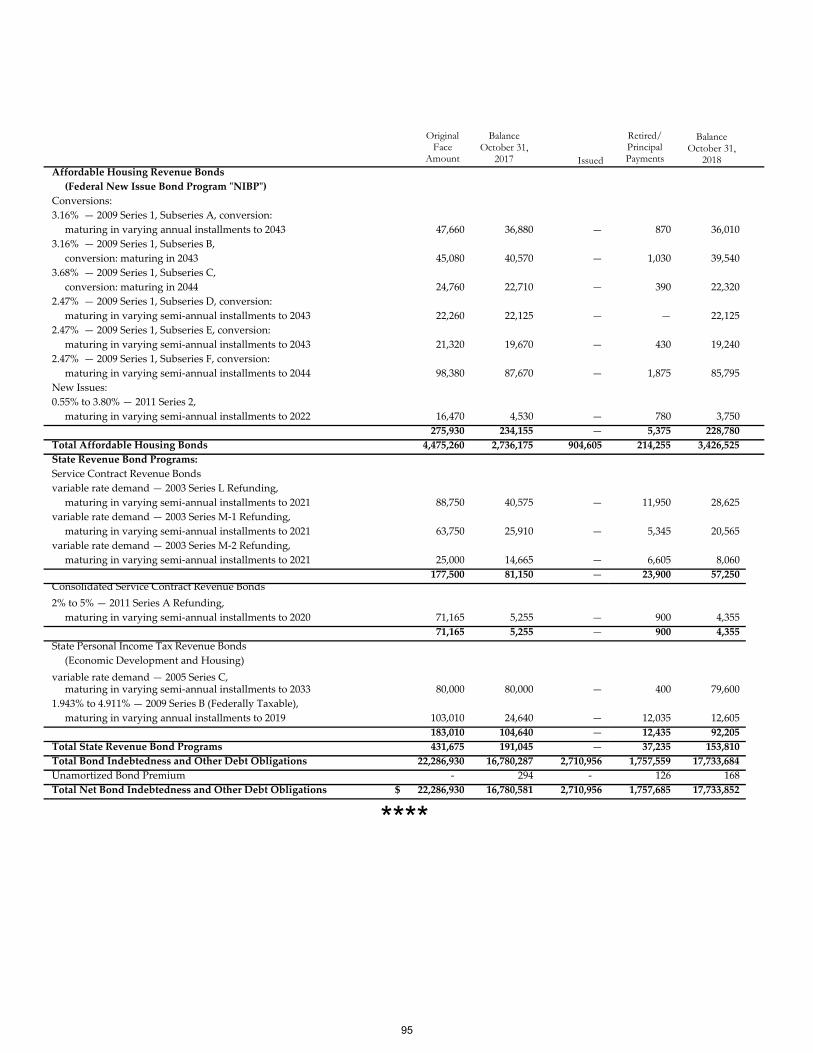
Affordable Housing Revenue Bonds
(Federal New Issue Bond Program ʺNIBPʺ)
Conversions:
3.16% — 2009 Series 1, Subseries A, conversion:
maturing in varying annual installments to 2043 47,660 36,880 — 870 36,010
3.16% — 2009 Series 1, Subseries B,
conversion: maturing in 2043 45,080 40,570 — 1,030 39,540
3.68% — 2009 Series 1, Subseries C,
conversion: maturing in 2044 24,760 22,710 — 390 22,320
2.47% — 2009 Series 1, Subseries D, conversion:
maturing in varying semi‐annual installments to 2043 22,260 22,125 — — 22,125
2.47% — 2009 Series 1, Subseries E, conversion:
maturing in varying semi‐annual installments to 2043 21,320 19,670 — 430 19,240
2.47% — 2009 Series 1, Subseries F, conversion:
maturing in varying semi‐annual installments to 2044 98,380 87,670 — 1,875 85,795
New Issues:
0.55% to 3.80% — 2011 Series 2,
maturing in varying semi‐annual installments to 2022 16,470 4,530 — 780 3,750
275,930 234,155 — 5,375 228,780
Total Affordable Housing Bonds 4,475,260 2,736,175 904,605 214,255 3,426,525
State Revenue Bond Programs:
Service Contract Revenue Bonds
variable rate demand — 2003 Series L Refunding,
maturing in varying semi‐annual installments to 2021 88,750 40,575 — 11,950 28,625
variable rate demand — 2003 Series M‐1 Refunding,
maturing in varying semi‐annual installments to 2021 63,750 25,910 — 5,345 20,565
variable rate demand — 2003 Series M‐2 Refunding,
maturing in varying semi‐annual installments to 2021 25,000 14,665 — 6,605 8,060
177,500 81,150 — 23,900 57,250 Consolidated Service Contract Revenue Bonds
2% to 5% — 2011 Series A Refunding,
maturing in varying semi‐annual installments to 2020 71,165 5,255 — 900 4,355
71,165 5,255 — 900 4,355
State Personal Income Tax Revenue Bonds
(Economic Development and Housing)
variable rate demand — 2005 Series C, maturing in varying semi‐annual installments to 2033 80,000 80,000 — 400 79,600
1.943% to 4.911% — 2009 Series B (Federally Taxable),
maturing in varying annual installments to 2019 103,010 24,640 — 12,035 12,605
183,010 104,640 — 12,435 92,205
Total State Revenue Bond Programs 431,675 191,045 — 37,235 153,810
Total Bond Indebtedness and Other Debt Obligations 22,286,930 16,780,287 2,710,956 1,757,559 17,733,684
Unamortized Bond Premium ‐ 294 ‐ 126 168
Total Net Bond Indebtedness and Other Debt Obligations $ 22,286,930 16,780,581 2,710,956 1,757,685 17,733,852
****
Original Face
Amount
Retired/ Principal Payments
Balance October 31,
2017
Balance October 31, 2018
Issued
95
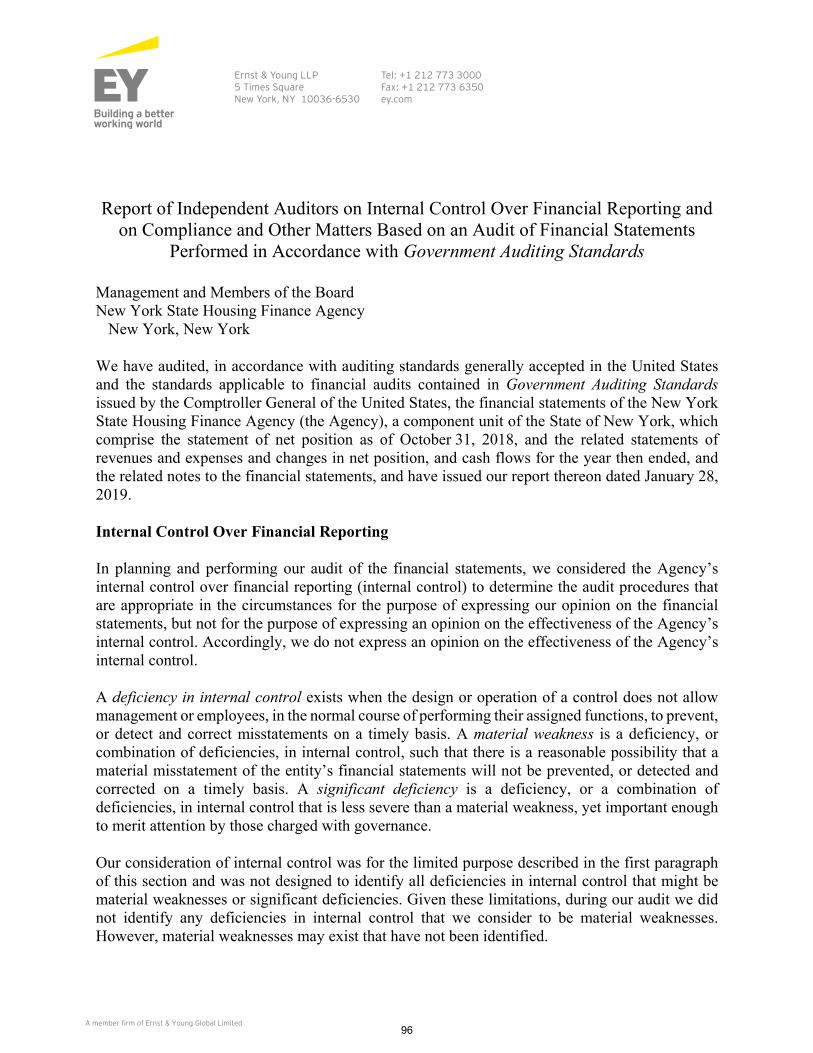
A member firm of Ernst & Young Global Limited
Ernst & Young LLP 5 Times Square New York, NY 10036-6530
Tel: +1 212 773 3000 Fax: +1 212 773 6350 ey.com
Report of Independent Auditors on Internal Control Over Financial Reporting and on Compliance and Other Matters Based on an Audit of Financial Statements
Performed in Accordance with Government Auditing Standards
Management and Members of the Board New York State Housing Finance Agency
New York, New York
We have audited, in accordance with auditing standards generally accepted in the United States and the standards applicable to financial audits contained in Government Auditing Standards issued by the Comptroller General of the United States, the financial statements of the New York State Housing Finance Agency (the Agency), a component unit of the State of New York, which comprise the statement of net position as of October 31, 2018, and the related statements of revenues and expenses and changes in net position, and cash flows for the year then ended, and the related notes to the financial statements, and have issued our report thereon dated January 28, 2019.
Internal Control Over Financial Reporting
In planning and performing our audit of the financial statements, we considered the Agency’s internal control over financial reporting (internal control) to determine the audit procedures that are appropriate in the circumstances for the purpose of expressing our opinion on the financial statements, but not for the purpose of expressing an opinion on the effectiveness of the Agency’s internal control. Accordingly, we do not express an opinion on the effectiveness of the Agency’s internal control.
A deficiency in internal control exists when the design or operation of a control does not allow management or employees, in the normal course of performing their assigned functions, to prevent, or detect and correct misstatements on a timely basis. A material weakness is a deficiency, or combination of deficiencies, in internal control, such that there is a reasonable possibility that a material misstatement of the entity’s financial statements will not be prevented, or detected and corrected on a timely basis. A significant deficiency is a deficiency, or a combination of deficiencies, in internal control that is less severe than a material weakness, yet important enough to merit attention by those charged with governance.
Our consideration of internal control was for the limited purpose described in the first paragraph of this section and was not designed to identify all deficiencies in internal control that might be material weaknesses or significant deficiencies. Given these limitations, during our audit we did not identify any deficiencies in internal control that we consider to be material weaknesses. However, material weaknesses may exist that have not been identified.
96
A member firm of Ernst & Young Global Limited
Compliance and Other Matters
As part of obtaining reasonable assurance about whether the Agency’s financial statements are free of material misstatement, we performed tests of its compliance with certain provisions of laws, regulations, contracts and grant agreements, noncompliance with which could have a direct and material effect on the determination of financial statement amounts. However, providing an opinion on compliance with those provisions was not an objective of our audit, and accordingly, we do not express such an opinion. The results of our tests disclosed no instances of noncompliance or other matters that are required to be reported under Government Auditing Standards.
Purpose of this Report
The purpose of this report is solely to describe the scope of our testing of internal control and compliance and the result of that testing, and not to provide an opinion on the effectiveness of the Agency’s internal control or on compliance. This report is an integral part of an audit performed in accordance with Government Auditing Standards in considering the Agency’s internal control and compliance. Accordingly, this communication is not suitable for any other purpose.
ey January 28, 2019
97
New York State Housing Finance Agency641 Lexington Avenue
New York, NY 10022
212-688-4000
www.nyshcr.org