Embed Size (px)
Citation preview
Heterogeneity of neuroanatomical patterns inprodromal Alzheimer’s disease: links tocognition, progression and biomarkers
Aoyan Dong,1,2,* Jon B. Toledo,2,3,4,* Nicolas Honnorat,1,2 Jimit Doshi,1,2 Erdem Varol,1,2
Aristeidis Sotiras,1,2 David Wolk,5 John Q. Trojanowski3 and Christos Davatzikos1,2 for theAlzheimer’s Disease Neuroimaging Initiative
*These authors contributed equally to this work.
See Coulthard and Knight (doi:10.1093/aww335) for a scientific commentary on this article.
Individuals with mild cognitive impairment and Alzheimer’s disease clinical diagnoses can display significant phenotypic heterogeneity.
This variability likely reflects underlying genetic, environmental and neuropathological differences. Characterizing this heterogeneity is
important for precision diagnostics, personalized predictions, and recruitment of relatively homogeneous sets of patients into clinical
trials. In this study, we apply state-of-the-art semi-supervised machine learning methods to the Alzheimer’s disease Neuroimaging cohort
(ADNI) to elucidate the heterogeneity of neuroanatomical differences between subjects with mild cognitive impairment (n = 530) and
Alzheimer’s disease (n = 314) and cognitively normal individuals (n = 399), thereby adding to an increasing literature aiming to establish
neuroanatomical and neuropathological (e.g. amyloid and tau deposition) dimensions in Alzheimer’s disease and its prodromal stages.
These dimensional approaches aim to provide surrogate measures of heterogeneous underlying pathologic processes leading to cognitive
impairment. We relate these neuroimaging patterns to cerebrospinal fluid biomarkers, white matter hyperintensities, cognitive and clinical
measures, and longitudinal trajectories. We identified four such atrophy patterns: (i) individuals with largely normal neuroanatomical
profiles, who also turned out to have the least abnormal cognitive and cerebrospinal fluid biomarker profiles and the slowest clinical
progression during follow-up; (ii) individuals with classical Alzheimer’s disease neuroanatomical, cognitive, cerebrospinal fluid bio-
markers and clinical profile, who presented the fastest clinical progression; (iii) individuals with a diffuse pattern of atrophy with
relatively less pronounced involvement of the medial temporal lobe, abnormal cerebrospinal fluid amyloid-b1-42 values, and proportion-
ally greater executive impairment; and (iv) individuals with notably focal involvement of the medial temporal lobe and a slow steady
progression, likely representing in early Alzheimer’s disease stages. These four atrophy patterns effectively define a 4-dimensional
categorization of neuroanatomical alterations in mild cognitive impairment and Alzheimer’s disease that can complement existing
dimensional approaches for staging Alzheimer’s disease using a variety of biomarkers, which offer the potential for enabling precision
diagnostics and prognostics, as well as targeted patient recruitment of relatively homogeneous subgroups of subjects for clinical trials.
1 Department of Radiology, Perelman School of Medicine at the University of Pennsylvania, PA, USA2 Center for Biomedical Image Computing and Analytics, Perelman School of Medicine at the University of Pennsylvania, PA, USA3 Department of Pathology and Laboratory Medicine and Center for Neurodegenerative Disease Research, Perelman School of
Medicine at the University of Pennsylvania, PA, USA4 Department of Neurology, Houston Methodist Hospital, Houston, TX, USA5 Department of Neurology, Perelman School of Medicine at the University of Pennsylvania, PA, USA
doi:10.1093/brain/aww319 BRAIN 2017: 140; 735–747 | 735
Received June 10, 2016. Revised October 12, 2016. Accepted October 21, 2016. Advance Access publication December 20, 2016
� The Author (2016). Published by Oxford University Press on behalf of the Guarantors of Brain. All rights reserved.
For Permissions, please email: [email protected]
Correspondence to: Christos Davatzikos
Center for Biomedical Image Computing and Analytics
University of Pennsylvania
3700 Hamilton Walk,
Richards Building, 7th Floor,
Perelman School of Medicine at the University of Pennsylvania, PA, USA
E-mail: [email protected]
Keywords: neuroanatomical heterogeneity; pattern analysis; magnetic resonance imaging; mild cognitive impairment; dementia
Abbreviations: ADNI = Alzheimer’s Disease Neuroimaging Initiative; MCI = mild cognitive impairment; VBM = voxel-basedmorphometry; WMH = white matter hyperintensity
IntroductionDementia is a prevalent disorder leading to substantial
healthcare, financial, and caregiver burden (Hurd et al.,
2013). Although Alzheimer’s disease is the most common
cause of dementia, several coincident pathologies, mainly
vascular lesions, limbic TAR-DNA binding protein-43
(TDP-43, encoded by TARDBP) and Lewy body-related
pathology, also account for the cognitive symptoms of de-
mentia subjects (Zanetti et al., 2006; Schneider et al., 2007;
Toledo et al., 2013a, b, 2016; Wilson et al., 2013). The
presence of different brain pathological lesions and the
variations in cognitive reserve, genetic background, and en-
vironmental exposures, can lead to differential vulnerabil-
ity. This, in turn, can lead to large variations in the clinical
presentation and course of the subjects. Therefore, it can be
expected that a group of cognitively impaired subjects is
composed of different subtypes. Each subtype would pre-
sent a specific disease course and characteristics.
Traditional imaging approaches [e.g. voxel-based morph-
ometry (VBM) or multi-voxel pattern analysis (MVPA)]
ignore phenotypic heterogeneity and define patterns of
structural or functional changes based on a priori diagnosis
or grouping but not the inherent heterogeneity presented in
the populations (Karas et al., 2004; Busatto et al., 2008;
Kloppel et al., 2008; Misra et al., 2009).
Previous studies have used a priori-defined neuropatho-
logical categories to identify subgroups of subjects (Shiino
et al., 2006; Murray et al., 2011; Lam et al., 2013; Jack
et al., 2015). In these approaches, subtypes of pathologies
are defined based on clinical diagnosis or neuropathological
findings, which unfortunately makes it not reliable enough
for accurately distinguishing them (McKeith et al., 1994;
Larner, 2004) and relies on a clinical ‘intuition’, as opposed
to unbiased data-driven approaches, that would be able to
identify different patterns of pathology distribution based
on the atrophy patterns inherent to the population
(Nettiksimmons et al., 2014; Noh et al., 2014; Toledo
et al., 2016). However, these studies adopted standard clus-
tering methods that tend to group patients along the direc-
tion associated with the largest data variability, which may
not be induced by the pathology, and which might reflect
effects such as age, gender or disease stage. A more specific
characterization of anatomical heterogeneity of neurode-
generation patterns of processes driving cognitive impair-
ment is likely to lead to grouping of subjects into relatively
homogeneous groups with potentially more predictable
clinical outcomes and treatment responses.
In this study, we investigate heterogeneity of neurodegen-
eration in mild cognitive impairment (MCI) and Alzheimer’s
disease relative to cognitively normal individuals, by lever-
aging a newly developed method for semi-supervised pattern
analysis and machine learning (Dong et al., 2016). This new
approach aims to complement and contribute to recently
proposed dimensional approaches, such as the A/T/N
Alzheimer’s disease staging system (Jack et al., 2016), by
evaluating and categorizing heterogeneity of disease-related
neurodegeneration patterns (the ‘N’ component in an A/T/N
system) in a data-driven way that leverages the power of
modern pattern analysis methods. Our approach applies a
sophisticated methodology that finds heterogeneity in a
probabilistic mapping from cognitively normal individuals
to MCI and Alzheimer’s disease dementia patients, while
also accounting for relevant covariates, such as age,
gender, and study recruitment (ADNI 1 versus GO/2) in a
non-linear way. We found four distinct neuroanatomical
subtypes in MCI and Alzheimer’s disease dementia relative
to cognitively normal subjects, which were replicable and
consistent across ADNI-1 and ADNI-GO/2 cohorts.
Subtypes in this context are mainly meant to define the
main dimensions of this heterogeneity, rather than imply
distinct imaging phenotypes. We describe in detail the CSF
biomarkers, cognitive characteristics and white matter hyper-
intensity (WMH) volumes of these subtypes.
Materials and methods
Subjects
A total number of 1243 Alzheimer’s Disease NeuroimagingInitiative (ADNI) participants were included in the study,including 760 ADNI-1 subjects (213 cognitively normal, 370late MCI, and 177 Alzheimer’s disease subjects) and 483ADNI-GO/2 subjects (186 cognitively normal, 160 late MCI,and 137 Alzheimer’s disease). Early MCI subjects from theADNI-GO/2 were excluded because this group was only
736 | BRAIN 2017: 140; 735–747 A. Dong et al.
recruited in ADNI-GO/2. Cognitively normal subjects includedsubjects with normal cognition, independently of the presenceof memory complaints. Diagnoses of MCI and Alzheimer’sdisease were established as described (Petersen et al., 1999,2010; McKhann et al., 2011). The data for this study weredownloaded in December 2015. The ADNI datasets have beenextensively reviewed in Weiner et al. (2015) (http://www.adni-info.org and Supplementary material). To evaluate differencesin cognitive measures, previously developed memory compositescore (Crane et al., 2012), executive composite score (Gibbonset al., 2012), and Boston naming test scores were studied.Median follow-up length for ADNI-1 and ADNI-GO/2 MCIsubjects was 161.0 (first quartile: 105.4–third quartile: 315.0)and 156.3 (first quartile: 106.5–third quartile: 159.1) weeks,respectively.
Cerebrospinal fluid collection andmeasurement
CSF samples were processed as previously described (Shaw et al.,2009, 2011) (http://www.adni-info.org/ and Supplementary ma-terial). Amyloid-b1-42 and total tau (t-tau) were measured usingthe multiplex xMAP Luminex platform with Innogenetics(INNO-BIA AlzBio3) immunoassay kit-based reagents.
MRI acquisition and processing
Acquisition of 1.5 T MRI (for ADNI-1) and 3.0 T MRI (forADNI-GO/2) data at each study site followed a previouslydescribed standardized protocol that included volumetric 3DMP-RAGE/sagittal MP-RAGE with variable resolution aroundthe target of 1.2 mm isotropically. The scans went throughthe following correction methods: gradwarp, B1 calibration,N3 correction, and (in-house) skull-stripping (Doshi et al.,2013). See www.loni.ucla.edu/ADNI and Jack et al. (2008)for details.
T1 structural MRI images of all subjects were segmented into80 anatomical regions of interest. The region of interest labelswere obtained using multi-atlas segmentation with label fusionof outputs from multiple registration methods (Doshi et al.,2015). For visualizing disease patterns, tissue density maps,referred as RAVENS (regional analysis of volumes examinedin normalized space) (Davatzikos et al., 2001), were computedand exploited as follows. An established deformable registra-tion method (Ou et al., 2011), was used for warping individualimages to a single subject brain template. The brain scans weresegmented into three tissue types: grey matter, white matterand CSF (Li et al., 2014). RAVENS maps encode, locallyand separately for each tissue type, the volumetric changesobserved during the registration. The comparison of theRAVENS maps obtained for the different groups revealedthe local volumetric differences between them. We used thecognitively normal group data for linearly regressing age andgender from the RAVENS maps of the entire dataset. To assesslongitudinal neuroimaging changes, region of interest volumeswere processed using Free-surfer software package version 4.4framework (Reuter et al., 2010, 2012) (http://surfer.nmr.mgh.harvard.edu/). Adjusted hippocampal volume was calculatedand matched across ADNI-1 and ADNI-GO/2 cohorts usinga set of matched MRIs as previously described (Toledo et al.,2014). Subjects were divided into four quartiles.
White matter hyperintensities
WMHs were segmented using different approaches in ADNI-1(Schwarz et al., 2009) and ADNI-GO/2 (DeCarli et al., 2005).The method used in ADNI-1 uses proton density (PD), T1, andT2 magnetic resonance images. A Bayesian Markov randomfield approach was adopted, where the joint posterior probabil-ity of the presence of WMH at each voxel is maximized. Theposterior probability consists of likelihood computed fromimage intensities, spatial prior that regularizes the location ofWMHs, and contextual prior that encourages neighbour voxelsto have the same labels. The method used in ADNI-GO/2 usesfluid-attenuated inversion recovery (FLAIR) and T1 images. Thismethod first co-registers the FLAIR magnetic resonance imageto the T1 image and performs inhomogeneity correction. Thebinary WMH mask is then estimated based on histogram fittingand thresholding at 3.5 standard deviations above the meansignal in brain matter distribution. The spatial prior and tissueclass constraints are incorporated with the WMH mask in aBayesian approach for the final segmentation.
Heterogeneity and voxel-based mor-phometry analysis
We used a newly developed probabilistic mapping methodology,named CHIMERA (Dong et al., 2016), to quantify neuroana-tomical heterogeneity between MCI/Alzheimer’s disease andcognitively normal individuals. The CHIMERA software imple-mentation is available on request and will be available onlinethrough https://www.cbica.upenn.edu/sbia/software. Additionalpreprocessing software (registration and region of interest def-inition) are also available on the same web page. A web-access-ible pipeline will be soon available to be run remotely via ourimage processing web portal: https://ipp.cbica.upenn.edu/.CHIMERA considers two groups of subjects: a group assumedto be affected by a pathology (MCI and Alzheimer’s disease,herein) and a normal control group. By performing a probabil-ity distribution mapping, it then seeks patterns of differencebetween these two groups, constrained non-linearly by anumber of covariates (e.g. age, gender, and study cohort),thereby effectively estimating heterogeneity of the underlyingpathologic process. More specifically, heterogeneous brain atro-phy patterns in the pathologic group are described by multipletransformations from the cognitively normal distribution. Thosetransformations are found by matching the transformed normalcontrol and the patient distributions, constrained by the covari-ates, which effectively enforce the fact that, for example, a 70-year-old female patient would have been a 70-year-old femalecontrol, should she had been spared of this pathological process(which is being estimated). To obtain stable and reproducibleresults, CHIMERA was run 10 000 times with random initial-ization to determine reproducible patterns. The methodologicaldetails and nuances of this approach can be found in theSupplementary material and Dong et al. (2016).
In this study, ADNI-1 and ADNI-GO/2 datasets were com-bined to delineate more consistent pathological imaging pat-terns. However, the structural MRI scans from these twocohorts have many discrepancies, such as different scan proto-cols and magnetic field strengths. We took these discrepanciesinto account during our analyses by introducing the originalrecruitment cohort (ADNI-1 versus ADNI-GO/2) as the third
Neuroanatomical heterogeneity of prodromal AD BRAIN 2017: 140; 735–747 | 737
covariate in our model, in addition to age and gender. As aresult, patient and normal control distributions were matchedwithin each cohort separately, but the pathological effects cap-tured by CHIMERA were shared across datasets. We per-formed a 10-fold cross-validation using the combined datasetto evaluate the robustness of the method, which showed an84.1% agreement (Supplementary material). In addition, weapplied our clustering approach separately in the ADNI-1and ADNI-GO/2 cohorts, which showed a 63% and 74%overall agreement with the combined approach, respectively.
Statistical analysis
The demographic variables, APOE genotype, CSF biomarkerlevels, cognitive test scores and WMH volumes were comparedacross clusters. For categorical variables, Fisher’s exact testwas used to identify differences between groups. In case ofsignificant differences, pairwise comparisons with Bonferroniadjustment were performed. For quantitative demographicvariables (age), an ANOVA analysis was conducted, followedby a Dunn test. For the clinical and CSF biomarker measures,an ANCOVA analysis was performed, which included age,gender, years of education and APOE genotype as covariates.In case of significant differences, Dunn’s post hoc test wasperformed. When the ANCOVA requirements were not met,a Box-Cox transformation was applied to the data. A longitu-dinal neuropsychological analysis was conducted for late MCIpatients (Alzheimer’s disease subjects were excluded due toshort follow-up) using mixed effect models that included sub-jects and time as random effects and age, gender, time, APOE"4 presence and years of education as fixed effects. A Coxhazards model including age, gender, APOE "4 presence andyears of education as covariates, was fitted for comparing theconversion of late MCI patient to Alzheimer’s disease in thedifferent clusters. For the evaluation of the profile of longitu-dinal changes in MRI volumes, individual mixed effects modelsthat included age, gender, time and APOE as covariates, wereapplied to estimate the yearly volumetric changes in cognitivelynormal subjects and each of the clusters. Baseline and second-year MRI scans were compared for this purpose and region ofinterest values were standardized to compare findings acrossthe different areas. Analyses were performed using R v. 3.2.2(R Core Team, 2016). The visualization of imaging signaturesof each cluster, clinically and adjusted hippocampal volume-defined groups was performed via VBM (Cox, 1996;Ashburner and Friston, 2000) on RAVENS maps.
Results
Cluster demographic and geneticcharacteristics
CHIMERA partitioned the entire set of ADNI patients into
four clusters that included in each case subjects from
ADNI-1 and ADNI-GO/2. Subjects in different ADNI co-
horts but within the same cluster exhibited similar atrophy
patterns. The characteristics of clusters identified in ADNI-
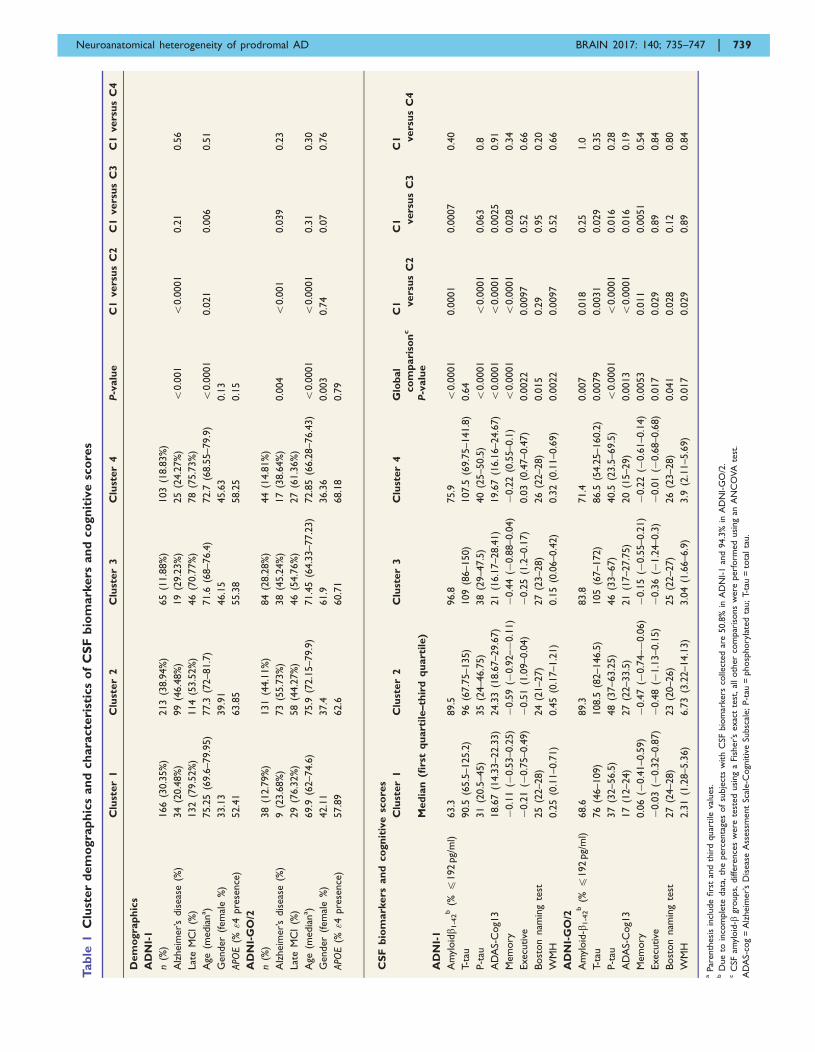
1 and ADNI-GO/2 cohorts are summarized in Table 1. In
all ADNI cohorts, cluster 2 subjects were older and had a
greater proportion of Alzheimer’s disease dementia subjects
compared to cluster 1.
Cluster membership confidence
In our main analysis, we assigned each subject to the clus-
ter with the highest probability. For most of the subjects,
cluster membership was assigned with a probability 50.5.
However, in the remaining cases membership was assigned
with a probability 50.5. The ‘tightest’ cluster was cluster 2
(87% subjects had a probability 50.5), whereas cluster 3
was the loosest one (66% subjects had a probability 50.5)
(Supplementary Fig. 2), with most of the loose cases being
close to cluster 1. We summarize these findings using a
Venn diagram in Fig. 1.
Cross-sectional clinical and biomar-ker associations
CSF amyloid-b1-42-defined groups, WMH volume and the
studied cognitive measures differed between the four clus-
ters (Table 1). Post hoc group comparisons identified simi-
lar results across cohorts. Subjects in clusters 2 and 3
included a higher frequency of subjects with pathological
CSF amyloid-b1-42 values. Cluster 2 and 3 subjects pre-
sented worse performance in the memory composite and
in ADAS-Cog compared to cluster 1. In addition, cluster
2 subjects had worse executive composite, higher phos-
phorylated-tau values and greater WMH volume compared
to cluster 1 subjects. Only in ADNI-GO/2 did the clusters
differ in terms of CSF t-tau values (cluster 1 had lower
values than cluster 2 and 3).
Group-wise voxel-based morphome-try results
The group-wise VBM results were presented in Fig. 2.
Cluster 1 showed the least amount and extent of atrophy:
in the ADNI-1 cohort atrophy was mainly localized in the
temporal lobe with additional involvement of the posterior
cingulate cortex, and in ADNI-GO/2 it was statistically in-
distinguishable from cognitively normal. Interestingly, clus-
ter 4 showed moderate localized atrophy in the
hippocampus and the anterior-medial temporal cortex,
without any significant involvement beyond these regions.
Conversely, clusters 2 and 3 showed widespread involve-
ment, extending to the temporal, parietal, and occipital
lobes in addition to subcortical grey matter. However,
they presented markedly different patterns, as cluster 2 pre-
sented relatively most severe temporal atrophy, whereas
cluster 3 exhibited a more diffuse atrophy pattern, with
comparatively less dominant involvement of the temporal
lobe compared to cluster 2. Group comparisons based on
baseline diagnosis and adjusted hippocampal volume quar-
tiles are presented in Supplementary Figs 3 and 4,
respectively.
738 | BRAIN 2017: 140; 735–747 A. Dong et al.
Tab
le1
Clu
ster
dem
ogra
ph
ics
an
dch
ara
cte
rist
ics
of
CS
Fb
iom
ark
ers
an
dco
gn
itiv
esc
ore
s
Clu
ster
1C
lust
er
2C
lust
er
3C
lust
er
4P
-valu
eC
1vers
us
C2
C1
vers
us
C3
C1
vers
us
C4
Dem
ogra
ph
ics
AD
NI-
1
n(%
)166
(30.3
5%
)213
(38.9
4%
)65
(11.8
8%
)103
(18.8
3%
)
Alz
heim
er’s
dis
eas
e(%
)34
(20.4
8%
)99
(46.4
8%
)19
(29.2
3%
)25
(24.2
7%
)5
0.0
01
50.0
001
0.2
10.5
6
Lat
eM
CI
(%)
132
(79.5
2%
)114
(53.5
2%
)46
(70.7
7%
)78
(75.7
3%
)
Age
(media
na)
75.2
5(6
9.6
–79.9
5)
77.3
(72–81.7
)71.6
(68–76.4
)72.7
(68.5
5–79.9
)5
0.0
001
0.0
21
0.0
06
0.5
1
Gender
(fem
ale
%)
33.1
339.9
146.1
545.6
30.1
3
APO
E(%
"4pre
sence
)52.4
163.8
555.3
858.2
50.1
5
AD
NI-
GO
/2
n(%
)38
(12.7
9%
)131
(44.1
1%
)84
(28.2
8%
)44
(14.8
1%
)
Alz
heim
er’s
dis
eas
e(%
)9
(23.6
8%
)73
(55.7
3%
)38
(45.2
4%
)17
(38.6
4%
)0.0
04
50.0
01
0.0
39
0.2
3
Lat
eM
CI
(%)
29
(76.3
2%
)58
(44.2
7%
)46
(54.7
6%
)27
(61.3
6%
)
Age
(media
na)
69.9
(62–74.6
)75.9
(72.1
5–79.9
)71.4
5(6
4.3
3–77.2
3)
72.8
5(6
6.2
8–76.4
3)
50.0
001
50.0
001
0.3
10.3
0
Gender
(fem
ale
%)
42.1
137.4
61.9
36.3
60.0
03
0.7
40.0
70.7
6
APO
E(%
"4pre
sence
)57.8
962.6
60.7
168.1
80.7
9
CS
Fb
iom
ark
ers
an
dco
gn
itiv
esc
ore
s
Clu
ster
1C
lust
er
2C
lust
er
3C
lust
er
4G
lob
al
co
mp
ari
son
cC
1 vers
us
C2
C1 vers
us
C3
C1 vers
us
C4
Med
ian
(firs
tq
uart
ile–th
ird
qu
art
ile)
P-v
alu
e
AD
NI-
1
Am
yloidb 1
-42b
(%4
192
pg/
ml)
63.3
89.5
96.8
75.9
50.0
001
0.0
001
0.0
007
0.4
0
T-ta
u90.5
(65.5
–125.2
)96
(67.7
5–135)
109
(86–150)
107.5
(69.7
5–141.8
)0.6
4
P-t
au31
(20.5
–45)
35
(24–46.7
5)
38
(29–47.5
)40
(25–50.5
)5
0.0
001
50.0
001
0.0
63
0.8
AD
AS-
Cog1
318.6
7(1
4.3
3–22.3
3)
24.3
3(1
8.6
7–29.6
7)
21
(16.1
7–28.4
1)
19.6
7(1
6.1
6–24.6
7)
50.0
001
50.0
001
0.0
025
0.9
1
Mem
ory
�0.1
1(�
0.5
3–0.2
5)�
0.5
9(�
0.9
2–�
0.1
1)�
0.4
4(�
0.8
8–0.0
4)�
0.2
2(0
.55–0.1
)5
0.0
001
50.0
001
0.0
28
0.3
4
Execu
tive
�0.2
1(�
0.7
5–0.4
9)�
0.5
1(1
.09–0.0
4)
�0.2
5(1
.2–0.1
7)
0.0
3(0
.47–0.4
7)
0.0
022
0.0
097
0.5
20.6
6
Bost
on
nam
ing
test
25
(22–28)
24
(21–27)
27
(23–28)
26
(22–28)
0.0
15
0.2
90.9
50.2
0
WM
H0.2
5(0
.11–0.7
1)
0.4
5(0
.17–1.2
1)
0.1
5(0
.06–0.4
2)
0.3
2(0
.11–0.6
9)
0.0
022
0.0
097
0.5
20.6
6
AD
NI-
GO
/2
Am
yloid
-b1-4
2b
(%4
192
pg/
ml)
68.6
89.3
83.8
71.4
0.0
07
0.0
18
0.2
51.0
T-ta
u76
(46–109)
108.5
(82–146.5
)105
(67–172)
86.5
(54.2
5–160.2
)0.0
079
0.0
031
0.0
29
0.3
5
P-t
au37
(32–56.5
)48
(37–63.2
5)
46
(33–67)
40.5
(23.5
–69.5
)5
0.0
001
50.0
001
0.0
16
0.2
8
AD
AS-
Cog1
317
(12–24)
27
(22–33.5
)21
(17–27.7
5)
20
(15–29)
0.0
013
50.0
001
0.0
16
0.1
9
Mem
ory
0.0
6(�
0.4
1–0.5
9)
�0.4
7(�
0.7
4–�
0.0
6)�
0.1
5(�
0.5
5–0.2
1)�
0.2
2(�
0.6
1–0.1
4)
0.0
053
0.0
11
0.0
051
0.5
4
Execu
tive
�0.0
3(�
0.3
2–0.8
7)�
0.4
8(�
1.1
3–0.1
5)
�0.3
6(�
1.2
4–0.3
)�
0.0
1(�
0.6
8–0.6
8)
0.0
17
0.0
29
0.8
90.8
4
Bost
on
nam
ing
test
27
(24–28)
23
(20–26)
25
(22–27)
26
(23–28)
0.0
41
0.0
28
0.1
20.8
0
WM
H2.3
1(1
.28–5.3
6)
6.7
3(3
.22–14.1
3)
3.0
4(1
.66–6.9
)3.9
(2.1
1–5.6
9)
0.0
17
0.0
29
0.8
90.8
4
aPar
enth
esi
sin
clude
firs
tan
dth
ird
quar
tile
valu
es.
bD
ue
toin
com
ple
tedat
a,th
eperc
enta
ges
of
subje
cts
with
CSF
bio
mar
kers
colle
cted
are
50.8
%in
AD
NI-
1an
d94.3
%in
AD
NI-
GO
/2.
cC
SFam
yloid
-bgr
oups,
diff
ere
nce
sw
ere
test
ed
usi
ng
aFi
sher’s
exac
tte
st,al
loth
er
com
par
isons
were
perf
orm
ed
usi
ng
anA
NC
OVA
test
.
AD
AS-
cog
=A
lzheim
er’s
Dis
eas
eA
ssess
ment
Scal
e-C
ogn
itiv
eSu
bsc
ale;P-t
au=
phosp
hory
late
dta
u;T-
tau
=to
talta
u.
Neuroanatomical heterogeneity of prodromal AD BRAIN 2017: 140; 735–747 | 739

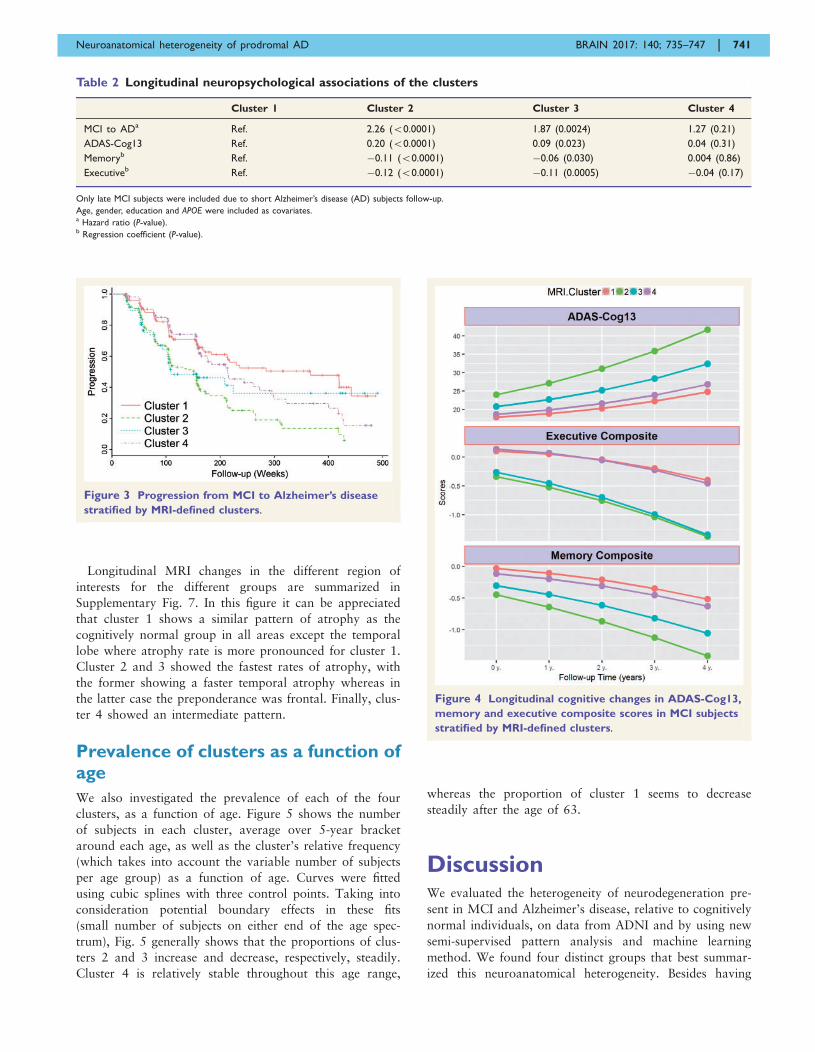
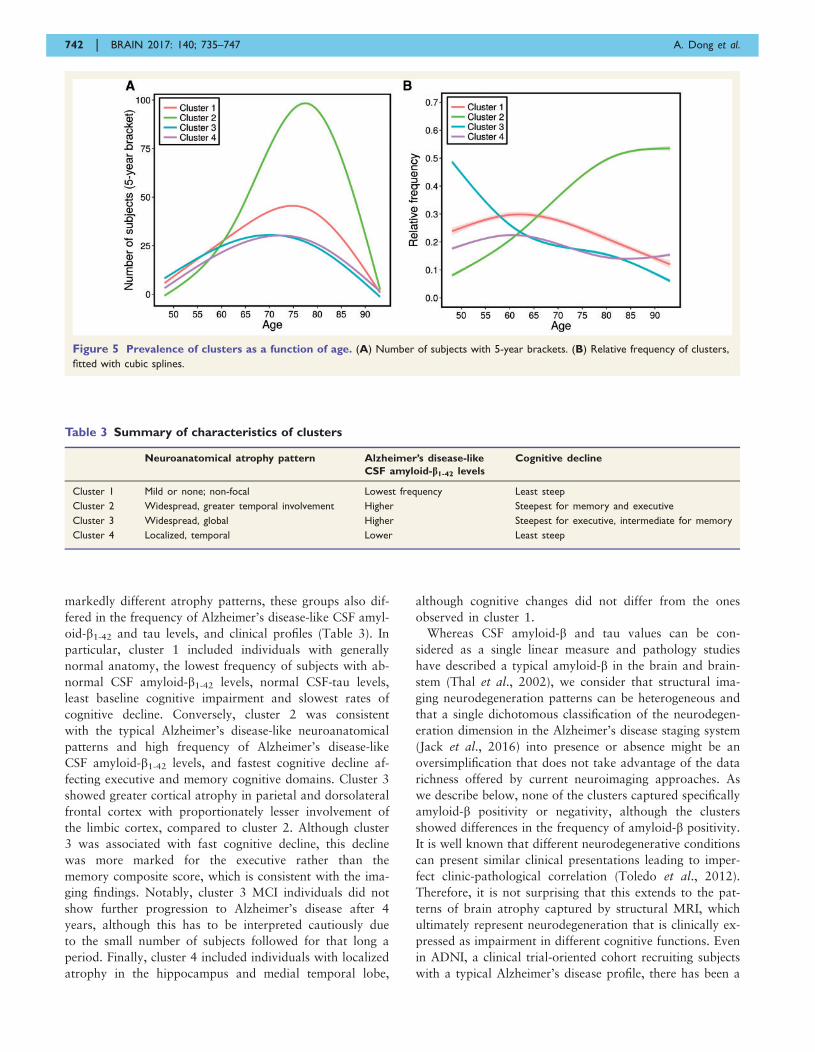
Longitudinal changes
Clusters 2 and 3 showed a faster progression from MCI to
Alzheimer’s disease, and a steeper cognitive decline in the
studied cognitive measures compared to cluster 1 (Table 2
and Figs 3 and 4). Similarly, clusters 2 and 3 showed a
more pronounced longitudinal cognitive decline than clus-
ter 1 (Fig. 3). Interestingly, whereas the rate of change of
the executive profile was similar in clusters 2 and 3 (P-
value = 0.75), cluster 3 showed a lower rate of memory
decline compared to cluster 2 (P-value = 0.039). In none
of the analyses did cluster 4 differ from cluster 1.
Supplementary Table 1 and Supplementary Figs 5 and 6
summarize the results for adjusted hippocampal volume
quartiles.
Figure 2 VBM between the identified clusters and the cognitively normal reference group for the ADNI-1 (A) and ADNI-GO/2
cohorts (B). Colour scale represents the effect size of grey matter RAVENS maps of each comparison between a cluster and cognitively normal
individuals. Red indicates greater atrophy (lower volume). Effect size maps are thresholded at false discovery rate (FDR) adjusted P-value of 0.05.
Figure 1 Venn diagram depicting number of subjects
classified tightly or loosely into clusters. Subjects with a
probability 40.5 were included within a single cluster, whereas
subjects with a highest cluster probability 50.5 are depicted in the
interphase of the two top clusters.
740 | BRAIN 2017: 140; 735–747 A. Dong et al.
Longitudinal MRI changes in the different region of
interests for the different groups are summarized in
Supplementary Fig. 7. In this figure it can be appreciated
that cluster 1 shows a similar pattern of atrophy as the
cognitively normal group in all areas except the temporal
lobe where atrophy rate is more pronounced for cluster 1.
Cluster 2 and 3 showed the fastest rates of atrophy, with
the former showing a faster temporal atrophy whereas in
the latter case the preponderance was frontal. Finally, clus-
ter 4 showed an intermediate pattern.
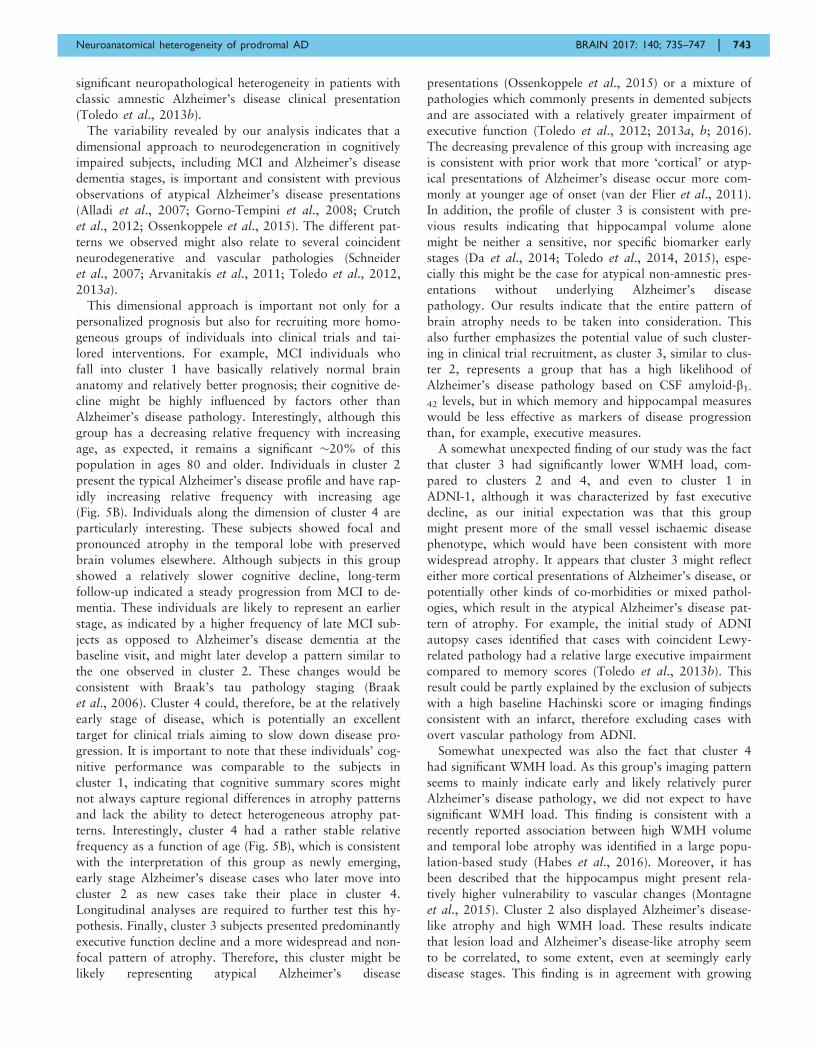
Prevalence of clusters as a function ofage
We also investigated the prevalence of each of the four
clusters, as a function of age. Figure 5 shows the number
of subjects in each cluster, average over 5-year bracket
around each age, as well as the cluster’s relative frequency
(which takes into account the variable number of subjects
per age group) as a function of age. Curves were fitted
using cubic splines with three control points. Taking into
consideration potential boundary effects in these fits
(small number of subjects on either end of the age spec-
trum), Fig. 5 generally shows that the proportions of clus-
ters 2 and 3 increase and decrease, respectively, steadily.
Cluster 4 is relatively stable throughout this age range,
whereas the proportion of cluster 1 seems to decrease
steadily after the age of 63.
DiscussionWe evaluated the heterogeneity of neurodegeneration pre-
sent in MCI and Alzheimer’s disease, relative to cognitively
normal individuals, on data from ADNI and by using new
semi-supervised pattern analysis and machine learning
method. We found four distinct groups that best summar-
ized this neuroanatomical heterogeneity. Besides having
Figure 4 Longitudinal cognitive changes in ADAS-Cog13,
memory and executive composite scores in MCI subjects
stratified by MRI-defined clusters.
Table 2 Longitudinal neuropsychological associations of the clusters
Cluster 1 Cluster 2 Cluster 3 Cluster 4
MCI to ADa Ref. 2.26 (50.0001) 1.87 (0.0024) 1.27 (0.21)
ADAS-Cog13 Ref. 0.20 (50.0001) 0.09 (0.023) 0.04 (0.31)
Memoryb Ref. �0.11 (50.0001) �0.06 (0.030) 0.004 (0.86)
Executiveb Ref. �0.12 (50.0001) �0.11 (0.0005) �0.04 (0.17)
Only late MCI subjects were included due to short Alzheimer’s disease (AD) subjects follow-up.
Age, gender, education and APOE were included as covariates.a Hazard ratio (P-value).b Regression coefficient (P-value).
Figure 3 Progression from MCI to Alzheimer’s disease
stratified by MRI-defined clusters.
Neuroanatomical heterogeneity of prodromal AD BRAIN 2017: 140; 735–747 | 741
markedly different atrophy patterns, these groups also dif-
fered in the frequency of Alzheimer’s disease-like CSF amyl-
oid-b1-42 and tau levels, and clinical profiles (Table 3). In
particular, cluster 1 included individuals with generally
normal anatomy, the lowest frequency of subjects with ab-
normal CSF amyloid-b1-42 levels, normal CSF-tau levels,
least baseline cognitive impairment and slowest rates of
cognitive decline. Conversely, cluster 2 was consistent
with the typical Alzheimer’s disease-like neuroanatomical
patterns and high frequency of Alzheimer’s disease-like
CSF amyloid-b1-42 levels, and fastest cognitive decline af-
fecting executive and memory cognitive domains. Cluster 3
showed greater cortical atrophy in parietal and dorsolateral
frontal cortex with proportionately lesser involvement of
the limbic cortex, compared to cluster 2. Although cluster
3 was associated with fast cognitive decline, this decline
was more marked for the executive rather than the
memory composite score, which is consistent with the ima-
ging findings. Notably, cluster 3 MCI individuals did not
show further progression to Alzheimer’s disease after 4
years, although this has to be interpreted cautiously due
to the small number of subjects followed for that long a
period. Finally, cluster 4 included individuals with localized
atrophy in the hippocampus and medial temporal lobe,
although cognitive changes did not differ from the ones
observed in cluster 1.
Whereas CSF amyloid-b and tau values can be con-
sidered as a single linear measure and pathology studies
have described a typical amyloid-b in the brain and brain-
stem (Thal et al., 2002), we consider that structural ima-
ging neurodegeneration patterns can be heterogeneous and
that a single dichotomous classification of the neurodegen-
eration dimension in the Alzheimer’s disease staging system
(Jack et al., 2016) into presence or absence might be an
oversimplification that does not take advantage of the data
richness offered by current neuroimaging approaches. As
we describe below, none of the clusters captured specifically
amyloid-b positivity or negativity, although the clusters
showed differences in the frequency of amyloid-b positivity.
It is well known that different neurodegenerative conditions
can present similar clinical presentations leading to imper-
fect clinic-pathological correlation (Toledo et al., 2012).
Therefore, it is not surprising that this extends to the pat-
terns of brain atrophy captured by structural MRI, which
ultimately represent neurodegeneration that is clinically ex-
pressed as impairment in different cognitive functions. Even
in ADNI, a clinical trial-oriented cohort recruiting subjects
with a typical Alzheimer’s disease profile, there has been a
Figure 5 Prevalence of clusters as a function of age. (A) Number of subjects with 5-year brackets. (B) Relative frequency of clusters,
fitted with cubic splines.
Table 3 Summary of characteristics of clusters
Neuroanatomical atrophy pattern Alzheimer’s disease-like
CSF amyloid-b1-42 levels
Cognitive decline
Cluster 1 Mild or none; non-focal Lowest frequency Least steep
Cluster 2 Widespread, greater temporal involvement Higher Steepest for memory and executive
Cluster 3 Widespread, global Higher Steepest for executive, intermediate for memory
Cluster 4 Localized, temporal Lower Least steep
742 | BRAIN 2017: 140; 735–747 A. Dong et al.
significant neuropathological heterogeneity in patients with
classic amnestic Alzheimer’s disease clinical presentation
(Toledo et al., 2013b).
The variability revealed by our analysis indicates that a
dimensional approach to neurodegeneration in cognitively
impaired subjects, including MCI and Alzheimer’s disease
dementia stages, is important and consistent with previous
observations of atypical Alzheimer’s disease presentations
(Alladi et al., 2007; Gorno-Tempini et al., 2008; Crutch
et al., 2012; Ossenkoppele et al., 2015). The different pat-
terns we observed might also relate to several coincident
neurodegenerative and vascular pathologies (Schneider
et al., 2007; Arvanitakis et al., 2011; Toledo et al., 2012,
2013a).
This dimensional approach is important not only for a
personalized prognosis but also for recruiting more homo-
geneous groups of individuals into clinical trials and tai-
lored interventions. For example, MCI individuals who
fall into cluster 1 have basically relatively normal brain
anatomy and relatively better prognosis; their cognitive de-
cline might be highly influenced by factors other than
Alzheimer’s disease pathology. Interestingly, although this
group has a decreasing relative frequency with increasing
age, as expected, it remains a significant �20% of this
population in ages 80 and older. Individuals in cluster 2
present the typical Alzheimer’s disease profile and have rap-
idly increasing relative frequency with increasing age
(Fig. 5B). Individuals along the dimension of cluster 4 are
particularly interesting. These subjects showed focal and
pronounced atrophy in the temporal lobe with preserved
brain volumes elsewhere. Although subjects in this group
showed a relatively slower cognitive decline, long-term
follow-up indicated a steady progression from MCI to de-
mentia. These individuals are likely to represent an earlier
stage, as indicated by a higher frequency of late MCI sub-
jects as opposed to Alzheimer’s disease dementia at the
baseline visit, and might later develop a pattern similar to
the one observed in cluster 2. These changes would be
consistent with Braak’s tau pathology staging (Braak
et al., 2006). Cluster 4 could, therefore, be at the relatively
early stage of disease, which is potentially an excellent
target for clinical trials aiming to slow down disease pro-
gression. It is important to note that these individuals’ cog-
nitive performance was comparable to the subjects in
cluster 1, indicating that cognitive summary scores might
not always capture regional differences in atrophy patterns
and lack the ability to detect heterogeneous atrophy pat-
terns. Interestingly, cluster 4 had a rather stable relative
frequency as a function of age (Fig. 5B), which is consistent
with the interpretation of this group as newly emerging,
early stage Alzheimer’s disease cases who later move into
cluster 2 as new cases take their place in cluster 4.
Longitudinal analyses are required to further test this hy-
pothesis. Finally, cluster 3 subjects presented predominantly
executive function decline and a more widespread and non-
focal pattern of atrophy. Therefore, this cluster might be
likely representing atypical Alzheimer’s disease
presentations (Ossenkoppele et al., 2015) or a mixture of
pathologies which commonly presents in demented subjects
and are associated with a relatively greater impairment of
executive function (Toledo et al., 2012; 2013a, b; 2016).
The decreasing prevalence of this group with increasing age
is consistent with prior work that more ‘cortical’ or atyp-
ical presentations of Alzheimer’s disease occur more com-
monly at younger age of onset (van der Flier et al., 2011).
In addition, the profile of cluster 3 is consistent with pre-
vious results indicating that hippocampal volume alone
might be neither a sensitive, nor specific biomarker early
stages (Da et al., 2014; Toledo et al., 2014, 2015), espe-
cially this might be the case for atypical non-amnestic pres-
entations without underlying Alzheimer’s disease
pathology. Our results indicate that the entire pattern of
brain atrophy needs to be taken into consideration. This
also further emphasizes the potential value of such cluster-
ing in clinical trial recruitment, as cluster 3, similar to clus-
ter 2, represents a group that has a high likelihood of
Alzheimer’s disease pathology based on CSF amyloid-b1-
42 levels, but in which memory and hippocampal measures
would be less effective as markers of disease progression
than, for example, executive measures.
A somewhat unexpected finding of our study was the fact
that cluster 3 had significantly lower WMH load, com-
pared to clusters 2 and 4, and even to cluster 1 in
ADNI-1, although it was characterized by fast executive
decline, as our initial expectation was that this group
might present more of the small vessel ischaemic disease
phenotype, which would have been consistent with more
widespread atrophy. It appears that cluster 3 might reflect
either more cortical presentations of Alzheimer’s disease, or
potentially other kinds of co-morbidities or mixed pathol-
ogies, which result in the atypical Alzheimer’s disease pat-
tern of atrophy. For example, the initial study of ADNI
autopsy cases identified that cases with coincident Lewy-
related pathology had a relative large executive impairment
compared to memory scores (Toledo et al., 2013b). This
result could be partly explained by the exclusion of subjects
with a high baseline Hachinski score or imaging findings
consistent with an infarct, therefore excluding cases with
overt vascular pathology from ADNI.
Somewhat unexpected was also the fact that cluster 4
had significant WMH load. As this group’s imaging pattern
seems to mainly indicate early and likely relatively purer
Alzheimer’s disease pathology, we did not expect to have
significant WMH load. This finding is consistent with a
recently reported association between high WMH volume
and temporal lobe atrophy was identified in a large popu-
lation-based study (Habes et al., 2016). Moreover, it has
been described that the hippocampus might present rela-
tively higher vulnerability to vascular changes (Montagne
et al., 2015). Cluster 2 also displayed Alzheimer’s disease-
like atrophy and high WMH load. These results indicate
that lesion load and Alzheimer’s disease-like atrophy seem
to be correlated, to some extent, even at seemingly early
disease stages. This finding is in agreement with growing
Neuroanatomical heterogeneity of prodromal AD BRAIN 2017: 140; 735–747 | 743
literature that shows an association between WMH load
and Alzheimer’s disease pathology, albeit our study is not
able to determine whether this association is due to shared
risk factors or to a more direct relationship in
pathophysiology.
Overall, clusters 2 and 3 presented the highest frequency
of subjects with Alzheimer’s disease-like CSF amyloid-b1-42
values, whereas cluster 1 presented a higher number of
subjects with normal CSF amyloid-b1-42 values. These find-
ings confirm that different pathologies (or combinations of
pathologies) (Toledo et al., 2013b) can present with clas-
sical amnestic MCI and Alzheimer’s disease dementia clin-
ical presentations and similarities even extends to MRI
patterns of atrophy, although the frequency of suspected
non-amyloid pathology (SNAP) cases differed between the
different clusters (4.2–36.7%) indicating that specificity
varies across the clusters.
Finally, the longitudinal MRI changes did also differ be-
tween the clusters. Clusters 2 and 3 showed the fastest de-
cline. Areas with the fastest decline corresponded to the
same areas that were more involved in baseline compari-
sons, further reinforcing baseline findings. Interestingly,
cluster 1 showed a large overlap with the cognitively
normal group, except in the temporal lobe that showed a
faster progression, therefore mainly involving Alzheimer’s
disease areas, but probably representing an early stage, at
least for part of this group.
Taken together, our findings suggest that there is remark-
able heterogeneity in patterns of brain atrophy that distin-
guish cognitively normal from MCI and patients with
Alzheimer’s disease, even in a relatively homogeneous
group of subjects as those recruited in ADNI. In particular,
a relatively normal group (cluster 1) displays only mild
atrophy. The cross-sectional and longitudinal profile of
this cluster suggests that it is heterogeneous, with some
individuals likely to progress to the other two clusters (clus-
ters 2 and 3), and some likely to remain stable for a rela-
tively long time. Individuals belonging to the cluster 4 are
likely to be at early and rapidly progressing Alzheimer’s
disease stages. Individuals in cluster 3 either represent
more cortical presentations of Alzheimer’s disease, perhaps
reflected by their younger age, or mixed pathologies other
than small vessel ischaemic disease, some of which are
likely to progress to predominantly Alzheimer’s disease de-
mentia, and others to a more executive-prominent cognitive
decline and dementia. In addition to shedding light into the
neuroanatomical heterogeneity of MCI and Alzheimer’s dis-
ease, our results suggest that patient recruitment into clin-
ical trials might benefit from a finer characterization of the
neuroanatomical phenotypes. Finally, our results suggest
that a rigorous and quantitative dimensional neuroanatom-
ical approach is necessary for neurodegenerative diseases,
in view of the underlying heterogeneity seen, even in rela-
tively selected groups of subjects like the ones of ADNI.
Supplementary Fig. 3 further underlines the limitations of
commonly used voxel-based methods in characterizing the
spectrum of neuroanatomical alterations in MCI and
Alzheimer’s disease based on a priori diagnostic definitions
that rely on disease severity. In particular, these figures in-
dicate that voxel-based analysis of regional volumes detects
the same form of brain atrophy pattern in Alzheimer’s dis-
ease dementia and MCI, with MCI pattern being more spa-
tially restricted and less pronounced. This picture is
consistent with a single typical progression pattern for
Alzheimer’s disease, presenting a milder involvement in
MCI, thereby largely missing the remarkable heterogeneity
unveiled by our results. Given that the underlying patho-
physiological mechanisms leading to brain atrophy are
complex and heterogeneous, personalized treatment deci-
sions and selection into treatment trials are likely to benefit
significantly from the dimensional approach followed
herein.
Our work differs substantially from recent clustering-
based approaches (Nettiksimmons et al., 2014). The
CHIMERA methodology used herein does not apply
direct clustering to the images themselves which could clus-
ter individuals according to anatomical characteristics such
as brain or ventricular size, demographics, and other fac-
tors not related to disease effects. In contrast, CHIMERA
estimates the disease effects by grouping the differences be-
tween patients and controls matched for these confounding
covariates. Also, previous findings (Nettiksimmons et al.,
2014) were derived from a much smaller sample drawn
only from ADNI-1 using a limited number of features to
perform the clustering (11 basic features, including brain,
ventricular and hippocampal volumes) and seemed to have
been significantly affected by outliers in the data (e.g. clus-
ter 4 of the aforementioned publication included only seven
individuals of likely very extreme measurements, which are
arguably outliers). However, our findings are generally in
agreement with (Nettiksimmons et al., 2014), especially the
existence of a subpopulation of MCI which is almost en-
tirely normal in all measures, and a subpopulation which
seems to display a typical Alzheimer’s disease-like pattern,
albeit their results reveal additional heterogeneity.
Another previous study described three patterns of neuro-
fibrillary tangle deposition based on a priori definitions
(Murray et al., 2011). These groups were described as hip-
pocampal-sparing, limbic-predominant and typical
Alzheimer’s disease, and were later characterized using
structural MRIs (Whitwell et al., 2012). Our findings also
confirm the presence of subpopulations in MCI and
Alzheimer’s disease-dementia subjects with different degrees
of limbic and extra-limbic pathologic that in some cases do
not follow the pattern expected based on tau neurofibrillary
tangle tau staging (Braak et al., 2006). In our study, cases
with a lesser limbic involvement (cluster 3) were also
younger than cases with typical Alzheimer’s disease atro-
phy, although we found larger dorsolateral prefrontal
cortex atrophy. As noted above, cluster 3 is likely to in-
clude patients with more cortical disease in young onset
cases as described in van der Flier et al. (2011).
Grouping subjects based on adjusted hippocampal
volume quartiles led to a linear staging of patient atrophy,
744 | BRAIN 2017: 140; 735–747 A. Dong et al.
primarily reflecting hippocampal volume, as expected.
However, these maps failed to reveal remarkable hetero-
geneity highlighted by our clustering analysis, including
cluster 3 which was characterized by substantial and wide-
spread cortical atrophy but relatively preserved hippocam-
pal volumes. We have also calculated conversion and
longitudinal cognitive models in Supplementary Figs 5
and 6. Although four adjusted hippocampal volume quar-
tiles were studied, analyses showed that patterns just rep-
resented two subgroups: 75% of the subjects who
progressed rapidly and the remaining 25% who remained
more stable. The experiments showed that our analysis
were focused on delineating imaging patterns throughout
the brain, whereas hippocampal volumes are very import-
ant biomarker of memory decline but yet not sufficiently
rich or specific in capturing heterogeneity of atrophy
throughout the entire brain.
Limitations of this study are the smaller sample for
ADNI-GO/2, which led to small numbers in some clusters,
and the relative homogeneity of subjects recruited in the
study, which namely were recruited as late MCI subjects
with and Alzheimer’s disease-like clinical presentation
or early Alzheimer’s disease dementia type subjects.
Future studies should expand to more heterogeneous
populations.
AcknowledgementsData used in preparation of this article were obtained from
the Alzheimer’s disease Neuroimaging Initiative (ADNI)
database (adni.loni.usc.edu). As such, the investigators
within the ADNI contributed to the design and implemen-
tation of ADNI and/or provided data but did not partici-
pate in analysis or writing of this report. A complete listing
of ADNI investigators can be found at: http://adni.loni.usc.
edu/wp-content/uploads/how_to_apply/ADNI_Acknowled-
gement_List.pdf.
FundingADNI is funded by the National Institute on Aging, the
National Institute of Biomedical Imaging and
Bioengineering, and through generous contributions from
the following: Alzheimer’s Association; Alzheimer’s Drug
Discovery Foundation; Araclon Biotech; BioClinica, Inc.;
Biogen Idec Inc.; Bristol-Myers Squibb Company; Eisai Inc.;
Elan Pharmaceuticals, Inc.; Eli Lilly and Company;
EuroImmun; F. Hoffmann-La Roche Ltd and its affiliated
company Genentech, Inc.; Fujirebio; GE Healthcare; IXICO
Ltd.; Janssen Alzheimer Immunotherapy Research &
Development, LLC.; Johnson & Johnson Pharmaceutical
Research & Development LLC.; Medpace, Inc.; Merck &
Co., Inc.; Meso Scale Diagnostics, LLC.; NeuroRx Research;
Neurotrack Technologies; Novartis Pharmaceuticals
Corporation; Pfizer Inc.; Piramal Imaging; Servier; Synarc
Inc.; and Takeda Pharmaceutical Company. The Canadian
Institutes Health Research is providing funds to support
ADNI clinical sites in Canada. Private sector contributions
are facilitated by the Foundation for the National Institutes
of Health (www.fnih.org). The grantee organization is the
Northern California Institute for Research and Education,
and the study is coordinated by the Alzheimer’s Disease
Cooperative Study at the University of California, San
Diego. ADNI data are disseminated by the Laboratory for
Neuro Imaging at the University of Southern California.
A.D., N.H., J.D., E.V., A.S. and C.D. are supported by
R01AG14971. J.B.T. is supported by P01AG032953,
P01AG017586, P30AG010124 and P50NS053488.
Supplementary materialSupplementary material is available at Brain online.
ReferencesAlladi S, Xuereb J, Bak T, Nestor P, Knibb J, Patterson K, et al. Focal
cortical presentations of Alzheimer’s disease. Brain 2007; 130:
2636–45.
Arvanitakis Z, Leurgans SE, Barnes LL, Bennett DA, Schneider JA.
Microinfarct pathology, dementia, and cognitive systems. Stroke
2011; 42: 722–7.
Ashburner J, Friston KJ. Voxel-based morphometry—the methods.
Neuroimage 2000; 11: 805–21.Braak H, Alafuzoff I, Arzberger T, Kretzschmar H, Del Tredici K.
Staging of Alzheimer disease-associated neurofibrillary pathology
using paraffin sections and immunocytochemistry. Acta
Neuropathol 2006; 112: 389–404.
Busatto GF, Diniz BS, Zanetti MV. Voxel-based morphometry in
Alzheimer’s disease. Expert Rev Neurother 2008; 8: 1691–702.
Cox RW. AFNI: software for analysis and visualization of functional
magnetic resonance neuroimages. Comput Biomed Res 1996; 29:
162–73.
Crane PK, Carle A, Gibbons LE, Insel P, Mackin RS, Gross A, et al.
Development and assessment of a composite score for memory in
the Alzheimer’s Disease Neuroimaging Initiative (ADNI). Brain
Imaging Behav 2012; 6: 502–16.Crutch SJ, Lehmann M, Schott JM, Rabinovici GD, Rossor MN, Fox
NC. Posterior cortical atrophy. Lancet Neurol 2012; 11: 170–8.
Da X, Toledo JB, Zee J, Wolk DA, Xie SX, Ou Y, et al. Integration
and relative value of biomarkers for prediction of MCI to AD pro-
gression: spatial patterns of brain atrophy, cognitive scores, APOE
genotype and CSF biomarkers. Neuroimage Clin 2014; 4: 164–73.
Davatzikos C, Genc A, Xu D, Resnick SM. Voxel-based morphometry
using the RAVENS maps: methods and validation using simulated
longitudinal atrophy. Neuroimage 2001; 14: 1361–9.
DeCarli C, Fletcher E, Ramey V, Harvey D, Jagust WJ. Anatomical
mapping of white matter hyperintensities (wmh) exploring the rela-
tionships between periventricular WMH, deep WMH, and total
WMH burden. Stroke 2005; 36: 50–5.Dong A, Honnorat N, Gaonkar B, Davatzikos C. CHIMERA: cluster-
ing of heterogeneous disease effects via distribution matching of
imaging patterns. IEEE Trans Med Imaging 2016; 35: 612–21.
Doshi J, Erus G, Ou Y, Gaonkar B, Davatzikos C. Multi-atlas skull-
stripping. Acad Radiol 2013; 20: 1566–76.
Doshi J, Erus G, Ou Y, Resnick SM, Gur RC, Gur RE, et al. MUSE:
MUlti-atlas region segmentation utilizing ensembles of registration
Neuroanatomical heterogeneity of prodromal AD BRAIN 2017: 140; 735–747 | 745
algorithms and parameters, and locally optimal atlas selection.
Neuroimage 2016; 127: 186–95.
Gibbons LE, Carle AC, Mackin RS, Harvey D, Mukherjee S, Insel P,
et al. A composite score for executive functioning, validated in
Alzheimer’s Disease Neuroimaging Initiative (ADNI) participants
with baseline mild cognitive impairment. Brain Imaging Behav
2012; 6: 517–27.
Gorno-Tempini ML, Brambati SM, Ginex V, Ogar J, Dronkers NF,
Marcone A, et al. The logopenic/phonological variant of primary
progressive aphasia. Neurology 2008; 71: 1227–34.
Habes M, Erus G, Toledo JB, Zhang T, Bryan N, Launer LJ, et al.
White matter hyperintensities and imaging patterns of brain ageing
in the general population. Brain 2016; 139 (Pt 4): 1164–79.
Hurd MD, Martorell P, Delavande A, Mullen KJ, Langa KM.
Monetary costs of dementia in the United States. N Engl J Med
2013; 368: 1326–34.
Jack CR, Bennett DA, Blennow K, Carrillo MC, Feldman HH, Frisoni
GB, et al. A/T/N: an unbiased descriptive classification scheme for
Alzheimer disease biomarkers. Neurology 2016; 87: 539–47.
Jack CR, Bernstein MA, Fox NC, Thompson P, Alexander G, Harvey
D, et al. The Alzheimer’s disease neuroimaging initiative (ADNI):
MRI methods. J Magn Reson Imaging 2008; 27: 685–91.
Jack CR, Wiste HJ, Weigand SD, Knopman DS, Mielke MM, Vemuri
P, et al. Different definitions of neurodegeneration produce similar
amyloid/neurodegeneration biomarker group findings. Brain 2015;
138: 3747–59.
Karas GB, Scheltens P, Rombouts SARB, Visser PJ, van Schijndel RA,
Fox NC, et al. Global and local gray matter loss in mild cognitive
impairment and Alzheimer’s disease. Neuroimage 2004; 23: 708–16.
Kloppel S, Stonnington CM, Chu C, Draganski B, Scahill RI, Rohrer
JD, et al. Automatic classification of MR scans in Alzheimer’s dis-
ease. Brain 2008; 131: 681–9.
Lam B, Masellis M, Freedman M, Stuss DT, Black SE. Clinical, ima-
ging, and pathological heterogeneity of the Alzheimer’s disease syn-
drome. Alzheimers Res Ther 2013; 5: 1.
Larner AJ. Getting it wrong: the clinical misdiagnosis of Alzheimer’s
disease. Int J Clin Pract 2004; 58: 1092–4.
Li C, Gore JC, Davatzikos C. Multiplicative intrinsic component op-
timization (MICO) for MRI bias fi eld estimation and tissue segmen-
tation. Magn Reson Imaging 2014; 32: 913–23.
McKeith IG, Fairbairn AF, Perry RH, Thompson P. The clinical diag-
nosis and misdiagnosis of senile dementia of Lewy body type
(SDLT). Br J Psychiatry 1994; 165: 324–32.
McKhann G, Drachman D, Folstein M, Katzman R, Price D, Stadlan
EM. Clinical diagnosis of Alzheimer’s disease: report of the
NINCDS–ADRDA Work Group under the auspices of Department
of Health and Human Services Task Force on Alzheimer’s Disease.
Neurology 2011; 77: 333.
Misra C, Fan Y, Davatzikos C. Baseline and longitudinal patterns of
brain atrophy in MCI patients, and their use in prediction of short-
term conversion to AD: results from ADNI. Neuroimage 2009; 44:
1415–22.
Montagne A, Barnes SR, Sweeney MD, Halliday MR, Sagare AP,
Zhao Z, et al. Blood-brain barrier breakdown in the aging human
hippocampus. Neuron 2015; 85: 296–302.
Murray ME, Graff-Radford NR, Ross OA, Petersen RC, Duara R,
Dickson DW. Neuropathologically defined subtypes of Alzheimer’s
disease with distinct clinical characteristics: a retrospective study.
Lancet Neurol 2011; 10: 785–96.
Nettiksimmons J, DeCarli C, Landau S, Beckett L; Alzheimer’s Disease
Neuroimaging Initiative. Biological heterogeneity in ADNI amnestic
mild cognitive impairment. Alzheimer’s Dement 2014; 10: 511–21.
Noh Y, Jeon S, Lee JM, Seo SW, Kim GH, Cho H, et al. Anatomical
heterogeneity of Alzheimer disease based on cortical thickness on
MRIs. Neurology 2014; 83: 1936–44.
Ossenkoppele R, Pijnenburg YAL, Perry DC, Cohn-Sheehy BI,
Scheltens NME, Vogel JW, et al. The behavioural/dysexecutive
variant of Alzheimer’s disease: clinical, neuroimaging and patho-
logical features. Brain 2015; 138: 2732–49.
Ou Y, Sotiras A, Paragios N, Davatzikos C. DRAMMS: deformable
registration via attribute matching and mutual-saliency weighting.
Med Image Anal 2011; 15: 622–39.
Petersen R, Smith G, Waring S, Ivnik R, Tangalos E, Kokmen E. Mild
cognitive impairment: clinical characterization and outcome. JAMA
Neurol 1999; 56: 303–8.
Petersen RC, Aisen PS, Beckett LA, Donohue MC, Gamst AC, Harvey
DJ, et al. Alzheimer’s Disease Neuroimaging Initiative (ADNI): clin-
ical characterization. Neurology 2010; 74: 201–9.R Core Team. R: a language and environment for statistical comput-
ing. Vienna, Austria: R Core Team; 2016.Reuter M, Rosas HD, Fischl B. Highly accurate inverse consistent
registration: a robust approach. Neuroimage 2010; 53: 1181–96.Reuter M, Schmansky NJ, Rosas HD, Fischl B. Within-subject tem-
plate estimation for unbiased longitudinal image analysis.
Neuroimage 2012; 61: 1402–18.
Schneider JA, Arvanitakis Z, Bang W, Bennett DA. Mixed brain
pathologies account for most dementia cases in community-dwelling
older persons. Neurology 2007; 69: 2197–204.
Schwarz C, Fletcher E, DeCarli C, Carmichael O. Fully-automated
white matter hyperintensity detection with anatomical prior know-
ledge and without FLAIR. Inf Process Med Imaging 2009; 21: 239–
51.Shaw LM, Vanderstichele H, Knapik-Czajka M, Clark CM, Aisen PS,
Petersen RC, et al. Cerebrospinal fluid biomarker signature in
Alzheimer’s disease neuroimaging initiative subjects. Ann Neurol
2009; 65: 403–13.
Shaw LM, Vanderstichele H, Knapik-Czajka M, Figurski M, Coart E,
Blennow K, et al. Qualification of the analytical and clinical per-
formance of CSF biomarker analyses in ADNI. Acta Neuropathol
2011; 121: 597–609.Shiino A, Watanabe T, Maeda K, Kotani E, Akiguchi I, Matsuda M.
Four subgroups of Alzheimer’s disease based on patterns of atrophy
using VBM and a unique pattern for early onset disease.
Neuroimage 2006; 33: 17–26.
Thal DR, Rub U, Orantes M, Braak H. Phases of Ab-deposition in the
human brain and its relevance for the development of AD.
Neurology 2002; 58: 1791–800.
Toledo JB, Arnold SE, Raible K, Brettschneider J, Xie SX, Grossman
M, et al. Contribution of cerebrovascular disease in autopsy con-
firmed neurodegenerative disease cases in the National Alzheimer’s
Coordinating Centre. Brain 2013a; 136: 2697–706.
Toledo JB, Bjerke M, Chen K, Rozycki M, Jack CR, Weiner MW,
et al. Memory, executive, and multidomain subtle cognitive impair-
ment clinical and biomarker findings. Neurology 2015; 85: 144–53.
Toledo JB, Brettschneider J, Grossman M, Arnold SE, Hu WT, Xie
SX, et al. CSF biomarkers cutoffs: the importance of coincident
neuropathological diseases. Acta Neuropathol 2012; 124: 23–35.
Toledo JB, Cairns NJ, Da X, Chen K, Carter D, Fleisher A, et al.
Clinical and multimodal biomarker correlates of ADNI neuropatho-
logical findings. Acta Neuropathol Commun 2013b; 1: 65.Toledo JB, Gopal P, Raible K, Irwin DJ, Brettschneider J, Sedor S,
et al. Pathological �-synuclein distribution in subjects with coinci-
dent Alzheimer’s and Lewy body pathology. Acta Neuropathol
2016: 131: 393–409.
Toledo JB, Weiner MW, Wolk DA, Da X, Chen K, Arnold SE, et al.
Neuronal injury biomarkers and prognosis in ADNI subjects with
normal cognition. Acta Neuropathol Commun 2014; 2: 26.
van der Flier WM, Pijnenburg YAL, Fox NC, Scheltens P. Early-onset
versus late-onset Alzheimer’s disease: the case of the missing APOE
"4 allele. Lancet Neurol 2011; 10: 280–8.Weiner MW, Veitch DP, Aisen PS, Beckett LA, Cairns NJ, Cedarbaum
J, et al. Impact of the Alzheimer’s disease neuroimaging initiative,
2004 to 2014. Alzheimers Dement 2015; 11: 865–84.
Whitwell JL, Dickson DW, Murray ME, Weigand SD, Tosakulwong
N, Senjem ML, et al. Neuroimaging correlates of pathologically
746 | BRAIN 2017: 140; 735–747 A. Dong et al.

defined subtypes of Alzheimer’s disease: a case-control study. LancetNeurol 2012; 11: 868–77.
Wilson RS, Yu L, Trojanowski JQ, Chen E-Y, Boyle PA, Bennett DA,
et al. TDP-43 pathology, cognitive decline, and dementia in old age.
JAMA Neurol 2013; 70: 1418–24.
Zanetti M, Ballabio C, Abbate C, Cutaia C, Vergani C, Bergamaschini
L. Mild cognitive impairment subtypes and vascular dementia in
community-dwelling elderly people: a 3-year follow-up study.
J Am Geriatr Soc 2006; 54: 580–6.
Neuroanatomical heterogeneity of prodromal AD BRAIN 2017: 140; 735–747 | 747