Embed Size (px)
Citation preview
Hertzsprung-Russell DiagramHertzsprung-Russell DiagramHertzsprung-Russell DiagramHertzsprung-Russell Diagram
Section 8.2 Section 8.2
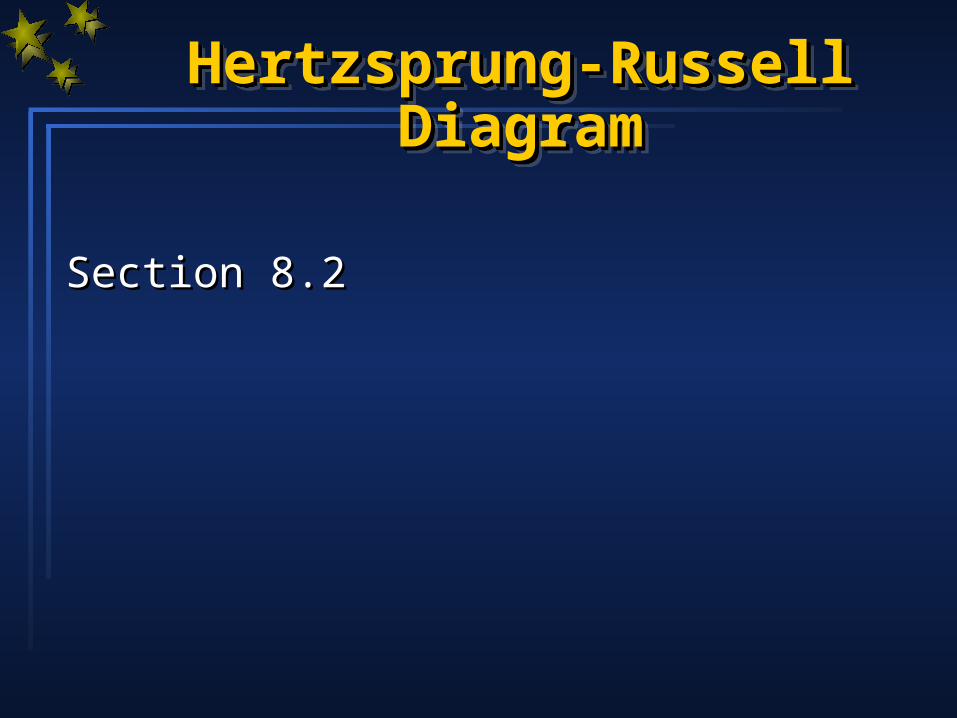
The story thus farThe story thus farThe story thus farThe story thus far
Masses, RadiiMasses, RadiiBinary stars (visual, Binary stars (visual, spectroscopic, eclipsing)spectroscopic, eclipsing)
Temperatures, Temperatures, composition, surface composition, surface gravity, Luminosity classgravity, Luminosity class
SpectrumSpectrum
Temperatures, TTemperatures, TColour Index (B-V) (+ Colour Index (B-V) (+ black body curve)black body curve)
Luminosities, L Luminosities, L (absolute magitudes)(absolute magitudes)
Flux, F, at Earth, apparent Flux, F, at Earth, apparent magnitude (with d + inverse square magnitude (with d + inverse square law) law)
Distances, dDistances, dParallax, moving clusterParallax, moving clusterCalculated propertyCalculated propertyObserved quantityObserved quantity
But what about…… ages, how stars are born, how they shine, how they die?
HR Diagram - introductionHR Diagram - introductionHR Diagram - introductionHR Diagram - introduction
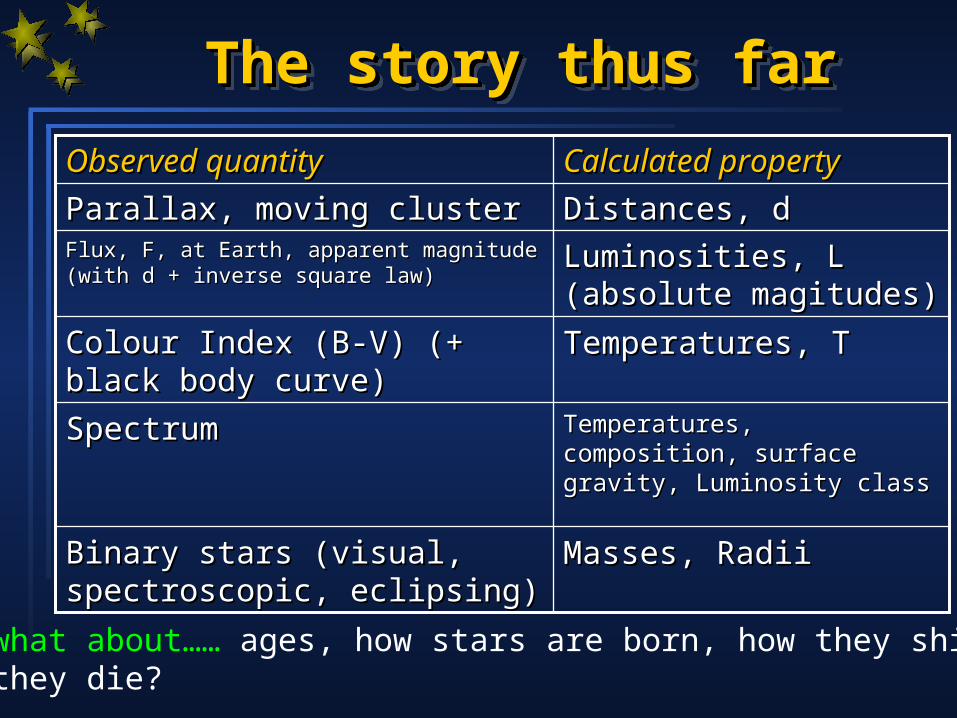
Make a plot of Make a plot of height vs height vs weight for weight for students in students in classclass
Supermodels
New-born babies
B-ball players
Sumo wrestlers
Adults
Children
Mass
Height
Height Height increasing increasing upward - upward - mass mass increasing increasing to leftto left
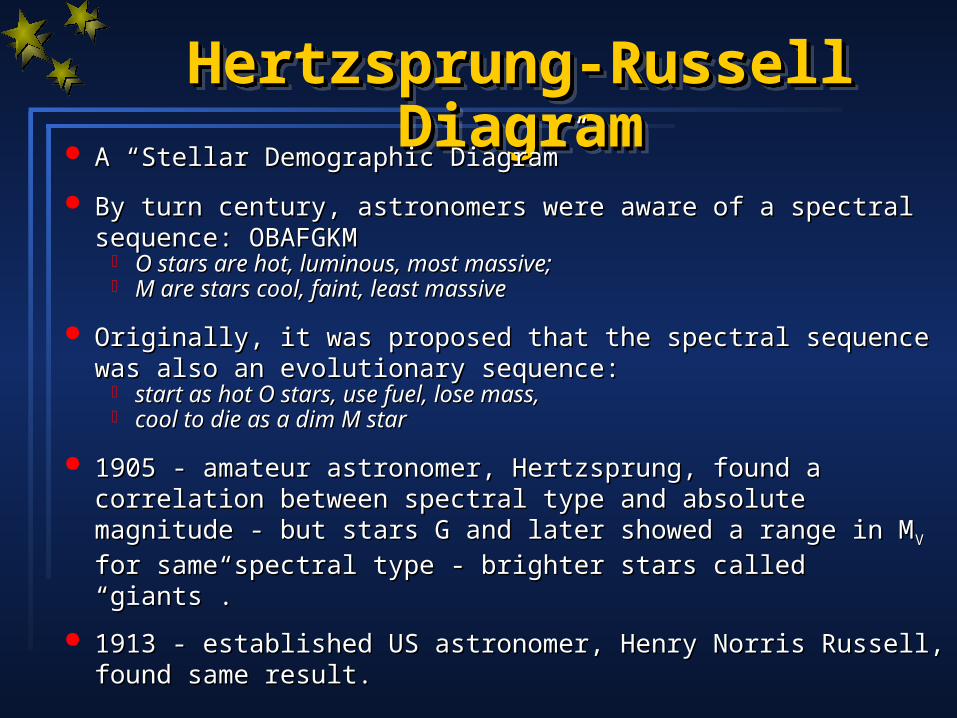
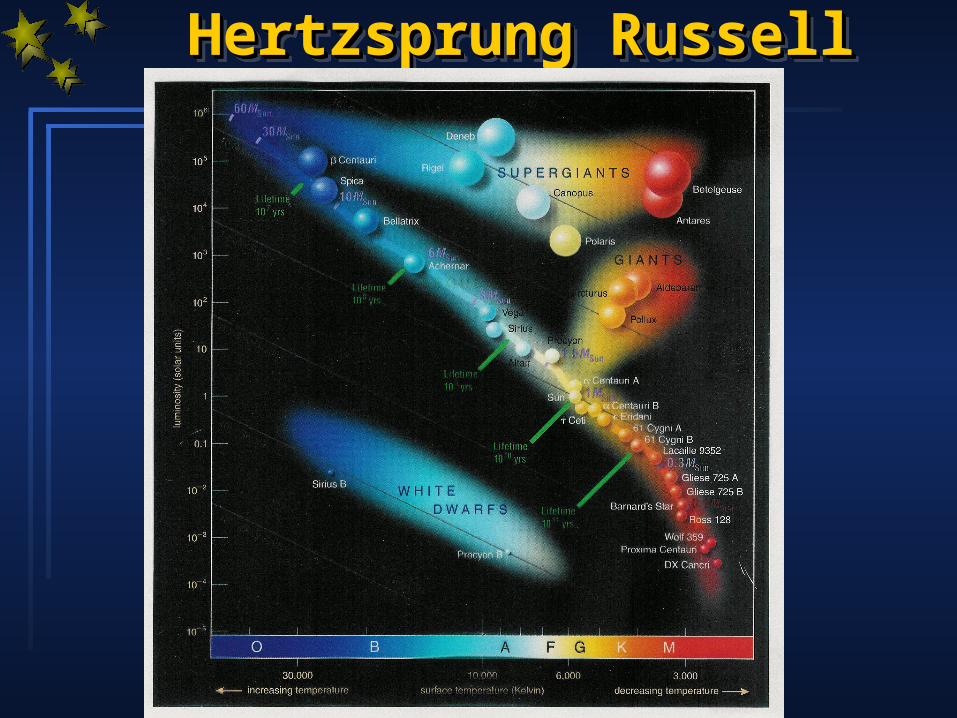
Hertzsprung-Russell DiagramHertzsprung-Russell DiagramHertzsprung-Russell DiagramHertzsprung-Russell Diagram A “Stellar Demographic Diagram”A “Stellar Demographic Diagram”
By turn century, astronomers were aware of a By turn century, astronomers were aware of a spectral sequence: OBAFGKM spectral sequence: OBAFGKM O stars are hot, luminous, most massive; O stars are hot, luminous, most massive; M are stars cool, faint, least massiveM are stars cool, faint, least massive
Originally, it was proposed that the spectral Originally, it was proposed that the spectral sequence was also an evolutionary sequence: sequence was also an evolutionary sequence: start as hot O stars, use fuel, lose mass, start as hot O stars, use fuel, lose mass, cool to die as a dim M starcool to die as a dim M star
1905 - amateur astronomer, Hertzsprung, found a 1905 - amateur astronomer, Hertzsprung, found a correlation between spectral type and absolute correlation between spectral type and absolute magnitude - but stars G and later showed a range in magnitude - but stars G and later showed a range in MMVV for same spectral type - brighter stars called for same spectral type - brighter stars called “giants”. “giants”.
1913 - established US astronomer, Henry Norris 1913 - established US astronomer, Henry Norris Russell, found same result.Russell, found same result.
Hertzsprung-Russell DiagramHertzsprung-Russell DiagramHertzsprung-Russell DiagramHertzsprung-Russell Diagram
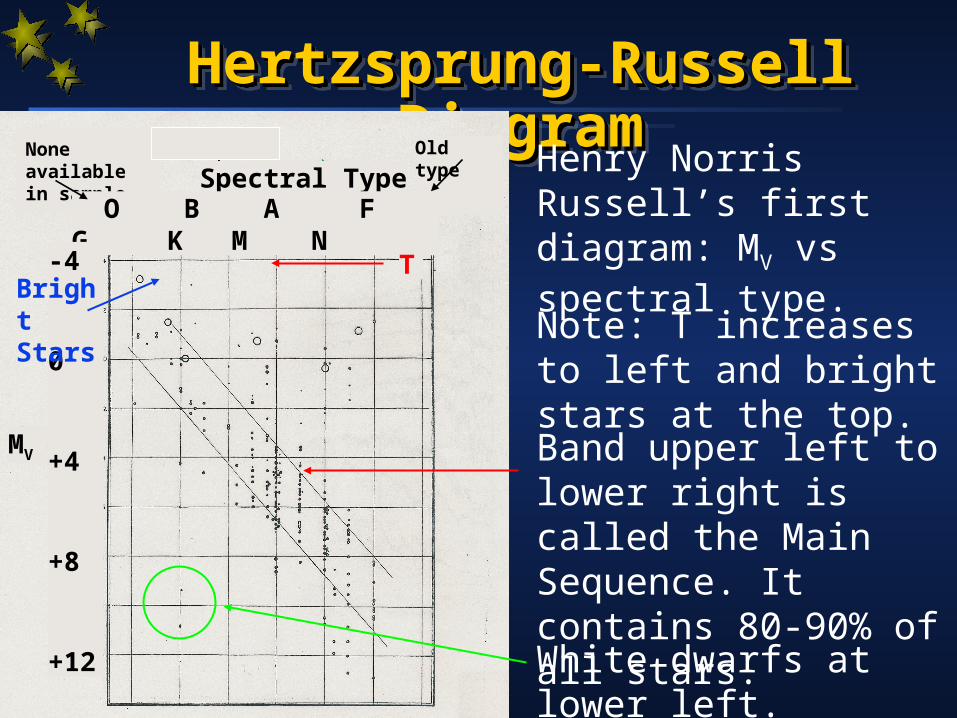
Henry Norris Russell’s first diagram: MV vs spectral type.
None available in sample
Old type Spectral
Type O B A F G K M N
-4
0
+4
+8
+12
MV
Note: T increases to left and bright stars at the top.
TBright Stars
Band upper left to lower right is called the Main Sequence. It contains 80-90% of all stars.White dwarfs at lower left.
Hertzsprung-Russell DiagramHertzsprung-Russell DiagramHertzsprung-Russell DiagramHertzsprung-Russell Diagram
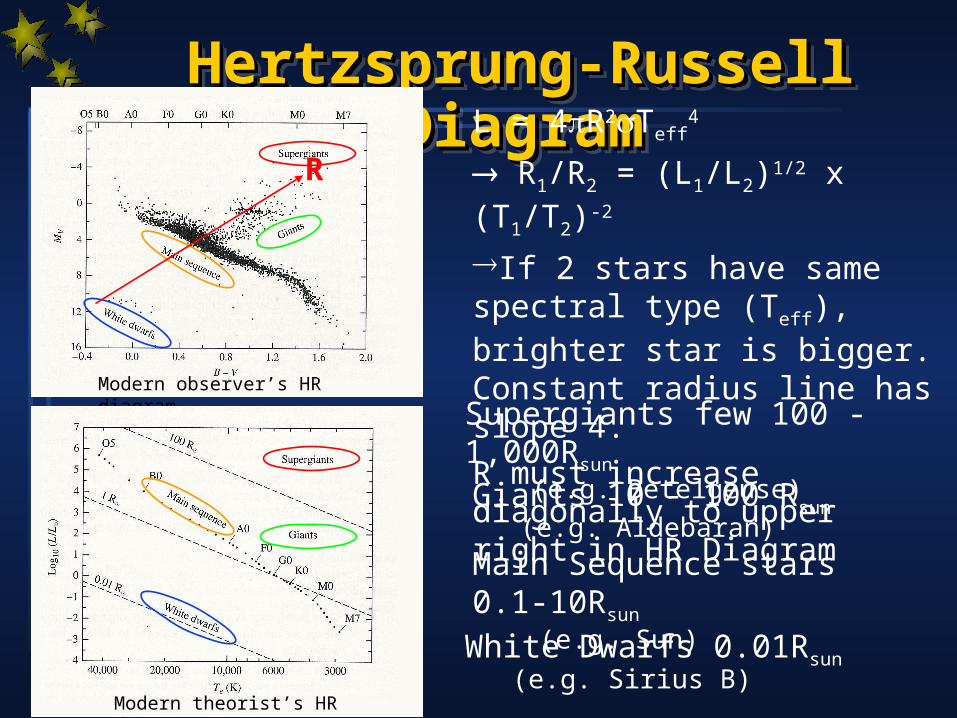
L = 4R2Teff
4
R1/R2 = (L1/L2)1/2 x (T1/T2)-2
If 2 stars have same spectral type (Teff), brighter star is bigger. Constant radius line has slope 4.R must increase diagonally to upper right in HR Diagram
Modern observer’s HR diagram
Modern theorist’s HR diagram
Supergiants few 100 - 1,000Rsun
(e.g. Betelgeuse)
Main Sequence stars 0.1-10Rsun
(e.g. Sun)White Dwarfs 0.01Rsun (e.g. Sirius B)
Giants 10 - 100 Rsun (e.g. Aldebaran)
R
Mass-Luminosity RelationMass-Luminosity RelationMass-Luminosity RelationMass-Luminosity Relation
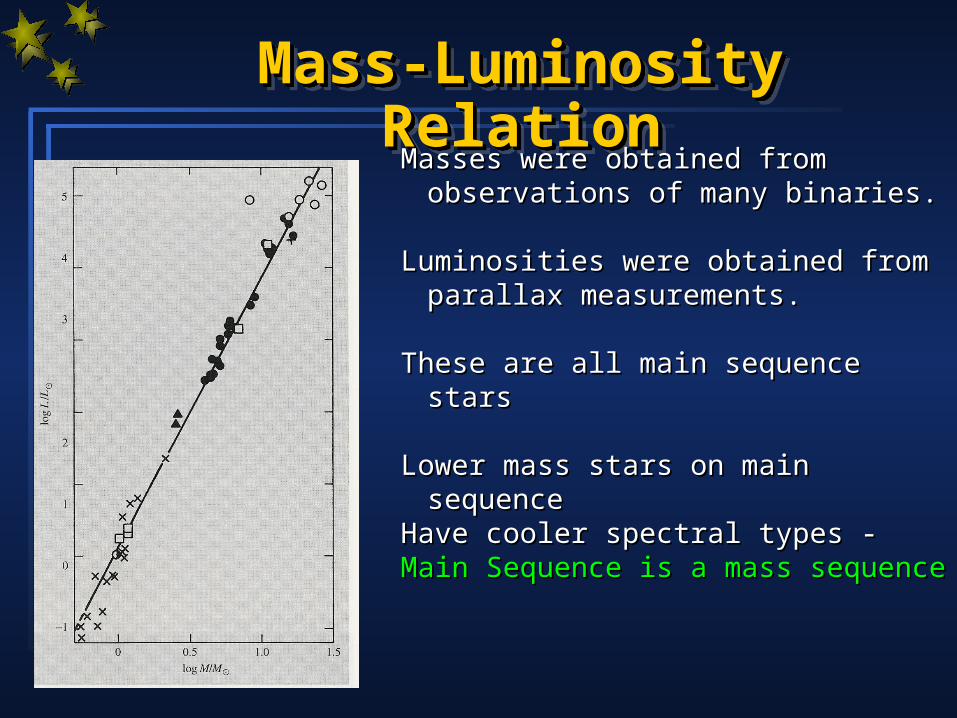
Masses were obtained from Masses were obtained from observations of many binaries.observations of many binaries.
Luminosities were obtained from Luminosities were obtained from parallax measurements. parallax measurements.
These are all main sequence These are all main sequence starsstars
Lower mass stars on main Lower mass stars on main sequencesequence
Have cooler spectral types -Have cooler spectral types -Main Sequence is a mass sequenceMain Sequence is a mass sequence
Hertzsprung Russell DiagramHertzsprung Russell DiagramHertzsprung Russell DiagramHertzsprung Russell Diagram

Sun
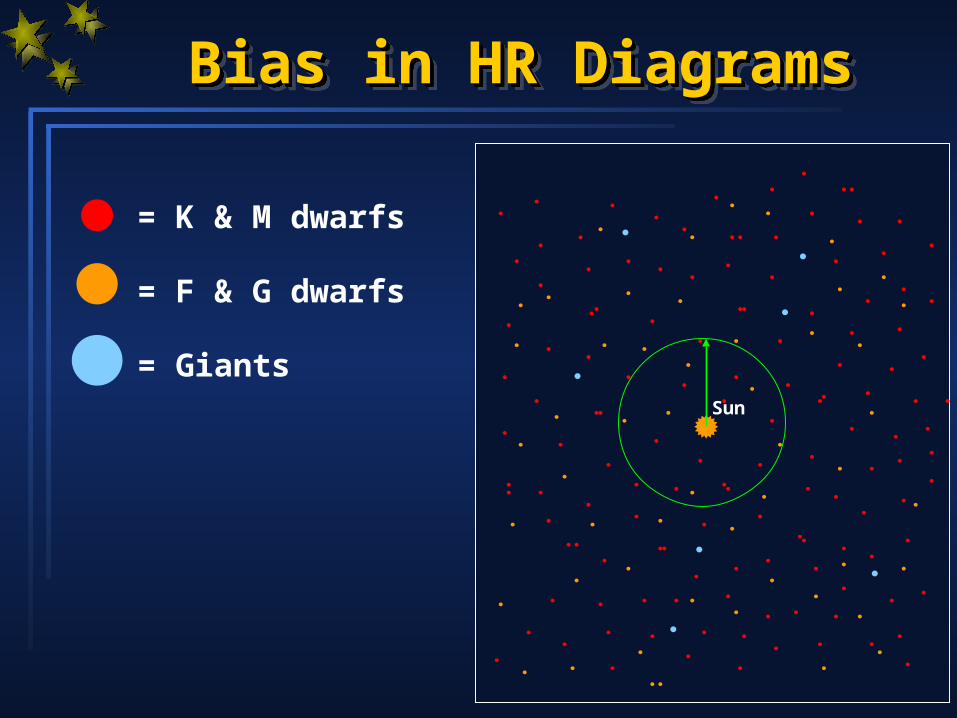
Bias in HR DiagramsBias in HR DiagramsBias in HR DiagramsBias in HR Diagrams
= K & M dwarfs
= F & G dwarfs
= Giants
Sun
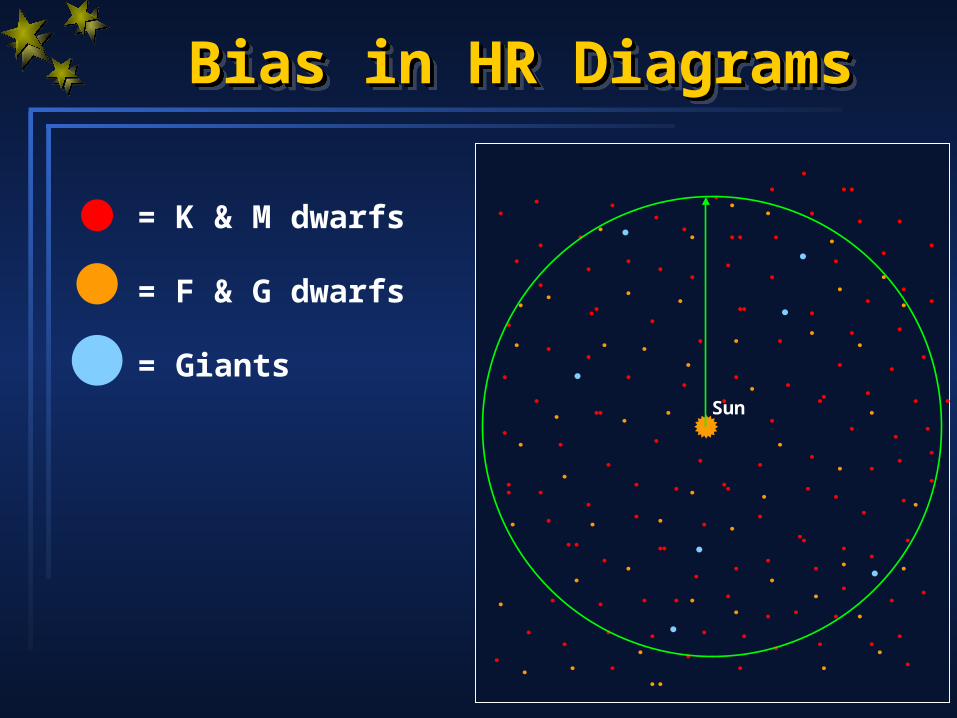
Bias in HR DiagramsBias in HR DiagramsBias in HR DiagramsBias in HR Diagrams
= K & M dwarfs
= F & G dwarfs
= Giants
Sun
Bias in HR DiagramsBias in HR DiagramsBias in HR DiagramsBias in HR Diagrams
= K & M dwarfs
= F & G dwarfs
= Giants
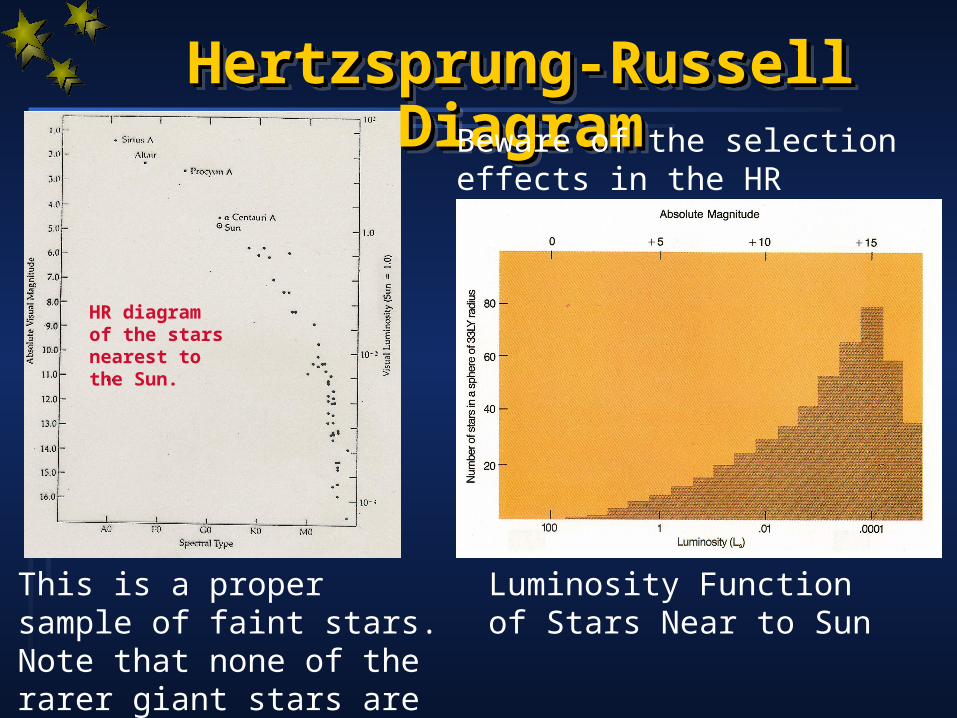
Hertzsprung-Russell DiagramHertzsprung-Russell DiagramHertzsprung-Russell DiagramHertzsprung-Russell Diagram
This is a proper sample of faint stars. Note that none of the rarer giant stars are within this volume of space.
Beware of the selection effects in the HR Diagram
HR diagram of the stars nearest to the Sun.
Luminosity Function of Stars Near to Sun
Hertzsprung-Russell DiagramHertzsprung-Russell DiagramHertzsprung-Russell DiagramHertzsprung-Russell Diagram
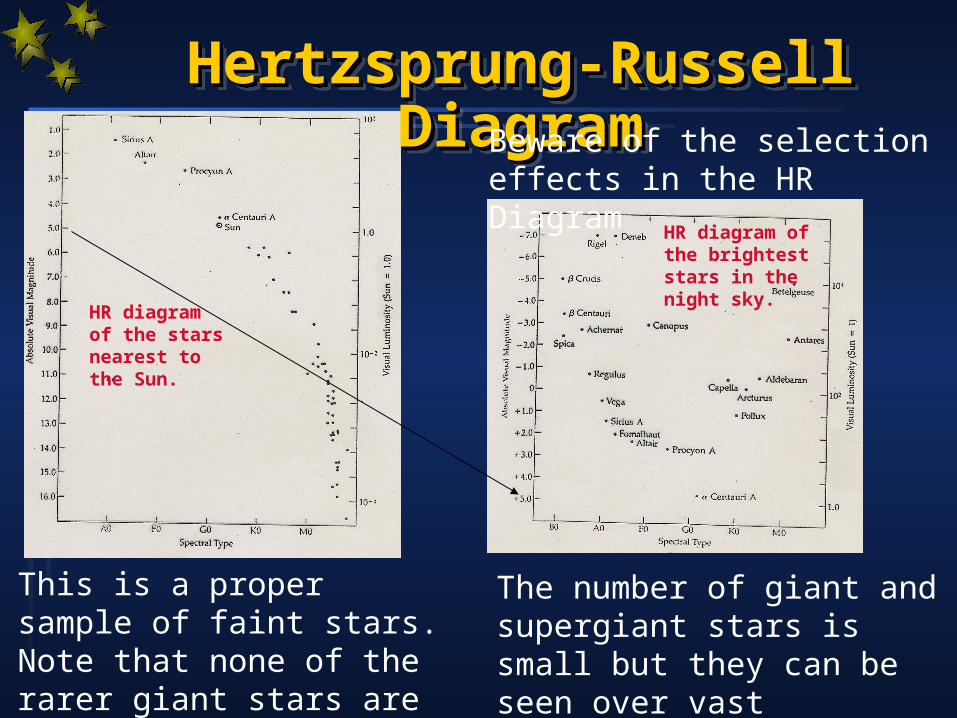
This is a proper sample of faint stars. Note that none of the rarer giant stars are within this volume of space.
The number of giant and supergiant stars is small but they can be seen over vast distances.
Beware of the selection effects in the HR Diagram
HR diagram of the stars nearest to the Sun.
HR diagram of the brightest stars in the night sky.