Embed Size (px)
Citation preview
Hertzian impact: Experimental study of the force pulse andresulting stress waves
Gregory C. McLaskeya� and Steven D. GlaserDepartment of Civil and Environmental Engineering, University of California, Berkeley, 621A Sutardja DaiHall (CITRIS Building), Berkeley, California 94720-1758
�Received 22 March 2010; revised 11 June 2010; accepted 21 June 2010�
Ball impact has long been used as a repeatable source of stress waves in solids. The amplitude andfrequency content of the waves are a function of the force-time history, or force pulse, that the ballimposes on the massive body. In this study, Glaser-type conical piezoelectric sensors are used tomeasure vibrations induced by a ball colliding with a massive plate. These measurements arecompared with theoretical estimates derived from a marriage of Hertz theory and elastic wavepropagation. The match between experiment and theory is so close that it not only facilitates theabsolute calibration the sensors but it also allows the limits of Hertz theory to be probed. Glass, rubyand hardened steel balls 0.4 to 2.5 mm in diameter were dropped onto steel, glass, aluminum, andpolymethylmethacrylate plates at a wide range of approach velocities, delivering frequencies up to1.5 MHz into these materials. Effects of surface properties and yielding of the plate material wereanalyzed via the resulting stress waves and simultaneous measurements of the ball’s coefficient ofrestitution. The sensors are sensitive to surface normal displacements down to about �1 pm in thefrequency range of 20 kHz to over 1 MHz.© 2010 Acoustical Society of America. �DOI: 10.1121/1.3466847�
PACS number�s�: 43.40.Kd, 43.38.Fx, 43.64.Yp �RLW� Pages: 1087–1096
I. INTRODUCTION
The normal impact of a ball on a massive body has beenextensively used as a source of stress waves for non-destructive testing techniques such as impact echo andacoustic emission �e.g., Sansalone and Street, 1997; Breck-enridge et al., 1990; Lange and Ustinov, 1983�. Ball impactis in some cases preferable to sources such as pencil leadfracture �Hsu, 1977� or pulsed laser �Scruby and Drain,1990� because the stress wave signature that it imparts isintimately related to the force pulse that ball imposes on themassive body, which can be calculated from Hertzian contacttheory �Hunter, 1957; Reed, 1985�. Hertz �1882� contactmodel is both elastic and quasistatic in nature; it neglects toconsider both radiated elastic waves and anelastic effects,such as plasticity and viscoelasticity. Hertz law has beenused beyond the limits of its validity on the basis that itaccurately predicts those impact parameters which can beexperimentally verified �Love, 1927�. As test methods be-come more precise, and theoretical and numerical studiesmore detailed, there is a need to experimentally validate theHertzian impact model and to quantitatively evaluate its lim-its.
This paper presents a systematic study of ball impact asa source of stress waves for a number of different materialcombinations. Impact-generated vibrations were recordedwith an array of pm sensitive high-fidelity sensors, and bycarefully eliminating the wave propagation effects, estimatesof the force pulse were obtained and compared to theHerztian-derived pulse. We experimentally verify the Reed
a�Author to whom correspondence should be addressed. Electronic mail:
[email protected]J. Acoust. Soc. Am. 128 �3�, September 2010 0001-4966/2010/128�3
�1985� correction to Hunter’s �1957� calculation of the forcepulse by measuring the locations of zeros in the spectralcontent of measured waves. The validity of Hertzian theoryis also assessed for cases in which plastic deformation andsurface effects absorb some of the ball’s kinetic energy dur-ing the collision. Our methodology is similar to that of pre-vious researchers �Crook, 1952; Goldsmith and Lyman,1960; Chang and Sun, 1989; Buttle and Scruby, 1990� butemploys a more exact treatment of wave propagation effects,and takes into careful consideration the response function ofthe sensors used to record the stress waves. The conical pi-ezoelectric sensors used in this work were developed in ourlaboratory and were absolutely calibrated by comparing re-sults from capillary fracture and ball impact calibrationsources.
The present work focuses on the measurement of twoimpact parameters: the force time history, or force pulse, thatthe ball imposes on the massive body, and the coefficient ofrestitution �e�—defined as the ratio of the magnitudes of therebound and approach velocities of the ball. The force pulsedescribes the ball’s change in momentum over time, shownto be intimately related to the stress waves radiated from thecollision, while e is a measure of the total kinetic energy lostto non-conservative processes such as radiated stress waves,plastic deformation, and viscoelasticity �Falcon et al., 1998�.We examine the applicability of different Hertzian deriva-tions of the force pulse published by Hunter �1957� and Reed�1985�.
II. METHODS
A schematic of the test setup is shown in Fig. 1. As
depicted, the collision of a ball �a� at location �b� on a mas-© 2010 Acoustical Society of America 1087�/1087/10/$25.00
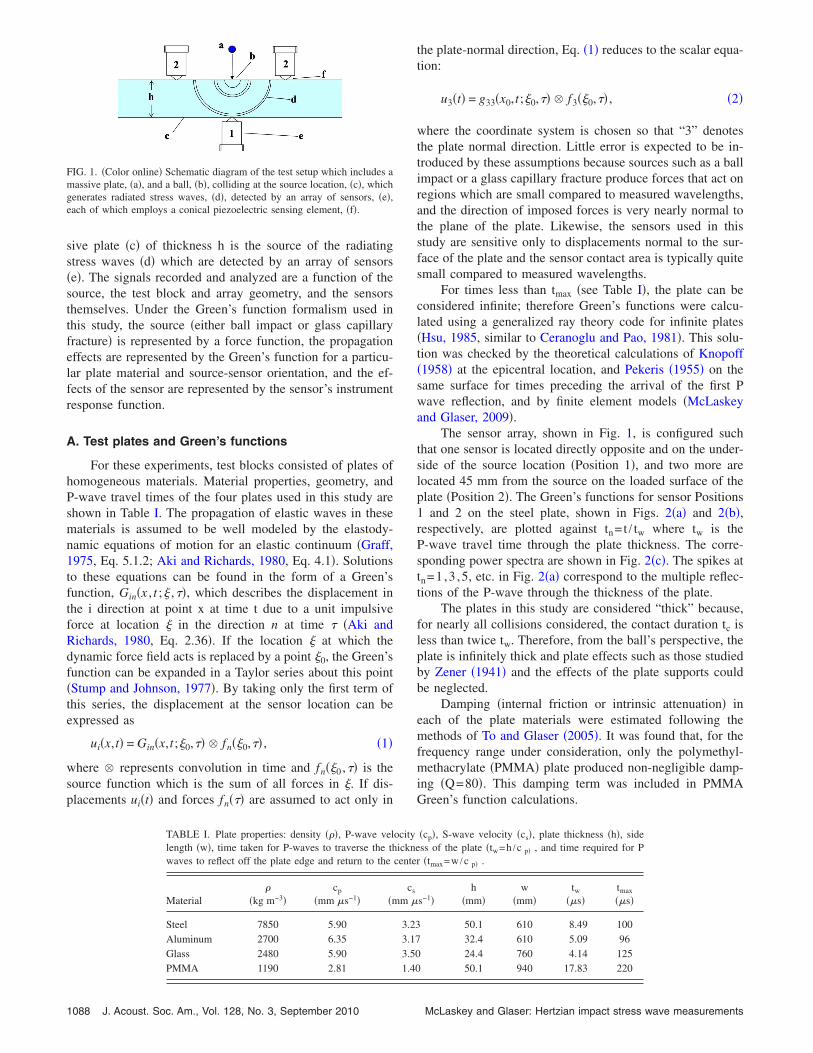
sive plate �c� of thickness h is the source of the radiatingstress waves �d� which are detected by an array of sensors�e�. The signals recorded and analyzed are a function of thesource, the test block and array geometry, and the sensorsthemselves. Under the Green’s function formalism used inthis study, the source �either ball impact or glass capillaryfracture� is represented by a force function, the propagationeffects are represented by the Green’s function for a particu-lar plate material and source-sensor orientation, and the ef-fects of the sensor are represented by the sensor’s instrumentresponse function.
A. Test plates and Green’s functions
For these experiments, test blocks consisted of plates ofhomogeneous materials. Material properties, geometry, andP-wave travel times of the four plates used in this study areshown in Table I. The propagation of elastic waves in thesematerials is assumed to be well modeled by the elastody-namic equations of motion for an elastic continuum �Graff,1975, Eq. 5.1.2; Aki and Richards, 1980, Eq. 4.1�. Solutionsto these equations can be found in the form of a Green’sfunction, Gin�x , t ;� ,��, which describes the displacement inthe i direction at point x at time t due to a unit impulsiveforce at location � in the direction n at time � �Aki andRichards, 1980, Eq. 2.36�. If the location � at which thedynamic force field acts is replaced by a point �0, the Green’sfunction can be expanded in a Taylor series about this point�Stump and Johnson, 1977�. By taking only the first term ofthis series, the displacement at the sensor location can beexpressed as
ui�x,t� = Gin�x,t;�0,�� � fn��0,�� , �1�
where � represents convolution in time and fn��0 ,�� is thesource function which is the sum of all forces in �. If dis-placements ui�t� and forces fn��� are assumed to act only in
FIG. 1. �Color online� Schematic diagram of the test setup which includes amassive plate, �a�, and a ball, �b�, colliding at the source location, �c�, whichgenerates radiated stress waves, �d�, detected by an array of sensors, �e�,each of which employs a conical piezoelectric sensing element, �f�.
TABLE I. Plate properties: density ���, P-wave vellength �w�, time taken for P-waves to traverse the thwaves to reflect off the plate edge and return to the
Material�
�kg m−3�cp
�mm �s−1� �m
Steel 7850 5.90Aluminum 2700 6.35Glass 2480 5.90PMMA 1190 2.81
1088 J. Acoust. Soc. Am., Vol. 128, No. 3, September 2010
the plate-normal direction, Eq. �1� reduces to the scalar equa-tion:
u3�t� = g33�x0,t;�0,�� � f3��0,�� , �2�
where the coordinate system is chosen so that “3” denotesthe plate normal direction. Little error is expected to be in-troduced by these assumptions because sources such as a ballimpact or a glass capillary fracture produce forces that act onregions which are small compared to measured wavelengths,and the direction of imposed forces is very nearly normal tothe plane of the plate. Likewise, the sensors used in thisstudy are sensitive only to displacements normal to the sur-face of the plate and the sensor contact area is typically quitesmall compared to measured wavelengths.
For times less than tmax �see Table I�, the plate can beconsidered infinite; therefore Green’s functions were calcu-lated using a generalized ray theory code for infinite plates�Hsu, 1985, similar to Ceranoglu and Pao, 1981�. This solu-tion was checked by the theoretical calculations of Knopoff�1958� at the epicentral location, and Pekeris �1955� on thesame surface for times preceding the arrival of the first Pwave reflection, and by finite element models �McLaskeyand Glaser, 2009�.
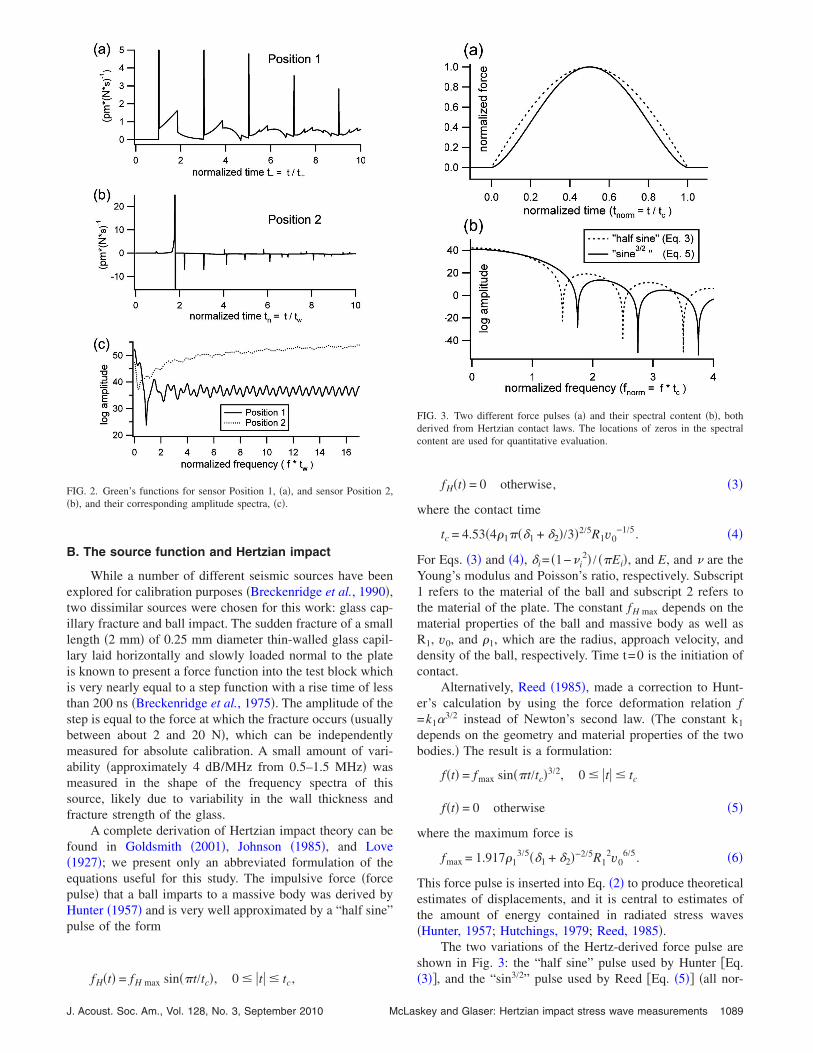
The sensor array, shown in Fig. 1, is configured suchthat one sensor is located directly opposite and on the under-side of the source location �Position 1�, and two more arelocated 45 mm from the source on the loaded surface of theplate �Position 2�. The Green’s functions for sensor Positions1 and 2 on the steel plate, shown in Figs. 2�a� and 2�b�,respectively, are plotted against tn= t / tw where tw is theP-wave travel time through the plate thickness. The corre-sponding power spectra are shown in Fig. 2�c�. The spikes attn=1 ,3 ,5, etc. in Fig. 2�a� correspond to the multiple reflec-tions of the P-wave through the thickness of the plate.
The plates in this study are considered “thick” because,for nearly all collisions considered, the contact duration tc isless than twice tw. Therefore, from the ball’s perspective, theplate is infinitely thick and plate effects such as those studiedby Zener �1941� and the effects of the plate supports couldbe neglected.
Damping �internal friction or intrinsic attenuation� ineach of the plate materials were estimated following themethods of To and Glaser �2005�. It was found that, for thefrequency range under consideration, only the polymethyl-methacrylate �PMMA� plate produced non-negligible damp-ing �Q=80�. This damping term was included in PMMAGreen’s function calculations.
�cp�, S-wave velocity �cs�, plate thickness �h�, sidess of the plate �tw=h /c�p��, and time required for P
r �tmax=w /c�p��.
s−1�h
�mm�w
�mm�tw
��s�tmax
��s�
50.1 610 8.49 10032.4 610 5.09 9624.4 760 4.14 12550.1 940 17.83 220
ocityickne
cente
cs
m �
3.233.173.501.40
McLaskey and Glaser: Hertzian impact stress wave measurements
B. The source function and Hertzian impact
While a number of different seismic sources have beenexplored for calibration purposes �Breckenridge et al., 1990�,two dissimilar sources were chosen for this work: glass cap-illary fracture and ball impact. The sudden fracture of a smalllength �2 mm� of 0.25 mm diameter thin-walled glass capil-lary laid horizontally and slowly loaded normal to the plateis known to present a force function into the test block whichis very nearly equal to a step function with a rise time of lessthan 200 ns �Breckenridge et al., 1975�. The amplitude of thestep is equal to the force at which the fracture occurs �usuallybetween about 2 and 20 N�, which can be independentlymeasured for absolute calibration. A small amount of vari-ability �approximately 4 dB/MHz from 0.5–1.5 MHz� wasmeasured in the shape of the frequency spectra of thissource, likely due to variability in the wall thickness andfracture strength of the glass.
A complete derivation of Hertzian impact theory can befound in Goldsmith �2001�, Johnson �1985�, and Love�1927�; we present only an abbreviated formulation of theequations useful for this study. The impulsive force �forcepulse� that a ball imparts to a massive body was derived byHunter �1957� and is very well approximated by a “half sine”pulse of the form
FIG. 2. Green’s functions for sensor Position 1, �a�, and sensor Position 2,�b�, and their corresponding amplitude spectra, �c�.
fH�t� = fH max sin��t/tc�, 0 � �t� � tc,
J. Acoust. Soc. Am., Vol. 128, No. 3, September 2010 McLas
fH�t� = 0 otherwise, �3�
where the contact time
tc = 4.53�4�1���1 + �2�/3�2/5R1v0−1/5. �4�
For Eqs. �3� and �4�, �i= �1−i2� / ��Ei�, and E, and are the
Young’s modulus and Poisson’s ratio, respectively. Subscript1 refers to the material of the ball and subscript 2 refers tothe material of the plate. The constant fH max depends on thematerial properties of the ball and massive body as well asR1, v0, and �1, which are the radius, approach velocity, anddensity of the ball, respectively. Time t=0 is the initiation ofcontact.
Alternatively, Reed �1985�, made a correction to Hunt-er’s calculation by using the force deformation relation f=k13/2 instead of Newton’s second law. �The constant k1
depends on the geometry and material properties of the twobodies.� The result is a formulation:
f�t� = fmax sin��t/tc�3/2, 0 � �t� � tc
f�t� = 0 otherwise �5�
where the maximum force is
fmax = 1.917�13/5��1 + �2�−2/5R1
2v06/5. �6�
This force pulse is inserted into Eq. �2� to produce theoreticalestimates of displacements, and it is central to estimates ofthe amount of energy contained in radiated stress waves�Hunter, 1957; Hutchings, 1979; Reed, 1985�.
The two variations of the Hertz-derived force pulse areshown in Fig. 3: the “half sine” pulse used by Hunter �Eq.
3/2
FIG. 3. Two different force pulses �a� and their spectral content �b�, bothderived from Hertzian contact laws. The locations of zeros in the spectralcontent are used for quantitative evaluation.
�3��, and the “sin ” pulse used by Reed �Eq. �5�� �all nor-
key and Glaser: Hertzian impact stress wave measurements 1089
malized in amplitude�. The magnitudes of the Fourier trans-forms of these pulses are plotted in Fig. 3�b� as a function ofnormalized frequency. The shape of the spectral content ofthis source consists of a series of lobes separated by zeros, orfrequencies void of spectral amplitude. The zero frequencywhich separates the main lobe from nth side lobe can beexpressed as fzero,n=An / tc where An is a dimensionless num-ber which depends on the shape of the pulse. An=n+0.5 forthe “half sine” pulse, and An=n+0.75 for the “sin3/2” pulse.
C. Sensors and the instrument response function
Piezoelectric sensors were used because of their superiorsensitivity compared to capacitive transducers �Breckenridgeand Greenspan, 1981� and optical methods �Boltz and For-tunko, 1995� and because of the relative ease with whichthey can be mounted to a specimen in the form of a sensorarray. While most piezoelectric transducers take advantage ofsome mechanical resonance to gain high sensitivity at theexpense of loss of bandwidth and signal distortion, the sen-sors used in this study, which are manufactured in our labo-ratory, are based on a design developed in the late 1970sintended to provide a more faithful transduction of surfacedisplacement �Proctor, 1982; Greenspan, 1987�.
The sensors contain an EBL# 2 PZT-5a �lead-zirconium-titanate composition� truncated cone sensing element. Theone part of the sensor in contact with the specimen is the1.75 mm diameter truncated tip of the conical PZT elementwhich is covered by a thin brass shim �which completes theelectrical circuit, and enhances the mechanical bond with thespecimen�. The sensor is pressed onto the surface of thespecimen with a mounting force of about 10 N. Sensitivitygreater than many resonant sensors is made possible by theincorporation of an impedance matching JFET driver circuitlocated adjacent to the base of the PZT cone. This avoidssignal loss due to parasitic capacitance. More details on thesensor design are described in Glaser et al. �1998�.
Conical piezoelectric sensors are reported to have anextremely flat response between 100 kHz and 1 MHz �e.g.,Scruby et al., 1986; Proctor, 1982�, but because these arecontact sensors, the actual response is a function of the im-pedance match between the sensor and specimen �Brecken-ridge et al., 1975�, causing difficulties in the sensor’s abso-lute calibration. Until now, a calibration on a number ofdifferent materials which adequately addresses both ampli-tude and phase information has been only briefly studied�Miller and McIntire, 1987�.
The calibrations performed for this study follow a trans-fer function approach fully described in Hsu and Brecken-ridge �1981�. In this method, the sensor output v�t� is ex-pressed as the linear convolution of the surface displacementand the sensor’s instrument response function:
v�t� = u3�t� � i�t� , �7�
where u3�t� is the displacement normal to the surface of thespecimen at the sensor location x which would exist in theabsence of the sensor �estimated from Eq. �2��. The complextransfer function of the transducer I���=V���U3���−1 can be
found from inversion of the Fourier transform of Eq. �7�. The1090 J. Acoust. Soc. Am., Vol. 128, No. 3, September 2010
sensor response I���=� · Inorm���, where Inorm��� is theshape of the frequency response, and � is the absolute sen-sitivity given a specific Inorm���.
Once the transducer response function and Green’s func-tion of the plate material/source-sensor orientation have beendetermined, any or both of these effects can be removedfrom recorded signals through inversion. This inverse prob-lem is solved in the frequency domain by directly dividingFourier frequencies, or in the time domain using a least-squares deconvolution strategy �Michaels, 1982; Yilmaz,1987�. Both methods were used in this study, and the accu-racy of the inversion is discussed in Sec. IV B.
III. EXPERIMENTS
Three collections of experiments were performed on thefour plates described in Table I. For all tests, the setup wasidentical to that shown in Fig. 1, except that the ball sourcewas in some cases replaced by a capillary fracture. The glassand PMMA plates were left in “as received” condition whilethe steel and aluminum plates were polished to a mirror fin-ish. The output from each sensor was recorded at 10 Msamples per second and 14-bit dynamic range. For spectralestimates, recorded signals were windowed with aBlackman-Harris window centered on the first wave arrivaland transformed using a fast Fourier transform algorithm.The length of the window varied for different plate materialsbut was always less than 2�tmax.
For the calibration tests, five capillary fracture tests wereperformed on each plate specimen and the force at whichfracture occurred was independently measured with a forcesensor. Five ball-drop tests using small �0.40 mm and 0.50mm diameter� ruby balls were also performed. To separatesensor response from source-receiver geometry, one of thesensors in Position 2 was switched with the sensor in Posi-tion 1, and the sets of five capillary tests and five ball dropswere repeated.
In the second collection of experiments, sets of ball-droptests were performed using hardened steel balls and rubyballs of 1.00 mm and 2.38 mm in diameter and glass balls of1.00 mm and 2.5 mm in diameter, at three different dropheights: 0.068 m, 0.127 m, and 0.315 m. For each test, a ballwas dropped from a platform of known height, allowed tofall through the air, strike the plate, rebound, and then strikethe plate again; this procedure was repeated ten times foreach of the selected combinations of drop height, ball size,and ball/plate materials. Signals were recorded for 1.6 mssurrounding the first arrival of the elastic waves produced bythe initial collision of the ball on the plate, and for 105 mssurrounding the expected time of the second bounce of theball on the plate. The incoming velocity of the initial colli-sion was calculated from the known height of the ball dropwhile the rebound velocity of the same collision was calcu-lated from the time between successive bounces �Bernstein,1977; Falcon et al., 1998�.
For the third set of tests, the ball was dropped from awide range of heights �1 mm to 1 m� and allowed to bouncerepeatedly �tens of times in succession�. Stress wave infor-
mation over the entire time period was recorded at a reducedMcLaskey and Glaser: Hertzian impact stress wave measurements
sampling rate �500 kHz�, and the first wave arrival �deter-mined to �2 �s� from each successive impact was used fore calculations �following Bernstein, 1977; and Falcon et al.,1998�.
IV. RESULTS
A. Fzero results
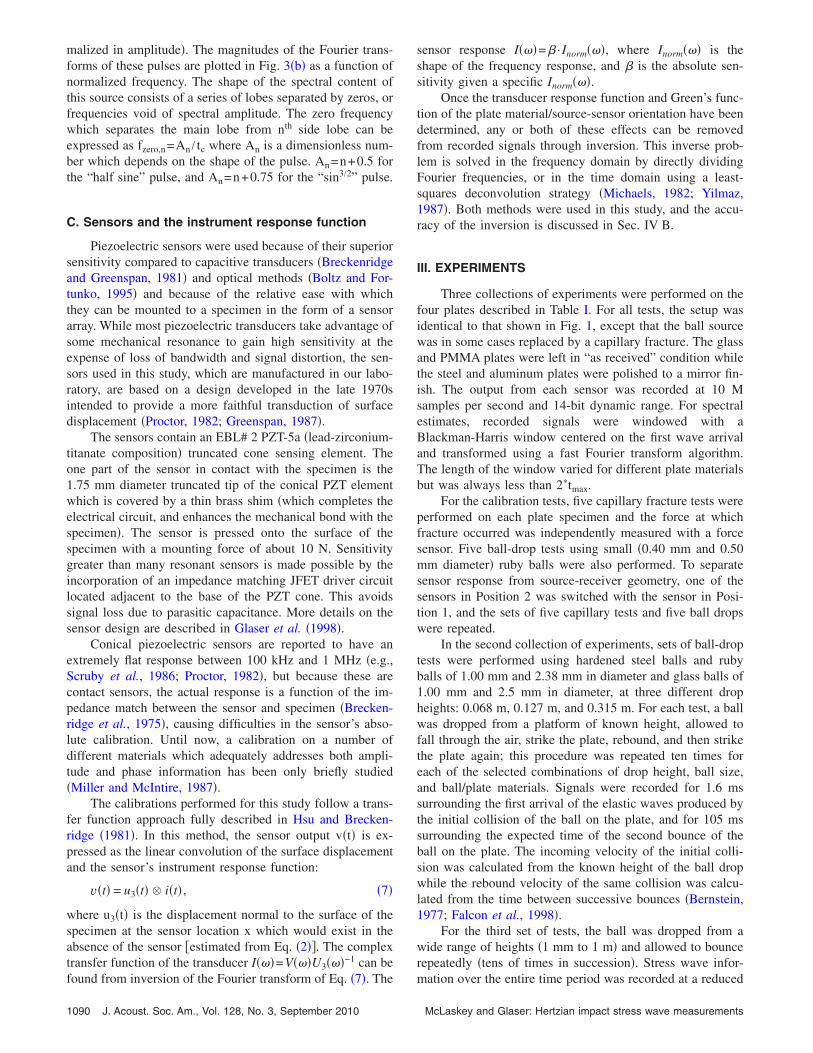
The frequencies of zeros in the power spectrum of re-corded signals �fzero,1, fzero,2, and fzero,3� were estimated fromlocal minima found in the magnitude of the Fourier trans-form of recorded signals from the sensors in Position 2. Anexample of one such signal, produced from the collision of a1.00 mm steel ball dropped 325 mm onto the aluminum plateis plotted in Fig. 4�a� along with the surface normal displace-ments predicted by theory �Eq. �5� inserted into Eq. �2��. Thetransducer sensitivity is approximately 250 mV/nm, and thenoise is approximately �0.25 mV ��1 pm�. The magnitudeof the Fourier transform of the recorded signals and theoret-ical displacements are plotted in Fig. 4�b� along with thepower spectrum of a pure noise signal of the same length.
The results for fzero,1, fzero,2, and fzero,3 for all materialcombinations are plotted in Fig. 5 on a nondimensionalizedfrequency scale which is normalized to tc, found from Eq.�4�. The expected fzero locations for the “sin3/2” force pulseare shown as vertical dashed lines for reference. The ob-served fzero locations strongly favor the “sin3/2” force pulseformulation over the “half sine” pulse described in Sec. II B,thus validating the Reed �1985� correction to Hunter’s �1957�theory. This quantitative evaluation of the force pulse doesnot rely on an accurate calibration of the sensors. Note thatthe results for ruby and steel balls colliding with the steel and
FIG. 4. �Color online� Comparison between theory �using the “sin3/2” Hert-zian force pulse, Eq. �5�� and experiment for a 1.00 mm steel ball dropped315 mm onto a thick aluminum plate. Subtle differences between experi-ment and theory can be identified by the locations of zeros in the frequencyspectra in �b�.
aluminum plates produce slightly low fzero,1, and slightly
J. Acoust. Soc. Am., Vol. 128, No. 3, September 2010 McLas
high fzero,2, and fzero,3, while the collisions on Glass andPMMA plates are more consistent with theory �these devia-tions are discussed in Sec. V B�.
B. Calibration tests
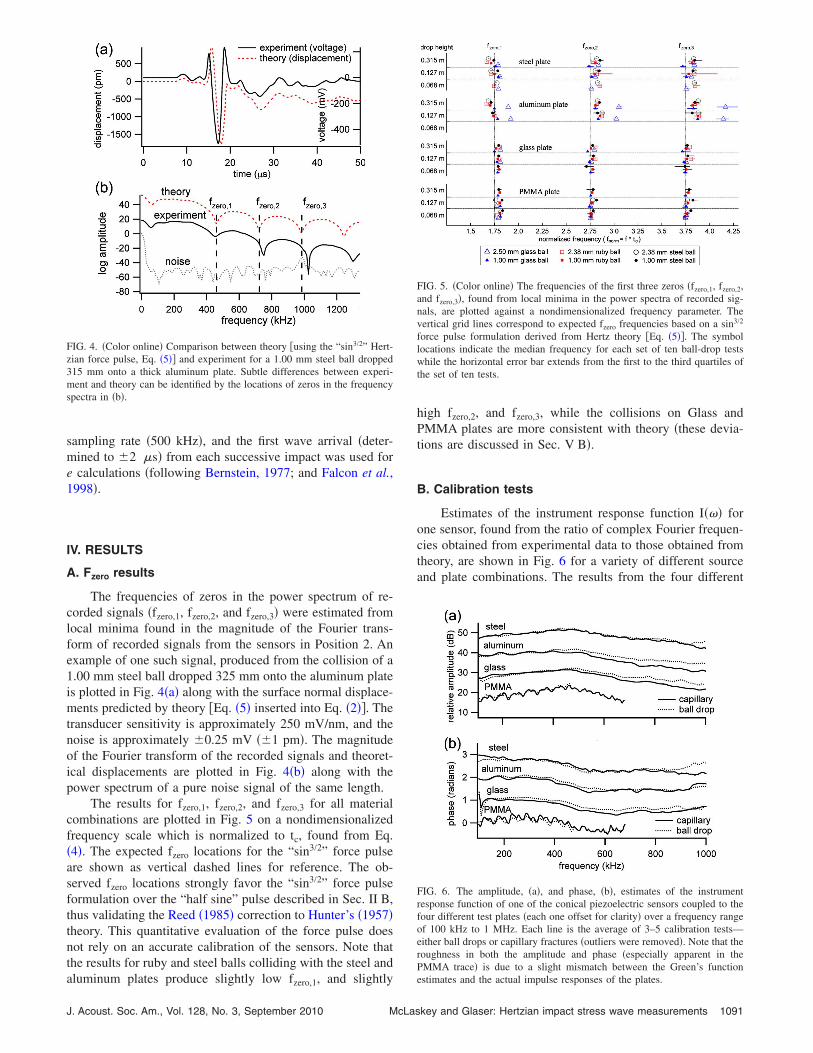
Estimates of the instrument response function I��� forone sensor, found from the ratio of complex Fourier frequen-cies obtained from experimental data to those obtained fromtheory, are shown in Fig. 6 for a variety of different sourceand plate combinations. The results from the four different
FIG. 5. �Color online� The frequencies of the first three zeros �fzero,1, fzero,2,and fzero,3�, found from local minima in the power spectra of recorded sig-nals, are plotted against a nondimensionalized frequency parameter. Thevertical grid lines correspond to expected fzero frequencies based on a sin3/2
force pulse formulation derived from Hertz theory �Eq. �5��. The symbollocations indicate the median frequency for each set of ten ball-drop testswhile the horizontal error bar extends from the first to the third quartiles ofthe set of ten tests.
FIG. 6. The amplitude, �a�, and phase, �b�, estimates of the instrumentresponse function of one of the conical piezoelectric sensors coupled to thefour different test plates �each one offset for clarity� over a frequency rangeof 100 kHz to 1 MHz. Each line is the average of 3–5 calibration tests—either ball drops or capillary fractures �outliers were removed�. Note that theroughness in both the amplitude and phase �especially apparent in thePMMA trace� is due to a slight mismatch between the Green’s function
estimates and the actual impulse responses of the plates.key and Glaser: Hertzian impact stress wave measurements 1091
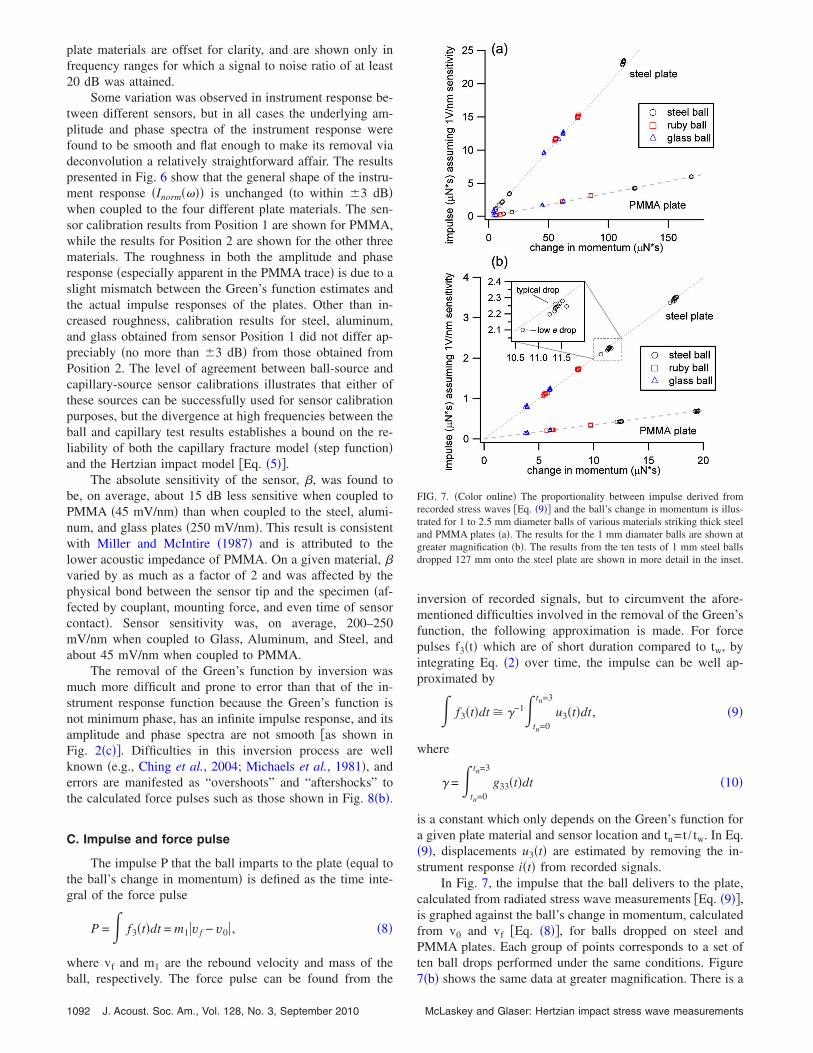
plate materials are offset for clarity, and are shown only infrequency ranges for which a signal to noise ratio of at least20 dB was attained.
Some variation was observed in instrument response be-tween different sensors, but in all cases the underlying am-plitude and phase spectra of the instrument response werefound to be smooth and flat enough to make its removal viadeconvolution a relatively straightforward affair. The resultspresented in Fig. 6 show that the general shape of the instru-ment response �Inorm���� is unchanged �to within �3 dB�when coupled to the four different plate materials. The sen-sor calibration results from Position 1 are shown for PMMA,while the results for Position 2 are shown for the other threematerials. The roughness in both the amplitude and phaseresponse �especially apparent in the PMMA trace� is due to aslight mismatch between the Green’s function estimates andthe actual impulse responses of the plates. Other than in-creased roughness, calibration results for steel, aluminum,and glass obtained from sensor Position 1 did not differ ap-preciably �no more than �3 dB� from those obtained fromPosition 2. The level of agreement between ball-source andcapillary-source sensor calibrations illustrates that either ofthese sources can be successfully used for sensor calibrationpurposes, but the divergence at high frequencies between theball and capillary test results establishes a bound on the re-liability of both the capillary fracture model �step function�and the Hertzian impact model �Eq. �5��.
The absolute sensitivity of the sensor, �, was found tobe, on average, about 15 dB less sensitive when coupled toPMMA �45 mV/nm� than when coupled to the steel, alumi-num, and glass plates �250 mV/nm�. This result is consistentwith Miller and McIntire �1987� and is attributed to thelower acoustic impedance of PMMA. On a given material, �varied by as much as a factor of 2 and was affected by thephysical bond between the sensor tip and the specimen �af-fected by couplant, mounting force, and even time of sensorcontact�. Sensor sensitivity was, on average, 200–250mV/nm when coupled to Glass, Aluminum, and Steel, andabout 45 mV/nm when coupled to PMMA.
The removal of the Green’s function by inversion wasmuch more difficult and prone to error than that of the in-strument response function because the Green’s function isnot minimum phase, has an infinite impulse response, and itsamplitude and phase spectra are not smooth �as shown inFig. 2�c��. Difficulties in this inversion process are wellknown �e.g., Ching et al., 2004; Michaels et al., 1981�, anderrors are manifested as “overshoots” and “aftershocks” tothe calculated force pulses such as those shown in Fig. 8�b�.
C. Impulse and force pulse
The impulse P that the ball imparts to the plate �equal tothe ball’s change in momentum� is defined as the time inte-gral of the force pulse
P =� f3�t�dt = m1�v f − v0� , �8�
where vf and m1 are the rebound velocity and mass of the
ball, respectively. The force pulse can be found from the1092 J. Acoust. Soc. Am., Vol. 128, No. 3, September 2010
inversion of recorded signals, but to circumvent the afore-mentioned difficulties involved in the removal of the Green’sfunction, the following approximation is made. For forcepulses f3�t� which are of short duration compared to tw, byintegrating Eq. �2� over time, the impulse can be well ap-proximated by
� f3�t�dt � −1�tn=0
tn=3
u3�t�dt , �9�
where
= �tn=0
tn=3
g33�t�dt �10�
is a constant which only depends on the Green’s function fora given plate material and sensor location and tn=t / tw. In Eq.�9�, displacements u3�t� are estimated by removing the in-strument response i�t� from recorded signals.
In Fig. 7, the impulse that the ball delivers to the plate,calculated from radiated stress wave measurements �Eq. �9��,is graphed against the ball’s change in momentum, calculatedfrom v0 and vf �Eq. �8��, for balls dropped on steel andPMMA plates. Each group of points corresponds to a set often ball drops performed under the same conditions. Figure
FIG. 7. �Color online� The proportionality between impulse derived fromrecorded stress waves �Eq. �9�� and the ball’s change in momentum is illus-trated for 1 to 2.5 mm diameter balls of various materials striking thick steeland PMMA plates �a�. The results for the 1 mm diamater balls are shown atgreater magnification �b�. The results from the ten tests of 1 mm steel ballsdropped 127 mm onto the steel plate are shown in more detail in the inset.
7�b� shows the same data at greater magnification. There is a
McLaskey and Glaser: Hertzian impact stress wave measurements
linear proportionality between impulse calculated from stresswaves and change in momentum observed from incomingand rebound velocities of the ball. The slope of the resultingtrend line is equal to the sensor sensitivity � relative to thesensitivity assumed for the impulse calculation �which was 1V/nm�. All of the data lies within �0.5 dB of the �=−14 dB and �=−29 dB lines shown, even for abnormallylow e collisions such as that shown in Fig. 7�b� inset. Thiscomparison serves a means of double checking the absolutesensor sensitivity � over a wide range of amplitudes once theinstrument response Inorm��� �shown in Fig. 6� has been es-timated. Note that the sensor is 15 dB more sensitive whencoupled to steel than when coupled to PMMA.
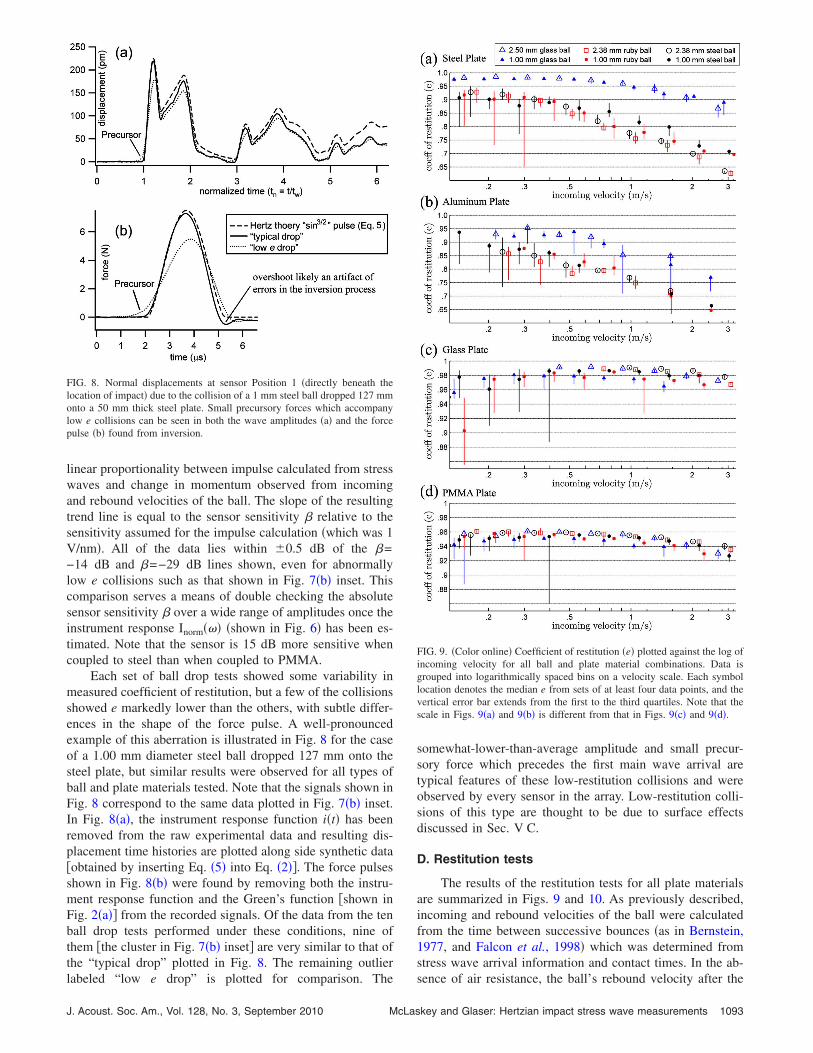
Each set of ball drop tests showed some variability inmeasured coefficient of restitution, but a few of the collisionsshowed e markedly lower than the others, with subtle differ-ences in the shape of the force pulse. A well-pronouncedexample of this aberration is illustrated in Fig. 8 for the caseof a 1.00 mm diameter steel ball dropped 127 mm onto thesteel plate, but similar results were observed for all types ofball and plate materials tested. Note that the signals shown inFig. 8 correspond to the same data plotted in Fig. 7�b� inset.In Fig. 8�a�, the instrument response function i�t� has beenremoved from the raw experimental data and resulting dis-placement time histories are plotted along side synthetic data�obtained by inserting Eq. �5� into Eq. �2��. The force pulsesshown in Fig. 8�b� were found by removing both the instru-ment response function and the Green’s function �shown inFig. 2�a�� from the recorded signals. Of the data from the tenball drop tests performed under these conditions, nine ofthem �the cluster in Fig. 7�b� inset� are very similar to that ofthe “typical drop” plotted in Fig. 8. The remaining outlier
FIG. 8. Normal displacements at sensor Position 1 �directly beneath thelocation of impact� due to the collision of a 1 mm steel ball dropped 127 mmonto a 50 mm thick steel plate. Small precursory forces which accompanylow e collisions can be seen in both the wave amplitudes �a� and the forcepulse �b� found from inversion.
labeled “low e drop” is plotted for comparison. The
J. Acoust. Soc. Am., Vol. 128, No. 3, September 2010 McLas
somewhat-lower-than-average amplitude and small precur-sory force which precedes the first main wave arrival aretypical features of these low-restitution collisions and wereobserved by every sensor in the array. Low-restitution colli-sions of this type are thought to be due to surface effectsdiscussed in Sec. V C.
D. Restitution tests
The results of the restitution tests for all plate materialsare summarized in Figs. 9 and 10. As previously described,incoming and rebound velocities of the ball were calculatedfrom the time between successive bounces �as in Bernstein,1977, and Falcon et al., 1998� which was determined fromstress wave arrival information and contact times. In the ab-
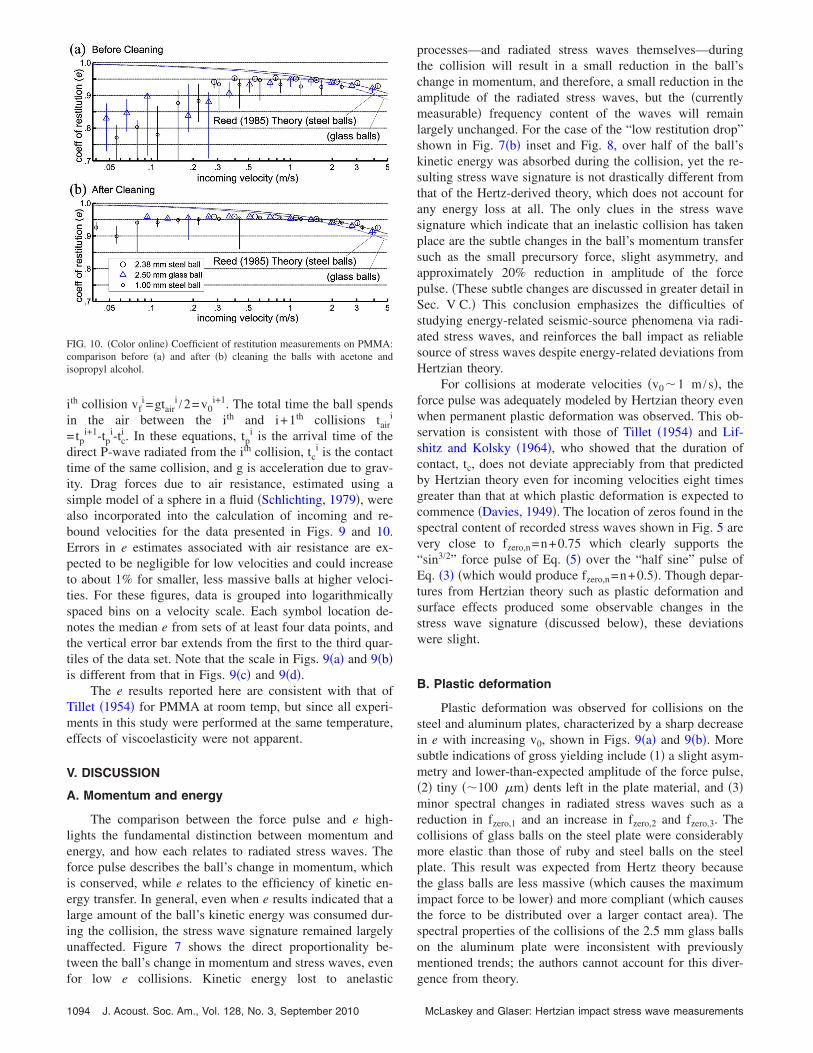
FIG. 9. �Color online� Coefficient of restitution �e� plotted against the log ofincoming velocity for all ball and plate material combinations. Data isgrouped into logarithmically spaced bins on a velocity scale. Each symbollocation denotes the median e from sets of at least four data points, and thevertical error bar extends from the first to the third quartiles. Note that thescale in Figs. 9�a� and 9�b� is different from that in Figs. 9�c� and 9�d�.
sence of air resistance, the ball’s rebound velocity after the
key and Glaser: Hertzian impact stress wave measurements 1093
ith collision vfi=gtair
i /2=v0i+1. The total time the ball spends
in the air between the ith and i+1th collisions tairi
= tpi+1-tp
i-tci . In these equations, tp
i is the arrival time of thedirect P-wave radiated from the ith collision, tc
i is the contacttime of the same collision, and g is acceleration due to grav-ity. Drag forces due to air resistance, estimated using asimple model of a sphere in a fluid �Schlichting, 1979�, werealso incorporated into the calculation of incoming and re-bound velocities for the data presented in Figs. 9 and 10.Errors in e estimates associated with air resistance are ex-pected to be negligible for low velocities and could increaseto about 1% for smaller, less massive balls at higher veloci-ties. For these figures, data is grouped into logarithmicallyspaced bins on a velocity scale. Each symbol location de-notes the median e from sets of at least four data points, andthe vertical error bar extends from the first to the third quar-tiles of the data set. Note that the scale in Figs. 9�a� and 9�b�is different from that in Figs. 9�c� and 9�d�.
The e results reported here are consistent with that ofTillet �1954� for PMMA at room temp, but since all experi-ments in this study were performed at the same temperature,effects of viscoelasticity were not apparent.
V. DISCUSSION
A. Momentum and energy
The comparison between the force pulse and e high-lights the fundamental distinction between momentum andenergy, and how each relates to radiated stress waves. Theforce pulse describes the ball’s change in momentum, whichis conserved, while e relates to the efficiency of kinetic en-ergy transfer. In general, even when e results indicated that alarge amount of the ball’s kinetic energy was consumed dur-ing the collision, the stress wave signature remained largelyunaffected. Figure 7 shows the direct proportionality be-tween the ball’s change in momentum and stress waves, even
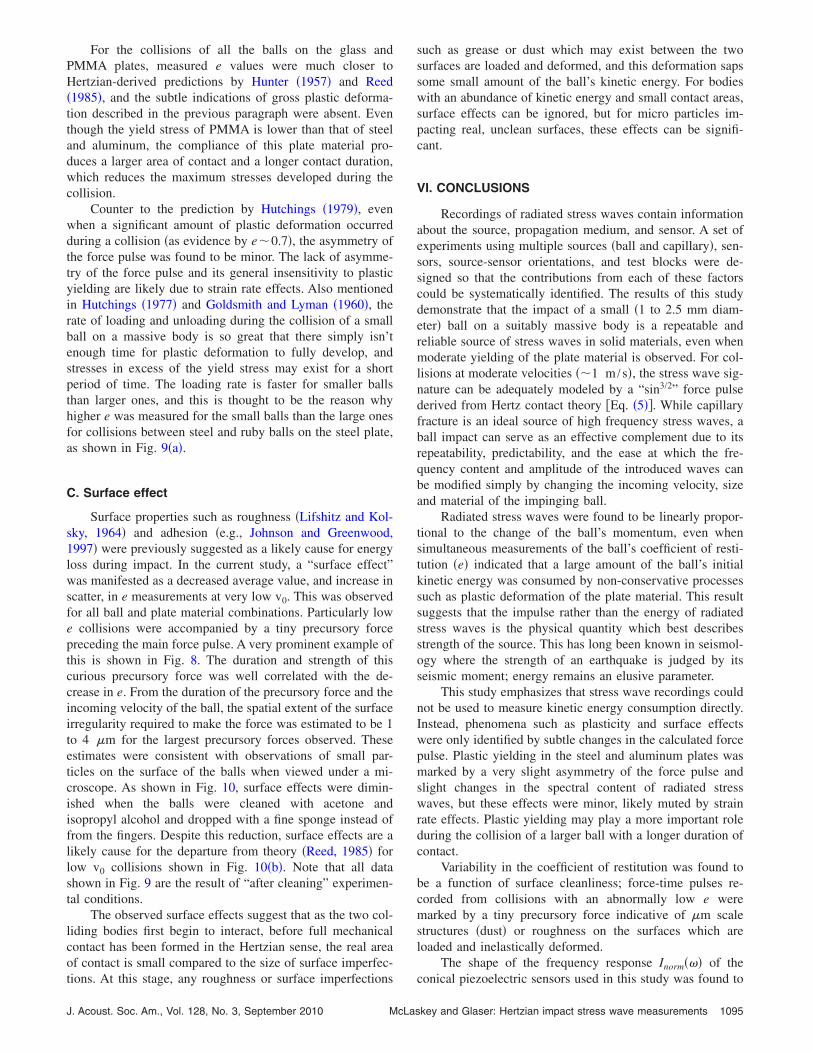
FIG. 10. �Color online� Coefficient of restitution measurements on PMMA:comparison before �a� and after �b� cleaning the balls with acetone andisopropyl alcohol.
for low e collisions. Kinetic energy lost to anelastic
1094 J. Acoust. Soc. Am., Vol. 128, No. 3, September 2010
processes—and radiated stress waves themselves—duringthe collision will result in a small reduction in the ball’schange in momentum, and therefore, a small reduction in theamplitude of the radiated stress waves, but the �currentlymeasurable� frequency content of the waves will remainlargely unchanged. For the case of the “low restitution drop”shown in Fig. 7�b� inset and Fig. 8, over half of the ball’skinetic energy was absorbed during the collision, yet the re-sulting stress wave signature is not drastically different fromthat of the Hertz-derived theory, which does not account forany energy loss at all. The only clues in the stress wavesignature which indicate that an inelastic collision has takenplace are the subtle changes in the ball’s momentum transfersuch as the small precursory force, slight asymmetry, andapproximately 20% reduction in amplitude of the forcepulse. �These subtle changes are discussed in greater detail inSec. V C.� This conclusion emphasizes the difficulties ofstudying energy-related seismic-source phenomena via radi-ated stress waves, and reinforces the ball impact as reliablesource of stress waves despite energy-related deviations fromHertzian theory.
For collisions at moderate velocities �v0�1 m /s�, theforce pulse was adequately modeled by Hertzian theory evenwhen permanent plastic deformation was observed. This ob-servation is consistent with those of Tillet �1954� and Lif-shitz and Kolsky �1964�, who showed that the duration ofcontact, tc, does not deviate appreciably from that predictedby Hertzian theory even for incoming velocities eight timesgreater than that at which plastic deformation is expected tocommence �Davies, 1949�. The location of zeros found in thespectral content of recorded stress waves shown in Fig. 5 arevery close to fzero,n=n+0.75 which clearly supports the“sin3/2” force pulse of Eq. �5� over the “half sine” pulse ofEq. �3� �which would produce fzero,n=n+0.5�. Though depar-tures from Hertzian theory such as plastic deformation andsurface effects produced some observable changes in thestress wave signature �discussed below�, these deviationswere slight.
B. Plastic deformation
Plastic deformation was observed for collisions on thesteel and aluminum plates, characterized by a sharp decreasein e with increasing v0, shown in Figs. 9�a� and 9�b�. Moresubtle indications of gross yielding include �1� a slight asym-metry and lower-than-expected amplitude of the force pulse,�2� tiny ��100 �m� dents left in the plate material, and �3�minor spectral changes in radiated stress waves such as areduction in fzero,1 and an increase in fzero,2 and fzero,3. Thecollisions of glass balls on the steel plate were considerablymore elastic than those of ruby and steel balls on the steelplate. This result was expected from Hertz theory becausethe glass balls are less massive �which causes the maximumimpact force to be lower� and more compliant �which causesthe force to be distributed over a larger contact area�. Thespectral properties of the collisions of the 2.5 mm glass ballson the aluminum plate were inconsistent with previouslymentioned trends; the authors cannot account for this diver-
gence from theory.McLaskey and Glaser: Hertzian impact stress wave measurements
For the collisions of all the balls on the glass andPMMA plates, measured e values were much closer toHertzian-derived predictions by Hunter �1957� and Reed�1985�, and the subtle indications of gross plastic deforma-tion described in the previous paragraph were absent. Eventhough the yield stress of PMMA is lower than that of steeland aluminum, the compliance of this plate material pro-duces a larger area of contact and a longer contact duration,which reduces the maximum stresses developed during thecollision.
Counter to the prediction by Hutchings �1979�, evenwhen a significant amount of plastic deformation occurredduring a collision �as evidence by e�0.7�, the asymmetry ofthe force pulse was found to be minor. The lack of asymme-try of the force pulse and its general insensitivity to plasticyielding are likely due to strain rate effects. Also mentionedin Hutchings �1977� and Goldsmith and Lyman �1960�, therate of loading and unloading during the collision of a smallball on a massive body is so great that there simply isn’tenough time for plastic deformation to fully develop, andstresses in excess of the yield stress may exist for a shortperiod of time. The loading rate is faster for smaller ballsthan larger ones, and this is thought to be the reason whyhigher e was measured for the small balls than the large onesfor collisions between steel and ruby balls on the steel plate,as shown in Fig. 9�a�.
C. Surface effect
Surface properties such as roughness �Lifshitz and Kol-sky, 1964� and adhesion �e.g., Johnson and Greenwood,1997� were previously suggested as a likely cause for energyloss during impact. In the current study, a “surface effect”was manifested as a decreased average value, and increase inscatter, in e measurements at very low v0. This was observedfor all ball and plate material combinations. Particularly lowe collisions were accompanied by a tiny precursory forcepreceding the main force pulse. A very prominent example ofthis is shown in Fig. 8. The duration and strength of thiscurious precursory force was well correlated with the de-crease in e. From the duration of the precursory force and theincoming velocity of the ball, the spatial extent of the surfaceirregularity required to make the force was estimated to be 1to 4 �m for the largest precursory forces observed. Theseestimates were consistent with observations of small par-ticles on the surface of the balls when viewed under a mi-croscope. As shown in Fig. 10, surface effects were dimin-ished when the balls were cleaned with acetone andisopropyl alcohol and dropped with a fine sponge instead offrom the fingers. Despite this reduction, surface effects are alikely cause for the departure from theory �Reed, 1985� forlow v0 collisions shown in Fig. 10�b�. Note that all datashown in Fig. 9 are the result of “after cleaning” experimen-tal conditions.
The observed surface effects suggest that as the two col-liding bodies first begin to interact, before full mechanicalcontact has been formed in the Hertzian sense, the real areaof contact is small compared to the size of surface imperfec-
tions. At this stage, any roughness or surface imperfectionsJ. Acoust. Soc. Am., Vol. 128, No. 3, September 2010 McLas
such as grease or dust which may exist between the twosurfaces are loaded and deformed, and this deformation sapssome small amount of the ball’s kinetic energy. For bodieswith an abundance of kinetic energy and small contact areas,surface effects can be ignored, but for micro particles im-pacting real, unclean surfaces, these effects can be signifi-cant.
VI. CONCLUSIONS
Recordings of radiated stress waves contain informationabout the source, propagation medium, and sensor. A set ofexperiments using multiple sources �ball and capillary�, sen-sors, source-sensor orientations, and test blocks were de-signed so that the contributions from each of these factorscould be systematically identified. The results of this studydemonstrate that the impact of a small �1 to 2.5 mm diam-eter� ball on a suitably massive body is a repeatable andreliable source of stress waves in solid materials, even whenmoderate yielding of the plate material is observed. For col-lisions at moderate velocities ��1 m /s�, the stress wave sig-nature can be adequately modeled by a “sin3/2” force pulsederived from Hertz contact theory �Eq. �5��. While capillaryfracture is an ideal source of high frequency stress waves, aball impact can serve as an effective complement due to itsrepeatability, predictability, and the ease at which the fre-quency content and amplitude of the introduced waves canbe modified simply by changing the incoming velocity, sizeand material of the impinging ball.
Radiated stress waves were found to be linearly propor-tional to the change of the ball’s momentum, even whensimultaneous measurements of the ball’s coefficient of resti-tution �e� indicated that a large amount of the ball’s initialkinetic energy was consumed by non-conservative processessuch as plastic deformation of the plate material. This resultsuggests that the impulse rather than the energy of radiatedstress waves is the physical quantity which best describesstrength of the source. This has long been known in seismol-ogy where the strength of an earthquake is judged by itsseismic moment; energy remains an elusive parameter.
This study emphasizes that stress wave recordings couldnot be used to measure kinetic energy consumption directly.Instead, phenomena such as plasticity and surface effectswere only identified by subtle changes in the calculated forcepulse. Plastic yielding in the steel and aluminum plates wasmarked by a very slight asymmetry of the force pulse andslight changes in the spectral content of radiated stresswaves, but these effects were minor, likely muted by strainrate effects. Plastic yielding may play a more important roleduring the collision of a larger ball with a longer duration ofcontact.
Variability in the coefficient of restitution was found tobe a function of surface cleanliness; force-time pulses re-corded from collisions with an abnormally low e weremarked by a tiny precursory force indicative of �m scalestructures �dust� or roughness on the surfaces which areloaded and inelastically deformed.
The shape of the frequency response Inorm��� of the
conical piezoelectric sensors used in this study was found tokey and Glaser: Hertzian impact stress wave measurements 1095
be unchanged �to within �3 dB� when coupled to the fourdifferent plate materials, with the differences easily removedby deconvolution due to the smoothness of its amplitude andphase spectra �there were no apparent poles or zeros�. Con-sequently, measurements of high frequency surface displace-ments down to a few pm in amplitude could be attained. Theabsolute sensitivity, �, of the sensors was found to be highlyvariable and dependent on the mechanical bond between thesensor tip and specimen, which emphasizes the need for arepeatable calibration source such as ball impact which de-livers waves of a known amplitude and frequency contentinto a solid body.
ACKNOWLEDGMENTS
The authors gratefully acknowledge Professor LaneJohnson for many helpful discussions. This work was fundedby NSF-GRF and NSF Grant No. CMS-0624985.
Aki, K., and Richards, P. G. �1980�. Quantitative Seismology: Theory andMethods �Freeman, San Francisco�, Chap. 2, pp. 9–36.
Bernstein, A. �1977�. “Listening to the coefficient of restitution,” Am. J.Phys. 45, 41–44.
Boltz, E. S., and Fortunko, C. M. �1995�. “Absolute sensitivity limits ofvarious ultrasonic transducers,” in Proceedings of the IEEE UltrasonicsSymposium, New York, edited by B. R. McAvoy, pp. 951–954.
Breckenridge, F., and Greenspan, M. �1981�. “Surface-wave displacement:Absolute measurements using a capacitive transducer,” J. Acoust. Soc.Am. 69, 1177–1185.
Breckenridge, F., Proctor, T., Hsu, N., Fick, S., and Eitzen, D. �1990�.“Transient sources for acoustic emission work,” in Progress in AcousticEmission V, edited by K. Yamaguchi, H. Takahashi, and H. Niitsuma, �TheJapanese Society for NDI, Sendai, Japan�, pp. 20–37.
Breckenridge, F., Tscheigg, C., and Greenspan, M. �1975�. “Acoustic emis-sion: Some applications of Lamb’s problem,” J. Acoust. Soc. Am. 57,626–631.
Buttle, D. J., and Scruby, C. B. �1990�. “Characterization of particle impactby quantitative acoustic emission,” Wear 137, 63–90.
Ceranoglu, A., and Pao, Y. �1981�. “Propagation of elastic pulses and acous-tic emission in a plate,” Trans. ASME, J. Appl. Mech. 48, 125–147.
Chang, C., and Sun, C. T. �1989�. “Determining transverse impact force ona composite laminate by signal deconvolution,” Exp. Mech. 29, 414–419.
Ching, J., To, A., and Glaser, S. �2004�. “Microseismic source deconvolu-tion: Wiener filter versus minimax, fourier versus wavelets, and linearversus nonlinear,” J. Acoust. Soc. Am. 115, 3048–3058.
Crook, A. W. �1952�. “A study of some impacts between metal bodies by apiezoelectric method,” Proc. R. Soc. London, Ser. A 212, 377–390.
Davies, R. M. �1949�. “The determination of static and dynamic yieldstresses using a steel ball,” Proc. R. Soc. London, Ser. A 197, 416–432.
Falcon, E., Laroche, C., Fauve, S., and Coste, C. �1998�. “Behavior of oneinelastic ball bouncing repeatedly off the ground,” Eur. Phys. J. B 3, 45–57.
Glaser, S., Weiss, G., and Johnson, L. �1998�. “Body waves recorded insidean elastic half-space by an embedded, wideband velocity sensor,” J.Acoust. Soc. Am. 104, 1404–1412.
Goldsmith, W. �2001�. Impact �Dover, New York�, Chap. IV, pp. 82–90.Goldsmith, W., and Lyman, P. T. �1960�. “The penetration of hard-steel
spheres into plane metal surfaces,” Trans. ASME, J. Appl. Mech. 27, 717–725.
Graff, K. �1975�. Wave Motion in Elastic Solids �Oxford University Press,Mineola, NY�, Chap. 5, pp. 273–310.
Greenspan, M. �1987�. “The NBS conical transducer: Analysis,” J. Acoust.Soc. Am. 81, 173–183.
Hertz, H. �1882�. “Über die Berührung fester elastischer Körper �On the
1096 J. Acoust. Soc. Am., Vol. 128, No. 3, September 2010
vibration of solid elastic bodies�,” J. Reine Angew. Math. 92, 156–171.Hsu, N. �1977�. U.S. Patent No. 4,018,084.Hsu, N. �1985�. “Dynamic Green’s functions of an infinite plate—A com-
puter program,” Technical Report No. NBSIR 85–3234, National Bureauof Standards, Center for Manufacturing Engineering, Gaithersburg, MD.
Hsu, N., and Breckenridge, F. �1981�. “Characterization of acoustic emis-sion sensors,” Mater. Eval. 39, 60–68.
Hunter, S. C. �1957�. “Energy absorbed by elastic waves during impact,” J.Mech. Phys. Solids 5, 162–171.
Hutchings, I. M. �1977�. “Strain rate effects in microparticle impact,” J.Phys. D: Appl. Phys. 10, L179–L184.
Hutchings, I. M. �1979�. “Energy absorbed by elastic waves during plasticimpact,” J. Phys. D: Appl. Phys. 12, 1819–1824.
Johnson, K. �1985�. Contact Mechanics �Cambridge University Press, Cam-bridge�, pp. 351–369.
Johnson, K., and Greenwood, J. �1997�. “An adhesion map for the contact ofelastic spheres,” J. Colloid Interface Sci. 192, 326–333.
Knopoff, L. �1958�. “Surface motions of a thick plate,” J. Appl. Phys. 29,661–670.
Lange, Y., and Ustinov, E. �1983�. “Acoustic pulses excited by impacts onobjects—Their analytical representation and spectra,” Sov. J. Nondestruct.Test. 105, 825–830.
Lifshitz, J. M., and Kolsky, H. �1964�. “Some experiments on anelasticrebound,” J. Mech. Phys. Solids 12, 35–43.
Love, A. E. H. �1927�. A Treatise on the Mathematical Theory of Elasticity�Cambridge Univeristy Press, London�, Chap. 8, pp. 184–203.
McLaskey, G., and Glaser, S. �2009�. “High-fidelity conical piezoelectrictransducers and finite element models utilized to quantify elastic wavesgenerated from ball collisions,” in Proceedings of the SPIE, Sensors andSmart Structures Technologies for Civil, Mechanical, and Aerospace Sys-tems, edited by M. Tomizuka, C. Yun, and V. Giurgiutiu, Vol. 7292, pp.72920S-1–72920S-18.
Michaels, J. �1982�. “Fundamentals of deconvolution with applications toultrasonics and acoustic emission,” MS thesis, Cornell University, Ithaca,NY.
Michaels, J., Michaels, T. E., and Sachse, W. �1981�. “Applications of de-convolution to acoustic emission signal analysis,” Mater. Eval. 39, 1032–1036.
Miller, R. K., and McIntire, P. �1987�. Nondestructive Testing HandbookSecond Edition Vol. 5: Acoustic Emission Testing �American Society forNondestructive Testing, Columbus, OH�, pp. 121–134.
Pekeris, C. L. �1955�. “The seismic surface pulse,” Proc. Natl. Acad. Sci.U.S.A. 41, 469–480.
Proctor, T. M. �1982�. “An improved piezoelectric acoustic emission trans-ducer,” J. Acoust. Soc. Am. 71, 1163–1168.
Reed, J. �1985�. “Energy losses due to elastic wave propagation during anelastic impact,” J. Phys. D 18, 2329–2337.
Sansalone, M. J., and Street, W. B. �1997�. Impact Echo: NondestructiveEvaluation of Concrete and Masonry �Bulbrier Press, Ithaca, NY�, Chap.3, pp. 29–46.
Schlichting, H. �1979�. Boundary-Layer Theory, 7th ed. �McGraw-Hill,New York�, Chap. 1, pp. 5–23.
Scruby, C., and Drain, L. �1990�. Laser Ultrasonics: Techniques and Appli-cations �Taylor & Francis, London�, pp. 1–324.
Scruby, C., Stacey, K., and Baldwin, K. G. �1986�. “Defect characterizationin three dimensions by acoustic emission,” J. Phys. D: Appl. Phys. 19,1597–1612.
Stump, B., and Johnson, L. �1977�. “The determination of source propertiesby the linear inversion of seismograms,” Bull. Seismol. Soc. Am. 67,1489–1502.
Tillet, J. P. A. �1954�. “A study of the impact of spheres on plates,” Proc. R.Soc. London, Ser. B 69, 677–688.
To, A., and Glaser, S. �2005�. “Full waveform inversion of a 3-D sourceinside an artificial rock,” J. Sound Vib. 285, 835–857.
Yilmaz, O. �1987�. Seismic Data Processing �Society of Exploration Geo-physicists, Tulsa, OK�, Chap. 2, pp. 82–153.
Zener, C. �1941�. “The intrinsic inelasticity of large plates,” Phys. Rev. Lett.
59, 669–673.McLaskey and Glaser: Hertzian impact stress wave measurements