Embed Size (px)
Citation preview
Copyright 0 1987 by the Genetics Society of America
Heritability and Variability in Ribosomal RNA Genes of Vicia faba
Scott 0. Rogers* and Arnold J. Bendich*’? Departments of *Botany and +Genetics, University of Washington, Seattle, Washington 981 95
Manuscript received January 9, 1987 Revised copy accepted June 20, 1987
ABSTRACT We have compared the restriction patterns and copy numbers of ribosomal RNA genes (rDNA)
between and within individuals of Vicia faba. While the EcoRI blot-hybridization patterns changed only after one to two generations, copy number changes were found among different tissues of the same plant. Copy number differences among individuals in the population were as great as 95-fold, whereas as much as a 12-fold variation was seen among tissues of the same plant. Among individual F1 progeny from genetic crosses, nearly an &fold variation was seen, and among individuals of the FP generation a spread of 22-fold was measured. Among individual siblings of self-pollinated parents, up to 7-fold variation was observed. However, changes in copy number did not necessarily indicate changes in rDNA EcoRI blot-hybridization pattern, and vice versa. Furthermore, nearest neighbor analysis of R-loop experiments showed that the arrangement of members of the “nontranscribed” spacer (NTS) size classes along the chromosome was not random, but some clustering was indicated. The data are consistent with the hypothesis that sister chromatid exchange in somatic cells of V. faba is the primary mechanism for altering the rDNA copy number as well as causing the extreme variation observed in the NTS. Variation among individuals in rDNA blot-hybridization pattern was also observed for Vicia villosa, Vicia dasycarpa, Vicia benghalensis and Vicia pannonica.
IGHER plants contain enormous numbers of H ribosomal RNA genes (rDNA). Estimates of copy number per haploid nuclear genome among plant species range from 570 to over 32,000 (PRUITT and MEYEROWITZ 1986; INGLE, TIMMIS and SINCLAIR 1975), while in organisms other than higher plants the number is usually much lower (LEWIN 1980). Expressed as proportion of the total genome the amount of rDNA is also high among plants. For example, Arabidopsis thaliana has a genome size of 0.08 pg of DNA per haploid cell, lowest of any higher plant (LEUTWEILER, HOUGH-EVANS and MEYEROWITZ 1984), and has 570 rDNA copies (PRUITT and MEYE- ROWITZ 1986). Drosophila melanogaster on the other hand has a genome size twice that of A. thaliana and has only 200 rDNA copies. It is generally agreed that the organism can survive with only a small part of its complement of ribosomal RNA genes. Mutants of D. melanogaster with between 100 and 200 copies do not appear different from wild type and mutants with between 30 and 100 are able to survive, although they develop slowly (TARTOF 1975; SHERMOEN and KIEFER 1975). It has been estimated that the salamander, Plethodon cinereus, can lose 67-96% of its ribosomal genes and still undergo normal development (MAC- GREGOR, VLAD and BARNETT 1977). In the same study, the number of ribosomal genes varied by 7.5- fold among 33 individuals of a single population. In another amphibian, Triturus vulgaris, a 1 O-fold varia- tion in copy number among 14 individuals was found
Genetics 117: 285-295 (October, 1987)
(ANDRONICO et al. 1985). Finally, among maize vari- eties with copy numbers ranging from 2,500 to 1 1,500 per haploid cell, no association was evident between rDNA copy number and phenotype, vigor, rRNA content or protein amount (BUESCHER, PHILLIPS and BRAMBL 1984). Thus, most of the rRNA gene copies appear to be superfluous to the normal functioning of the organism.
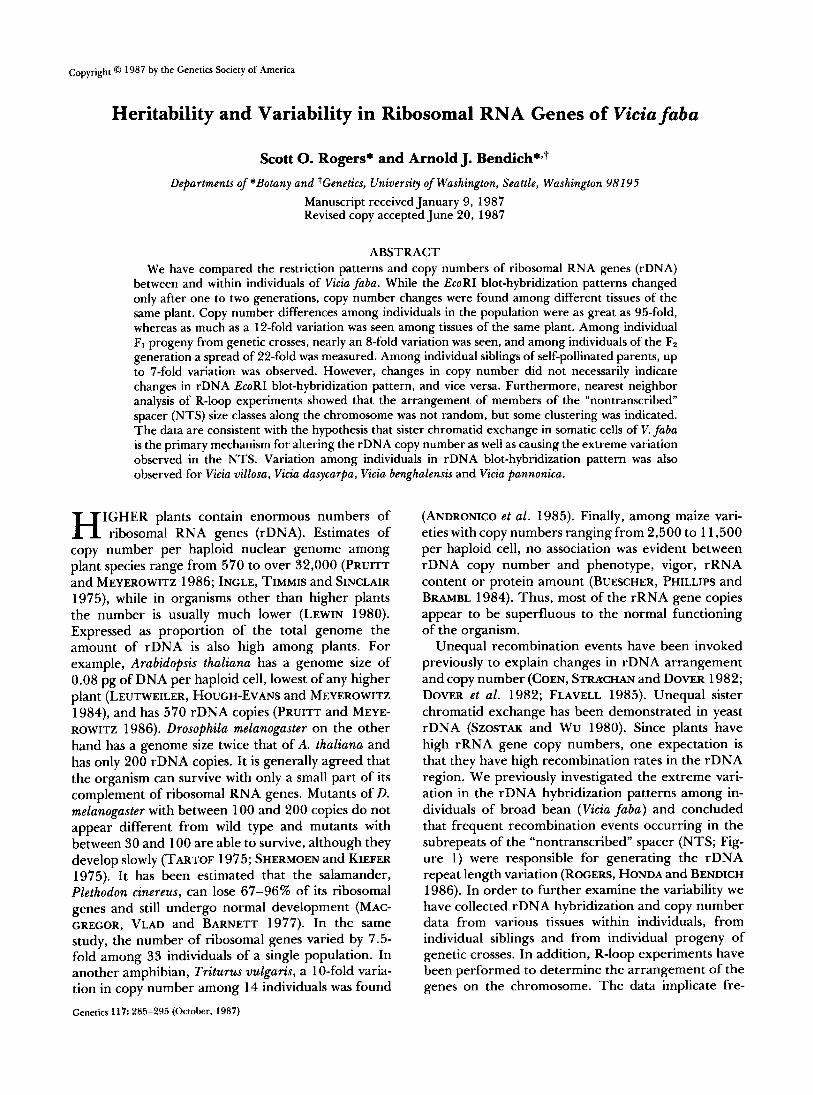
Unequal recombination events have been invoked previously to explain changes in rDNA arrangement and copy number (COEN, STRACHAN and DOVER 1982; DOVER et al. 1982; FLAVELL 1985). Unequal sister chromatid exchange has been demonstrated in yeast rDNA (SZOSTAK and Wu 1980). Since plants have high rRNA gene copy numbers, one expectation is that they have high recombination rates in the rDNA region. We previously investigated the extreme vari- ation in the rDNA hybridization patterns among in- dividuals of broad bean (Vicia faba) and concluded that frequent recombination events occurring in the subrepeats of the “nontranscribed” spacer (NTS; Fig- ure 1) were responsible for generating the rDNA repeat length variation (ROGERS, HONDA and BENDICH 1986). In order to further examine the variability we have collected rDNA hybridization and copy number data from various tissues within individuals, from individual siblings and from individual progeny of genetic crosses. In addition, R-loop experiments have been performed to determine the arrangement of the genes on the chromosome. The data implicate fre-
286 S. 0. Rogers and A. J. Bendich
, NTS 18s 58s 251 f I 3.75bP 1 1
S u b r e p e a 5
PI FIGURE 1.-Ribosomal RNA genes of V. fubu showing two of
the 4750 tandem repeats. Map data are from KATO, YAKURA and TANIFUJI (1 985), YAKURA, KATO and TANIFUJI (1 984), and YAKURA and TANIFUJI (1 983). EcoRI cleavage sites are designated by arrows. The 325-bp subrepetitive elements are shown in the NTS by full vertical lines. The two half vertical lines on either side of the 325- bp subrepeat region indicate two flanking direct repeats that are unrelated in sequence to the 325-bp subrepeats.
quent sister chromatid exchanges as the cause of the variation in the rDNA region.
MATERIALS AND METHODS
Plant sources: Seeds of Vicia faba L. (broad Windsor bean, lot 08267) and Vicia uillosa Roth (hairy vetch) were obtained from Chas. H. Lilly Co. , Seattle, Washington. Seeds of Vicia benghalensis L. (purple vetch), Vicia dasycarpa Ten. (Lana vetch), Vicia melanops Sibth. and Smith, Vicia pannonica L. (Hungarian vetch), Vicia sativa L. (common vetch) and Vicia tetrasperma L. (slender vetch) were obtained from the U.S. Department of Agriculture, Beltsville, Mary- land, and with the possible exception of V. sativa, individuals were from the same accession.
Genetic crosses: V. faba plants were grown in a green- house (free of pollinating insects) and given one application of a timed-release fertilizer (Osmocote) at the time of plant- ing. For the genetic crosses each of 48 plants was character- ized as to its rDNA blot-hybridization pattern using the enzyme EcoRI (as described below). The plants were allowed to self-pollinate and their individual progeny were then assayed. Individual plants that exhibited no detectable pat- tern changes from the parental pattern were again allowed to self-pollinate. These progeny were also used in genetic crosses. For these crosses, a flower from the plant that would be the female parent was emasculated before any pollen had been released by the anthers. Pollen from a different plant was then placed onto the stigma of the emasculated flower. The petals were then replaced around the ovary and four layers of cheesecloth were taped around the flower so that the pollen would come into contact with the stigma and to ensure that no other pollen could reach the stigma. The flowers were then observed over several days. After one to two weeks, the cheesecloth was removed. About 20% of the ovaries showed signs of swelling and lengthening, indicating a successful cross. The F, seeds were allowed to mature, then were planted and a leaf from each was assayed for its rDNA pattern. The plants were grown to maturity and allowed to self-pollinate to produce seeds. The F2 seeds were germinated and a leaf from each seedling was assayed.
DNA extractions: DNA was extracted using a CTAB microprep method (ROGERS and BENDICH 1985).
Restriction pattern assays: Up to 5 Pg of total DNA were digested with 10-20 units ofEcoRI at 37" for 8-12 hr, with ribonuclease A (100 rg/ml) and T1 (10 units/ml) for 30 min and then subjected to electrophoresis on 0.4-0.6% agarose gels (30 cm long) at 60-70 V for 18-44 hr. Size markers ("1 kb ladder" from BRL) were run on each of the gels. The gels were blotted onto Gene Screen Plus (NEN) and dried at room temperature. The blots were then hy- bridized to a radioactive probe as described below. For purposes of comparison of NTS size classes, the relevant bands on the autoradiogram were scanned using a densitom- eter. The peak heights were measured and the proportion
of hybridization in each band was calculated. Comparisons were then made by comparing the band proportions.
Copy number determinations: After digestion for 1 hr with ribonuclease (see above), DNA amounts were measured in glass capillaries according to the method of MOORE and SUTHERLAND (1 985). A known amount of DNA (100 ng to 1 rg) was then used for each sample. At room temperature, each DNA sample was treated with 0.5 N HCI for 1 min, denatured in 0.75 N NaOH for 3-5 min, then neutralized in 0.5 M Tris (pH 7.5) and 1.5 M NaCl for 1-3 min. Known amounts (1 pg to 10 ng) of pBD4, a plasmid containing the ribosomal RNA genes of the yeast Saccharomyces cerevisiae (BELL et al. 1977) were also prepared in the same way to construct a set of standards. Each sample was dotted onto Gene Screen Plus and hybridized to a radioactive probe as described below. After autoradiography to obtain a prelim- inary indication of hybridization, the blots were dried. Each dot was then cut out and assayed by liquid scintillation counting. A standard curve was made of amounts of pBD4 (in pg) vs. the number of counts per minute measured. This curve was then used to estimate the amounts of rDNA in each of the samples based on scintillation count measure- ments. These amounts were then divided by the total amount of DNA loaded for each dot to obtain the estimated percentage of the genome that was rDNA. Because the rDNA of yeast is not completely homologous with that of V. faba and because the probe included vector sequences in addition to rDNA, a correction factor was employed. The average rDNA percentage for leaves was compared with the published value for shoots based on rRNA/rDNA saturation hybridization (MAHER and FOX 1973). Since the value w e obtained was 33% higher than the published value, all of the percentages for all tissues were multiplied by 0.75. The corrected average value for embryos, 0.34% (Figure 6), compared favorably with the previously published value of 0.32-0.34% (FUKUEI et al. 1975).
Ribosomal gene copy numbers (Table 2) were calculated as shown in the following example. The average amount of rDNA in V. faba leaves was 0.22% (Figure 6). This was then multiplied by the haploid genome size of 13.2 pg (BENNETT and SMITH 1976) and by the constant 9.1 1 x lo5 kb (which equals 6.03 X 10" daltons/pgdivided by 6.62 X 10⁵daltons/ kb) to obtain the number of kilobases of rDNA per haploid cell, in this case 26,450. Finally, this was divided by the average rDNA repeat length of 10.5 kb to obtain the total copy number per haploid cell of 2519 (rounded to 2500) for V. faba leaves (see Table 2).
It should be noted that the calculation of copy number from rDNA percentage includes the assumptions that the genome size of the V. faba cultivar we used is the same as those in the cited work and that total DNA content does not vary greatly among individuals.
Southern hybridizations: Blots were prehybridized at 65" for 6-12 hr in hybridization solution (50% formamide, 1 % sodium dodecyl sulfate (SDS) and 1 M NaCl). The probe used was a 92P-labeled DNA plasmid (pBD4). For each microgram of plasmid DNA 80-90% of 100 FCi of [a-'*P]- dCTP (3000 Ci/mmol) was incorporated using a nick-trans- lation kit (NEN). The "P-labeled plasmid was denatured (in hybridization solution) at 95" for 10 min and then added to each blot at a concentration of about 20 ng/ml. The blots were then incubated at 42" for 16-24 hr, rinsed twice with 2X SSC (0.3 M NaC1, 0.03 M sodium citrate) at room temperature followed by two 30-min washes in 2X SSC and 1 % SDS at 65 O and two 30-min washes in 0.1 X SSC at room temperature. The blots were then placed onto X-ray film (Kodak XAR-2) for autoradiography with intensification
Ribosomal RNA Genes in Viciafaba 287
Screens (Du Pont lightning plus) and later without the screens to obtain a sharper image.
Electron microscopy: V. f a h rRNA ( I 8s and 25s) was isolated by using low melting point agarose and the gel purification technique described for DNA by TAU= and RENZ (1983). Proteinase K (200 pg/ml) was used in all solutions during extraction. V. f a h rDNA was obtained from a Hoechst 33258/CsCI gradient and R-looping was done as described by LAMPPA, HONDA and BENDICH ( 1 984), except a Tris buffer was used in place of the Pipes buffer.
1
P F, A& 1 2 3 4
I -
= =- v -0''
'V
X
2 3
J I
4 5 6
F;
RESULTS
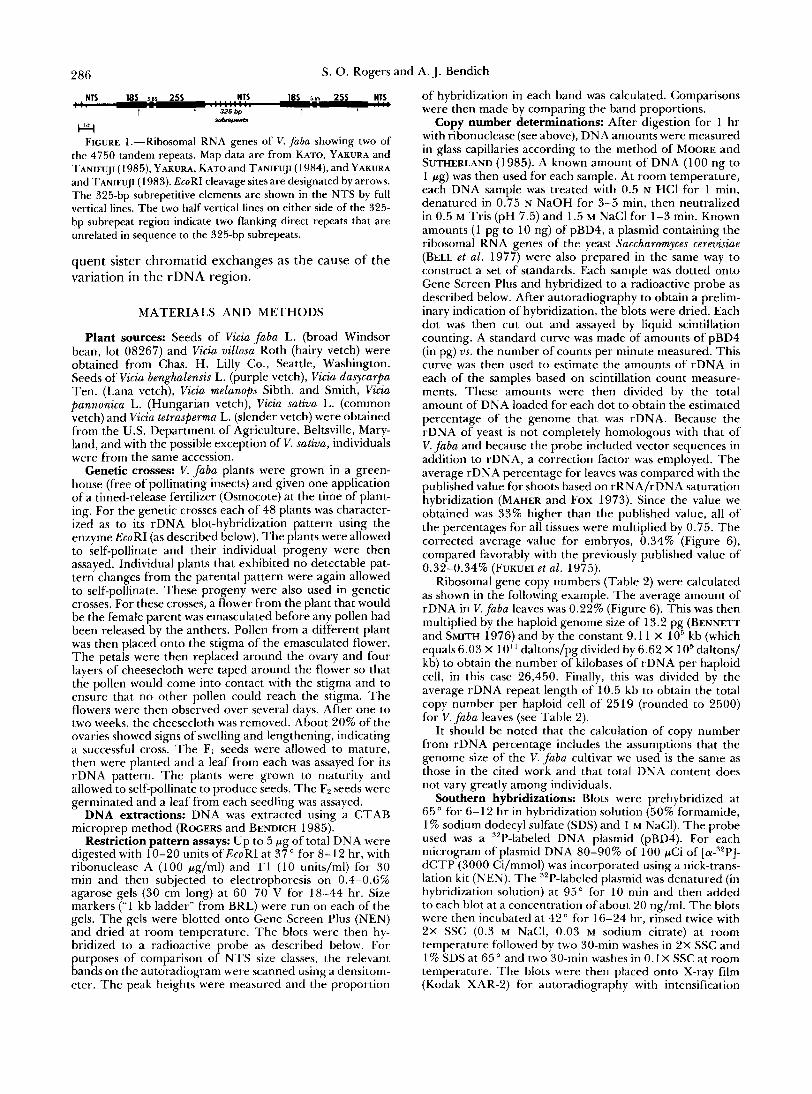
Repeat length variation: In previous work we found that while no changes in rDNA EcoRI blot- hybridiiation pattern were detected in various tissues from the same plant or between individual FI progeny from a self-pollinated plant (as in Figure 2a). changes were, however, observed in self-pollinated plant lines after two generations (ROGERS, HONDA and BENDICH 1986). In order to investigate whether pattern changes could be observed over fewer generations, genetic crosses were made between plants with dissim- ilar hybridiiation patterns. These data were also used to identify the types and locations of the rearrange- ments.
Ou t of 27 crosses, 23 individuals of the FI progeny were identified as heterozygotes as determined by their hybridiiation patterns. Occasionally very minor changes in the intensities of one or a few bands were found, indicating that some rearrangements had oc- curred that had changed the relative N T S size class proportions in those plants. These plants were not used for analysis of the F2 generation. O u t of 36 self- pollinated plants, none of their FI progeny (125) exhibited any detectable changes in their hybridiia- tion pattern (see, for example, Figure 2a).
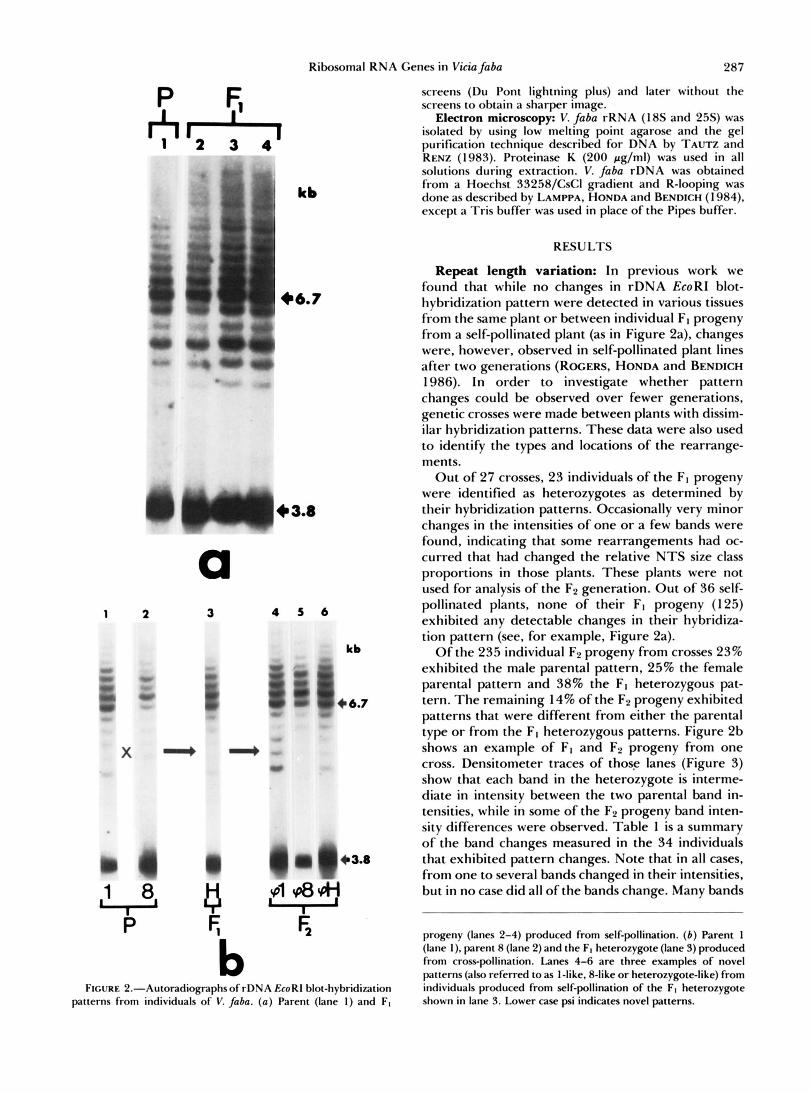
Of the 235 individual F2 progeny from crosses 23% exhibited the male parental pattern, 25% the female parental pattern and 38% the FI heterozygous pat- tern. The remaining 14% of the F2 progeny exhibited patterns that were different from either the parental type or from the FI heterozygous patterns. Figure 2b shows an example of FI and F2 progeny from one cross. Densitometer traces of those lanes (Figure 3) show that each band in the heterozygote is interme- diate in intensity between the two parental band in- tensities, while in some of the F2 progeny band inten- sity differences were observed. Table 1 is a summary of the band changes measured in the 34 individuals that exhibited pattern changes. Note that in all cases, from one to several bands changed in their intensities, but in no case did all of the bands change. Many bands
progeny (lanes 2-4) produced from self-pollination. ( b ) Parent 1 ilane I i. parent 8 (lane 2) and the FI heterozygote (lane 3) produced - . , .. . . . from cross-pollination. Lanes 4-6 are three examples of novel patterns (also referred to as I-like, 8-like or heterozygote-like) from individuals produced from self-pollination of the FI heterozygote shown in lane 3. Lower case psi indicates novel patterns.
b FIGURE P.-Autoradiog~aphs of rDNA EcoRl blot-hybridization
patterns from individuals of V. faba. (a) Parent (lane I ) and FI

288 S. 0. Rogers and A. J. Bendich
8
V H
H
Sl
1
15 U 11 9 7 5 3 I
BAND NUMBER FIGURE 3.-Densitometer traces of the lanes in Figure 2b. Trace
a is of lane 5 (Figure 2b). Trace b is of lane 2. Trace c is of lane 6. Trace d is of lane 3. Trace e is of lane 4. Trace f is of lane 1. Numbers on the right stand for pattern type. As in Figure 2, lower case psi indicates the novel patterns.
were observed which increased in intensity above the sum of the intensities of the corresponding parental bands as indicated by the large, upward pointing triangles in Table 1. For example, in the 8-like pattern (Figure Zb, lane 5; Figure 3, trace a; and Table 1, cross 1 X 8, column 7), bands 1-3 decreased in inten- sity compared to the parental 8 type pattern (Figure 2b, lane 2 and Figure 3, trace b); in the heterozygote- like pattern (Figure 2b, lane 6; Figure 3, trace c; and Table 1, cross 1 X 8, column 3), bands 1 and 2 have increased compared to the normal heterozygote (Fig- ure 2b, lane 3, and Figure 3, trace d); in the l-like pattern (Figure Zb, lane 4; Figure 3, trace e; and Table 1, cross 1 X 8, column l), band 1 had increased greatly and bands 2-5 have also changed compared to the parental type 1 pattern (Figure 2b, lane 1, and Figure 3, trace f) .
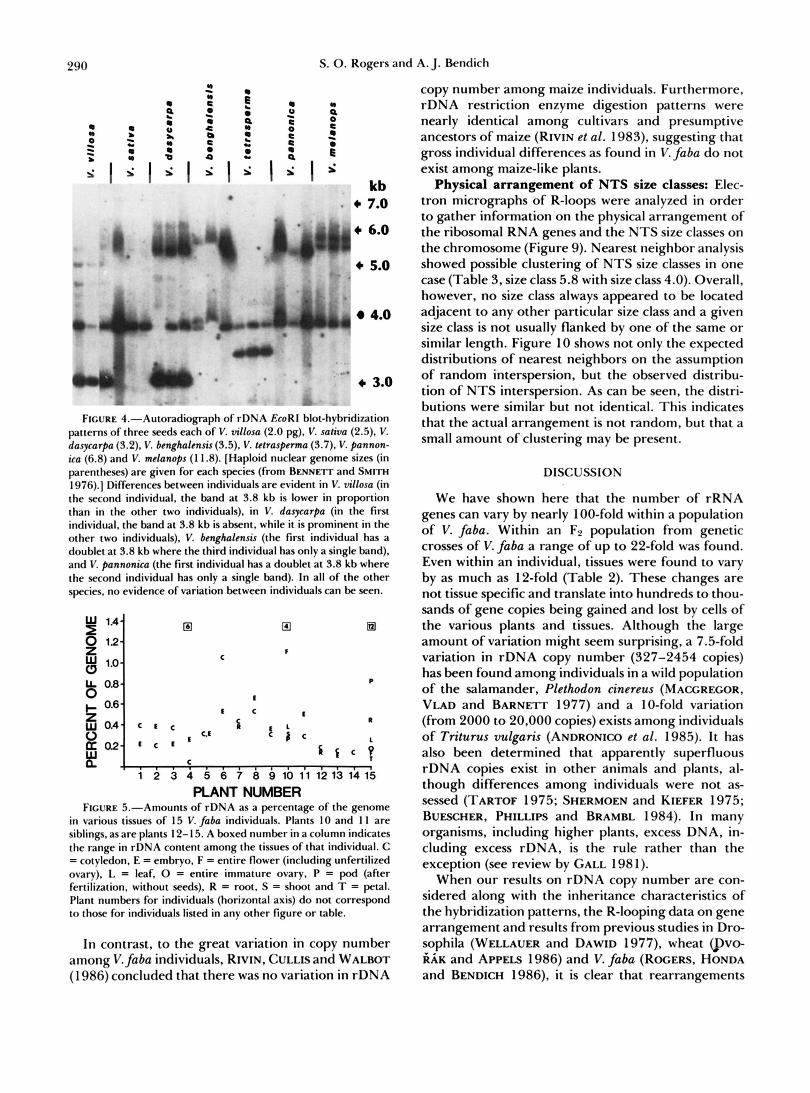
Individual seeds of other species of Vicia were also assayed (Figure 4). In a sample size of three, some degree of variation between individuals was observed in V. villosa, V. dasycarpa, V. benghalensis and V. pan- nonica, while no variation was detected in V. sativa, V. tetrasperma and V. melanops. Thus there is no apparent relationship between rDNA variability and genome size in this genus (Figure 4, legend).
Copy number determinations: These assays were
performed in order to obtain another measure of variation in the rDNA region. The sensitivity of the test was greater than that of blot-hybridization pattern changes (above) in that variation was found over a smaller number of cell divisions (for example, within individuals). Thus changes in copy number were not limited to meiotic divisions, but occurred in somatic cells.
The copy number of rRNA genes varied between individuals as well as within individuals (Figures 5 and 6 and Table 2). Copy number in various tissues within an individual generally varied 2-fold or less, although in three cases out of the 15 the variations ranged from 4- to 12-fold (Figure 5). These do not appear to be tissue specific changes since in plant 15 the pod was the organ with the highest proportion of rRNA genes, whereas in plant 10 the pod had the lowest proportion. Furthermore, in the same two plants nearly the re- verse was found for the proportion of rRNA genes in flowers. The average percent rDNA in embryos (em- bryo axes) was nearly identical to the value for coty- ledons (Figure 6). Embryo cells have an approximately diploid DNA content (2C), while cotyledon cells are, on average, 9OC (DAVIES 1977). This means that during endopolyploidization in the cotyledons, the average extent of rDNA replication is the same as that for most sequences of the genome. Changes are oc- curring, however, as indicated by copy number vari- ation within individuals. When the 2C embryos are compared to the 9OC cotyledons from the same indi- vidual, copy number variation is almost always less than 2-fold, but in one case a 6-fold variation was measured (plant number 4 in Figure 5). Thus the relationship between rDNA and total nuclear DNA replication during endopolyploidization is not ridgidly maintained in all individuals. It should be noted that during endoreduplication of DNA in Drosophila me- lanogaster, the rDNA is 1 O-fold underreplicated in polytene salivary gland cells, 2-fold underreplicated in follicle cells and only slightly or not underreplicated in nurse cells (HAMMOND and LAIRD 1985a,b).
In leaves of V. faba , the average proportion of the total DNA that was rDNA was 0.22%, while in em- bryos it was 0.34% (Figure 6). This compares with the previously published values of 0.22% for leaves (MAHER and Fox 1973) and 0.32-0.34% for embryos (FUKUEI et al. 1975). Using a value of 26.4 pg of DNA per diploid cell (BENNETT and SMITH 1976), our data indicate that there are, on average, 5,000 copies of rDNA in leaf cells and 7,600 copies in embryo cells (Table 2). Cotyledon cells, however, contain much more rDNA. Although the average percent of the genome is similar in cotyledon (0.39%) and embryo (0.34%), the number of rRNA gene copies per cell is enormously different because cotyledons contain about 45 times more DNA per cell. While an average
Ribosomal RNA Genes in Viciafaba
TABLE 1
Summary of band intensity changes
289
16
0 0
- v - v
- A - - L A
- The table summarizes the band intensity
H 38 -
0 .
v - 0 .
v v - Q
v v - - A A 0 -
- - - v 0 .
v - - - ianges for ea
I H H H
0
0
0 . v o A
* * A A - -
* A V * A - 0 v A A - A A A
* A * v v v - - -
’ of the 34
41x14 H H 14 14
0 . 0 0
- A - A
- A o A A A o A A A 0 7 - - - - A V - - - 7 - -
- v - - 0 0 -I - - A - v v - - 0 0 0A v v - -
41746 4q46 H H H H H H 4 4
e . . . . .
eA0 0 0 0 0
b o - 0 . 0 0
- - v o 0 . - A v V - - - - A - - v - - V - - - v v - 1 V V I I v -
v ~ A v v 0 - V A - - A - - V - - A A - A
A - A - V - 0
male parental pattern.
embryo cell contains 7,600 rDNA copies, the average cotyledon cell contains over 400,000. In cotyledons, the range of gene copies varies from an individual with 41,000 copies per cell to one having nearly 1.9 million.
Copy number differences among V. fuba individuals were as great as 95-fold within the population and 22- fold over the course of two generations in cross- pollinated plants. After one generation in self- and cross-pollinated plants differences were as much as 7- fold and 8-fold, respectively (Figure 6 and Table 2). Figures 7 and 8 show copy number comparisons among parents and progeny. For self-pollinated plants (Figure 7), the rDNA amount for the parent is on the top, the amount for each of the progeny below for each comparison. Some progeny exhibit little change from their parent (for example, plant 34), while for others there is a large variation among progeny (for example, plant 22). For the cross-pollinated plants (Figure 8), the rDNA amount for each of the parents is on top, the amount for the F1 heterozygotes is in the middle and the amounts for each of the F2 progeny are on the bottom. A small range is seen in both F1 and F2 progeny in cross 41 X 14, a small change in
on pattern was different from the ndividuals whose blot-hybridiza parental or F1 heterozygous patterns. Each ol ie bands (representing an NTS length) of the novel pattern was compared to the corresponding bands of the pattern that it most closely resembled (either of the two parental patterns or the Ft heterozygous pattern). For example, in this table, if the column has an “H” at the top, it is a heterozygote-like and was compared band-for-band to the authentic F1 heterozygote. Parental types used in the crosses are indicated at the top, with the male parent on the left and the female parent on the right. These numbers correspond to those in Figures 7 and 8 (where applicable). Band number (left margin) increases with increasing molecular weight (band 6 is at 6.7 kb, all bands vary from it in 325-bp steps). A dot (.) represents a band that could not be compared, either because the proportion of total intensity of those bands was not sufficiently different between parental types or the film at those positions was not interpretable. A minus sign (-) represents a band that did not change in intensity compared to the band in the reference pattern. A triangle, pointing up or down, represents an increase or decrease, respectively, in intensity of the band. Small triangles indicate that the intensity was within the range determined by the two parental pattern bands. Large triangles indicate that the intensity was either above the sum of the parental band intensities (upward pointing) or far below the intensity of either parental type (downward pointing). Open triangles indicate that the intensity changed in the direction of the female parental pattern. Solid triangles indicate that the intensity changed in the direction of the
the F1 and a large range in the F2 is seen in cross 6 X 7 and large variation in the F1 and F2 is seen in cross 1 X 8. Clearly large changes in copy number can occur over a short time span.
Comparisons of copy number changes with hy- bridization pattern changes: Changes in copy num- ber were not correlated with hybridization pattern changes. Among progeny from self-pollinated plants, there was no pattern variation detected, but variation in copy number up to 7-fold was seen (Figure 7 and Table 2). Some FI progeny of cross-pollinated plants identified as heterozygotes exhibited up to an 8-fold change in copy number. When the heterozygotes were allowed to self-pollinate, the resulting progeny ranged up to 22-fold in copy number (Figure 8 and Table 2). As can be seen in Figure 8, changes in pattern were not always coincident with changes in copy number. Asterisks below some of the F2 data points indicate the 34 individuals whose EcoRI rDNA blot-hybridi- zation pattern was different from the F1 or F2 patterns with which they were compared. Some exhibit no variation in copy number from the F1 or parental values, while others do. Therefore, no association between a change in pattern and a change in copy number was found.
290 S. 0. Rogers a n d A. J. Bendich
9
9 c 0 c P
Q
- e - e
i 1
0 U C 0 e c 0 0
- i 1
* c 0
3
Q - i
kb b 7.0
b 6.0
5.0
4.0
+ 3.0
FIGURE 4.-Autoradiopph of rDNA EcoRl blot-hybridi~ation patterns of three seeds each of V. villosa (2.0 pg). V. sativa (2.5). V. dasycarpa (3.2). V. benghalensis (3.5), V. tetraspewma (3.7). V. pannon- ica (6.8) and V. melanops ( 1 1.8). [Haploid nuclear genome sizes (in parentheses) are given for each species (from BENNETT and S W ~ I976).] Differences between individuals are evident in V. villosa (in the second individual, the band at 3.8 kb is lower in proportion than in the other two individuals), in V. dasycarpa (in the first individual, the band at 3.8 kb is absent, while it is prominent in the other two individuals), V. benghalmsis (the first individual has a doublet at 3.8 kb where the third individual has only a single band). and V. pannonica (the first individual has a doublet at 3.8 kb where the second individual has only a single band). In all of the other species, no evidence of variation between individuals can be seen.
0.6 t E
E C E
c
PLANT NUMBER FIGURE 5.-Amounts of rDNA as a percentage of the genome
in various tissues of 15 V. faba individuals. Plants I O and 1 I are siblings. as are plants 12-1 5. A boxed number in a column indicates the range in rDNA content among the tissues of that individual. C = cotyledon. E = embryo, F = entire flower (including unfertilized ovary), 1. = leaf, 0 = entire immature ovary, P = pod (after fertiliiation. without seeds), R = root. S = shoot and T = petal. Plant numbers for individuals (horizontal axis) d o not correspond to those for individuals listed in any other figure or table.
In contrast, to the great variation in copy number among V.faba individuals, RIVIN, CULLIS and WALBOT (1986) concluded that there was no variation in rDNA
copy number among maize individuals. Furthermore, rDNA restriction enzyme digestion patterns were nearly identical among cultivars and presumptive ancestors of maize (RIVIN et al. 1983), suggesting that gross individual differences as found in V.faba do not exist among maize-like plants.
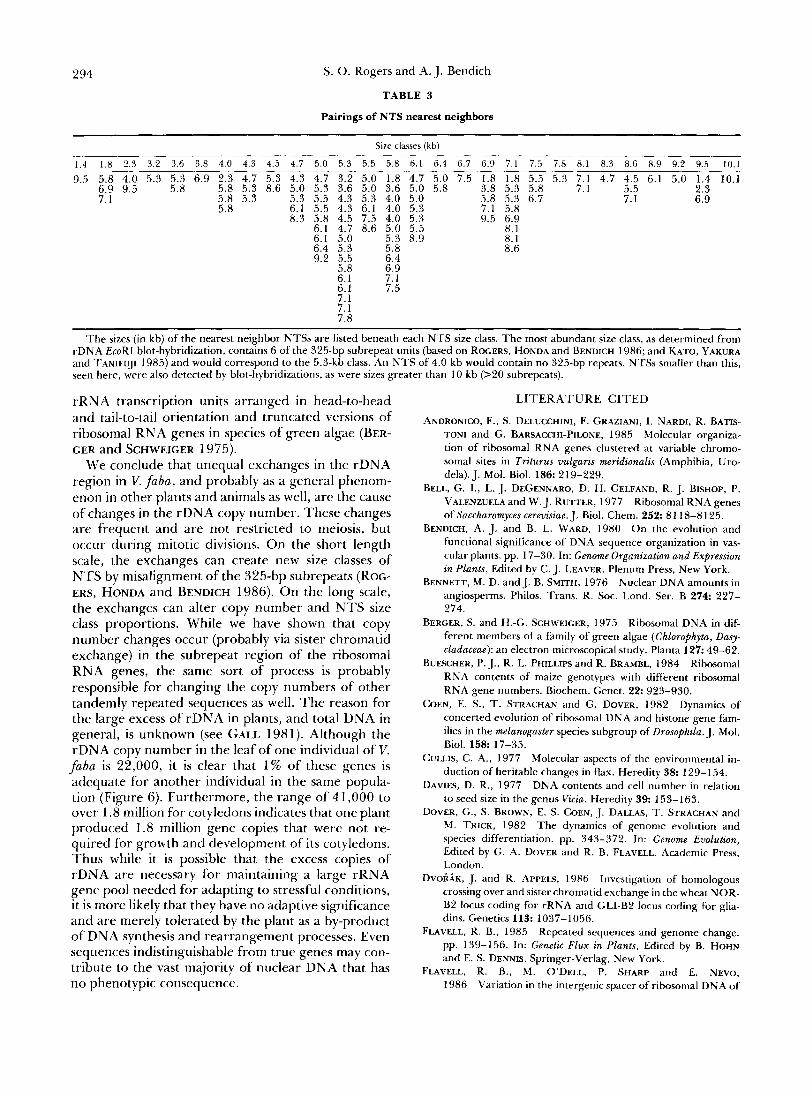
Physical arrangement of NTS size classes: Elec- tron micrographs of R-loops were analyzed in order to gather information on the physical arrangement of the ribosomal RNA genes and the NTS size classes on the chromosome (Figure 9). Nearest neighbor analysis showed possible clustering of NTS size classes in one case (Table 3, size class 5.8 with size class 4.0). Overall, however, no size class always appeared to be located adjacent to any other particular size class and a given size class is not usually flanked by one of the same or similar length. Figure 10 shows not only the expected distributions of nearest neighbors on the assumption of random interspersion, but the observed distribu- tion of N T S interspersion. As can be seen, the distri- butions were similar but not identical. This indicates that the actual arrangement is not random, but that a small amount of clustering may be present.
DISCUSSION
We have shown here that the number of rRNA genes can vary by nearly 100-fold within a population of V. faba. Within an F2 population from genetic crosses of V. faba a range of up to 22-fold was found. Even within an individual, tissues were found to vary by as much as 12-fold (Table 2). These changes are not tissue specific and translate into hundreds to thou- sands of gene copies being gained and lost by cells of the various plants and tissues. Although the large amount of variation might seem surprising, a 7.5-fold variation in rDNA copy number (327-2454 copies) has been found among individuals in a wild population of the salamander, Plethodon cinereus (MACGREGOR, VLAD and B A R N E ~ 1977) and a 10-fold variation (from 2000 to 20,000 copies) exists among individuals of Triturus vulgaris (ANDRONICO et al. 1985). It has also been determined that apparently superfluous rDNA copies exist in other animals and plants, al- though differences among individuals were not as- sessed (TARTOF 1975; SHERMOEN and KIEFER 1975; BUESCHER, PHILLIPS and BRAMBL 1984). In many organisms, including higher plants, excess DNA, in- cluding excess rDNA, is the rule rather than the exception (see review by GALL 1981).
When our results on rDNA copy number are con- sidered along with the inheritance characteristics of the hybridiiation patterns, the R-looping data on gene arrangement and results from previous studies in Dro- sophila (WELLAUER and DAWID 1977), wheat (JDvo- ~ A K and APPELS 1986) and V. faba (ROGERS, HONDA and BENDICH 1986). it is clear that rearrangements

Ribosomal RNA Genes in Vicia fubu
V O V A R Y
a V SHOOT
V FLOWERS 3 : e ? 8 s r s r m ' '
L ? I - ' n ? , . , , , , , , I
T : q ' " m l ' ' ' l ' l ' r ' ' l
0. POLLEN I r ' ' '
V P O D S ' 8 m m ' - r ' ' ' ' ' '
z + V , I R O O T S
u, V E M B R Y O S
- I
.+ ., . , I ., . , , , , I , , , , C O T Y L E D O N S - V U W
3 10 LEAVES z I . ... - 1 . - -
I I I 1 l 1 1 1 I t 0.2 0.4 0.6 0.8 1.0 1.2 1.4 I 1.6 ' 1.8 I 2.0
I
29 1
PERCENT OF GENOME
TABLE 2
Ribosomal RNA gene copy numbers in Viciafaba tissues
Tissue
Leaf Cotyledon Embryo Root Pod Pollen Flower Shoot Ovary Petal Various tissues
(1 plant)" Leaves (single line
self-pollinated)* Leaves (single line
cross-pollinated)"
Haploid copy number
Variation Average Range
95 2,500 230-21,900 45 4,500 460-20,700
6 3,800 1,300-7,500 3 3,700 1,800-5,000 7 4,600 1,400-9,300 1 1,700 1,400-1,900 8 7,000 1,500-12.600
3,400 1,800
800 12 3,500 800-9,200
FI 7 2,600 700-4,700
FI 8 1,900 600-4,400 FP 22 4,600 700-14,800
N
434 27 12 3 3 2 2 1 1 1
15
125
23 242
Average copy number and copy number range were calculated using the data on rDNA amounts (Figures 5 and 6), a genome size of 13.2 pg (BENNETT and SMITH 1976), average rDNA repeat length of 10.5 kb (LAMPPA, HONDA and BENDICH 1984; ROGERS, HONDA and BENDICH 1986) and 1 pg = 9.11 X lo5 kb. The maximum amount of variation is also presented. N = number of individuals.
a The values for variation, average and range are from plant 15 (Figure 5) which exhibited the widest variation.
The values for variation, average and range are from the FI progeny of plant 17 (Figure 7) which exhibited the widest variation.
The values for variation, average and range are from the FI progeny from the 4 1 X 46 cross and from the F2 progeny from the 1 x 8 cross (Figure 8) which exhibited the widest variations.
are occurring frequently in the rDNA region to cause the copy number and NTS size class variations. Changes in the NTS size class proportions were not observed within an individual plant (ROGERS, HONDA and BENDICH 1986), but copy number variation was seen in the present study. Most often the changes observed were 2-fold and less, but in 20% of the plants from 4- to 12-fold variation was measured between
FIGURE 6.-Variation among V. fubu individuals in rDNA amounts for different tissues. The rDNA amounts are given as a percentage of the genome. Open triangles indicate the mean value for each distribution. T o test the reproducibility of the as- say, nine of the DNA samples were dotted onto separate positions on the blots. The average variation between duplicate samples was 1.5 +. 0.3-fold. Inaddition, DNA was extracted from two or three different parts of the same leaf sample. The concentrations of the DNAs were measured sepa- rately and the DNAs were then dot- ted separately. The average variation for the 22 duplicate comparisons was 1.7 f 0.7-fold.
29 31
FIGURE 7.-Distribution of rDNA amounts in progeny from self-pollination. The data point on top in each comparison repre- sents the amount of rDNA measured in the leaf of the parent. The data points below represent the amounts in the leaves of each of the FI progeny. The scale is in rDNA as a percentage of total DNA. Ribosomal DNA amount appears above each data point for the parents. Reference numbers for each parent correspond to those in Figure 8 (where applicable).
tissues (Figure 5). This type of change, not associated with meiosis, indicates that unequal sister chromatid exchanges are probably occurring to generate these differences. Individual classes of NTS were observed which, over two generations, doubled in hybridization band intensity while all or most of the other bands remained constant (Figures 2b. and 3 and Table 1). The changes in intensity accounted for hundreds to thousands of gene copies. This observation indicates that the arrangement of NTS size classes on the chro- mosome is not random, but some clustering of partic-

S. 0. Rogers and A. J. Ekndich
0.10 . . m " . 7: jr .. .
.
p * O ? 11 @
.
0.09 0.36 . A
I a io 020 0 .
A
+. .. . .
. . r y .. .. .
.A
d o o kt. .
- 0.20 %
FIGURE S.-Distribution of rDNA amounts for parents and progeny produced from cross-pollination. The two data points on top in each comparison represent the amounts of rDNA measured in the leaves of the t w o parents. The data point(s) in the middle represent the value(s) measured in leaves of the FI heterozygote(s). The lower data points are the amounts measured in the leaves of the F* progeny produced from self-pollination of the FI heterozygote(s). Asterisks below some of the FP progeny indicate the 34 individuals that exhibited novel rDNA EcoRl blot-hybridization patterns (see Table 1). Scale is in rDNA as a percent of total DNA. Ribosomal DNA amount appears above the data points for each of the parents. Reference numbers for parents (males in squares, females in circles) correspond to those in Figure 7 (where applicable).
FICUREQ.-R-IOO~S formed between rRNA and ribosomal genes. V. faba lSS/25S rRNA and rDNA were used. Bar is 1 kb. Interpretive drawing (below) indicates the location of the 18s and 25s genes as well as the NTSs. This molecule contains three NTSs, each of a different length.
ular size classes exists. Nearest neighbor analysis from R-looping studies confirmed that some clustering of NTS size classes was present (Figure IO). Since large misalignments of ribosomal gene repeat units during crossing over would tend to alter band proportions more often than would small misalignments, and be-
cause the band changes were observed only after many cell divisions (i.e., after at least one generation), overall the misalignments must have been small in size. How- ever, the rearrangements themselves must be occur- ring frequently, since large copy number differences were measured between tissues of an individual.
Although the data indicate that sister chromatid exchanges are probably responsible for the copy num- ber changes and the variation seen in hybridization pattern, it is also possible that the additional copies could arise from extrachromosomal amplification events without sister chromatid exchange, as occurs for the rDNA of Tetrahymena themophila (PAN et al. 1982), Physarum polycephalum (VOCT and BRAUN 1977), Xenopus luevis (WELLAUER et al. 1976) and Ascaphus truei (MACGREGOR and KEZER 1970). We have no direct evidence excluding this possibility, but gross amplification (and deletion) events cannot alone account for the hybridization pattern variation ob- served in the population and the relative stability of the pattern over several generations. Furthermore, the proportion of rDNA in total DNA is the same for diploid embryos and highly polyploid cotyledons (9OC; DAVIS 1977). In Xenopus luevis oocytes NTS size class proportions changed during amplification of the rDNA (WELLAUER et al. 1976), but we see no such change within individual plants. However, in cotyle- don cells the number of gene copies are on average 80 times greater than in leaf cells and 50 times greater

Ribosomal RNA Genes in Viciafubu 293
35-
30-
25-
E 20- Q,
15-
10-
5-
n
-
J I
I "
0 1 2 3 4 5 6 7 8 e 0 Nearest Neighbor Differences
( kb 1 FIGURE lO.-Distribution of length differences of nearest neigh-
bor NTSs. The differences, in l-kb steps, between one NTS'and its neighboring NTSs were determined by R-loop analysis (data from Table 3). The percentage in each length interval is indicated by the black bars. The expected random distribution of the differ- ences between nearest neighbors (white bars) was calculated from the proportion of each NTS size class in the population. This proportion was determined from a densitometer trace of an auto- radiograph of a rDNA EcoRI blot-hybridization pattern from 50 pooled individuals. Category 0 indicates NTS nearest neighbors that are identical in length; category 1 indicates nearest neighbors that are different by up to and including 1 kb; and so on. For example, 9% of the neighboring NTSs differed in length by 2-3 kb, whereas if distribution were random the expected value would be 15%. At P = 0.05, the observed distribution is statistically different from the expected random distribution.
than in embryo cells. In order to account for these observations, the amplification events would have to act on a vast majority of the gene copies and take place on the chromosome rather than extrachromo- somally. The simpler explanation is that exchanges between chromatids are exclusively responsible for the variation in NTS size class and gene copy number.
Data from the other species of Vicia indicate that similar rearrangements are probably occurring in those plants as well. In some species NTS size class variation is absent (V, sativa, V. tetrasperma and V. melanops in Figure 4) perhaps due to a homogeniza- tion after exchange or by tight control of NTS align- ment during recombination, whereas in others such processes do not limit variation (V. villosa, V. dasy- carpa, V. benghalensis and V. faba). Studies with maize have shown that while copy number differences are observed among different cultivars (BUESCHER, PHIL- LIPS and BRAMBL 1984; RIVIN, CULLIS and WALBOT 1986), the rDNA hybridization pattern among culti- vars is nearly invariant (RIVIN et al. 1983). Since the maize NTS contains 10 subrepetitive elements in a similar location as the subrepetitive elements found in V. faba (MCMULLEN et al. 1986; YAKURA, KATO and
TANIFUJI 1984; KATO, YAKURA and TANIFUJI 1985), there is a possibility for NTS size class variation. Additionally, in T. vulgaris, the blot-hybridization pat- terns show that little, if any, variation is found in the NTSs, but a 10-fold variation in copy number can exist within a population. Furthermore, the rDNA is located at many different chromosomal sites (AN- DRONICO et al. 1985). In contrast, V. faba exhibits great variation in both NTS size classes and copy number, but all of the rDNA is located at one locus on a single chromosome (KNALMANN and BURGER 1977; SCHUBERT, BAUMLEIN and WOBUS 1978). Therefore, copy number variation does not imply that size class variation is also present and increasing the number of different rDNA loci does not necessarily lead to increase in NTS size class variation. It may be that some species in a group have a more active recombination system than others, thus increasing the variability in these species.
Certain environmental factors can alter the amount of variation in NTS size class and the copy number of the ribosomal genes. Such alterations have been in- ferred to result from changes in temperature and rainfall among wild populations of wheat (FLAVELL et al. 1986) and have been induced by fertilizer treat- ments and plant crowding in flax (CULLIS 1977) and by changing hormone concentration in cultured melon (Cucumis melo) cells (GRISVARD and TUFFET- ANGHILERI 1980; BENDICH and WARD 1980). Al- though no adaptive significance is evident in any of these cases, this does imply that changes in recombi- nation rates may change in response to stress. More than 60% of the over 50 plant species so far examined have exhibited some degree of variation in their rDNA, most in the NTS and less in the genes them- selves (ROGERS and BENDICH 1987). Whereas extra- chromosomal amplification is responsible for increas- ing ribosomal RNA gene copy number in T. thermo- phila (PAN et al. 1982) and P. polycephalum (VOGT and BRAUN 1977) and in certain tissues of X. laaris (WEL- LAUER et al. 1976) and A. truei (MACGREGOR and KEZER 1970), recombination appears to be the mech- anism used in other organisms [for example, Triticum aestivum (DVOFZK and APPELS 1986), V. faba (ROGERS, HONDA and BENDICH 1986) and D. melanogaster (WEL- LAUER and DAWID 1977)l.
Variation between ribosomal RNA genes in V. faba and other species has been found to be due to variable numbers of subrepetitive elements located in the NTS near the 3' end of the 25s rRNA gene for V. faba (YAKURA, KATO and TANIFUJI 1984), T. aestivum (LAS- SNER and Dvo~AK 1986) and Hordeum vulgare (SAG- HAI-MAROOF et al. 1984). It seems likely, therefore, that the subrepeats are often sites of recombination. Unequal recombination may also occur at other sites in the rDNA region, as indicated by the presence of
294 S. 0. Rogers and A. J. Bendich
TABLE 3
Pairings of NTS nearest neighbors
Si7e classes (kb)
1.4 1.8 2.3 3.2 3.6 3.8 4.0 4.3 4.5 4.7 5.0 5.3 5.5 5.8 6.1 6.4 6.7 6.9 7.1 7.5 7.8 8.1 8.3 8.6 8.9 9.2 9.5 10.1
9.5 5.8 4.0 5.3 5.3 6.9 2.3 4.7 5.3 4.3 4.7 3.2 5.0 1.8 4.7 5.0 7.5 1.8 1.8 5.5 5.3 7.1 4.7 4.5 6.1 5.0 1.4 10.1 6.9 9.5 5.8 5.8 5.3 8.6 5.0 5.3 3.6 5.0 3.6 5.0 5.8 3.8 5.3 5.8 7.1 5.5 2.3 7.1 5.8 5.3 5.3 5.5 4.3 5.3 4.0 5.0 5.8 5.3 6.7 7.1 6.9
5.8 6.1 5.5 4.3 6.1 4.0 5.3 7.1 5.8 8.3 5.8 4.5 7.5 4.0 5.3 9.5 6.9
6.1 4.7 8.6 5.0 5.5 8.1 6.1 5.0 5.3 8.9 8.1 6.4 5.3 5.8 8.6 9.2 5.5 6.4
5.8 6.9 6.1 7.1 6.1 7.5 7.1 . .. 7.1 7.8
T h e sizes (in kb) of the nearest neighbor NTSs are listed beneath each NTS size class. T h e most abundant size class, as determined from rDNA EcoRI blot-hybridization, contains 6 of the 325-bp subrepeat units (based on ROGERS, HONDA and BENDICH 1986; and KATO, YAKURA and TANIFUJI 1985) and would correspond to the 5.3-kb class. An NTS of 4.0 kb would contain no 325-bp repeats. NTSs smaller than this, seen here, were also detected by blot-hybridizations, as were sizes greater than 10 kb (>20 subrepeats).
rRNA transcription units arranged in head-to-head and tail-to-tail orientation and truncated versions of ribosomal RNA genes in species of green algae (BER- GER and SCHWEIGER 1975).
We conclude that unequal exchanges in the rDNA region in V. faba, and probably as a general phenom- enon in other plants and animals as well, are the cause of changes in the rDNA copy number. These changes are frequent and are not restricted to meiosis, but occur during mitotic divisions. On the short length scale, the exchanges can create new size classes of NTS by misalignment of the 325-bp subrepeats (ROG- ERS, HONDA and BENDICH 1986). On the long scale, the exchanges can alter copy number and NTS size class proportions. While we have shown that copy number changes occur (probably via sister chromatid exchange) in the subrepeat region of the ribosomal RNA genes, the same sort of process is probably responsible for changing the copy numbers of other tandemly repeated sequences as well. The reason for the large excess of rDNA in plants, and total DNA in general, is unknown (see GALL 1981). Although the rDNA copy number in the leaf of one individual of V. faba is 22,000, it is clear that 1% of these genes is adequate for another individual in the same popula- tion (Figure 6). Furthermore, the range of 41,000 to over 1.8 million for cotyledons indicates that one plant produced 1.8 million gene copies that were not re- quired for growth and development of its cotyledons. Thus while it is possible that the excess copies of rDNA are necessary for maintaining a large rRNA gene pool needed for adapting to stressful conditions, it is more likely that they have no adaptive significance and are merely tolerated by the plant as a by-product of DNA synthesis and rearrangement processes. Even sequences indistinguishable from true genes may con- tribute to the vast majority of nuclear DNA that has no phenotypic consequence.
LITERATURE CITED
ANDRONICO, F., S. DELUCCHINI, F. GRAZIANI, I. NARDI, R. BATIS- TONI and G. BARSACCHI-PILONE, 1985 Molecular organiza- tion of ribosomal RNA genes clustered at variable chromo- somal sites in Triturus vulgaris meridionalis (Amphibia, Uro- dela). J. Mol. Biol. 1 8 6 219-229.
BELL, G . I., L. J. DEGENNARO, D. H. GELFAND, R. J. BISHOP, P. VALENZUELA and W. J. RUTTER, 1977 Ribosomal RNA genes of Saccharomyces cerevisiae. J. Biol. Chem. 252: 81 18-81 25.
BENDICH, A. J. and B. L. WARD, 1980 On the evolution and functional significance of DNA sequence organization in vas- cular plants. pp. 17-30. In: Genome Organization and Expression in Plants, Edited by C. J. LEAVER. Plenum Press, New York.
Nuclear DNA amounts in angiosperms. Philos. Trans. R. Soc. Lond. Ser. B 274 227- 274.
Ribosomal DNA in dif- ferent members of a family of green algae (Chlorophyta, Dasy- cladaceae): an electron microscopical study. Planta 127: 49-62.
Ribosomal RNA contents of maize genotypes with different ribosomal RNA gene numbers. Biochem. Genet. 22: 923-930.
Dynamics of concerted evolution of ribosomal DNA and histone gene fam- ilies in the melanogaster species subgroup of Drosophila. J. Mol. Biol. 158: 17-35.
CULLIS, C. A., 1977 Molecular aspects of the environmental in- duction of heritable changes in flax. Heredity 38: 129-154.
DAVIES, D. R., 1977 DNA contents and cell number in relation to seed size in the genus Vicia. Heredity 3 9 153-163.
DOVER, G., S. BROWN, E. S . COEN, J. DALLAS, T. STRACHAN and M. TRICK, 1982 The dynamics of genome evolution and species differentiation. pp. 343-372. In: Genome Evolution, Edited by G. A. DOVER and R. B. FLAVELL. Academic Press, London.
Investigation of homologous crossing over and sister chromatid exchange in the wheat NOR- B2 locus coding for rRNA and GLI-B2 locus coding for glia- dins. Genetics 113: 1037-1056.
Repeated sequences and genome change. pp. 139-156. In: Genetic Flux in Plants, Edited by B. HOHN and E. S. DENNIS. Springer-Verlag, New York.
FLAVELL, R. B., hl. O’DELL, P. SHARP and E. NEVO, 1986 Variation in the intergenic spacer of ribosomal DNA of
BENNETT, M. D. and J. B. SMITH, 1976
BERGER, S. and H .G. SCHWEIGER, 1975
BUESCHER, P. J., R. L. PHILLIPS and R. BRAMBL, 1984
COEN, E. S., T. STRACHAN and G. DOVER, 1982
DVOGK, J. and R. APPELS, 1986
FLAVELL, R. B., 1985

Ribosomal RNA Genes in Vzciafaba 295
wild wheat, Triticum dicoccoides, in Israel. Mol. Biol. Evol. 3: 547-558.
FUKUEI, K., T. SAKAMAKI, N. TAKAHASHI and S. TANIFUJI, 1975 Stability of rRNA genes during germination of Vicia
faba seeds. Plant Cell Physiol. 16: 387-394. Chromosome structure and the C-value para-
dox. J. Cell Biol. 91: 3s-14s. Variations in the
satellite DNA content of Cucumis melo in relation to dediffer- entiation and hormone concentration. Nucleic Acids Res. 8:
Chromosome structure and DNA replication in nurse and follicle cells of Drosophila melanogaster . Chromosoma 91 : 2 6 7-2 7 8.
HAMMOND, M. P. and C. D. LAIRD, 1985b Control of DNA replication and spatial distribution of defined DNA sequences in salivary gland cells of Drosophila melanogaster. Chromosoma
The relationship between satellite DNA, rRNA gene redundancy, and genome size in plants. Plant Physiol. 55: 496-50 1.
KATO, A., K. YAKURA and S. TANIFUJI, 1985 Repeated DNA sequences found in the large spacer of Vicia faba rDNA. Biochim. Biophys. Acta 825: 41 1-415.
Cytologische lokalisation von 5 s and 18/25S RNA genorten in mitose-chromosomen von Vi& faba. Chromosoma 61: 177-192.
LAMPPA, G. K., S. HONDA and A. J. BENDICH, 1984 The relation- ship between ribosomal repeat length and genome size in Vicia. Chromosoma 8 9 1-7.
Preferential homogenization between adjacent and alternate subrepeats in wheat rDNA. Nucleic Acids Res. 14: 5499-55 12.
LEUTWEILER, L. S., B. R. HOUGH-EVANS and E. M. MEYEROWITZ, 1984 The DNA of Arabidopsis thaliana. Mol. Gen. Genet.
Gene Expression, Vol. 2. Eucaryotic Chro- mosomes. pp. 875-878. John Wiley & Sons, New York.
Gene amplification in oocytes with eight germinal vesicles from the tailed frog Asca- phus truei Stejneger. Chromosoma 29: 189-206.
MACGREGOR, H. C., M. VLAD and L. BARNETT, 1977 An investi- gation of some problems concerning nucleolus organizers in salamanders. Chromosoma 5 9 283-299.
Multiplicity of ribosomal RNA genes in Vicia species with different nuclear DNA contents. Nature New Biol. 245: 170-172.
MCMULLEN, M. D., B. HUNTER, R. L. PHILLIPS and 1. RUBENSTEIN, 1986 The structure of the maize ribosomal DNA spacer region. Nucleic Acids Res. 1 4 4953-4968.
MOORE, S. P. and B. M. SUTHERLAND, 1985 A densitometric nondestructive microassay for DNA quantitation. Anal. Biochem. 144: 15-19.
PAN, W.-C., E. ORIAS, M. FLACKS and E. H. BLACKBURN,
GALL, J. G., 1981
GRISVARD, J. and A. TUFFET-ANGHILERI, 1980
2843-2858. HAMMOND, M. P. and C. D. LAIRD, 1985a
91: 279-286. INGLE, J., J. N. TIMMIS and J. SINCLAIR, 1975
K N ~ M A N N , M. and E.-C. BURGER, 1977
LASSNER, M. and J. Dvo~AK, 1986
194 15-23. LEWIN, B. (Editor), 1980
MACGREGOR, H. C. and J. KEZER, 1970
MAHER, E. P. and D. P. Fox, 1973
1982 Allele-specific, selective amplification of a ribosomal RNA gene in Tetrahymena thermophila. Cell 28: 595-604.
Characterization of the genome of Arabidopsis thaliana. J. Mol. Biol. 187: 169- 183.
Evaluating quantitative variation in the genome of Zea mays. Genetics 113: 1009-1019.
RIVIN, C. J., E. A. ZIMMER, C. A. CULLIS, V. WALBOT, T . HUYNH and R. W. DAVIS, 1983 Evaluation of genomic variability at the nucleic acid level. Plant Mol. Biol. Rep. 1: 9-16.
ROGERS, S. 0. and A. J. BENDICH, 1985 Extraction of DNA from milligram amounts of fresh, herbarium and mummified plant tissues. Plant Mol. Biol. 5: 69-76.
Ribosomal RNA genes in plants: variability in copy number and in the intergenic spacer. Plant Mol. Biol. In press.
Variation in the ribosomal RNA genes among individuals of Vicia faba. Plant Mol. Biol. 6: 339-345.
SAGHAI-MAROOF, M. A., K. M. SOLIMAN, R. A. JORGENSEN and R. W. ALLARD, 1984 Ribosomal DNA spacer-length polymor- phisms in barley: Mendelian inheritance, chromosomal loca- tion, and population dynamics. Proc. Natl. Acad. Sci. USA 81:
SCHUBERT, I., H. BAUMLEIN and U. WOBUS, 1978 In situ hybridi- zation of iodinated 5s and 18/25S RNA to Viciafaba metaphase chromosomes. Biol. Zentralbl. 97: 129-135.
Regulation in rDNA- deficient Drosophila melanogaster. Cell 4 275-280.
Unequal crossing over in the ribosomal DNA of Saccharomyces cerevisiae. Nature 284 426- 430.
TARTOF, K. D., 1975 Redundant genes. Annu. Rev. Genet. 9:
TAUTZ, D. and M. RENZ, 1983 An optimized freeze-sqeeze method for the recovery of DNA fragments from agarose gels. Anal. Biochem. 132: 14-19.
The replication of ribosomal DNA in Physarum polycephalum. Eur. J. Biochem. 80: 557-587.
The structural organi- zation of ribosomal DNA in Drosophila melanogaster. Cell 10: 193-2 12.
WELLAUER, P. K., R. H. REEDER, I. B. DAWID and D. D. BROWN, 1976 The arrangement of length heterogeneity in repeating units of amplified and chromosomal ribosomal DNA from Xenopus lamis. J. Mol. Biol. 105 487-505.
YAKURA, K. and S. TANIFUJI, 1983 Molecular cloning and restric- tion analysis of EcoRI-fragments of Viciafaba rDNA. Plant Cell Physiol. 24: 1327-1330.
Length heteroge- neity in the large spacer of Vicia faba rDNA is due to the differing number of a 325 bp repetitive sequence elements. Mol. Gen. Genet. 193: 400-405.
Communicating editor: M. R. HANSON
PRUITT, R. E. and E. M. MEYEROWITZ, 1986
RIVIN, C. J., C. A. CULLIS and V. WALBOT, 1986
ROGERS, S. 0. and A. J. BENDICH, 1987
ROGERS, S. O., S. HONDA and A. J. BENDICH, 1986
801 4-801 8.
SHERMOEN, A. W. and B. I. KIEFER, 1975
SZOSTAK, J. W. and R. WU, 1980
355-385.
VOGT, V. M. and R. BRAWN, 1977
WELLAUER, P. K. and I. B. DAWID, 1977
YAKURA, K., A. KATO and S. TANIFUJI, 1984