Embed Size (px)
Citation preview

1
TITLE1
Gazelle seasonal mobility in the Jordanian Steppe: the use of dental isotopes and microwear as2
environmental markers, applied to Epipalaeolithic Kharaneh IV3
4
ABSTRACT5
The Early/Middle Epipalaeolithic aggregation site of Kharaneh IV in the east Jordan steppe is one of the largest6
of the period, showing repeated use, high degrees of site investment, and relatively prolonged periods of7
occupation. Hunters relied heavily on the single prey species, Gazella subgutturosa. This paper reports on8
isotopic analyses of gazelle teeth, drawn from the Kharaneh IV assemblage, to explore the seasonal and spatial9
distribution of gazelle in life and examine models of long-distance seasonal gazelle migrations. Dental10
microwear analysis is also employed to assess hunting seasons.11
12
Results from sequential isotope analyses of 11 Epipalaeolithic gazelle molars show that, with one exception,13
gazelle did not move seasonally from the limestone steppe onto other geologies, nor did they seasonally relocate14
to areas with different climate regimes. Rather, seasonal herd mobility seems to have been local, meaning15
animals would have been available in the vicinity of Kharaneh IV year-round. Results from 19 microwear16
analyses show some gazelle to have died in spring when grass graze was available, whilst others had been17
browsing around their time of death, indicating non-spring hunting. Microwear evidence thus suggests gazelle18
were hunted in more than one restricted season. The implications of these new datasets for hunter-gatherer use19
of the steppe, and potential hunting methods, is highlighted.20
21
KEY WORDS22
Early/Middle Epipalaeolithic23
Oxygen, carbon, strontium isotopes24
Dental microwear analysis25
Gazelle seasonal mobility26
Hunting seasonality27
28
29
30
31
32
33
34
35
36
37
38
39
40
2
INTRODUCTION1
2
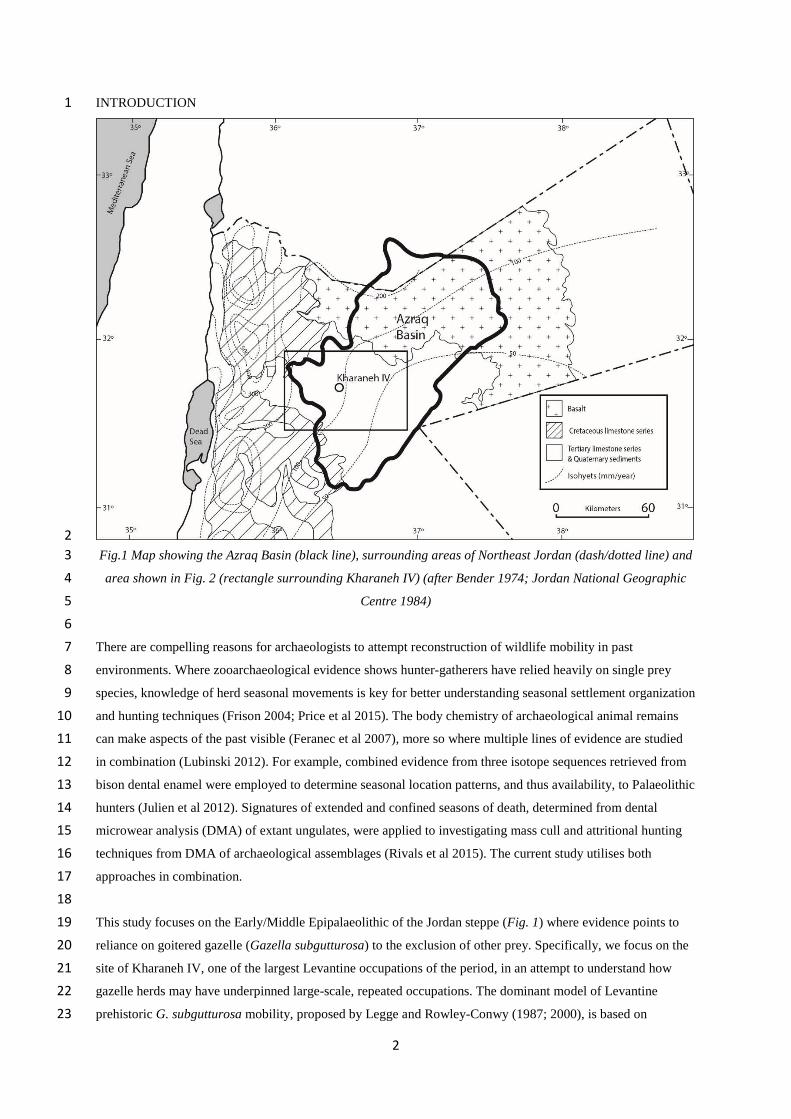
Fig.1 Map showing the Azraq Basin (black line), surrounding areas of Northeast Jordan (dash/dotted line) and3
area shown in Fig. 2 (rectangle surrounding Kharaneh IV) (after Bender 1974; Jordan National Geographic4
Centre 1984)5
6
There are compelling reasons for archaeologists to attempt reconstruction of wildlife mobility in past7
environments. Where zooarchaeological evidence shows hunter-gatherers have relied heavily on single prey8
species, knowledge of herd seasonal movements is key for better understanding seasonal settlement organization9
and hunting techniques (Frison 2004; Price et al 2015). The body chemistry of archaeological animal remains10
can make aspects of the past visible (Feranec et al 2007), more so where multiple lines of evidence are studied11
in combination (Lubinski 2012). For example, combined evidence from three isotope sequences retrieved from12
bison dental enamel were employed to determine seasonal location patterns, and thus availability, to Palaeolithic13
hunters (Julien et al 2012). Signatures of extended and confined seasons of death, determined from dental14
microwear analysis (DMA) of extant ungulates, were applied to investigating mass cull and attritional hunting15
techniques from DMA of archaeological assemblages (Rivals et al 2015). The current study utilises both16
approaches in combination.17
18
This study focuses on the Early/Middle Epipalaeolithic of the Jordan steppe (Fig. 1) where evidence points to19
reliance on goitered gazelle (Gazella subgutturosa) to the exclusion of other prey. Specifically, we focus on the20
site of Kharaneh IV, one of the largest Levantine occupations of the period, in an attempt to understand how21
gazelle herds may have underpinned large-scale, repeated occupations. The dominant model of Levantine22
prehistoric G. subgutturosa mobility, proposed by Legge and Rowley-Conwy (1987; 2000), is based on23
3
zooarchaeological analysis of late Epipalaeolithic gazelle remains from Abu Hureyra (Middle Euphrates), and1
draws on ethno-historic observations (18th - 20th C AD) of gazelle movements. Their study posits that the2
northern migration point of gazelle herds was near Abu Hureyra in spring for fresh graze, and their3
southernmost over-wintering point was the Jordanian steppe. This long-distance migration model has found4
widespread acceptance, particularly as an explanation for mass-capture ‘kite’ structures (e.g. Bar-Oz et al 2011),5
while some authors have also suggested that large Epipalaeolithic sites such as Kharaneh IV developed on6
gazelle migration routes (Goring-Morris 1995, 156).7
8
Gazelles are extinct in the Jordanian steppe today, and historical accounts of recent mobility patterns cannot be9
assumed for the Epipalaeolithic before millennia of landscape degradation and livestock grazing (Martin 2000).10
Independent approaches are required for reconstructing the seasonal mobility of prehistoric gazelle herds (Julien11
et al 2012). We infer mobility and feeding seasonality from oxygen, carbon and strontium stable isotope12
sequences retrieved from Kharaneh IV gazelle teeth to ask whether, during the Epipalaeolithic, targeted herds13
undertook long-distance seasonal migrations in and out of the Jordan steppe area. Dental microwear analysis of14
the same tooth samples augment hunting seasonality evidence, providing indicators of diet, known to vary15
seasonally, at time of death. This study is the first use of archaeological isotopes to examine Gazella16
subgutturosa seasonal mobility in the Levantine Epipalaeolithic and the first regional application of a combined17
isotope/DMA approach.18
19
KHARANEH IV20
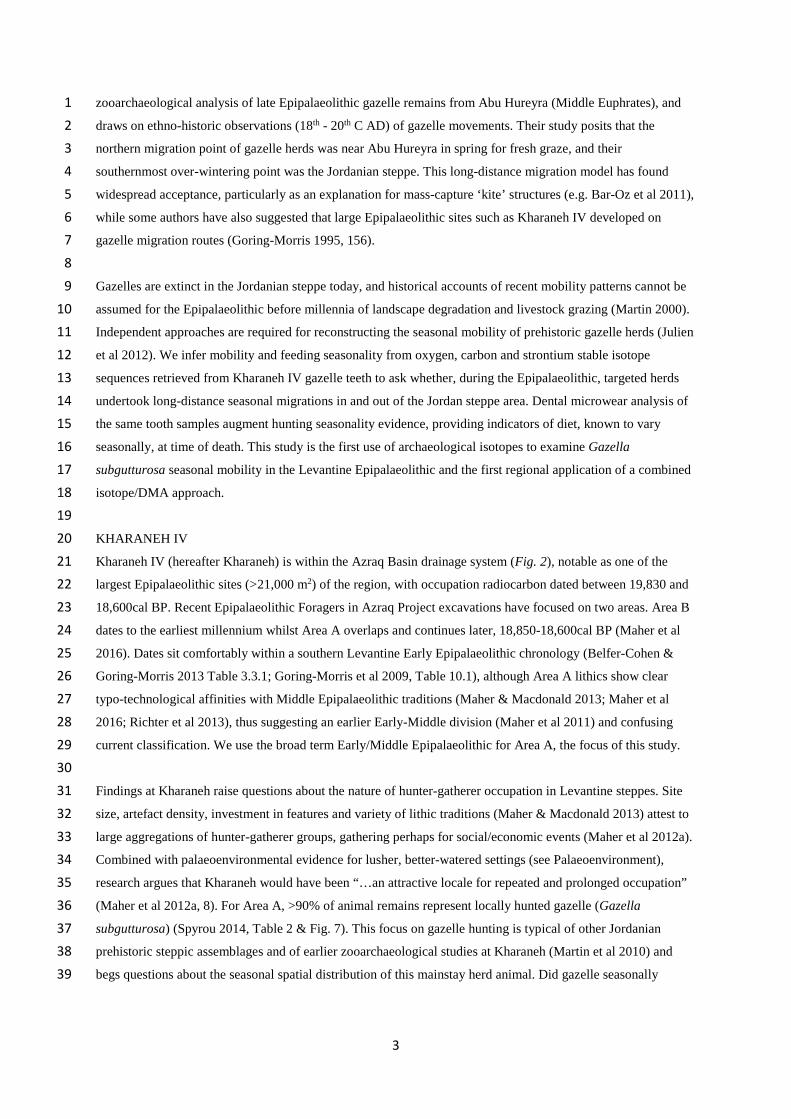
Kharaneh IV (hereafter Kharaneh) is within the Azraq Basin drainage system (Fig. 2), notable as one of the21
largest Epipalaeolithic sites (>21,000 m2) of the region, with occupation radiocarbon dated between 19,830 and22
18,600cal BP. Recent Epipalaeolithic Foragers in Azraq Project excavations have focused on two areas. Area B23
dates to the earliest millennium whilst Area A overlaps and continues later, 18,850-18,600cal BP (Maher et al24
2016). Dates sit comfortably within a southern Levantine Early Epipalaeolithic chronology (Belfer-Cohen &25
Goring-Morris 2013 Table 3.3.1; Goring-Morris et al 2009, Table 10.1), although Area A lithics show clear26
typo-technological affinities with Middle Epipalaeolithic traditions (Maher & Macdonald 2013; Maher et al27
2016; Richter et al 2013), thus suggesting an earlier Early-Middle division (Maher et al 2011) and confusing28
current classification. We use the broad term Early/Middle Epipalaeolithic for Area A, the focus of this study.29
30
Findings at Kharaneh raise questions about the nature of hunter-gatherer occupation in Levantine steppes. Site31
size, artefact density, investment in features and variety of lithic traditions (Maher & Macdonald 2013) attest to32
large aggregations of hunter-gatherer groups, gathering perhaps for social/economic events (Maher et al 2012a).33
Combined with palaeoenvironmental evidence for lusher, better-watered settings (see Palaeoenvironment),34
research argues that Kharaneh would have been “…an attractive locale for repeated and prolonged occupation”35
(Maher et al 2012a, 8). For Area A, >90% of animal remains represent locally hunted gazelle (Gazella36
subgutturosa) (Spyrou 2014, Table 2 & Fig. 7). This focus on gazelle hunting is typical of other Jordanian37
prehistoric steppic assemblages and of earlier zooarchaeological studies at Kharaneh (Martin et al 2010) and38
begs questions about the seasonal spatial distribution of this mainstay herd animal. Did gazelle seasonally39
4
1
Fig. 2 Map showing the location of Kharaneh and the wadi system draining into the central Azraq Oasis2
3
migrate in and out of the Jordan steppe or could they have maintained a more year-round presence? The latter4
could have aided the prolonged hunter-gatherer site residence proposed by Kharaneh excavators (Maher et al5
2012a).6
7
There are presently two sources of evidence for Kharaneh gazelle hunting seasonality. Fusion data shows8
targeted winter culling and slight evidence for spring culls (Martin et al 2010), and a tooth cementum pilot study9
(Jones 2012) finds evidence for both spring/summer and autumn/winter culls. Questions remain as to whether10
gazelle herds were on northerly migrations in spring (as Legge and Rowley-Conwy predict) and were present in11
the Jordan steppe mainly in winter, or whether other mobility patterns pertained. Animal behavioural plasticity12
is an adaptive response to environmental conditions, and Martin (2000) has argued that small-bodied gazelle13
may not have needed to move far in search of resources. Considering G. subguttorosa behavioural and forage14
requirements, and the environmental parameters of our study region, we propose four potential herd mobility15
patterns for Epipalaeolithic gazelle herds (Fig. 3). Gazelle herds might seasonally aggregate and disperse locally16
in the steppe (1), or might undergo longer seasonal migrations following better resources, westwards into the17
Jordanian Highlands in summer (2), northwards towards the Middle Euphrates in spring (3) or south-eastwards18
along the Wadi Sirhan corridor (4). In cases 2-4, animal presence in the Jordan steppe is predicted to be19
seasonal.20
21
AZRAQ BASIN PALAEOENVIRONMENT22
Geology23

5
1
Fig.3 Map showing the four proposed movement patterns of gazelle in the Early/Middle Epipalaeolithic (after2
Bender 1974; Jordan National Geographic Centre 1984)3
4
The Azraq Basin is a 12,000km2 endorheic drainage basin covering north-central Jordan (Garrard & Byrd 2013),5
with Early Tertiary (tt1) chalky limestones and marls exposed along western and eastern flanks. In the north6
there is an extensive cover of Pliocene/Oligocene (B4) and Pliocene/Miocene (B5) basalts, whilst in the centre7
and southeast there is a spread of Quaternary gravels and silts (q2). Further west, the Jordanian Highlands are8
composed of Cretaceous dolomitic limestones and marls (c2) (Bender 1974). Wadi Kharaneh, in the Basin’s9
central-western sector, drains from Early Tertiary uplands (c850m) to the central Qa Azraq (c500m). Kharaneh10
is situated in the broad wadi c640masl, c40km west of Azraq (Fig. 2). Where conditions allow, small pockets of11
rendzina soils have accumulated.12
13
Climate and hydrology14
Present-day Azraq Basin temperatures range from 45ºC to -10 ºC, and precipitation from 200mm (NW) to15
<50mm (SE). The Mediterranean controls rainfall distribution; westerly winds bring rain in the cold season but16
effectively none in the highly evaporative hot season (Enzel et al 2008) (Fig. 4). Winter run-off collects in17
playas and stream channels but evaporates as temperatures rise, becoming highly saline and drying within18
months; only spring-fed Azraq Oasis marshlands have perennial freshwater.19
20
6
1
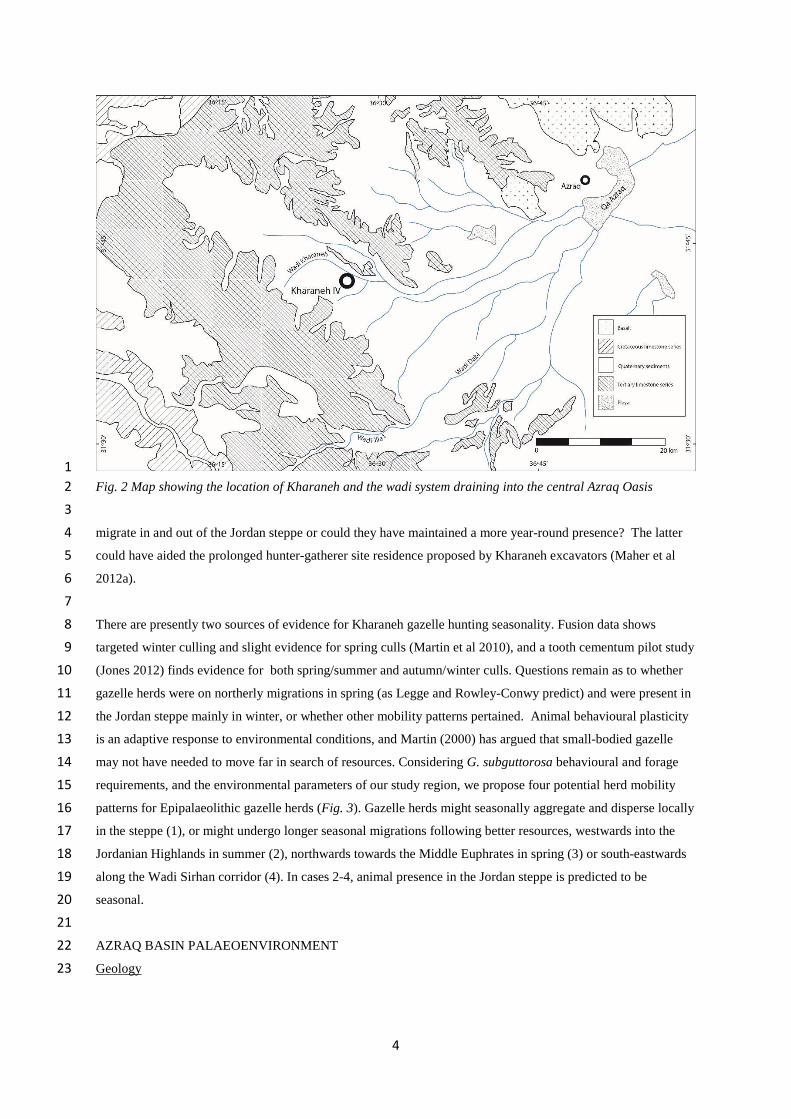
Fig. 4 Mean monthly GNIP temperature and precipitation data for Azraq (WMO/IAEA 2014) with the prime2
vegetation growth season3
4
Regional and local evidence (Frumkin et al 1999; Hunt and Garrard 2013; Jones & Richter 2011; Jones et al5
2016; Ramsey & Rosen 2016) suggest the Last Glacial Maximum (LGM) climate in the Mediterranean zone and6
regions due east was wetter than now, but with the same atmospheric circulation and seasonality (Enzel et al7
2008). However, there is evidence for increasing dryness during the post-LGM period (Hunt and Garrard 2013;8
Jones et al 2016). Kharaneh was established on the marls of a receding wetland area, possibly 2km maximum,9
which appears to have dried out during occupation, later overlain by loess (Garrard et al 1985; Jones et al 2016).10
11
Vegetation12
Due to precipitation seasonality, opportunistic annual grasses and forbs germinate rapidly in moist, warming13
spring soils, outcompeting slower growing perennials but soon setting seed and withering as aridity increases,14
leaving only xeric shrubs and species tolerant of soil salinity (Batanouny 2001; Hillman 1996). Vegetation15
zones grade according to isohyets; the Highlands have higher rainfall and lower temperatures supporting oak16
woodland (>400mm) and park woodland/ woodland steppe (400-200mm). Within the Azraq Basin, this grades17
into the steppe plant community described above (200-100mm), and desert vegetation (<100mm) (Hillman18
1996; Hillman in Moore et al 2000). Each zone extends further east along wadi edges than on interfluvial plains,19
and in the Oasis permanent springs support marshland plants. Today, Kharaneh is located on the Irano-Turanian20
steppe/desert 100mm isohyet boundary.21
22
Modelled palaeovegetation distribution (Byrd et al 2016; Colledge 2001; Hillman 1996) shows an eastward shift23
and greater species abundance, such that xeric woody thickets encroached along wadis and perennial pools;24
7
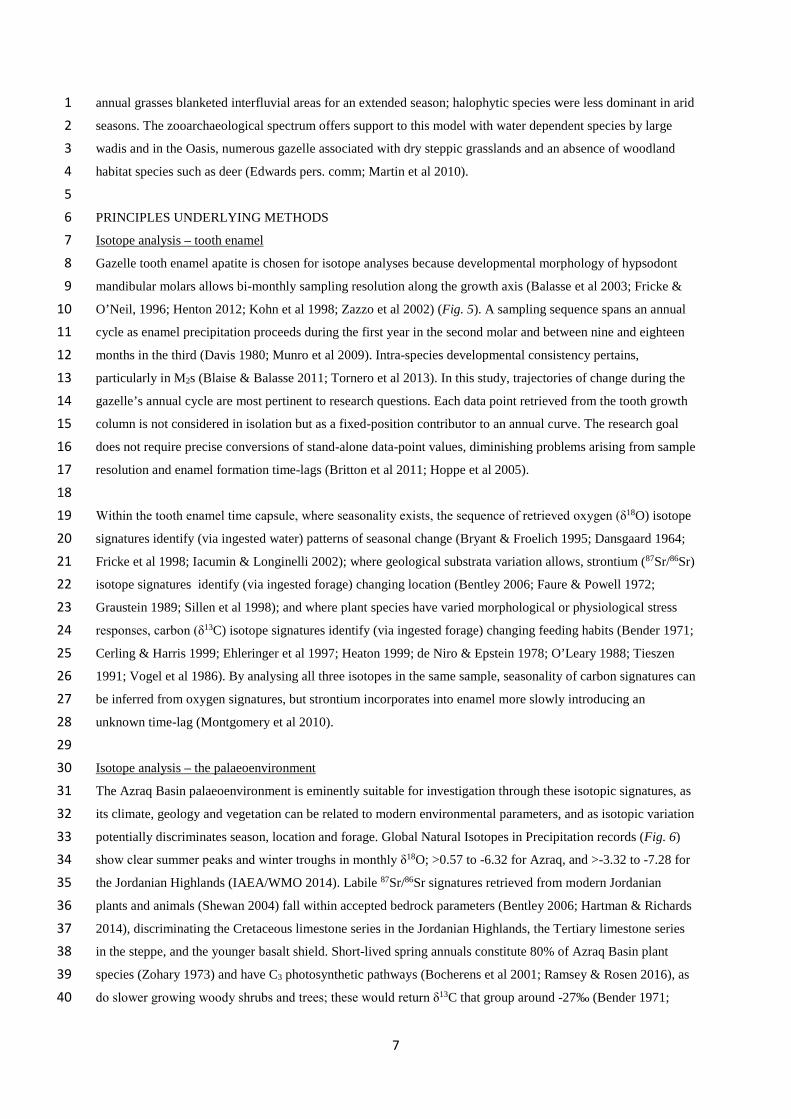
annual grasses blanketed interfluvial areas for an extended season; halophytic species were less dominant in arid1
seasons. The zooarchaeological spectrum offers support to this model with water dependent species by large2
wadis and in the Oasis, numerous gazelle associated with dry steppic grasslands and an absence of woodland3
habitat species such as deer (Edwards pers. comm; Martin et al 2010).4
5
PRINCIPLES UNDERLYING METHODS6
Isotope analysis – tooth enamel7
Gazelle tooth enamel apatite is chosen for isotope analyses because developmental morphology of hypsodont8
mandibular molars allows bi-monthly sampling resolution along the growth axis (Balasse et al 2003; Fricke &9
O’Neil, 1996; Henton 2012; Kohn et al 1998; Zazzo et al 2002) (Fig. 5). A sampling sequence spans an annual10
cycle as enamel precipitation proceeds during the first year in the second molar and between nine and eighteen11
months in the third (Davis 1980; Munro et al 2009). Intra-species developmental consistency pertains,12
particularly in M2s (Blaise & Balasse 2011; Tornero et al 2013). In this study, trajectories of change during the13
gazelle’s annual cycle are most pertinent to research questions. Each data point retrieved from the tooth growth14
column is not considered in isolation but as a fixed-position contributor to an annual curve. The research goal15
does not require precise conversions of stand-alone data-point values, diminishing problems arising from sample16
resolution and enamel formation time-lags (Britton et al 2011; Hoppe et al 2005).17
18
Within the tooth enamel time capsule, where seasonality exists, the sequence of retrieved oxygen (δ18O) isotope19
signatures identify (via ingested water) patterns of seasonal change (Bryant & Froelich 1995; Dansgaard 1964;20
Fricke et al 1998; Iacumin & Longinelli 2002); where geological substrata variation allows, strontium (87Sr/86Sr)21
isotope signatures identify (via ingested forage) changing location (Bentley 2006; Faure & Powell 1972;22
Graustein 1989; Sillen et al 1998); and where plant species have varied morphological or physiological stress23
responses, carbon (δ13C) isotope signatures identify (via ingested forage) changing feeding habits (Bender 1971;24
Cerling & Harris 1999; Ehleringer et al 1997; Heaton 1999; de Niro & Epstein 1978; O’Leary 1988; Tieszen25
1991; Vogel et al 1986). By analysing all three isotopes in the same sample, seasonality of carbon signatures can26
be inferred from oxygen signatures, but strontium incorporates into enamel more slowly introducing an27
unknown time-lag (Montgomery et al 2010).28
29
Isotope analysis – the palaeoenvironment30
The Azraq Basin palaeoenvironment is eminently suitable for investigation through these isotopic signatures, as31
its climate, geology and vegetation can be related to modern environmental parameters, and as isotopic variation32
potentially discriminates season, location and forage. Global Natural Isotopes in Precipitation records (Fig. 6)33
show clear summer peaks and winter troughs in monthly δ18O; >0.57 to -6.32 for Azraq, and >-3.32 to -7.28 for34
the Jordanian Highlands (IAEA/WMO 2014). Labile 87Sr/86Sr signatures retrieved from modern Jordanian35
plants and animals (Shewan 2004) fall within accepted bedrock parameters (Bentley 2006; Hartman & Richards36
2014), discriminating the Cretaceous limestone series in the Jordanian Highlands, the Tertiary limestone series37
in the steppe, and the younger basalt shield. Short-lived spring annuals constitute 80% of Azraq Basin plant38
species (Zohary 1973) and have C3 photosynthetic pathways (Bocherens et al 2001; Ramsey & Rosen 2016), as39
do slower growing woody shrubs and trees; these would return δ13C that group around -27‰ (Bender 1971;40

8
1
Fig. 5 Diagram showing a hypothetical annual graph retrieved from the sequential drilling of enamel apatite in2
an ungulate second mandibular molar formed over 12 months3
4
5
Fig 6. Mean monthly GNIP δ18OVSMOW data (WMO/IAEA2014) comparing highland Ras Muneef to Azraq6
(number of modern records7
8
Ehleringer et al 1997; O’Leary 1988). Whereas halophytic chenopods, more predominant throughout the arid9
season, have C4 photosynthetic pathways that enrich δ13C to c.-12‰ (Akhani et al 1997; Shomer-Ilan et al10
1981).11
12
Isotope analysis – gazelle ethology13
This research focuses on seasonal changes experienced by gazelle, and their ethology constrains likely14
environmental situations. Gazelle are non-obligate drinkers with water needs met by plant tissues, where arid-15

9
season δ18O is considerably enriched by evapo-transpiration (Ayliff & Chivas 1990), enhancing, but not1
masking, the summer/winter range in values (Kohn et al 1996, 1998). However, should gazelle migrate to2
cooler, less-evaporative summer feeding grounds (Poage & Chamberlain 2001), the sinusoidal annual δ18O3
curve would be disrupted due to loss of the extreme arid season signature.4
5
Gazelle ingest strontium from plants which take up only the labile fraction. In more arid regimes, soils largely6
derive from underlying bedrock (Bentley 2006), but where geologies intersect, where upland sediments are7
washed downstream (Graustein 1989; Sillen et al 1998), or where windborne dust settles, the resulting soil8
87Sr/86Sr reflects the contributory mix. For this research, key location soil 87Sr/86Sr signatures are refined with9
the aid of a small modern plant baseline; results for locations deep within major geologies conform to10
established 87Sr/86Sr ranges; local to Kharaneh, Tertiary limestone series 0.70807-0.70819, Highlands11
Cretaceous limestone series 0.70845-0.70854 and basalt lava flows 0.70764-0.70778 (Supplement 1, Table 1 &12
Fig. 1; Henton et al submitted to Environmental Archaeology). Curves constructed from sequential 87Sr/86Sr13
sampling are predicted to be flat in gazelle remaining on a single bedrock type but where they might have14
moved between different geologies within a yearly cycle, the curves would, respectively, progressively rise or15
fall in gazelle progressing onto bedrock with higher or lower 87Sr/86Sr signatures. Climate-induced variation in16
aeolian dust input (Hartman & Richards 2014; Stein et al 2007) would not register within an annual 87Sr/86Sr17
cycle in a gazelle tooth.18
19
Gazelle primarily ingest carbon from forage; grazing or browsing as seasonal mixed feeders on many Irano-20
Turanic species, but preferentially eating high-nutrient grasses, particularly during late gestation and lactation21
(Kingswood & Blank 1996). Seasonal δ13C change in archaeological gazelle enamel is predicted due to the22
combined effects of seasonal availability of C3 and C4 plants and feeding preferences. In spring/early summer,23
when water-stress is minimal, enamel δ13C would be most depleted as gazelle graze C3 grasses, whereas high24
summer to mid-winter browsing on water-stressed C3 shrubs might enrich δ13C by as much as 6‰ (Farquhar et25
al 1989), and the inclusion of C4 halophytes would further raise values. After accounting for a +14.1‰26
fractionation factor between plant and animal tissue (Cerling & Harris 1999), δ13C of -12‰ might be27
approached in spring/early summer, becoming enriched by >-8‰ in the rest of the year.28
29
Dental microwear analysis (DMA)30
Isotope analyses reveal the seasonal forage landscape experienced by gazelle throughout a year of life as a sub-31
adult, whereas DMA elucidates forage conditions in the final weeks before death. Microwear describes marks32
on the enamel surface that last only a few weeks. Their interpretation draws on correlation with diets in modern33
animals (Teaford & Walker 1984). A 2-feature discrimination of pits (length:breadth <4:1) and striations34
(length:breadth >4:1) usefully identifies grazers, with more striations, from browsers, with more pits (Solounias35
& Hayek 1993; Solounias & Moelleken 1992). This holds true across mammalian orders and between36
geographical zones (Mainland 1998; Merceron et al 2005; Wilkie et al 2007), however tooth type introduces37
DMA variation, where pit percentage increases towards the third molar (Gordon 1982).The rapidity of turnover38
allows a bimodial distribution of features in seasonal mixed feeders such as gazelle (Merceron et al 2007; Rivals39
et al 2011; Solounias and Hayek 1993; Solounias & Moelleken 1992).40

10
1
As Jordanian steppe gazelle are seasonal mixed feeders on seasonally available food types, a strong seasonal2
signature might be revealed through DMA. Striation-rich microwear can be associated with spring/early summer3
as the only time when fibrous grasses flourish, pits with later summer, autumn and early winter when soft4
dicotyledonous plants are the sole dietary contributors, and an intermediate signal with the brief transitional5
periods where one diet replaces the other.6
7
Summary8
This research asks simple questions of each dataset; the strength of the approach becomes apparent in their9
combined interpretation constrained by gazelle ethology and palaeoenvironmental reconstruction. In considering10
the seasonal mobility represented by each gazelle tooth sample throughout a year of early life, the δ18O sequence11
enables identification of four seasons, 87Sr/86Sr identifies movement over different geologies, and the δ13C12
sequence identifies dietary shifts between spring/early summer and other seasons. Seasonal mobility patterns for13
sampled individuals are assumed to be representative of those of whole herds; sub-herds of G. subgutturosa may14
briefly form throughout the year, but unite for long-distance movements (Blank et al 2012). We also assume that15
patterns are likely to represent annually repeated movements if environmental pressures are largely unchanged16
(Cunningham & Wronski 2011). Microwear data provide insights on forage conditions around the time of death,17
when the gazelle’s lifecycle was intercepted by hunters; a single tightly clustered pattern can be associated with18
a short, single hunting season, a bimodal pattern with two hunting seasons, and a non-modal, diffuse pattern19
with year-round hunting.20
21
MATERIALS, PREPARATION PROTOCOLS AND ANALYSES22
Fully developed third mandibular molars (M3), just in wear and with closed roots, are most identifiable in the23
fragmented Kharaneh assemblage, but some securely identifiable second molars (M2) were also sampled,24
meeting recommended sample sizes of nine teeth for isotope analyses (Hoppe et al 2005; Pearson & Grove25
2013) and fourteen for microwear analyses (Mainland pers. comm.). Table 1 provides the context and26
description of fourteen M3 and eight M2 archaeological specimens suitable for analyses; these represent twenty27
gazelle as two individuals had both M2 and M3 sampled.28
29
After taking morphometric and photographic records, impression and resin casts were made following Mainland30
(1998) protocols. Four images of the infundibular enamel of the paraconid cusp were captured under a Hitachi31
S–3400N scanning electron microscope (SEM) at x500 magnification. The clearest and most representative was32
imported into Ungar’s (2002) image analysis software (Microware 4.02) where the dimensions and orientation33
of each microwear feature in a surface area of 0.0404mm2 were quantified and categorised.34
35
For isotope analyses, the mesial tooth-column buccal surface of each specimen was cleaned and six sequential36
samples of >20mg drilled at measured distances from the enamel:root junction (see Fig. 5); contamination and37
diagenetic carbonates were removed following established protocols (Balasse 2002). The carbonate fraction38
from 10mg of each was analysed for δ13C and δ18O by Isotope Ratio Mass Spectrometry at UCL Bloomsbury39
Environment Isotope Facility (BEIF). Each remaining 10mg was processed for 87Sr/86Sr analysis under clean40
11
laboratory conditions in the Isotope Geochemistry Laboratories at Royal Holloway College, UL. The sample1
was digested in concentrated HNO3 and the soluble residue passed through columns that collected the strontium2
on Sr-resin. This was eluted with triple-reduced water, evaporated, and mounted on Rhenium filaments for3
analysis in a VG354 Thermal Ionisation Mass Spectrometer.4
5
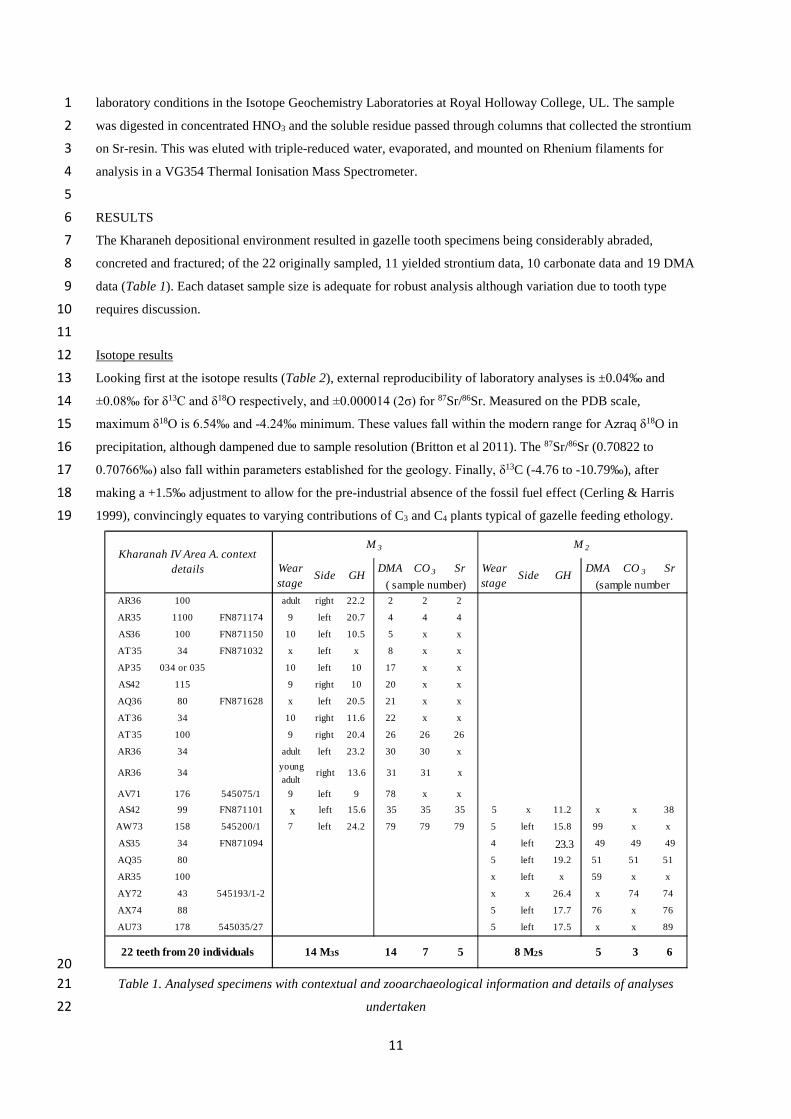
RESULTS6
The Kharaneh depositional environment resulted in gazelle tooth specimens being considerably abraded,7
concreted and fractured; of the 22 originally sampled, 11 yielded strontium data, 10 carbonate data and 19 DMA8
data (Table 1). Each dataset sample size is adequate for robust analysis although variation due to tooth type9
requires discussion.10
11
Isotope results12
Looking first at the isotope results (Table 2), external reproducibility of laboratory analyses is ±0.04‰ and13
±0.08‰ for δ13C and δ18O respectively, and ±0.000014 (2σ) for 87Sr/86Sr. Measured on the PDB scale,14
maximum δ18O is 6.54‰ and -4.24‰ minimum. These values fall within the modern range for Azraq δ18O in15
precipitation, although dampened due to sample resolution (Britton et al 2011). The 87Sr/86Sr (0.70822 to16
0.70766‰) also fall within parameters established for the geology. Finally, δ13C (-4.76 to -10.79‰), after17
making a +1.5‰ adjustment to allow for the pre-industrial absence of the fossil fuel effect (Cerling & Harris18
1999), convincingly equates to varying contributions of C3 and C4 plants typical of gazelle feeding ethology.19
20
Table 1. Analysed specimens with contextual and zooarchaeological information and details of analyses21
undertaken22
DMA CO 3 Sr DMA CO 3 Sr
AR36 100 adult right 22.2 2 2 2
AR35 1100 FN871174 9 left 20.7 4 4 4
AS36 100 FN871150 10 left 10.5 5 x x
AT35 34 FN871032 x left x 8 x x
AP35 034 or 035 10 left 10 17 x x
AS42 115 9 right 10 20 x x
AQ36 80 FN871628 x left 20.5 21 x x
AT36 34 10 right 11.6 22 x x
AT35 100 9 right 20.4 26 26 26
AR36 34 adult left 23.2 30 30 x
AR36 34young
adultright 13.6 31 31 x
AV71 176 545075/1 9 left 9 78 x x
AS42 99 FN871101 x left 15.6 35 35 35 5 x 11.2 x x 38
AW73 158 545200/1 7 left 24.2 79 79 79 5 left 15.8 99 x x
AS35 34 FN871094 4 left 23.3 49 49 49
AQ35 80 5 left 19.2 51 51 51
AR35 100 x left x 59 x x
AY72 43 545193/1-2 x x 26.4 x 74 74
AX74 88 5 left 17.7 76 x 76
AU73 178 545035/27 5 left 17.5 x x 89
14 7 5 5 3 6
Kharanah IV Area A. context
details
M 3 M 2
22 teeth from 20 individuals 14 M3s 8 M2s
Wear
stageSide GH
Wear
stageSide GH
( sample number) (sample number

12
1
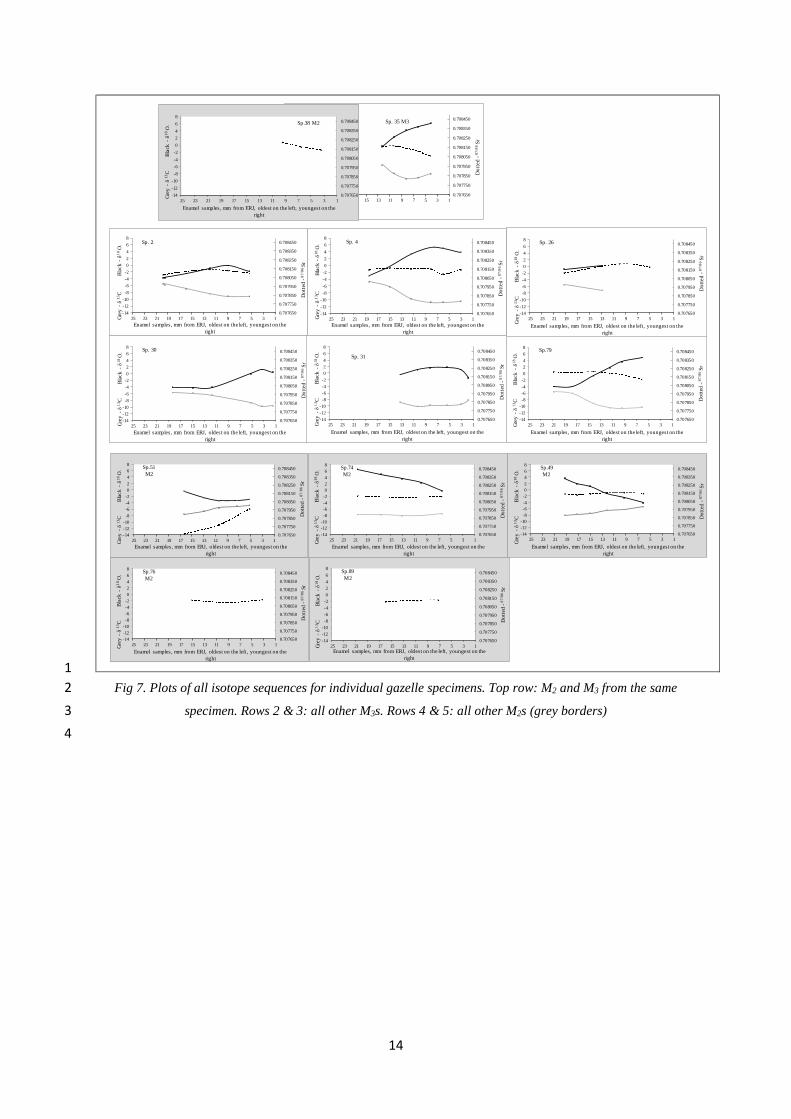
The results for each gazelle tooth are displayed in Figure 7. Sp38 (M2 with grey border) and Sp35 (M3 with2
white border) are from the same individual (top row Fig. 7) and, considered together, provide insight into how3
enamel precipitation timing, and therefore generated isotopic curves, relate sequentially between tooth-types.4
Consequently, all specimens (Fig. 7 M3s in rows 2 & 3 and M2s, with grey borders, in rows 4 & 5) can be5
discussed in relation to each other.6
7
In addition to tooth specimens with missing data sets, it is clear that not all time capsules span a whole year of8
life; this is to be expected as M2s have <1 year formation period and toothwear has truncated M3 records.9
Nevertheless, M3 specimens 2, 4, 30 and 79 show clear seasonal variation in δ18O with seasonally linked10
variation in δ13C. The 87Sr/86Sr sequences span the same length of time although without seasonal linkage.11
Although spanning a more limited period, a seasonal link between δ18O and δ13C can be observed in M212
specimens 51, 74 and 49.13
14
DMA15
Turning to the DMA results (Table 2) fourteen M3s (black) and five M2s (open circles) are analysed using the16
simplest DMA, 2-feature pit to striation discrimination, and displayed in Figure 8 with pit percentages for each17
on the x-axis and striation percentages on the y-axis. In this research we confine ourselves to this analysis as we18
do not have a modern comparator on which to base more nuanced DMA, and as recorders using this semi-19
quantitative recording method tends to miscount but not misidentify features (Grine et al 2002; Henton 201020
p328).21
22
The results show the gazelle died having eaten a range of diets. The highest striation percentage was 79.5% and23
the lowest was 27.6%. Eight M3s had more striations (>50%) than pits, and six had less; of the M2s, three had24
more and two had less. The bar chart, inset on the left of Figure 8, clearly shows a relatively even distribution of25
results, only slightly higher than the 50% mark, with no evidence of any single or bimodal clustering. Whilst26
some adjustment should be made for the known increase in M2s striation numbers compared to M3s in the same27
tooth row, this might be offset by gazelle feeding behaviour; as ground feeders in more arid environments,28
gazelle species ingest grit and have higher pit numbers than many ungulates (Rivals et al 2011; Schulz et al29
2013; Solounias & Semprebon 2002).30
31
32

13
6 5 4 3 2 1
a 19.5 19.8 15.9 12 8.9 5.3
b -3.74 -3.71 -2.50 -0.95 -0.14 -1.73 -2.13 -0.14 -3.74 3.60
c -5.92 -5.57 -7.03 -8.42 -9.11 -9.20 -7.54 -5.57 -9.20 3.64
d 0.70808 0.70808 0.70812 0.70814 0.70813 0.70810 0.70811 0.70814 0.70808 0.00006
a 18.4 15 11.4 8.1 6 3
b -3.02 -0.41 3.32 5.27 4.92 3.85 2.32 5.27 -3.02 8.28
c -4.72 -6.20 -9.74 -10.75 -10.79 -10.50 -8.78 -4.72 -10.79 6.07
d 0.70814 0.70816 0.70815 0.70815 0.70809 0.70814 0.70814 0.70816 0.70809 0.00007
5 38 13 25
8 127 26 101
17 90 50 40
20 46 31 15
21 79 49 30
22 118 51 67
a 19.2 12.8 10 7.4 4.9 1.4
b -0.86 0.16 -0.35 0.16 -0.86 1.02
c -5.50 -7.09 -6.29 -5.50 -7.09 1.60
d 0.70811 0.70822 0.70818 0.70817 0.70822 0.70811 0.00011
a 18.3 14.9 11.6 5.2 3.4 1.5
b -3.99 -4.24 -4.11 -0.02 1.24 0.41 -1.78 1.24 -4.24 5.48
c -5.65 -5.85 -6.49 -8.77 -9.85 -9.64 -7.71 -5.65 -9.85 4.20
d
a 13.2 10.3 8.2 5.5 3.1 1.8
b -0.50 0.96 1.61 1.82 1.08 -1.48 0.58 1.82 -1.48 3.30
c -8.82 -10.12 -9.76 -9.72 -9.50 -8.19 -9.35 -8.19 -10.12 1.94
d
a 12.3 10.3 8.2 6.2 4.1
b -0.72 1.71 3.64 4.54 5.44 2.92 5.44 -0.72 6.16
c -5.97 -8.21 -9.68 -9.31 -8.3 -8.29 -5.97 -9.68 3.71
d 0.70815 0.70816 0.70814 0.70811 0.70805 0.70812 0.70816 0.70805 0.00011
a 9.4 6.5 3.5
b
c
d 0.70822 0.70817 0.70814 0.70818 0.70822 0.70814 0.00008
a 19.2 17.2 15 12.2 9.3 6.1
b 3.7 1.91 1.07 -1.16 -2.56 -4.24 -0.21 3.70 -4.24 7.94
c -8.08 -7.69 -7.41 -6.62 -6.23 -5.3 -6.89 -5.30 -8.08 2.78
d 0.70814 0.70812 0.70814 0.70815 0.70816 0.70815 0.70814 0.70816 0.70812 0.00003
a 16.3 13 10.4 7.3 5.2
b -0.39 -2.51 -3.45 -3.27 -2.93 -2.51 -0.39 -3.45 3.06
c -7.66 -6.72 -5.67 -5.08 -4.76 -5.98 -4.76 -7.66 2.90
d 0.70766 0.70777 0.70796 0.70779 0.70796 0.70766 0.00031
59204 93 111
a 20.5 16.7 13.1 9.9 6.5
b 6.54 4.96 3.55 2.17 -0.21 3.40 6.54 -0.21 6.75
c -7.87 -7.79 -8.19 -8.07 -7.49 -7.88 -7.49 -8.19 0.70
d 0.70811 0.70810 0.70811 0.70811 0.70811 0.70810 0.00001
a 15.1 9.1 3.2
b
c
d 0.70812 0.70809 0.70812 0.70811 0.70812 0.70809 0.00003
a
b
c
d
a 20.9 17.7 14.2 11.5 9.5 6.1
b -3.98 -4.03 -0.81 1.68 3.54 4.88 1.05 4.88 -4.03 8.91
c -5.56 -6.02 -9.14 -10.48 -10.62 -10.30 -9.31 -6.02 -10.62 4.60
d 0.70821 0.70820 0.70821 0.70819 0.70818 0.70812 0.70818 0.70821 0.70812 0.00009
a 16 10.7 7.2 5.4
b
c
d 0.70810 0.70812 0.70812 0.70812 0.70812 0.70810 0.00002
a
b
c
d
44 45
134 60 74
99
27
82 48 34
74
76
35
(the M2 is
38)38
(the M3 is
35)
4
26
30
66 29
24
72
79
89
148 59 89
96 36 60
Maximum
44 28
49
51
87 63
Minimum Range
2
Specimen
M 3 white
M 2 grey
a. Distance of sampling bands (1 to 6) from root/enamel junction mm
b. δ18
O(VPDB) c. δ13
C(VPDB) d.87
Sr/86
Sr
Isotope resultsDental Microwear
results
Total
feature
Number
Pit
Number
Striation
Number
70 43
37
Mean
78 93 50 43
31
138 56 82
176 46 90
89
1
Table 2. Results of analyses for dental microwear and isotopes of oxygen, carbon and strontium in all2
specimens (M2s are shaded grey)3
4
14
1
Fig 7. Plots of all isotope sequences for individual gazelle specimens. Top row: M2 and M3 from the same2
specimen. Rows 2 & 3: all other M3s. Rows 4 & 5: all other M2s (grey borders)3
4
0.707650
0.707750
0.707850
0.707950
0.708050
0.708150
0.708250
0.708350
0.708450
-14
-12
-10
-8
-6
-4
-2
0
2
4
6
8
135791113151719212325
Do
tted
-8
7/8
6S
r
Gre
y-
δ 1
3C
Bla
ck-
δ1
8O
.
Enamel samples, mm from ERJ, oldest on the left, youngest on theright
Sp. 2
0.707650
0.707750
0.707850
0.707950
0.708050
0.708150
0.708250
0.708350
0.708450
-14
-12
-10
-8
-6
-4
-2
0
2
4
6
8
135791113151719212325
Do
tted
-8
7/8
6S
r
Gre
y-
δ 1
3C
Bla
ck-
δ1
8O
.
Enamel samples, mm from ERJ, oldest on the left, youngest on theright
Sp. 4
0.707650
0.707750
0.707850
0.707950
0.708050
0.708150
0.708250
0.708350
0.708450
-14
-12
-10
-8
-6
-4
-2
0
2
4
6
8
135791113151719212325
Do
tted
-8
7/8
6S
r
Gre
y-
δ 1
3C
Bla
ck-
δ1
8O
.
Enamel samples, mm from ERJ, oldest on the left, youngest on theright
Sp. 26
0.707650
0.707750
0.707850
0.707950
0.708050
0.708150
0.708250
0.708350
0.708450
-14
-12
-10
-8
-6
-4
-2
0
2
4
6
8
135791113151719212325
Do
tted
-8
7/8
6S
r
Gre
y-
δ 1
3C
Bla
ck-
δ1
8O
.
Enamel samples, mm from ERJ, oldest on the left, youngest on theright
Sp. 30
0.707650
0.707750
0.707850
0.707950
0.708050
0.708150
0.708250
0.708350
0.708450
-14
-12
-10
-8
-6
-4
-2
0
2
4
6
8
135791113151719212325
Do
tted
-8
7/8
6S
r
Gre
y-
δ 1
3C
Bla
ck-
δ1
8O
.
Enamel samples, mm from ERJ, oldest on the left, youngest on theright
Sp. 31
0.707650
0.707750
0.707850
0.707950
0.708050
0.708150
0.708250
0.708350
0.708450
-14
-12
-10
-8
-6
-4
-2
0
2
4
6
8
135791113151719212325
Do
tted
-8
7/8
6S
r
Gre
y-
δ 1
3C
Bla
ck-
δ1
8O Sp. 35 M3
0.707650
0.707750
0.707850
0.707950
0.708050
0.708150
0.708250
0.708350
0.708450
-14
-12
-10
-8
-6
-4
-2
0
2
4
6
8
135791113151719212325
Gre
y-
δ 1
3C
Bla
ck-
δ1
8O
.
Enamel samples, mm from ERJ, oldest on the left, youngest on theright
Sp.38 M2
0.707650
0.707750
0.707850
0.707950
0.708050
0.708150
0.708250
0.708350
0.708450
-14
-12
-10
-8
-6
-4
-2
0
2
4
6
8
135791113151719212325
Do
tted
-8
7/8
6S
r
Gre
y-
δ 1
3C
Bla
ck-
δ1
8O
.
Enamel samples, mm from ERJ, oldest on the left, youngest on theright
Sp.49M2
0.707650
0.707750
0.707850
0.707950
0.708050
0.708150
0.708250
0.708350
0.708450
-14
-12
-10
-8
-6
-4
-2
0
2
4
6
8
135791113151719212325
Do
tted
-8
7/8
6S
r
Gre
y-
δ 1
3C
Bla
ck-
δ1
8O
.
Enamel samples, mm from ERJ, oldest on the left, youngest on theright
Sp.51M2
0.707650
0.707750
0.707850
0.707950
0.708050
0.708150
0.708250
0.708350
0.708450
-14
-12
-10
-8
-6
-4
-2
0
2
4
6
8
135791113151719212325
Do
tted
-8
7/8
6S
r
Gre
y-
δ 1
3C
Bla
ck-
δ1
8O
.
Enamel samples, mm from ERJ, oldest on the left, youngest on theright
Sp.74M2
0.707650
0.707750
0.707850
0.707950
0.708050
0.708150
0.708250
0.708350
0.708450
-14
-12
-10
-8
-6
-4
-2
0
2
4
6
8
135791113151719212325
Do
tted
-8
7/8
6S
r
Gre
y-
δ 1
3C
Bla
ck-
δ1
8O
.
Enamel samples, mm from ERJ, oldest on the left, youngest on theright
Sp.76M2
0.707650
0.707750
0.707850
0.707950
0.708050
0.708150
0.708250
0.708350
0.708450
-14
-12
-10
-8
-6
-4
-2
0
2
4
6
8
135791113151719212325
Do
tted
-8
7/8
6S
r
Gre
y-
δ 1
3C
Bla
ck-
δ1
8O
.
Enamel samples, mm from ERJ, oldest on the left, youngest on theright
Sp.79
0.707650
0.707750
0.707850
0.707950
0.708050
0.708150
0.708250
0.708350
0.708450
-14
-12
-10
-8
-6
-4
-2
0
2
4
6
8
135791113151719212325
Do
tted
-8
7/8
6S
r
Gre
y-
δ 1
3C
Bla
ck-
δ1
8O
.
Enamel samples, mm from ERJ, oldest on the left, youngest on theright
Sp.89M2
15
1
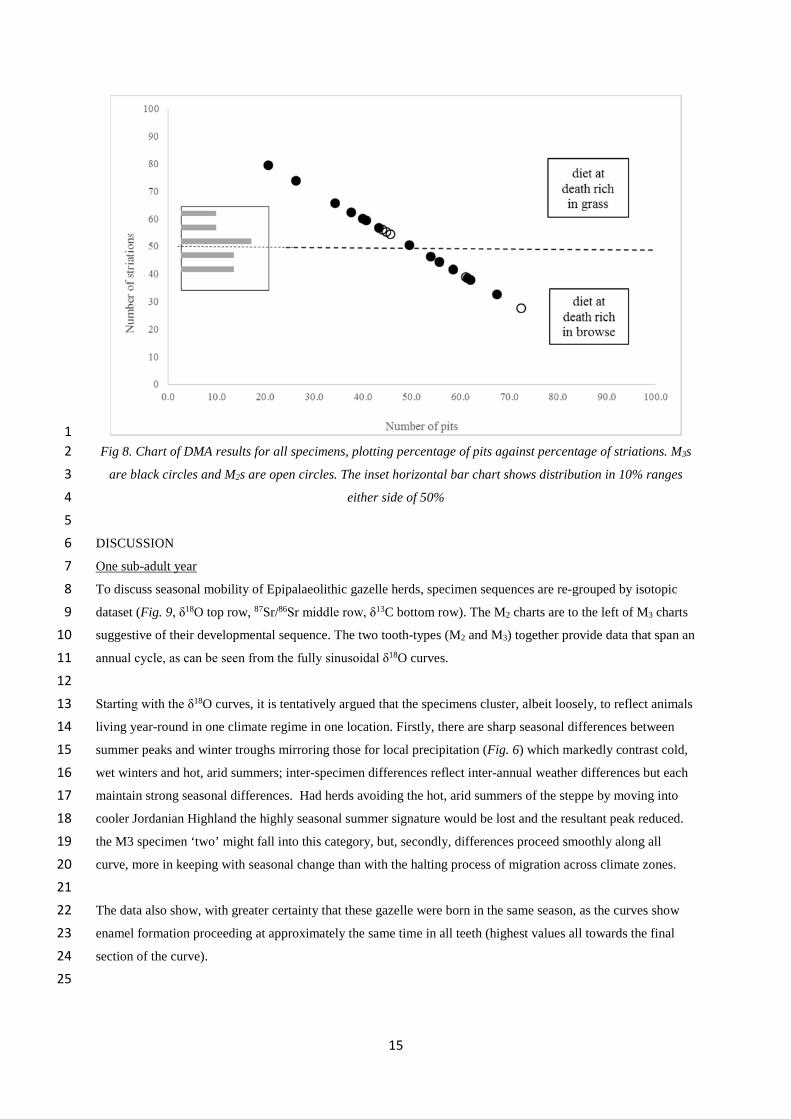
Fig 8. Chart of DMA results for all specimens, plotting percentage of pits against percentage of striations. M3s2
are black circles and M2s are open circles. The inset horizontal bar chart shows distribution in 10% ranges3
either side of 50%4
5
DISCUSSION6
One sub-adult year7
To discuss seasonal mobility of Epipalaeolithic gazelle herds, specimen sequences are re-grouped by isotopic8
dataset (Fig. 9, δ18O top row, 87Sr/86Sr middle row, δ13C bottom row). The M2 charts are to the left of M3 charts9
suggestive of their developmental sequence. The two tooth-types (M2 and M3) together provide data that span an10
annual cycle, as can be seen from the fully sinusoidal δ18O curves.11
12
Starting with the δ18O curves, it is tentatively argued that the specimens cluster, albeit loosely, to reflect animals13
living year-round in one climate regime in one location. Firstly, there are sharp seasonal differences between14
summer peaks and winter troughs mirroring those for local precipitation (Fig. 6) which markedly contrast cold,15
wet winters and hot, arid summers; inter-specimen differences reflect inter-annual weather differences but each16
maintain strong seasonal differences. Had herds avoiding the hot, arid summers of the steppe by moving into17
cooler Jordanian Highland the highly seasonal summer signature would be lost and the resultant peak reduced.18
the M3 specimen ‘two’ might fall into this category, but, secondly, differences proceed smoothly along all19
curve, more in keeping with seasonal change than with the halting process of migration across climate zones.20
21
The data also show, with greater certainty that these gazelle were born in the same season, as the curves show22
enamel formation proceeding at approximately the same time in all teeth (highest values all towards the final23
section of the curve).24
25
16
1
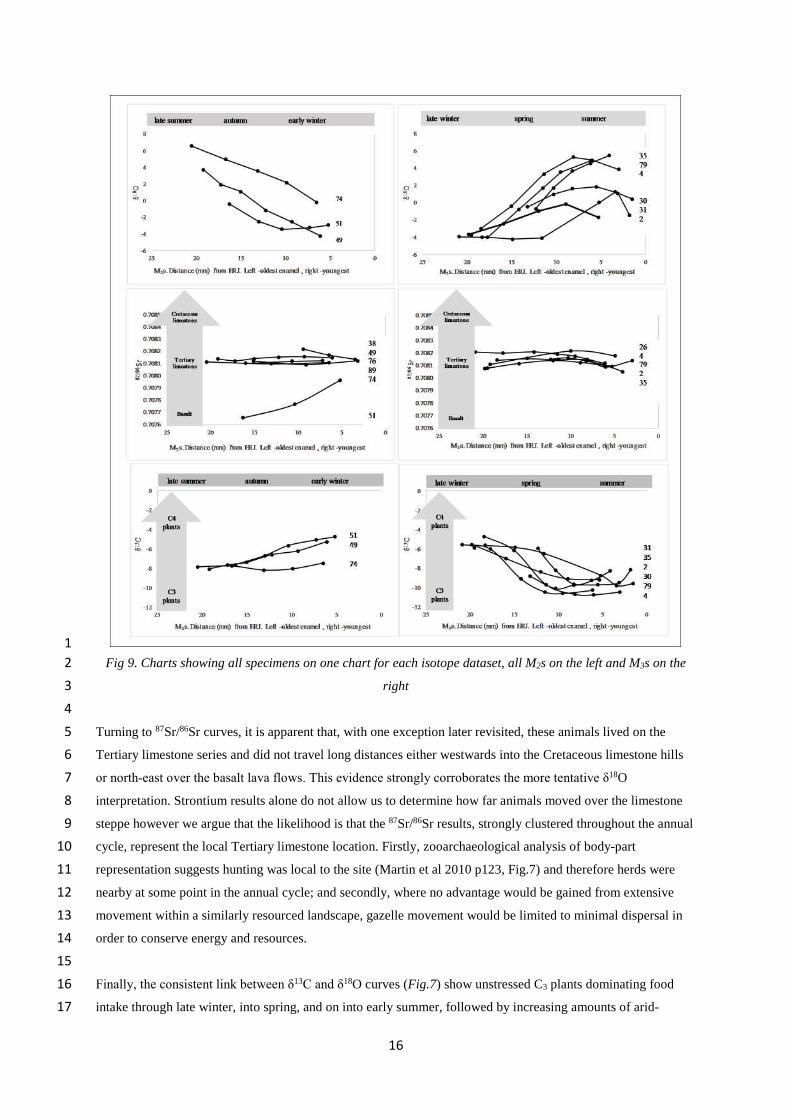
Fig 9. Charts showing all specimens on one chart for each isotope dataset, all M2s on the left and M3s on the2
right3
4
Turning to 87Sr/86Sr curves, it is apparent that, with one exception later revisited, these animals lived on the5
Tertiary limestone series and did not travel long distances either westwards into the Cretaceous limestone hills6
or north-east over the basalt lava flows. This evidence strongly corroborates the more tentative δ18O7
interpretation. Strontium results alone do not allow us to determine how far animals moved over the limestone8
steppe however we argue that the likelihood is that the 87Sr/86Sr results, strongly clustered throughout the annual9
cycle, represent the local Tertiary limestone location. Firstly, zooarchaeological analysis of body-part10
representation suggests hunting was local to the site (Martin et al 2010 p123, Fig.7) and therefore herds were11
nearby at some point in the annual cycle; and secondly, where no advantage would be gained from extensive12
movement within a similarly resourced landscape, gazelle movement would be limited to minimal dispersal in13
order to conserve energy and resources.14
15
Finally, the consistent link between δ13C and δ18O curves (Fig.7) show unstressed C3 plants dominating food16
intake through late winter, into spring, and on into early summer, followed by increasing amounts of arid-17

17
stressed C3 plants, possibly including some C4 plants in high summer and autumn. The modelled1
palaeovegetation proposes a longer growing season for annual grasses than today, explaining why C3 species2
remain available through the earlier summer. The 87Sr/86Sr data interpretation establishes that dietary changes3
were not due to animal seasonal movement to more mesic vegetation zones, so it is argued that variation is due4
to seasonal forage availability or to seasonal feeding preference; it is unnecessary to disentangle which as5
feeding ethology and food seasonality are interrelated. In addition, for gazelle herds local to Kharaneh, gazelle6
ethology allows us to assume a spring birth season when nutritious grasses flourished.7
8
The weeks before death9
If the above interpretations are correct, and these sampled specimens are representative of wider herd behaviour,10
it appears that gazelle herds in the vicinity of Kharaneh gave birth in spring and did not undertake long distance11
seasonal movements or migrations. We now turn to the evidence from DMA to assess hunting seasonality.12
13
DMA evidence (Fig. 8) points to some of the sampled herd being hunted (local to Kharaneh) between late14
winter and early summer when grasses flourished and had not yet died back, and when feeding preference for15
lactating females in particular meant grasses were essential. Others were hunted when grasses had died off and16
the most palatable, and only available, food was browse which persists into arid periods (tree leaves, soft growth17
on woody shrubs, perennials and annuals such as chenopods). Yet others died on a mixed diet, possibly in early18
summer when sparse grasses had to be supplemented with browse, or in late winter when the first grass shoots19
were appearing and supplement the browse diet. The important point is that dental microwear evidence shows20
no indication of clustering in either one or two seasons, which might be expected if hunting had been seasonal21
or if gazelle presence had been seasonal; rather, DMA clearly points to hunting at Kharaneh being practiced in22
more than one season.23
24
We have shown that gazelle remained on the limestone steppe year-round and were hunted in multiple seasons.25
The microwear gives a stronger signature for spring hunting than fusion data which noted a peak in winter26
culling, and helps define the broader spring/summer category identified by the cementum study. Each27
zooarchaeological method for determining cull seasonality has limitations, only allowing assessment of28
particular seasons rather than the whole annual cycle. The current study lends support, however, to other site29
evidence (Maher et al 2012a) indicating multi-seasonal and prolonged occupation of Kharaneh.30
31
CONCLUSION32
Discussion of hunter-gatherer mobility and seasonality in the Levantine Epipalaeolithic often relies on33
assumptions about underlying animal and plant resource availability. Some researchers draw on traditional34
models of radiating and circulating mobility around resource patches (Bar-Yosef & Belfer-Cohen 1989;35
Lieberman 1993), others look to recently observed pastoralist (Bedouin) seasonal movements in interpreting36
prehistoric hunter-gatherer mobility (Henry 1989). Maher and colleagues (2012b) question the validity of37
applying uniform mobility models across the Levant, where high degrees of ecological heterogeneity define the38
region. Indeed, the large-scale, multi-phase, repeatedly revisited site of Kharaneh (and nearby Wadi Jilat 6,39
18
Garrard & Byrd 2013) attests to settlement organization quite different to the small campsites characterising the1
Early/Middle Epipalaeolithic elsewhere.2
3
This study makes an important contribution to the debate on settlement dynamics in the Epipalaeolithic Azraq4
basin. Isotopic evidence suggests these gazelle herds were sustained year-round in the eastern Jordan limestone5
steppe without recourse to long-distance seasonal migrations. An alternative model to that predicting large6
migrating herds crossing the steppe might be one supporting localised seasonal aggregation and dispersal7
consistent with seasonal variation in social groupings following vegetation availability and herd reproductive8
cycles, similar to that seen amongst goitered gazelle in Saudi Arabia (Cunningham & Wronski 2011). This9
scenario offers a different picture of wildlife availability in the Early/Middle Epipalaeolithic. Hunter-gatherers10
could potentially have inhabited the steppes year-round, possibly aggregating and dispersing with herds.11
12
Wadi Kharaneh may well have been an attractive winter location for hunting or mass-trapping large mixed13
herds. But spring gazelle hunting probably targeted smaller herd groupings requiring different hunting14
techniques such as stalking. We do not assume an ecologically deterministic relationship between hunters and15
prey, the research presented here merely shows possibilities of how hunting practices may have varied16
seasonally following wildlife behaviour. This study cautions against using recent and historical animal17
migration patterns uncritically, especially where landscapes have been heavily impacted by humans and18
livestock.19
20
Finally, we return briefly to Specimen 51, the M2 outlier with a strontium sequence indicating movement from21
the basalt towards the Tertiary limestone series during the year (Fig. 9). This specimen (with no special22
depositional conditions) serves as a reminder of the complexity of attempting reconstruction of past animal23
mobility, and that regional (and indeed temporal) variation is to be expected. Future research, following the24
methods used here, aims to include other Azraq Basin prehistoric sites, in order to explore spatial and temporal25
variation of the animal behaviour that underpinned human use of the steppe in prehistory.26
27
ACKNOWLEDGEMENTS28
The research presented here was undertaken as part of a Leverhulme Trust funded multi-disciplinary project29
(RPG-2013-223) and we thank the Trust for their support. We would also like to thank Ass. Prof. Lisa Maher30
(Co-Director of EFAP) for permission to study materials from Kharaneh IV, and the Jordan Department of31
Antiquities for allowing export of specimens. We are grateful for support provided by the CBRL, especially the32
Director of the British Institute in Amman, Dr. Carol Palmer. Many thanks also to Sandra Bond, Tom Gregory33
and Morag McBride at UCL’s Institute of Archaeology and Christina Manning at Royal Holloway College UL.34
35
REFERENCES36
Akhani, H., Trimborn, P. Ziegler, H. 1997. Photosynthetic pathways in Chenopodiaceae from Africa, Asia and37
Europe with their ecological, phytogeographical and taxonomical importance. Plant systematics and evolution38
206, 187-221.39
40

19
Ayliffe, L., Chivas, A. 1990. Oxygen isotope composition of the bone phosphate of Australian kangaroos.1
Geochimica et Cosmochimica Acta, 54: 2603-2609.2
3
Balasse, M. 2002. Reconstructing dietary and environmental history from enamel isotopic analysis: time4
resolution of intra-tooth sequential sampling. International Journal of Osteoarchaeology 12, 155-165.5
6
Balasse, M., Smith, A., Ambrose, S., Leigh, S. 2003. Determining sheep birth seasonality by analysis of tooth7
enamel oxygen isotope ratios: the Late Stone Age site of Kasteelberg (South Africa). Journal of Archaeological8
Science 30, 205-215.9
10
Bar-Oz, G., Zeder, M., Hole, F. 2011. Role of mass-kill hunting strategies in the extirpation of Persian gazelle11
(Gazella subgutturosa) in the northern Levant, PNAS 108, 7345–7350.12
13
Bar-Yosef, O., Belfer-Cohen, A. 1989. The Origins of Sedentism and Farming Communities in the Levant.14
Journal of World Prehistory 3, 447-498.15
16
Batanouny, K. 2001. Plants in the deserts of the Middle East. Berlin: Springer.17
18
Belfer-Cohen, A., Goring-Morris, A. 2013. The Upper Palaeolithic and Earlier Epi-Palaeolithic of Western19
Asia. In (Eds. Renfrew, A., Bahn, P.). The Cambridge World Prehistory, vol. 3, 1381-1407. Cambridge20
University Press, Cambridge.21
22
Bender, F. 1974. Geology of Jordan. Berlin: Borntraeger.23
24
Bender, M. 1971. Variations in the 13C/12C ratios of plants in relation to the pathways of photosynthetic carbon25
dioxide fixation. Phytochemistry 10, 1239-1245.26
27
Bentley, A. 2006. Strontium isotopes from the earth to the archaeological skeleton: a review. Journal of28
Archaeological Method and Theory 13, 135-187.29
30
Blaise, E., Balasse, M. 2011. Seasonality and season of birth of modern and late Neolithic sheep from south-31
eastern France using tooth enamel d18O analysis. Journal of Archaeological Science 38, 3085-3093.32
33
Blank, D., Ruckstuhl, K., Yang, W. 2012. Influence of population density on group sizes in goitered gazelle34
(Gazella subgutturosa Guld. 1780), European Journal of Wildlife Research 58, 981-989.35
36
Bocherens, H., Mashkour, M., Billou, D., Pellé, E., Mariotti, A. 2001. A new approach for studying prehistoric37
herd management in arid areas: intra-tooth isotopic analyses of archaeological caprine from Iran. Earth and38
Planetary Sciences 322, 67-74.39
40

20
Britton, K., Grimes, V., Niven, L., Steele, T., McPherron, S., Soressi, M., Kelly, T., Jaubert, J., Hublin, J-J.,1
Richards, M. 2011. Strontium isotope evidence for migration in later Pleistocene Rangifer: implications for2
Neanderthal hunting strategies at the Middle Palaeolithic site of Jonzac, France. Journal of Human Evolution,3
61, 176-185.4
5
Bryant, J. Froelich, P. 1995. A model of oxygen isotope fractionation in body water of large mammals.6
Geochimica et Cosmochimica Acta 59. 4523-4537.7
8
Byrd, B., Garrard, A., Brandy, P. 2016. Modelling foraging ranges and spatial organization of Late Pleistocene9
hunter-gathers in the southern Levant – a least-cost GIS approach. Quaternary International 396, 62-78.10
11
Cerling, T., Harris J. 1999. Carbon isotope fractionation between diet and bioapatite in ungulate mammals and12
implications for ecological and paleoecological studies. Oecologia 120, 347–363.13
14
Colledge, S. 2001. Plant exploitation on Epipalaeolithic and early Neolithic sites in the Levant. Oxford, BAR15
S986.16
17
Cunningham, P., Wronski, T. 2011. Seasonal changes in group size and composition of Arabian Sand gazelle18
Gazella subgutturosa marica Thomas 1987, during a period of drought in central western Saudi Arabia. Current19
Zoology 57, 36-42.20
21
Dansgaard, W. 1964. Stable isotopes in precipitation. Tellus 16, 436-468.22
23
Davis, S. 1980. A note on the dental and skeletal ontogeny of Gazella. Israel Journal of Zoology 29, 129–134.24
25
de Niro, M., Epstein, S. 1978. Influence of diet on the distribution of carbon isotopes in animals. Geochimica et26
Cosmochimica Acta 42, 495–506.27
28
Ehleringer, J., Cerling, T., Helliker, B. 1997. C4 photosynthesis, atmospheric CO2, and climate. Oecologia 112,29
285-299.30
31
Enzel, Y., Amit, R., Dayan, U., Crouvi, O., Kahana, R., Ziv, B., Sharon, D. 2008. The climatic and32
physiographic controls of the eastern Mediterranean over the late Pleistocene climates in the southern Levant33
and its neighbouring deserts. Global and Planetary Change 60, 165-192.34
35
Faure, G., Powell, J. 1972. Strontium Isotope Geology. New York: Springer.36
37
Feranec, R. 2007. Stable carbon isotope values reveal evidence of resource partitioning among ungulates from38
modern C3-dominated ecosystems in North America. Palaeogeography, Palaeoclimatology, Palaeoecology39
252, 575-585.40
21
1
Fricke, H., Clyde, W., O’Neil J. 1998. Intra-tooth variations in δ18O (PO4) of mammalian tooth enamel as a2
record of seasonal variations in continental climate variables. Geochimica et Cosmochimica Acta 62, 1839-3
1850.4
5
Fricke, H., O’Neil, J. 1996. Inter- and intra- tooth variations in the oxygen isotope composition of mammalian6
tooth enamel phosphate: implications for palaeoclimatological and palaeobiological research. Palaeogeography,7
Palaeoclimatology, Palaeoecology 126, 91-99.8
9
Frison, G. 2004. Survival by hunting: prehistoric human predators and animal prey. University of California10
Press.11
12
Frumkin, A., Ford, D., Schwarcz, H. 1999. Continental oxygen isotopic record of the last 170,000 years in13
Jerusalem. Quaternary Research 51, 317–327.14
15
Garrard, A., Byrd, B. 2013. Beyond the Fertile Crescent: Late Palaeolithic and Neolithic communities of the16
Jordanian Steppe. The Azraq Basin Project, Volume 1. Levant Supplementary Series 13, Oxford: Oxbow17
Books.18
19
Garrard, A., Byrd, B., Harvey, P., Hivernel, F. 1985. Prehistoric environment and settlement in the Azraq20
Basin. A report on the 1982 survey season. Levant 17: 1-28.21
22
Gordon, K. 1982. A study of chimpanzee molars: implications for dental microwear analysis. American Journal23
of Physical Anthropology 59, 195-215.24
25
Goring-Morris, N. 1995. Ch. 10: Complex hunter-gatherers at the end of the Palaeolithic (20,000-10,000 BP),26
142-167, in (Ed.) Levy, T. The Archaeology of Society in the Holy Land, Leicester University Press.27
28
Goring-Morris, N., Hovers, E., Belfer-Cohen, A. 2009. The dynamics of Pleistocene and Early Holocene29
settlement patterns and human adaptations in the Levant: an overview. In (Eds.) Shea, J., Lieberman, D.30
Transitions in Prehistory, 185-252. Oxbow Books.31
32
Graustein, W. 1989. 87Sr/86Sr ratios measure the sources and flow of strontium in terrestrial ecosystems. In33
(Eds.). Rundel, P., Ehleringer, J., Nagy, K. Stable isotopes in ecological research. Springer-Verlag, New York,34
491–512.35
36
Grine, F., Ungar, P., Teaford, M. 2002. Error rates in dental microwear quantification using scanning electron37
microscopy. Scanning 24, 144-153.38
39
22
Heaton, T. 1999. Spatial, species, and temporal variations in the 13C/12C ratios of C3 Plants: implications for1
Palaeodiet studies. Journal of Archaeological Science 26, 637-649.2
3
Henry, D. 1989. From Foraging to Agriculture. University of Pennsylvania Press.4
5
Henton, E. 2010. (Unpublished PhD thesis).Herd management and the social role of herding at Neolithic6
Çatalhöyük: an investigation using oxygen isotope and dental microwear evidence in sheep. Institute of7
Archaeology: University College, London.8
9
Henton, E., 2012. The combined use of oxygen isotopes and microwear in sheep teeth to elucidate seasonal10
management of domestic herds: the case study of Çatalhöyük, central Anatolia. Journal of Archaeological11
Science 30, 3264-3276.12
13
Hillman, G. 1996. Late Pleistocene changes in wild plant-foods available to hunter–gatherers of the northern14
Fertile Crescent: possible preludes to cereal cultivation. In (Ed.) Harris, D. The origins and spread of15
agriculture and pastoralism in Eurasia. Washington D.C.: Smithsonian Institution Press, 159-203.16
17
Hoppe, K., Stuska, S., Amundson, R. 2005. The implications for paleodietary and paleoclimatic reconstructions18
of intrapopulation variability in the oxygen and carbon isotopes of teeth from modern feral horses. Quaternary19
Research 64, 138-146.20
21
Hunt, C., Garrard, A., 2013. Section B: The Late Palaeolithic – geological context. In: Garrard, A., Byrd, B.,22
2013. Beyond the Fertile Crescent: Late Palaeolithic and Neolithic communities of the Jordanian steppe. The23
Azraq Basin Project Volume 1. Levant Supplementary Series 13, Oxbow Books, Oxford, pp. 53-135.24
25
Iacumin, P., Longinelli, A. 2002. Relationship between δ18O values for skeletal apatite from reindeer and foxes26
and yearly mean δ18O values of environmental water. Earth and Planetary Science Letters 201, 213-219.27
28
IAEA/WMO. 2014. Global network of isotopes in precipitation. The GNIP Database. http://www.iaea.org/water29
30
Jones, J. 2012. Using gazelle dental cementum studies to explore seasonality and mobility patterns of the Early-31
Middle Epipalaeolithic Azraq Basin, Jordan. Quaternary International 252, 195-201.32
33
Jones, M., Maher, L., Macdonald, D., Ryan, C., Rambeau, C., Black, S., Richter, T. 2016. The environmental34
setting of Epipalaeolithic aggregation site Kharaneh IV. Quaternary International 396, 95-104.35
36
Jones, M., Richter, T. 2011. Paleoclimatic and archeological implications of Pleistocene and Holocene37
environments in Azraq, Jordan. Quaternary Research 76, 363-372.38
39
23
Jordan National Geographic Centre 1984. National Atlas of Jordan. Part I Climate and Agroclimatology.1
Amman: Jordan National Geographic Centre.2
3
Julien, M-A., Bocherens, H., Burke, A., Drucker, D., Patou-Mathis, M., Krotova, O., & Péan S. 2012. Were4
European steppe bison migratory? 18O, 13C and Sr intra-tooth isotopic variations applied to a palaeoethological5
reconstruction. Quaternary International 271, 106–119.6
7
Kingswood, S., Blank, D. 1996. Gazella subgutturosa. Mammalian Species 518, 1-10.8
9
Kohn, M., Schoeninger, M., Valley, J. 1996. Herbivore tooth oxygen isotope compositions: effects of diet and10
physiology. Geochimican et Cosmochimica Acta 60, 3889–3896.11
12
Kohn, M., Schoeninger, M., Valley, J. 1998. Variability in oxygen isotope compositions of herbivore teeth:13
reflections of seasonality or developmental physiology? Chemical Geology 152, 97-112.14
15
Legge, A., Rowley-Conwy, P. 1987. Gazelle killing in Stone-age Syria. Scientific American 255, 88-95.16
17
Legge, A., Rowley-Conwy, P. 2000. The exploitation of animals. In (Eds.) Moore, A. Hillman, G., Legge, A.18
Village on the Euphrates–from foraging to farming at Abu Hureyra. Oxford: Oxford University Press, 455-471.19
20
Lieberman, D. 1993. The rise and fall of seasonal mobility among hunter-gatherers: the case of the southern21
Levant. Current Anthropology 34: 599-63122
23
Lubinski, P., 2013. What is adequate evidence for mass procurement of ungulates in zooarchaeology?24
Quaternary International 297, 167-175.25
26
Maher, L., Macdonald, D. 2013. Assessing typo-technological variability in Epipalaeolithic assemblages:27
Preliminary results from two case studies from the Southern Levant. In (Eds.): Borrell, F., Molist, M., Ibanez, J.28
The state of stone: terminologies, continuities and contexts in Near Eastern lithics. Studies in Early Near29
Eastern production, subsistence and environment 14. Ex oriente, Berlin, 29-44.30
31
Maher, L., MacDonald, D., Allentuck, A., Martin, L., Spyrou, A., Jones, M. 2016. Occupying wide open32
spaces? Late Pleistocene hunter-gatherer activities in the Eastern Levant. Quaternary International 396, 79-94.33
34
Maher, L., Richter, T., Macdonald, D., Jones, M., Martin, L., Stock, J. 2012a. Twenty thousand-year-old huts at35
a hunter-gatherer settlement in Eastern Jordan, PLoS ONE, 7, 2, e31447.36
37
Maher, L., Richter, T., Jones, M., Stock, J. 2011. The Epipalaeolithic Foragers in Azraq Project: prehistoric38
landscape change in the Azraq Basin, eastern Jordan. CBRL Bulletin 6:21-27.39
40

24
Maher, L., Richter, T., Stock, J. 2012b. The Pre-Natufian Epipalaeolithic: long-term behavioural trends in the1
Levant, Evolutionary Anthropology 21, 69-81.2
3
Mainland, I. 1998. Dental microwear and diet in domestic sheep (Ovis aries) and goats (Capra hircus):4
distinguishing grazing and fodder-fed ovicaprids using a quantitative analytical approach. Journal of5
Archaeological Science 25, 1259-1271.6
7
Martin, L. 2000. Gazelle (Gazella spp.) behavioural ecology: predicting animal behaviour for prehistoric8
environments in south-west Asia. Journal of Zoology, London 250, 13-30.9
10
Martin, L., Edwards, Y., Garrard, A. 2010. Hunting practices at an Eastern Jordanian Epipalaeolithic11
aggregation site: the case of Kharaneh IV. Levant 42, 107-135.12
13
Merceron, G., de Bonis, L., Viriot, L., Blondel, C. 2005. Dental microwear of fossil bovids from northern14
Greece: paleoenvironmental conditions in the eastern Mediterranean during the Messinian. Palaeogeography,15
Palaeoclimatology, Palaeoecology 217, 173-185.16
17
Merceron, G., Schulz, E., Kordos, L., Kaiser, T. 2007. Paleoenvironment of Dryopithecus brancoi at18
Rudabánya, Hungary: evidence from dental meso- and micro-wear analyses of large vegetarian mammals.19
Journal of Human Evolution 53, 331-349.20
21
Montgomery, J., Evans, J., Horstwood, M. 2010. Evidence for long-term averaging of strontium in bovine22
enamel using TIMS and LA-MC-ICP-MS strontium isotope intra-molar profiles. Environmental Archaeology23
15, 32-42.24
25
Moore, A., Hillman, G., Legge, A. 2000. Village on the Euphrates. From foraging to farming at Abu Hureyra.26
Oxford: Oxford University Press.27
28
Munro, N., Bar-Oz, G., Stutz, A. 2009. Aging mountain gazelle (Gazella gazelle): refining methods of tooth29
eruption and wear and bone fusion. Journal of Archaeological Science 36, 752-763.30
31
O’Leary, M. 1988. Carbon isotopes in photosynthesis. Bioscience 38, 328–336.32
33
Pearson, J., Grove, M. 2013. Counting sheep: sample size and statistical inference in stable isotope analysis and34
palaeodietary reconstruction. World Archaeology 45, 373-387.35
36
Poage, M., Chamberlain, C. 2001. Empirical relationships between elevation and the stable isotope composition37
of precipitation and surface waters: considerations for studies of palaeoelevation change. American Journal of38
Science 301, 1-15.39
40
25
Price, T., Meiggs, D., Weber, M-J., Pike-Tay, A. 2015. The migration of Late Pleistocene reindeer: isotopic1
evidence from northern Europe, Archaeological and Anthropological Sciences, 1-15.2
3
Ramsey, M., Rosen, A. 2016. Wedded to wetlands: exploring Late Pleistocene plant-use in the Eastern Levant.4
Quaternary International 396, 5-19.5
6
Richter, T., Maher, L., Garrard, A., Edinborough, K., Jones, M., Stock, J. 2013. Epipalaeolithic settlement7
dynamics in southwest Asia: New radiocarbon evidence from the Azraq Basin. Journal of Quaternary Science8
28, 467-479.9
10
Rivals, F., Prignano, L., Semprebon, G., Lozano, S. 2015. A tool for determining duration of mortality events in11
archaeological assemblages using extant ungulate microwear. Scientific Reports 5:17330 DOI:12
10.1038/srep17330, 1-7.13
Rivals, F., Solounias, N., Schaller, G. 2011. Diet of Mongolian gazelles and Tibetan antelopes from steppe14
habitats using premaxillary shape, tooth mesowear and microwear analyses. Mammalian Biology 76, 358-364.15
16
Schulz, E., Fraas, S., Kaiser, T., Cunningham, P., Ismail, K., Wronski, T. 2013. Food preferences and tooth17
wear in the sand gazelle (Gazella marica). Mammalian Biology 78, 55-62.18
19
Shewan, L. 2004. Natufian settlement systems and adaptive strategies: the issue of sedentism and the potential20
of strontium isotope analysis. In (Ed). Delage, C. The last hunter-gatherer societies in the Near East. BAR21
(International Series) 1320: Oxford.22
23
Shomer-Ilan, A., Nissenbaum, A., Waisal, Y. 1981. Photosynthetic pathways and the ecological distribution of24
the Chenopodiaceae in Israel. Oecologia 48, 244-248.25
26
Sillen, A., Hall, G., Richardson, S., Armstrong, R. 1998. 87Sr/86Sr ratios in modern and fossil food-webs of the27
Sterkfontein Valley: implications for early hominid habitat preference. Geochimica et Cosmochimica Acta 62,28
2463-2473.29
30
Solounias, N., Hayek, L-A. 1993. New methods of tooth microwear analysis and application to dietary31
determination of two extinct antelopes. Journal of Zoology London 229, 421-445.32
33
Solounias, N., Moelleken, S. 1992. Tooth microwear analysis of Eotragus sansaniensis (Mammalia:34
Ruminantia), one of the oldest known bovids. Journal of Vertebrate Paleontology 12, 113-121.35
36
Solounias, N., Semprebon, G. 2002. Advances in the reconstruction of ungulate ecomorphology with application37
to early fossil equids. American Museum Novitates 3366, 1-49.38
39

26
Spyrou, A. 2014. Gazelle carcass utilisation during the Early/Middle Epipalaeolithic of the southern Levant:1
zooarchaeological and ethnographic implications of animal nutrient storage among human foragers. Assemblage2
PFAZ, 1-18.3
4
Teaford M. & Walker A. 1984. Quantitative differences in dental microwear between primate species with5
different diets and a comment on the presumed diet of Sivapithecus. American Journal of Physical6
Anthropology 64, 191-200.7
8
Tieszen, L. 1991. Natural variations in the carbon isotope values of plants: implications for archaeology,9
ecology and paleoecology. Journal of Archaeological Science 18, 227–248.10
11
Tornero, C., Bălăşescu, A., Ughetto-Monfrin, J., Voinea, V., Balasse, M. 2013. Seasonality and season of birth 12
in early Eneolithic sheep from Cheia (Romania): methodological advances and implications for animal13
economy. Journal of Archaeological Science 40, 4039-4055.14
15
Ungar, P. 2002. Microwear image analysis software, version 4.02 (04.10.02) Buffalo Edition (Retrieved16
10.01.05).17
18
Vogel, J., Fuls, A., Danin, A. 1986. Geographical and environmental distribution of C3 and C4 grasses in the19
Sinai, Negev, and Judean deserts. Oecologia 70, 258-265.20
21
Wilkie, T., Mainland, I., Albarella, U., Dobney, K., Rowley-Conwy, P. 2007. A dental microwear study of pig22
diet and management in Iron Age, Romano-British, Anglo-Scandinavian, and Medieval contexts in England. In23
(Eds.) Albarella, U., Dobney, K., Ervynck, A., Rowley-Conwy, P. Pigs and humans: 10,000 years of24
interaction. Oxford: Oxford University Press, 241-254.25
26
Zazzo, A., Mariotti, A., Lécuyer, C., Heintz, E. 2002. Intra-tooth isotope variations in late Miocene bovid27
enamel from Afghanistan: paleobiological, taphonomic, and climatic implications. Palaeogeography,28
Palaeoclimatology, Palaeoecology 186, 145-161.29
30
Zohary, M. 1973. Geobotanical foundations of the Middle East, Vols 1 & 2. G. Fischer: Stuttgart.31
32
33
34
35
36
37
38
39
40

27
1
2
3
4
5
SUPPLEMENTARY MATERIAL6
7
Supp 1. – 87Sr/86Sr in modern plants from three locations8
This supplement provides a little background information on the strontium isotope baseline that is referred to in9
this paper and used to contribute to the identification of key geological locations. The supplement forms a10
preliminary report on a small part of a more comprehensive isotopic baseline using modern plant collections,11
which is currently in publication preparation. The 87Sr/86Sr results reported here are those collected from key12
geological endmembers within and around the Azraq Basin: the Cretaceous limestone series of the Highlands to13
the west, the Basalt lava flow to the northeast and the Early Tertiary limestone series near Kharaneh IV.14
15
The leaves and soft shoots of moderately rooted plants were collected in one season (April) and used to measure16
labile strontium. Each sampling aliquot included material from three individual plants and duplicates were run17
to test intra-species variation at one location. Plants were exported to UCL Institute of Archaeology with the18
permission of the Department of Antiquities of Jordan. Samples were first washed in milli-Q water then, in the19
Earth Sciences Department at Royal Holloway University of London, labile strontium was extracted from20
homogenised material followed standard protocols, and analyses were made in a VG354 thermal ionisation mass21
spectrometer. Typical external reproducibility for 87Sr/86Sr is ±0.000014 (2sd).22
23
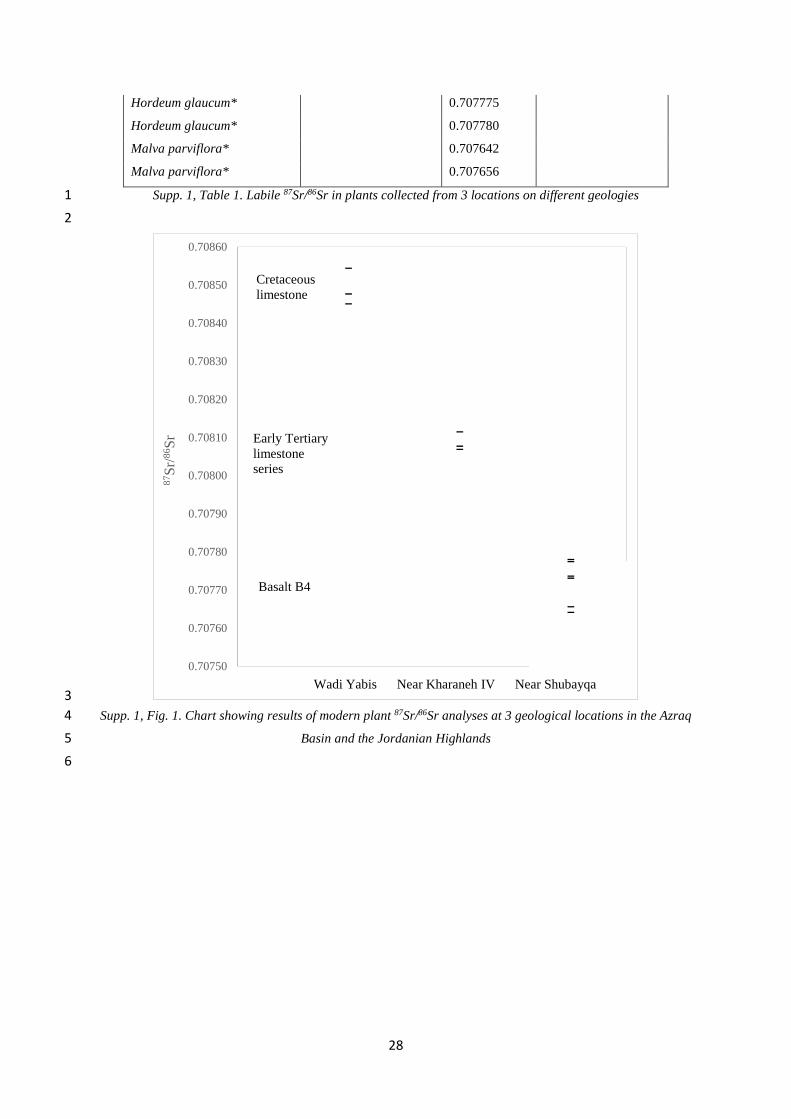
Results are displayed below in Supplementary 1, Figure 1. It is immediately clear that the plant labile 87Sr/86Sr24
values cluster into three groups that discriminate between the three locations and convincingly reflect25
underlying geologies (Bentley 2006; Hartman & Richards 2014). The averaged 87Sr/86Sr readings for the26
Cretaceous Highland location is 0.708941‰, the Early Tertiary limestone steppe 0.708087‰, and the basalt27
steppe is 0.707720‰.28
Taxa * duplicate analyses
from one plant
Location
UTM (north
hemisphere)
87Sr/86Sr
average of 3
plants
Bedrock geology
Phlomis fruticosaUpper Wadi Yabis
36: 7.597 E x 35.881 N
0.708479Cretaceous limestone
series (c2)Salvia heirosolymitana 0.708453
Anthemis sp. 0.708543
Hordeum glaucum Kharaneh IV
37. 37: 2.587 E x
35.128 N
0.708115Early Tertiary
limestone series (tt1)Achillea fragrantissima 0.708069
Malva parviflora 0.708078
Achillea fragrantissima* Shubayqa 1
37: 3.334 E x 35.868 N
0.707731 Pliocene/Oligocene
basalt (B4)Achillea fragrantissima* 0.707737
28
Supp. 1, Table 1. Labile 87Sr/86Sr in plants collected from 3 locations on different geologies1
2
3
Supp. 1, Fig. 1. Chart showing results of modern plant 87Sr/86Sr analyses at 3 geological locations in the Azraq4
Basin and the Jordanian Highlands5
6
0.70750
0.70760
0.70770
0.70780
0.70790
0.70800
0.70810
0.70820
0.70830
0.70840
0.70850
0.70860
87S
r/8
6S
r
Wadi Yabis Near Kharaneh IV Near Shubayqa
Cretaceouslimestone
Early Tertiarylimestoneseries
Basalt B4
Hordeum glaucum* 0.707775
Hordeum glaucum* 0.707780
Malva parviflora* 0.707642
Malva parviflora* 0.707656