Embed Size (px)
Citation preview

1
World Wide MARINE
METEOROLOGY AS APPLICABLE TO
YACHTSMEN/WOMEN, AND CAPTAINS/MASTERS AT SEA
By Henton JaabackBy Henton JaabackDeck Officer, SA Sailing and the first Deck Officer, SA Sailing and the first
Southern Hemisphere MCA/RYA Southern Hemisphere MCA/RYA International Yachtmaster Instructor International Yachtmaster Instructor
and Examiner.and Examiner.www.sailingtrainingCD.com

2
00 136 143 163 180 00
186 21,
ContentsPageSubject PageSubject
Winds’ causes Polar Fronts Oceans Winds ISOBARS Synoptic chart Beaufort scale Abnormal
wave Low Pressure Cold Fronts
4 41 42 48 62 73 00 89 92
109
Buys Ballots Law
Fronts’ Cloud TRS Fog Land and See
Breezes Terms/words:36, 39, 44, 47, 48, 60, 62, 91, 110 and 132.
21, 26,

3
Why “Met”? What is its relevance to boats at sea?
When at sea, we are all affected by strong wind, huge waves, rain, or storms, and sailing vessels are also affected by the lack of wind. We need to know in advance if wind, and therefore sea state, is about to change – for better or for worse. We need to regularly observe the weather state, understand how changes occur, and how and where to get forecasts – or how to make them ourselves! So let’s start …

4
Our (round) earth is half exposed to the sun, warming up, and half is in darkness cooling down. The sun is so big and far
away that the light and heat rays are effectively parallel when arriving at the
earth.
The Sun’s light and heat rays
METEOROLOGY IS EASY!
Night Day

5
There is a greater concentration of heat rays on the earth near the equator, than at
the polar regions:
The Sun’s light and heat rays
Night Day
WE KNOW THE EQUATOR IS HOTTEST!
At the top and bottom, north and south, the same amount of heat, , as at the
equator is spread over a much larger area – thus further from the equator, the colder!

6
When we see a small garden fire on a cool windless morning, we see smoke rise vertically; if windy it rises at an angle.
By day the surface air at and near the equator
warms, expands, becomes lighter, and rises; the air pressure
there drops – the equator becomes an area of LOW PRESSURE.
THIS IS LOGICAL!
‘Low’
DayNight

7
The slightly cooler, more dense, heavier air on the sides of the Low Pressure (“L”) drifts in to fill the gap created by rising,
expanding warming air.On the upper, north
side the air blows down towards the south; on the lower south side
the air blows up towards the north.
L
DayNight

8
So we might as well know now why often the wind gets stronger by early afternoon, just after the mid day’s hottest period …
… and slows down as the air
gets coolest and heavier shortly before sunrise! Heavier air goes
slower; lighter air goes faster!
L
Heating starts
Hot
HottestCooling
Coldest
Day and Night Frequent Wind Changes

9
So we expect to see the wind on both sides of the equator blow like this:
Equator (or equivalent?)
Wind direction is described as where it comes from; this is “Northerly” wind.
On this side the wind is coming from the south so it is “Southerly” wind. As it is from the south, it is therefore going towards the north. But be aware …

10
Summer and Winter changes the “Equator”We just refer to ‘the equator’, but we mean a parallel line as it moves when the angle from the centre of the earth to the centre of the sun moves changing the seasons :
North Pole
South Pole
Summer in Northern hemisphere
Winter in Southern hemisphere
+/- 22 June:
Earth

11
Seasons Change When the Sun becomes in Line with the Equator, Heading SouthIt takes 3 months to change from a maximum North angle to 0°.
North Pole
South Pole
Autumn in the Northern hemisphere
Spring in the Southern hemisphere
+/- 22 September:
Earth

12
It Changes Again When the Sun Maximum Angle is South of the Equator. It takes another 3 months to change from a 0° to 23° S .
North Pole
South Pole
Winter in the Northern hemisphere
Summer in the Southern hemisphere
+/- 22 December:
Earth

13
GFED
C B A H
Northern Hemisphere seasons are when the sun direction angle, Declination, (+/- ° N/S) to the equator, and dates are: A. 0° mid Spring, +/- 22 March. B. 15°N end of Spring/start Summer, mid May. C. 23°N mid Summer,
D. 15°N end Summer, mid August. E. 0° mid Autumn, 23 September. F. 15°S Winter starts, mid October. G. 23°S mid Winter, 23 December. H. 15°S Spring starts, February.
(The earth rotates 360° in 365 days.)
22 June.

14
GFED
C B A H
D. 15°N end Winter, mid August. E. 0° mid Spring, 23 September. F. 15°S Summer starts, mid October. G. 23°S mid Summer, 23 December. H. 15°S Spring starts, February.
(The earth rotates 360° in 365 days.)
June.
Southern Hemisphere seasons are when sun direction angles, Declination, (+/- ° N/S) to the equator, and dates are: A. 0° mid Autumn +/- 22 March. B. 15°N end of Autumn/start Winter, mid May. C. 23°N mid Winter, 22nd
14

15
So as seasons change, the sun’s apparent movement is changing. As the direction angle, the Declination, goes northward, the Highs and cold fronts, in the north and south hemisphere’s, move north - it becomes summer in the north, winter in the south. When it changes south, winter is in the north and summer in the south – there the Highs and cold fronts are further south, further away, and so it is summer.

16
And now … The Earth’s Speed of Rotation We know the earth rotates 360° once every 24 hours. Each 1° has 60’ (minutes); 1’ is 1 n.m. (nautical mile) at and near the equator.
As we get further away from the
equator, the same angle covers a
shorter distance on the surface of the
earth.

17
So a point on or near the equator therefore moves 21,600 n.m. in 24 hours
(360 x 60 = 21,600); that is a speed of 900 n.m. per hour
West to East
A nautical speed is 900 knots (kns)
(21,600 ÷ 24 = 900).
(This speed is 1,600 km/hour!!!)

18
and … The Air’s Speed of Rotation As the speed of rotation at and near the equator is 900 n.m./hour (knots), the friction of the earth’s surface with the air in contact with the earth causes the air to move in the same direction although it will be a little slower. The difference in speeds may average about 10 to 20 knots.
900 kns
Air at +/-885 kns

19
A Question:Lets say the wind is blowing along a road
at a speed of about 10 knots.
Imagine you get onto a bicycle and start to go very slowly (1 knot) with the wind. You feel it on your back. You speed up to the same wind speed and feel no wind. Now you go even faster – what wind will you experience? Answer: The faster you go the stronger the wind will be on your face!
20
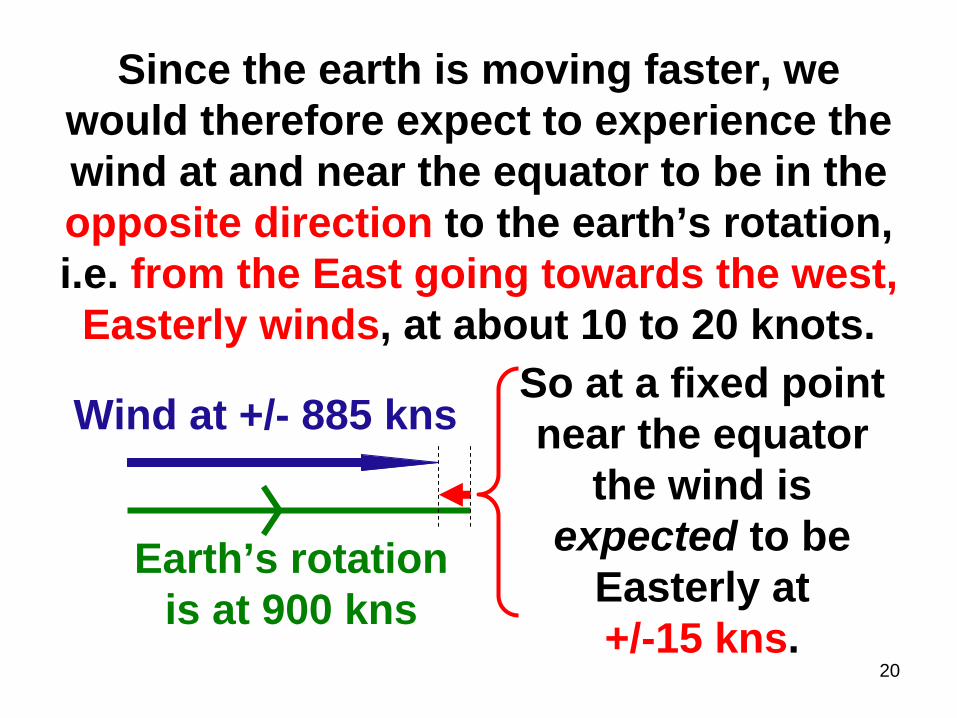
Since the earth is moving faster, we would therefore expect to experience the wind at and near the equator to be in the opposite direction to the earth’s rotation, i.e. from the East going towards the west, Easterly winds, at about 10 to 20 knots.
Earth’s rotation is at 900 kns
Wind at +/- 885 knsSo at a fixed point near the equator
the wind is expected to be
Easterly at +/-15 kns.

21
If there are northerly and southerly winds on either side of the equator being
deflected by the Easterly winds, the net result is North Easterly (NE) and South
Easterly (SE) winds on their respective sides.
Equator
NE
SE
So … Trade Winds
L

22
These are the Easterly TRADE WINDS – they are the same all around the equator.
The closer they get to the equator, the northerly and southerly winds, , become
, and therefore the easterly influence is dominant, , so the wind becomes
more easterly:
becomesBig angle
Big angle
Small angleSmall angle

23
So in the area of the equator the Easterly Trade Winds blow like this:
Equator
EASTERLY TRADE WINDS

24
When a point on or near the equator is moving at a speed of 900 kns, can you
imagine how slowly a person standing at or near the north or south pole turns once in 24 hours? VERY SLOWLY!
N (North Pole, polar side)
S (South Pole, polar side)
He or she has a very short circle circumference to move around in 24 hours.

25
The further a place is from the equator, the slower it moves – the circumference length is less than the equator but it still
has 24 hours for one rotation. (Meanwhile wind speed there gets higher!)
Fastest
Slower
SlowerVery Slow
Very SlowThe earth’s speed:

26
So the wind gets faster … Why? 1. As the fast (+/- 885 kns) moving hot air rises in the area of the equator, it cools.
The higher it goes, the lower the pressure, the colder it gets – called
ADIABATIC COOLING.
The hot air rises faster than the
temperature drops. As the rising
air’s pressure drops, it expands.
L

27
2. When the rising air reaches the outer level of the atmosphere, it cannot move into space – it pushes and moves the
rising, once warm air already there ahead of it, to the sides, to the north and south.
The air moving to the sides is not getting higher – the pressure is not changing (much).
L

28
3. Since the temperature drops slower than the warm air rises and its and pressure
decreases, once moving sideways with no height and pressure change, the air
temperature drop catches up.
4. The air cooling moving sideways gets more dense, concentrated, and heavy. So it starts to drop.
L

29
5. As the heavier, cold air sinks down, it adds to and pushes down on the air already on the earth’s surface – the
surface air pressure rises. And as pressure increases, temperature increases.
6. So on opposite sides of the Low pressure equator we see warm lines of High pressures, ‘H’, is created around the earth as it turns.
Low
High
High

30
We expect to see the wind blows away from High pressure areas towards Low pressure areas (left), but we now know
the wind adjacent to the equator is Easterly Trade Winds (right).
So what happens to the high pressure wind on the polar side of the high pressure line?
L
H
H ?
?

31
7. The wind around the equator is at a speed of +/- 885 knots. As it rises and gets pushed north or south, the circumference decreases – it has a shorter distance to go and will take less than 24 hours to go around.
8. In 24 hours, wind away from the equator moves more than once around – it goes faster than the slowing earth rotation speed.

32
9. So that’s why! So we see the air, wind, on the polar side of the High pressure, H,
moves faster than the earth surface at that latitude, so the polar side wind from
the High, H, curves towards the east.
The polar side winds are seen coming from the west (going towards the east).
L
H
H
Polar side
Polar side

33
So now we see where the Westerly Trade Winds are!
L
H
HWind from the south west (SW)
Wind from the north west (NW)
These are on the Polar sides of H’s.

34
Summary of the Main Trade Winds
As an interim summary, here are the Easterly and Westerly Trade Winds, and now you know how they are created, and
which is normally faster.
Westerly Trade Winds
Westerly Trade Winds
LH
HEasterly Trade Winds

35
Why “Trade” Winds???Sailing ships of centuries ago, not having engines, used to follow the best regular wind directions to sell and buy goods, to ‘trade’, as quickly as possible so that apart from the business aspect, crew did not have to spend excessive days on board when possible.
So to go west was closer to the equator; to go east they went further from the equator – the polar side of the ‘High’.
36
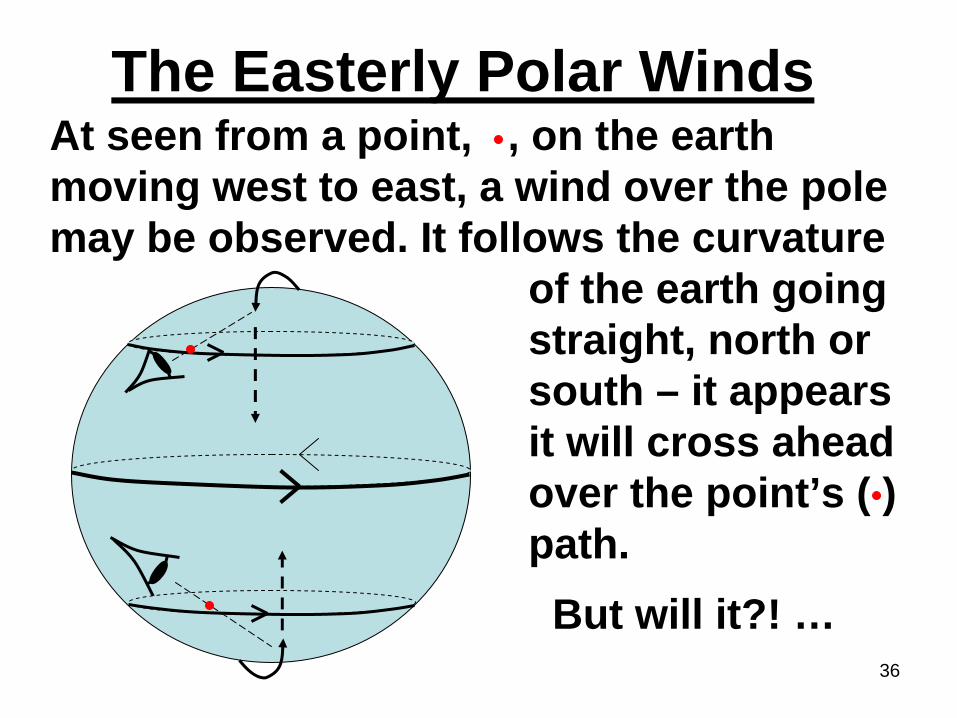
At seen from a point, , on the earth moving west to east, a wind over the pole may be observed. It follows the curvature
of the earth going straight, north or south – it appears it will cross ahead over the point’s ( ) path.
The Easterly Polar Winds
But will it?! …

37
Having moved towards the east, after a while the wind that appeared to be about to pass ahead over the point’s path, , is now coming straight at the point, . The winds’
tracks have curved towards the
west .
So the Polar wind is turning!
It was here.
It has moved

38
Later, the point having moved further to the east as the earth rotates, the wind is
seen to pass behind the point, , across its track.
It was here Now it is hereThen
here

39
CORIOLIS What we have been seeing is the curving of the polar wind towards the west, i.e. it comes from the north east in the north and south east in the south.
This cold wind from over a pole is therefore called the Easterly Polar Winds. They can be regarded as, but are not, Trade Winds.

40
So the three basic types of winds are:
LH
HEasterly Trade WindsEasterly Trade Winds
Westerly Trade Winds
Westerly Trade WindsEasterly Polar Winds
Easterly Polar Winds

41
The “Polar Front”The Polar Fronts are the areas between strong winds blowing in opposite directions on the polar sides of the high
pressure areas.A Polar Front
A Polar FrontH
H Later we see “Cold Fronts” on page 107.

42
Equator – Low Pressure, ‘L’
High Pressure, ‘H’
High Pressure, ‘H’
Oceans’ Winds From what we have seen so far, we would believe the lines of High and Low pressures around the world would be like we see here:
42

43
L
H
H
LL L
HH
HH H
Now we know land is higher than sea level, the higher the colder – and land can be hot by day and cold at night. Sea temperatures remain fairly constant day and night. So these High, ‘H’, and Low, ‘L’, pressures can be regarded more stable over the sea:
43

44
High Pressure When a bicycle’s tyre, car’s wheel, or a balloon, each with high pressure air inside it, is punctured or bursts, the air under high pressure immediately rushes out to the surrounding lower pressure air – nature tries to establish equilibrium, ‘even pressure’, everywhere. So without something to restrain it, high pressure moves towards low pressure.

45
L
H
H
LL L
HH
HH H
So we have ocean High pressures. The highest pressure is somewhere near the centre of its hemisphere ocean. The pressures north and south of the Highs decrease – as it does on lands’ sides.
45

46
Now, knowing that at sea level in the north and south hemispheres high
pressure air moves away towards lower pressure areas, and if we see the effect
of trade winds, we see …
H
H H
H
becomes

47
And the ‘domino’ effect causes all wind blowing away from the centre of the
high(est) pressure to curve in the same direction:
H
HA High Pressure is
called an Anti-Cyclone – irrespective of wind direction

48
We see the direction of the outer winds becomes closer and closer to being
parallel to the circumference, an ISOBAR.
H
H
As air starts to move away the angle between the wind direction and a near circumference is big.
As it gets further out the angle decreases.When further out it becomes parallel to a circumference.

49
What is an “ISOBAR”? Now imagine you are standing at the top of a very large hill
shaped like the top half of a ball. You relax after climbing and have a drink of
water – oops, you spill some …
Water spilt on the top flat area – it spreads out and dries, no movement.

50
If you spilt some of the water when you were near but not quite at the top of the hill, where you are on a slight slope, the water would SLOWLY start to drift down.
The water now moves slowly on a gradual
slope..

51
If you had been where it was a little steeper when you spilt water, the water
would spill over a larger downward area, drifting down a little faster.
As one gets further away from the top, flat, centre,
the speed increases.

52
If it happened where it was quite a bit steeper, the spilt water would run down
even faster.
The further we go from the centre the faster it flows away and down.
53
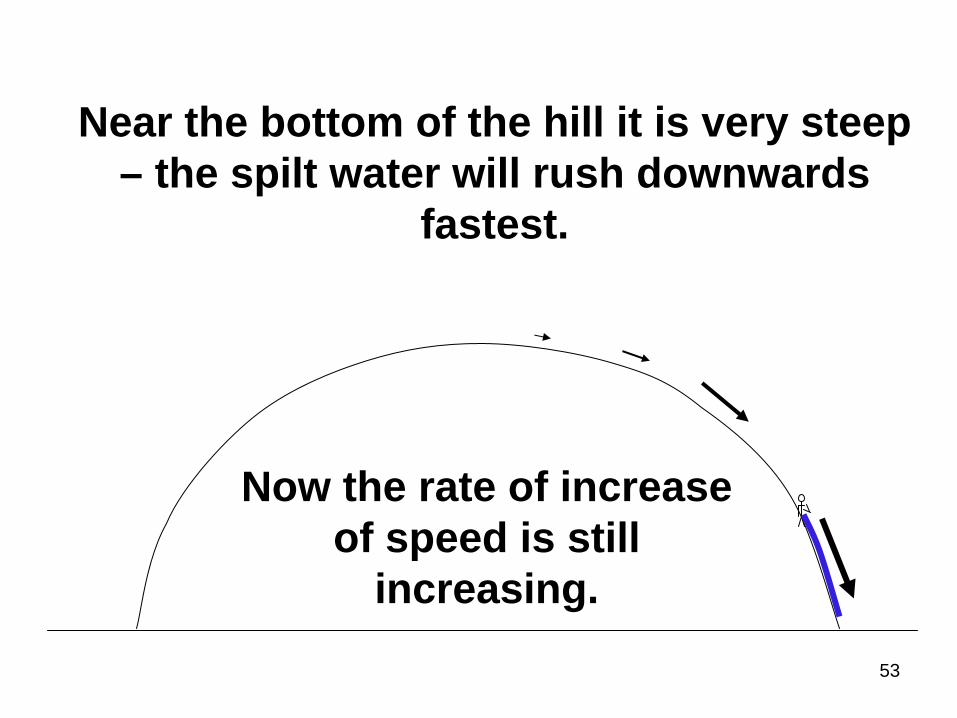
Near the bottom of the hill it is very steep – the spilt water will rush downwards
fastest.
Now the rate of increase of speed is still
increasing.

54
Imagine there was a ring painted around the hill at ‘X’00 m height intervals …
Notice the further from the top centre, the shorter the (horizontal) distance between
rings.

55
It is the same when we see the high pressures in the oceans’ hemispheres. Wind
at the centre of a High is zero! As we get further away the wind starts to develop; the closer the “rings” are, the steeper the slope,
the faster the wind flows.
For meteorology, the “rings” are ISOBARS. The closer they are, the stronger the wind speed.
H

56
Isobars are not perfect rings or circles – they mark all points of the same
pressure. For most weather charts they are showing the present shape of the
pressure area.
H
H
Northern Hemisphere
Southern Hemisphere

57
Isobars show where the pressures are different, usually every 4 mbs, millibars,
and the shape and pressure are constantly changing. Here are two
examples of an ocean High:
H
H
Northern Hemisphere
Southern Hemisphere

58
Here are three isobars for a higher High pressure (1022 mbs) in the southern hemisphere compared to a lower High (1018) northern hemisphere pressure.
H
H
A High pressure exists when the pressure is above 1013 mbs. Isobars show multiples of 4 mbs. So Highs’ isobars start with the pressure as 1014 mbs.
10181014
102210181014

59
Now if we know the effect of the Trade Winds, we can estimate where the winds
are going and where strong winds will be. We see strong
H
H
wind here in , where isobars are close to each other. Mild where they are far apart .
Easterly and westerly trade winds cause the wind turning directions.

60
Barometer Pressure Changes
By regularly monitoring the air pressure as seen on a barometer, the rate of change gives us an idea how much the wind speed will change. If we check every three hours, and enter in the vessel’s log book for later confirmation, we can find the approximate wind speed change to follow, usually about 4 hours after the pressure changed.
See the average rates of change: …

61
mb change up or down per 3 hours
012345
Wind speeds up in Low Latitudes 0° to +/- 35° N/S
0 knots5 to 10 knots
10 to 15 knots15 to 25 knots20 to 30 knots25 to 40 knots
Wind speeds up in Latitudes +/- 35° plus, N/S
0 knots0 to 5 knots5 to 10 knots
10 to 20 knots15 to 25 knots20 to 30 knots
These rates of wind speed change, due to pressure increase or decrease, are averages

62
When seeing a weather map, a Synoptic Chart,
we can estimate wind speed and direction – named where it comes from:
Hi
Hi
E
D CB
A A – 20 to 30 kns, SW B – 10 to 20 kns, WNW C – 5 to 10 kns, NNE D – 30 to 40 kns, E E – 15 to 25 kns, E F – 10 to 20 kns, SW G – 40 to 50 kns, NW H – 15 to 25 kns, NNE
HG
F

63
Examples from www.oceanweather.comExample 1. NE Atlantic Ocean

64
Example 2. NW Atlantic Ocean

65
Example 3. Australian Region

66
Example 4. South Atlantic Ocean
64

67
We often see the producers of the synoptic charts have recorded wind direction and speed for us – they show arrows indicating both. are changed to . Wind is:
the west wind, ‘W, 5 kns’ ( ), the wind from east, ‘E, 10 kns’, south west, ‘SW, 15 kns’, east north east, ‘ENE, 20 kns’,
etc. Each ‘feather’ of an arrow is for 10 kns; half length is 5 kns. This would be 45 kns from NW (north west):

68
The ring at the leading end of a wind arrow shows how many eights of cloud exist at the time on the synoptic chart:
0/8th
1/8th
2/8th
3/8th
4/8th
5/8th
6/8th
7/8th
8/8th
A number next to the ring shows air temperature in degrees Celsius
17

69
Example 5. South Africa’s Weather Bureau chart shows a Cyclone in the Indian Ocean
0°N/S
0°E/W
20°W
20°E 40°E
60°E
20°S
40°S
40°W
60°SAntarctic Coast
South African coast
Brazilian coast

70
To get an idea of wind speed at any place, measure the shortest distance between parallel isobars. What is the approximate latitude where it is?
20°S
40°S
30°S23°S

71
The wind speed between isobars at a latitude is seen from this graph:
Latitudes
Wind speed in knots
25 kns at 23° S
Knots: 30 20 10

72
Wind speed is also shown by wing arrows
Cold FrontWarm Front
70

73
Wind speed and sea state may be indicated by the
Beaufort Scale
Number
Wind speed knots
Beaufort Sea
State
Beaufort Name stated
The lighter the wind, the lower the Beaufort number, the flatter the sea, – the smaller the waves or ripples.
THE BEAUFORT SCALE

74
Beaufort Scale
Number
Wind speed knots
Beaufort Sea
State
Beaufort Name stated
0 0 - 1 Calm
Flat, smooth, mirror-like.
Force 0
72

75
Beaufort Scale
Number
Wind speed knots
Beaufort Sea
State
Beaufort Name stated
1 1 - 3 Light airs
Very small ripples, 10 cms/ 3 inches
Force 1
73

76
Beaufort Scale
Number
Wind speed knots
Beaufort Sea
State
Beaufort Name stated
Force 2
2 4 - 6 Light Breeze Small
wavelets,glassy crests,20 cms/ 6 inches
74

77
Beaufort Scale
Number
Wind speed knots
Beaufort Sea
State
Beaufort Name stated
Force 3
Gentle Breeze
3 7 - 10
Large wavelets,no white crests,
0,5 m/2 feet
75

78
Beaufort Scale
Number
Wind speed knots
Beaufort Sea
State
Beaufort Name stated
Force 4
Moderate Breeze
4 11 - 16
Small waves,becoming
longer,white caps.1,5 m/4 feet
76

79
Beaufort Scale
Number
Wind speed knots
Beaufort Sea
State
Beaufort Name stated
Force 5
5 17 - 21 Fresh Breeze Moderate
waves, taking a longer form,
many whitecaps, some
spray,2 m/6 feet
77

80
Beaufort Scale
Number
Wind speed knots
Beaufort Sea
State
Beaufort Name stated
Force 6
6 22 - 27 Strong Breeze Large waves
forming, whitecaps
everywhere,more spray,3 m/10 feet
78

81
Beaufort Scale
Number
Wind speed knots
Beaufort Sea
State
Beaufort Name stated
Force 7
7 28 - 33 Near Gale Sea heaps up,
white foam from breaking waves begins to be blownin streaks.4 m/14 feet
79

82
Beaufort Scale
Number
Wind speed knots
Beaufort Sea
State
Beaufort Name stated
Force 8
Gale8 34 - 40 Moderate highwaves, greater
length, tops begin to break into spindrift;foam is blown
in streaks.5 m / 18 feet
80

83
Beaufort Scale
Number
Wind speed knots
Beaufort Sea
State
Beaufort Name stated
Force 9
9 41 - 47 High waves; the sea
begins to roll,dense streaks of foam; spray
may reduce visibility.
7 m – 23 feet.
Strong Gale
81

84
Beaufort Scale
Number
Wind speed knots
Beaufort Sea
State
Beaufort Name stated
Force 10
Storm10 48 - 54 Waves v-high;overhangingcrests; white
sea as foam is blown in very
dense streaks;rolling heavy,
visibility reduced.
9 m / 29 feet.82

85
Beaufort Scale
Number
Wind speed knots
Beaufort Sea
State
Beaufort Name stated
Force 11
56 - 6311 Violent Storm
Exceptionally high Storm waves; sea
covered with white foam
patches; visibility still
more reduced.11 m / 37 feet.
83

86
Beaufort Scale
Number
Wind speed knots
Beaufort Sea
State
Beaufort Name stated
Force 12
12 64 + Hurricane Cyclone
Air filled with foam. Sea completelywhite with
driving spray; visibilityGreatly
reduced.14 m / 45 feet.
84

87
Beaufort Wind Beaufort BeaufortForce Speed Name Sea
Number (knots) State12 64 – 71 Hurricane 14 - 16 m13 72 - 80 Hurricane >16 m14 81 - 89 Hurricane >16 m15 90 – 99 Hurricane >16 m16 100 – 109 Hurricane >16 m17 109 – 118 Hurricane >16 m
Forces 12 to 17 as in the USA

88
It is possible to have a sea state higher than the wind equivalent, or vice versa. For example, immediately after a storm
which has ended rather quickly, the wind may drop to Force 5 while the sea state is still Force 7 but dropping soon.
AND, BE WARNED … if the ocean current or a tidal stream is moving in the opposite direction to strong wind, a larger steep walled ‘abnormal’ wave develops. Yachts and ships can sink…
Wind and Sea States may differ:

89
Wave PatternsWhen wind at 30 to 40 knots
+/- 4 m, no significant current or tidal stream
1. Normal wave patterns
2. Abnormal wave patternsIf the current or tidal stream is +/- 2.5 to 5+ knots, the ‘wall’ is +/- 10 m!
When SW winds are on the South East coast of South Africa, this is normal!!!
Current/Tidal stream

90
Big waves are not straight nor perfectly parallel lines – there are areas where one crosses another, and 10 m + 10 m = 20 m!
A wall of a wave, 10 or 20 m high, will smash a yacht and 20 m capsize any ship which is ‘beam on’ (sideways on) to the
approaching wave. And even if ‘head-on’ to that size wave, is like driving fast into a strong wall. There are ships and yachts, with people on board, that we know just
disappeared wherever in areas where that type of wind against current occurs.

91
Cyclonic and Anti-Cyclonic Winds
Whether in the northern or southern hemispheres, ‘cyclonic’ winds are around ‘Lows’, and anti-cyclonic winds are around ‘Highs’, regardless of rotation direction.
Do not be confused – these names have nothing to do with meaning these winds are cyclones, Tropical Revolving Storms, TRS’s, etc. They just tell us that if wind is cyclonic, it is a Low; anti-cyclonic a High.

92
Low Pressures – Cyclonic WindsWe saw that High Pressure is anywhere
where the sea level air pressure is greater than 1013 mbs – therefore less than that
is a Low Pressure (L). L = <1013 mbs.We are involved with three types of Lows: 1. Ocean Low:
a. Formed at the Polar Front. b. Formed close to the equator.
2. Coastal Low – formed on a coast line.
93
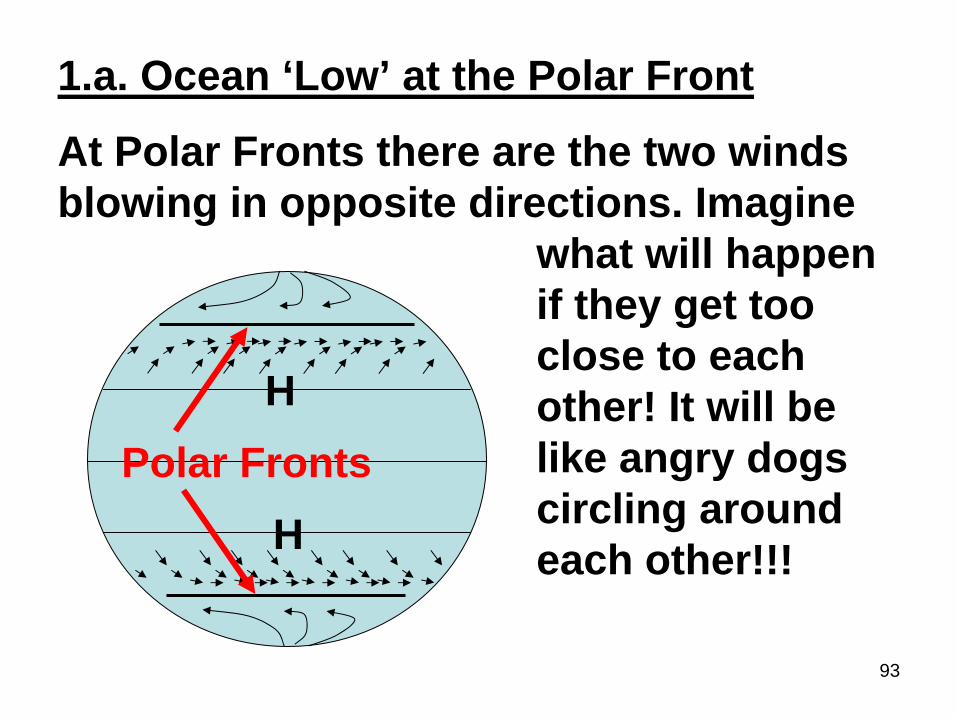
1.a. Ocean ‘Low’ at the Polar Front
H
H
At Polar Fronts there are the two winds blowing in opposite directions. Imagine
what will happen if they get too close to each other! It will be like angry dogs circling around each other!!!
Polar Fronts

94
When the two strong winds begin to approach too close to the sides of each
other, a spinning motion starts:Northern Hemisphere Polar Front:
Southern Hemisphere Polar Front:Anti-clockwise turning
Clockwise rotation

95
We know that if we had a plate with crumbs on it, and it was on a disc that spins, as it starts to turn the outer and lighter crumbs slide outwards and off the plate. As it speeds up, more and more crumbs do the same thing.
Look at water rushing out of a basin’s outlet – as it speeds spinning, so a hole develops in the centre.

96
The faster the winds were blowing, the higher the speed of revolution forms, and the lower the pressure at the centre of the
circle, the Low Pressure (L), becomes.
H1018
1014
Northern Hemisphere:As it starts: It becomes:
H1018
1014
LAt sea
level, air goes fast inward to fill the ‘L’.
Anti - Clockwise

97
L
Wind around a ‘Low’ in the southern hemisphere curves inward in a clockwise direction to fill the air gap being created.
H1022
10181014
H1022
10181014
Southern Hemisphere:
This … becomes
Clockwise:

98
So remember: ocean Lows are created in the Polar fronts,
Lows in the north turn anti-
clockwise; in the southern
hemisphere they are clockwise. Highs rotate opposite to
Lows.
H1022
10181014
L
L
H1018
1014

99
The westerly trade winds are always in their general area; they therefore
push the ocean Lows from west
to east.H1022
10181014
L
L
H1018
1014
80%20%
20%80% 97

100
1.b. Ocean Lows form near the equator.
Africa
South America
H
In the North Atlantic, cold wind from the Artic brings cold water the same way:
Cape Verde Islands
Equator
Wind
Caribbean
Ocean current
Trade

101
H
The relatively colder water causes cool air – cool air speeds up as it approaches the gap of rising hot air over these islands. When the occasional Trade winds speed differs, rotation results; anti-clockwise.
Africa
South America
Stronger winds,
lighter winds,hence anti-clockwise wind around a ‘Low’.
102
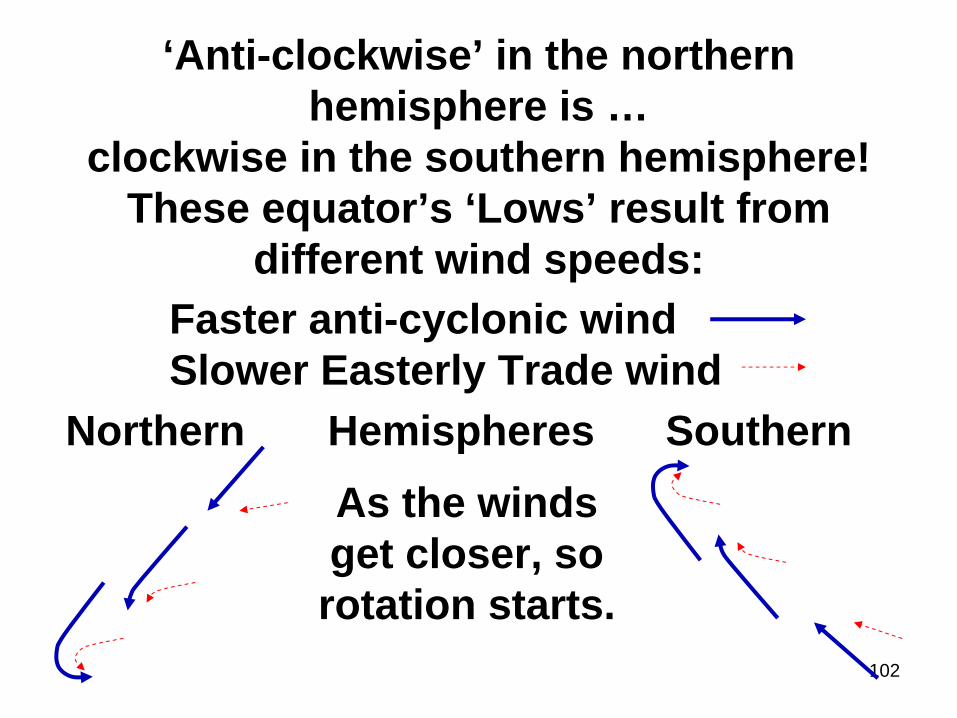
‘Anti-clockwise’ in the northern hemisphere is …
clockwise in the southern hemisphere! These equator’s ‘Lows’ result from
different wind speeds:Faster anti-cyclonic wind Slower Easterly Trade wind
Northern Hemispheres Southern As the winds get closer, so rotation starts.

103
L
H
Due to the stronger winds as well as the Easterly Trade Winds, once formed the Low is moved east to west. The same occurs in all oceans – mirror image for southern hemisphere.
Africa
South America
L
See “TRS’s”, page 161.
104
2. Coastal Lows
Where the land along a hot coastline has air rising, air over the colder sea does not; not all air rises. So the rising land air leaves a gap – a low pressure. Cold air moves in from the colder sea to fill the gap, and the more that goes ashore and heats up then rises, the more the air pressure across the coast-line drops.

105
Southern Africa’s west coast is an example of a coastal low. They are not as low and windy as ocean lows.
H Hot air, not dense, rises, forms a Low.
Cold sea from the Antarctic has cold air, more dense.
L
South Atlantic Ocean
West coast of Southern Africa.

106
The cold sea air moving off the sea into the gap created by the hot land’s air that has risen, also warms and rises.
H
Hot air, less dense, rises, forms a Low.
So the pressure drop is on both sides of the coast line.
L

107
For +/- 50 n.m. seaward, the wind blows ‘80%’ of the time parallel to the coast towards the low(est) pressure:
H L
So if in Cape Town* the
Coastal Low pressure is to the north, the wind is from the south, to
the north.*

108
Weather forecasts refer to “Coastal Weather for 50 n.m. Seaward”:
H L
So if north of the Low, the wind is seen
to be from the north,
opposite to wind further
offshore.*

109
Cold FrontsWe have all heard the term “Cold Front” and we know it relates to a temperature drop, cloudy cold weather, and rain. We now know ‘ocean lows’ (1.a., pages 93 to 99) formed at the Polar Front are drawing in cold wind from the pole, and the Highs’ warm humid air is formed near the equator. These two come together and then this happens …
and Warm ones!

110
Condensation, Coalescence, and Precipitation
When the faster cold air from an ocean Low happens to be where it runs into the back of slow moving warm humid air, there is cooling and condensation, forming many types of clouds, then coalescence results in precipitation – rain. The greater the cold and humid warm airs’ temperatures differ, the stronger the rain and wind increases. Now read …

111
So what is:
Condensation – when humidity reaches 100%, Due Point, and then gets cooler, it has too much water vapour– some must go! Tiny drops of water, too light to drop, form and when many, they are seen as a cloud.
Coalescence – is when lots of the tiny drops bump into each other and join into bigger lumps of water, too heavy as clouds.
Precipitation – when these larger lumps, or drops, being heavy, fall downward – rain!

112
Cold water and cool air approach the equator on the east side of an ocean. As it moves towards the west it gets hotter by day as the sun moves across with it.
HVERY Cold
ColdCool
WarmWarmerHot
HVERY ColdCold
Equator:Cool

113
Each day as the sun rises, the sea and air start warming more near the equator, so evaporation starts and increases, and
by the end of the day there has been a huge amount of humidity increase.
H
H
Europe
Africa

114
From sunrise to sunset every day we get an area of hot air created
H
H

115
– at night it moves away, and the next day it repeats.
H
H

116
Now imagine (1) a day’s humid hot air moves slowly around to the polar side of a High. When there, if an ocean Low which has formed and is moving faster, west to east due to the more powerful trade winds, and catches up with the back of the slow moving humid hot air, the cold air pushes hot humid air (2) - see the next page.
The humid air is cooled. Condensation is followed by Coalescence and Precipitation – a large temperature difference causes LOTS of this, and wind speed increases …

117
H
H
L
L1. We see the slow
warm humid air is on the polar side of the ‘High’.
2. The ocean ‘Low’ has formed, and is pushing fast cold air into the back of the slow east moving warm humid air.

118
The airs’ temperatures differences where the very cold polar wind pushes into the back of the warm, humid air, results in a huge amount of condensation, heavy rain and strong wind. When exceptionally strong from intense condensation, there may also be lightning, thunder and hail.
L
H
Very cold Warm
Northern Hemisphere Southern
L
H
Very cold
WarmCold Front
Cold Front

119
This condensation, forming clouds as the cold front, creates rough winds following the big drop in air pressure. It causes wind speeding up to go into the cloud to fill the lost space once occupied by vapour.
Assume this volume of vapour, , after condensation, forms a minute drop of water this size: . See how much space is left empty! So the pressure drops a lot. As this is happening in random areas, wind is moving in all directions in the Cold Front cloud – a VERY rough in-cloud wind ...

120
WarmVery cold Cold (not
very?)Slow
Going from left to right, west to east, is the same in both hemispheres – the faster, heavier cold air pushes in under the warm air. At the sloped junction is where the cloud and wind and rain is happening.
Cold front cloud

121
If the air ahead of the ‘front’ of the warm air is cool, there may also be some dark condensation (clouds), coalescence, and then precipitation. However, this cool air is not as cold as the cold polar air; this rain and wind will not be as strong. It is the “Warm Front” :
L
H
Very cold
WarmCool
Northern Hemisphere Southern
L
H
Very cold
Warm
Cool

122
If the air ahead of the ‘front’ of the warm air is cold, then there WILL be some dark condensation (clouds), coalescence, and then precipitation. So it depends on the temperature of the air ahead of the warm air; cool = not much condensation,
cold = more dark clouds and rain.
L
H
Very cold
Warm
Cold air, rain
Northern Hemisphere Southern
L
H
Very cold
WarmCold
air, rain

123
If this
air is colder; more!
So, as we know when the air ahead of the approaching ‘Warm Front’ is not cold, but just cool or even warm, there will be little if any rain and also clouds, but when it is a lot colder such as at higher latitudes, there will be a lot of clouds and steady rain but not very strong wind.
Warm FrontVery
coldRain
Cold front cloud

124
WarmCold
Very cold
As time goes on, the warm air and its humidity is ‘eaten up’. The faster moving very cold air is advancing in on the decreasing volume of warm air.
Cold front cloud

125
Warm
ColdVery cold
Cold front cloud
Then “Occlusion” occurs – the very cold air has pushed in under the warm air, the lower part of which is seen to rise. So at sea level there is no Very Cold against Warm air – the rain rises and decreases, and the sea wind starts to drop.

126
WW
When seen on Synoptic Charts (weather maps) note the symbols for Cold Fronts and Warm Fronts; see where Occlusion may have started to occur – the front is fading.
L LL
LLL
Northern Hemisphere
Southern Hemisphere
Started Later Ending
W WW
W
Occlusion*
* *
127
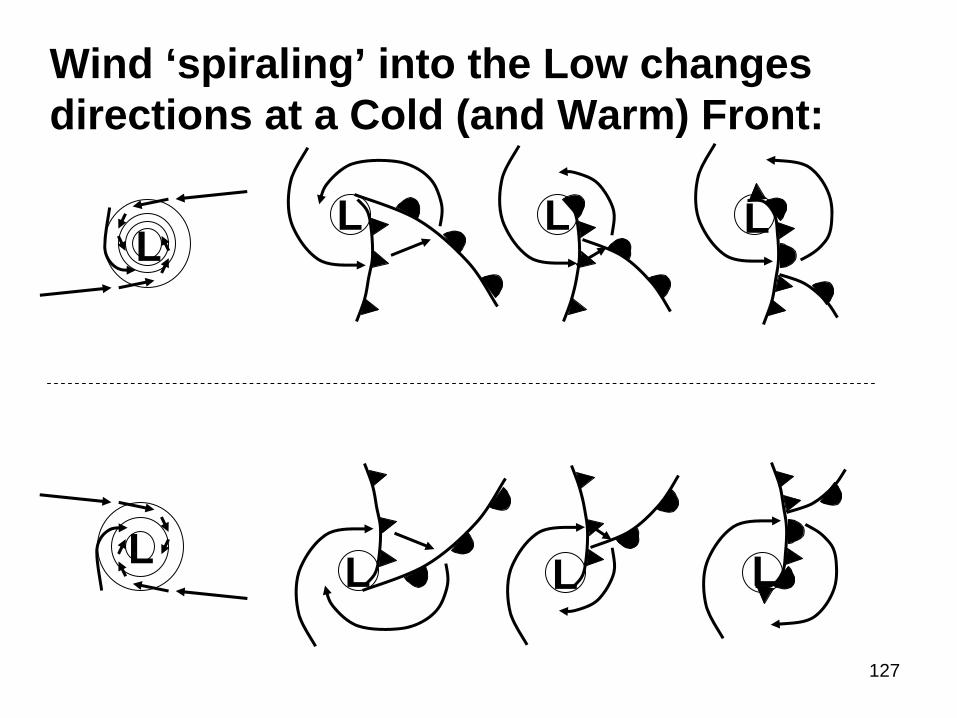
L
L
Wind ‘spiraling’ into the Low changes directions at a Cold (and Warm) Front:
LLL
L LL

128
L
In the Northern Hemisphere we see the wind directions around the ocean High near a cold front, and around the Low as:

129
In the Southern Hemisphere we see the wind directions are only different because they curve in the opposite directions.
L

130
See what to expect of wind direction changes as a front approaches and passes:The front moves to the east 5 4 3 2 1
1. Before it arrives our wind is West of North West – WNW. 2. As it arrives the wind changed anti-clockwise, it BACKS. 3. Then it moves a little clockwise, it has VEERED. 4. Veered more. 5. Normal again.
(Northern Hemisphere)

131
If it approaches and passes south of you, i.e. on the equator side of you:
The front moves to the east
5 4 3 2 1
1. Before it arrives our wind is West of North West – WNW. 2. As it arrives the wind changed anti-clockwise, it BACKS. 3. And Backs. 4. And Backs. 5. And Backs back to normal again.
(Northern Hemisphere)

132
“Veer/s/ed” means the wind direction has changed in a clockwise direction. As an example, wind from the north changes to being ‘from’ north east, then from east.
“Back/s/ed” means the opposite direction of wind change, e.g. wind from the north becomes ‘from’ north west, then west.
In the 21 century, these terms apply the same in both hemispheres, but there are officials who still use the old method where they mean opposite directions i.e. BACK in the south = VEER in the north.

133
In the Southern Hemisphere it is exactly the same but a mirror image – directions are opposite:
5 4 3 2 1
1. Before it arrives our wind may be West of South West – WSW. 2. As it arrives the wind changes clockwise, it VEERS. 3. Then it moves a little anti-clockwise, it BACKS. 4. It BACKS more. 5. It VEERS to WSW.

134
If it passes north of you, i.e. on the equator side of your position, wind just veers and veers:
5 4 3 2 1
1. Before it arrives our wind may be West of South West – WSW. 2. As it arrives the wind changes clockwise, it VEERS. 3. Then it moves a little more clockwise, it VEERS. 4. It VEERS even more. 5. It VEERS to the original WSW. It has turned +/- 360°!

135
Why do we need to know this?
Weather forecasts are not always received when well out to sea. Never-the- less we can know a Low with or without a cold front is approaching our area.
We see the Barometer Pressure dropping!
When below 1013 mb we are in the Low.
Where is its centre? Which way is it going? Do we need to change out course?
How do we know if a Cold Front is coming?

136
Where is it, its centre?
We use “Buys Ballot’s Law” – it tells us how to determine where the Low is, and then how to determine whether it will come straight at us or pass us on which side.
?L ?
L ??

137
Where is it, its centre?
L
L
When approaching, face* into the wind.
North Hemisphere: It is over my right shoulder.
South Hemisphere: It is over my left shoulder.
Getting closer,
the angle increases
*RYA says get it on your back … (P.T.O.)

138
The RYA says put your back into the wind. If you do that then what is over your left shoulder when looking into the wind becomes over your right shoulder, etc.
An advantage may be that you do not have heavy wind and breaking waves spray into your eyes. But how accurate will you be?
I believe that will only happen when the Low is already getting very close. Having your eyes and face’s cheeks into the wind gives a much more accurate determination of wind direction, and therefore the Low.

139
Is it coming straight at us?
L
LIf you see the wind
direction is not
changing, you are on its path; it is coming straight to
you.
D C B A
D C B A
If at A, then B, then C, then D and the wind stays the same direction, watch out!
Northern Hem.
Southern Hem.
140
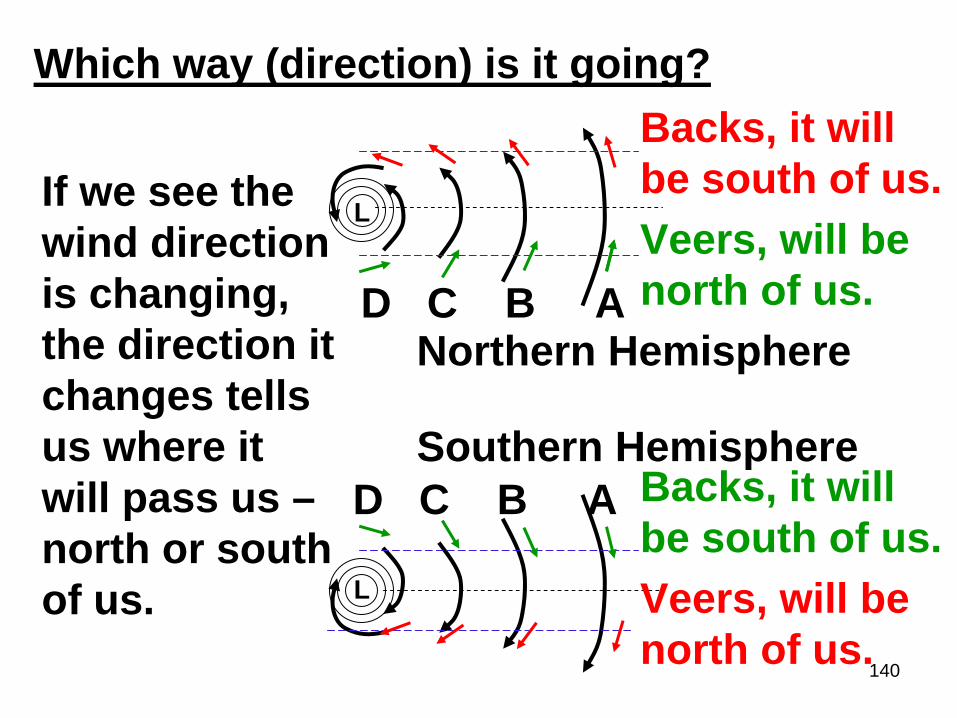
Which way (direction) is it going?
L
LIf we see the wind direction is changing, the direction it changes tells us where it will pass us – north or south of us.
D C B A
D C B A
Backs, it will be south of us.Veers, will be north of us.
Backs, it will be south of us.Veers, will be north of us.
Northern Hemisphere
Southern Hemisphere

141
Do we need to change course?
In the northern hemisphere we need to have the wind on the starboard side of the vessel, power or sail. If it is on the port side it means we are going closer to the centre of the Low, the centre of a storm?

142
In the Southern Hemisphere, the wind should be on the port side of the vessel to ensure movement is away from the centre of the Low where wind is strongest. If the wind is on the starboard side it will result in the vessel going into the centre of the Low.
143
How do we know if a Cold Front is coming?
We know that when warm humid air is cooled below the “Dew Point”, i.e. when 100% humidity continues to cool, then condensation occurs. Clouds are seen ...
At the leading edge of the warm air we see cooling from the air ahead. As the cool air is not very cold, the speed of condensation is slow – there is only little wind; these clouds are relatively smooth, “Stratus”. Cold Front, windy/rough clouds are “Cumulus”:

144
High level wind is fastest. Low level air is slowed by the slower earth rotation speed being further away from the equator. So there is a sloping edge of the Warm Front.
Cooling airWarm
humid air
Cool or colder air
Fast Slow
Cold Front
Very Very cold cold airair
FasterFaster
SlowerSlower
Warm Front

145
Cold Front
Clouds above 8000 m are the High clouds, high = cirro. Clouds between 2000 m and 8000 m are the middle level clouds, middle = “Alto”. Clouds below 2000 m have no prefix.
2000 m
Medium
Low
High8000 m
“Alto’s”
“Cirro’s”
146
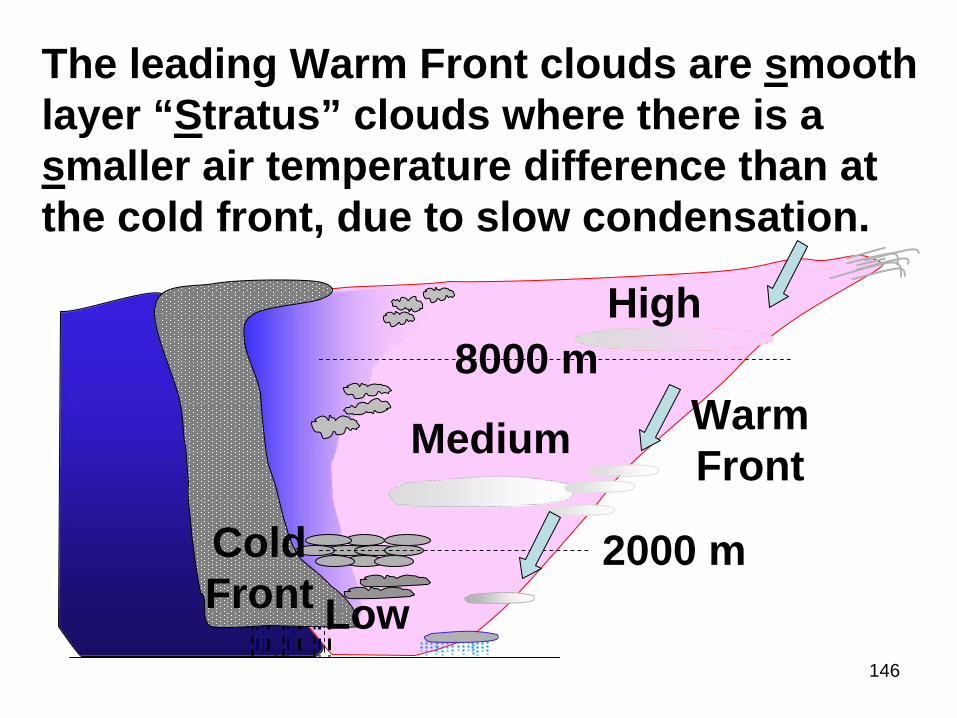
Cold Front
The leading Warm Front clouds are smooth layer “Stratus” clouds where there is a smaller air temperature difference than at the cold front, due to slow condensation.
2000 m
Medium
Low
High8000 m
Warm Front

147
Cumulus
Cirrostratus
Altostratus
Stratus
For practical sailing purposes, names are not too important, but when first seeing the high clouds come over the horizon, then clouds getting lower, A FRONT IS COMING!
CirrusCirrocumulus
Altocumulus
Stratocumulus
Nimbostratus (steady rain)
Cumulo- nimbus
Heavy rain

148
The highest Cirrus clouds – see streaks:

149
Cirrocumulus – high, small lumpy clouds:
147
150
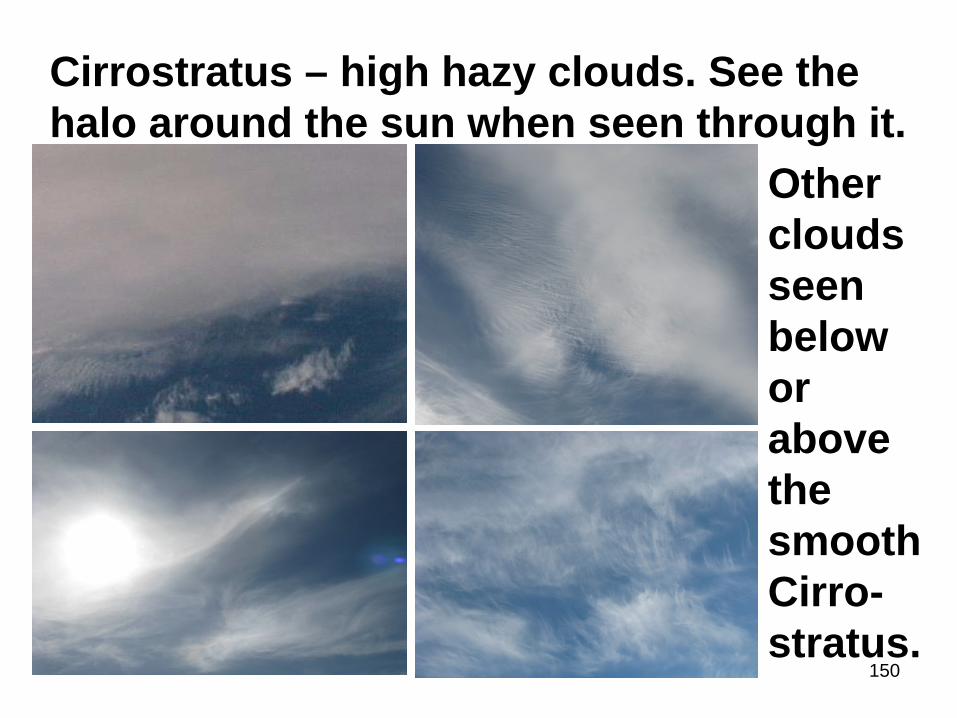
Cirrostratus – high hazy clouds. See the halo around the sun when seen through it.
Other clouds seen below or above the smooth Cirro- stratus.

151
Altocumulus – any ‘middle level lumpy’ clouds – sometimes some types are
seen in irregular sequence.

152
Altostratus – ‘middle level smooth and deep’ cloud – nothing visible through it .
Some other clouds seen above or below it.

153
Stratocumulus – a dark layer of lumpy clouds, all are joined
together and no sky or anything visible through them. It will not
normally be long before rain
starts.

154
Cumulus clouds – usually with a flat dark bottom. If not part of the ‘cold front’ clouds sequence, it normally will be indicating nice sailing speed Trade Wind, but here the wind was lighter. We were motoring! 152

155
Stratus – mainly smooth and low clouds, with gaps between them. If at sea level, it is fog:

156
Nimbostratus – dark and rain imminent or it is raining – here it was moving from port (left) to (right) starboard. We can only see the bottom of it approaching.
154

157
Cumulonimbus – a sight very rarely seen. Rain was pouring down under the bottom
dark area to the right. We only see its side.
158
BB
CC
DD
AA
You You are are
herehere
Your Your horizonhorizon
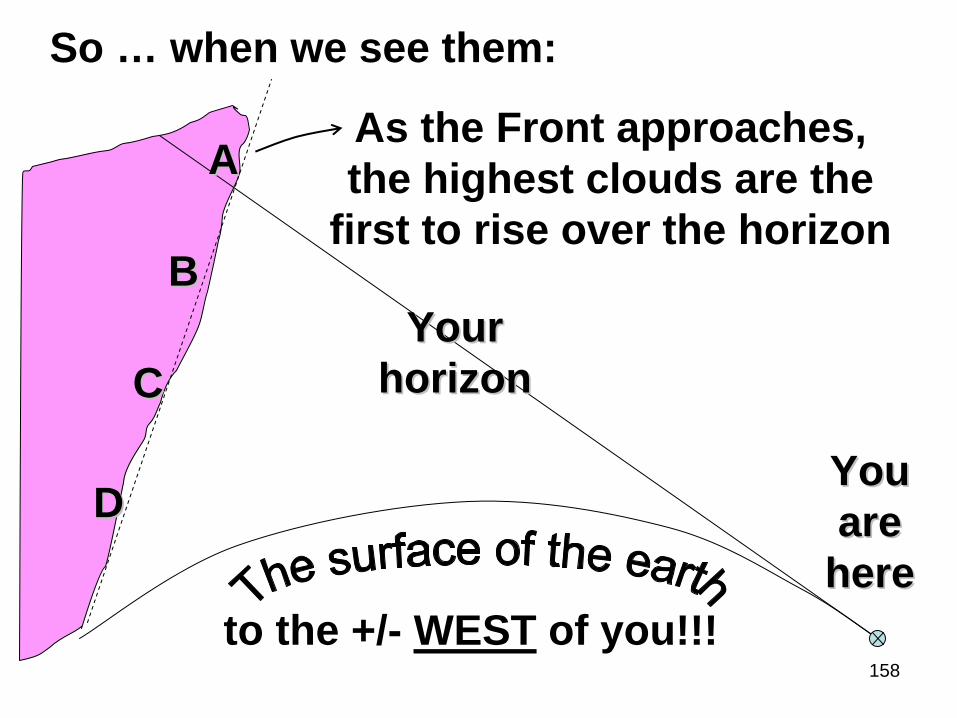
As the Front approaches, the highest clouds are the
first to rise over the horizon
to the +/- WEST of you!!!
So … when we see them:

159
BB
CC
DD
AA
You You are are
herehere
Your Your horizonhorizon The next clouds are
then rising over the horizon
The top clouds may have passed already..
A few hours later … the next may be seen

160
BB
CC
DD
AA
You You are are
herehere
Your Your horizonhorizon
Later lower clouds are seen rising over
the horizon
Often layers overlap - we see several.
And this continues until the lowest are seen to arrive!
Later

161
The cirrus clouds of a ‘front’ are usually(?!) about 500 n.m. ahead of the cold front. As clouds follow getting lower, the wind direction changes, as shown on pages 128 to 134.
When we see the wind direction changes, clouds down to the lower levels, and the sky gets darker, rain is not far away.

162
However, while observing high clouds changing as lower clouds arrive, it may happen that suddenly there is a clear sky. If it stays clear, the ‘front’ is going to pass to one side of you, not over you.
Quite often we see that the clouds moving take a long time – either they are moving slowly (maybe being blocked by a High pressure ahead) or each type is covering a long distance, and many may overlap.

163
Tropical Revolving Storms, T.R.S.’s
We have all heard of “Hurricanes” and “Cyclones” and we know they are the very strong winds of storms in the tropics, hence TRS’s.
Unlike normal ocean Lows formed in the polar front and which move west to east, in the tropics we have the easterly trade winds pushing the weather form east to west.
So Lows moving east to west are to be regarded as TRS’s unless proved not.

164
When wind speed is known to be over 54+ knots, it is termed a Tropical Depression. When it increases to over 64 knots it is a Tropical Storm, a Hurricane, a Cyclone, or a Typhoon. These occur here:
Cyclones
Hurricanes
Typhoons
164

165
In the west of the North Pacific ocean they happen at any time. In the North Atlantic and east of the Pacific they are from June to December. Typhoons a, b, and c are April to July, September to January, and … April to December!!!
Cyclones:a b
c
October to March
December to April
None!165

166
When seen on a synoptic chart, the inner symbols instead of an ‘L’ for Low is for Tropical Depression; when it is upgraded it becomes . So we see they appear as:
becomes and becomes
They usually form at latitudes of about 10° plus, and in the eastern half of the ocean, then follow a general direction similar to the outer winds of the ocean high pressures. When curving up to latitudes of around 35° to 40°, they then die away. Sometimes the route may be over islands and into land.

167
These are the more normal routes. At times they are like bad drivers; they go at extra speed where the should not!
Cyclones normally occur between October and March/
December to April, but infrequently they do or may
appear in any month.

168
The Track
The Track
The Path
The Path
- the most dangerous quadrants to be avoided
- the second most dangerous quadrants; they are to be avoided.

169
Imagine the wind around these TRS’s are at about 75 knots. Imagine also that the TRS’s are moving east to west at 25 knots - the wind on the polar side will be 75 + 25 = 100. 25 knots
75 knotsOn the equator side it is 75 – 25
= 50 knots75 knots 25 knots
75 knots25 knots
25 knots75 knots

170
So the equator side of the path is on the opposite side to the very dangerous quadrants and the wind will be about half the speed of the most dangerous side!
Now we also need to know, in the northern hemisphere whether on a power boat or sailing, to move away and not towards the centre of the Hurricane the wind must be coming onto the starboard side of the vessel. In the southern hemisphere the wind must be on to the port side. Let’s see…

171
As the wind veers or backs, you want to be moving away, not towards the storm.Northern Hemisphere - wind to be on the starboard.Southern Hemisphere - wind to be on the port side.

172
Tornadoes occur when the condensation in cumulonimbus clouds is so intense, air rushes into the cloud from all directions. High speed winds rushing together from opposite directions start to spin, re-creating a very low pressure in the cloud. As it continues and increases, it starts to spiral down – when the high speed rotating wind gets to the ground, it smashes anything and everything in its way. Objects get thrown up and away. If over water, a water spout tower occurs.

173
Inside a very low pressure area wind is pulled in from all sides – wind in opposite directions starts fast spinning …

174
When you see water starting to spin down into a basin’s outlet, the top opening gets larger as the ‘hole’ gets deeper …
In this cloud, the spinning also starts to work down- wards. It will touch ground first as a pin! Then expand.
Low level winds can be near 200 knots!

175
Three categories of Tornados: 1. Weak, +/- 10 mins, wind up to 95 knots. 2. Strong, up to 30 mins, wind up to 175 knots. 3. Violent, +/- 1 hour, winds more than Strong.
Observe the size where it touches down – about 200 m? The wind is VERY strong even miles away!

176
Thunderstorms occur in cumulonimbus clouds. The big difference in temperatures cause the warm humid air to experience rapid condensation. (Remember page 119,
becomes .) When millions of these are happening at random in varying places, air is running in many directions at any one time, then another, then another, so air turbulence becomes excessive. This results in electrical voltage build-up.
177
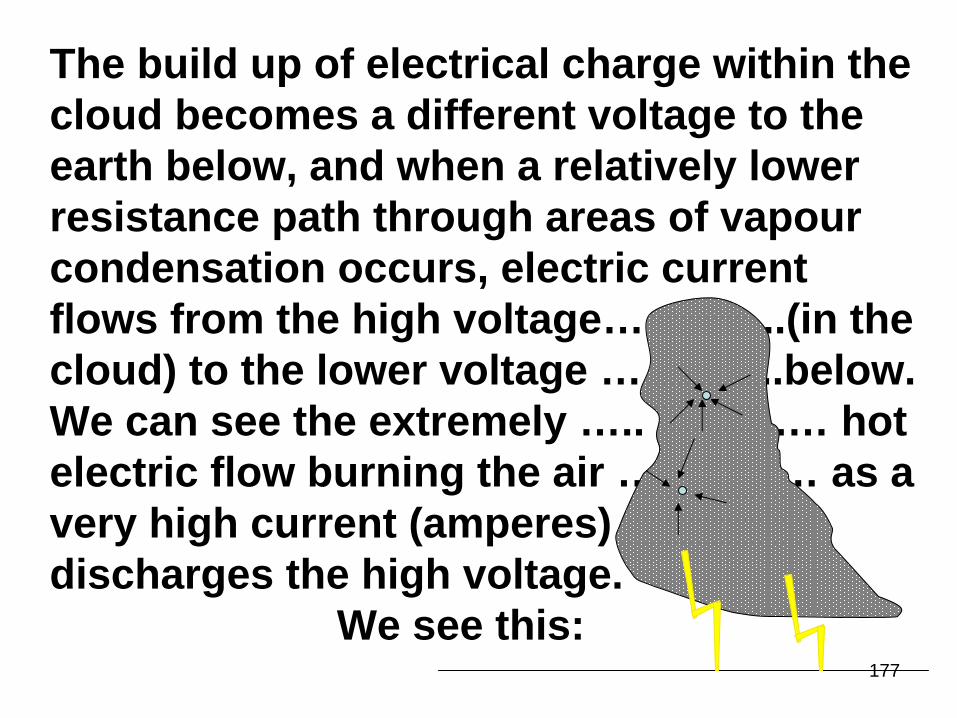
The build up of electrical charge within the cloud becomes a different voltage to the earth below, and when a relatively lower resistance path through areas of vapour condensation occurs, electric current flows from the high voltage… ..(in the cloud) to the lower voltage … ..below. We can see the extremely ….. ..… hot electric flow burning the air … … as a very high current (amperes) discharges the high voltage.
We see this:

178
The lightning high current flow ‘spark’ only exists for a second, and a very short while later we hear a loud ‘bang’. All the air and vapour in its path have been burnt to nothing, leaving a ‘tube shaped’ empty gap. Air around it now rushes in from all sides to fill this gap. As the air is moving in, it is accelerating. When air from opposite directions crash into each other, the resulting vibration of the air is at sound identifiable frequencies – we hear the ‘BANG’.

179
The speed of sound at and near sea level and under normal conditions is 340 m/second.
Therefore it takes: 3 seconds per kilometer, 5 seconds per mile, and 5.5 seconds per nautical mile.
So when we see the lightning, then hear the sound, we can determine how close or far away it is.

180
Fog - when visibility is less than 1000 m due to sea level ‘cloud’. (We deal with “Advection” and “Radiation” fog.) 1. Advection fog. Whenever warm, humid air is cooled over the sea, and as a result the humidity reaches 100% or ‘Due Point’, any further cooling will cause condensation. The condensation that takes place appears as a cloud. If warm humid air moves over cold sea surface areas, condensation occurs at sea level – and our visibility is reduced.

181
H
H
Each day as the sun crosses east to west near the equator, air and sea moving the same way heats up and humidity grows!
Later, when the warm humid air circles around the High, it may eventually cross over cold sea where cooling and condensation may occur – it is fog.

182
Fog at sea is called Advection Fog – it can happen anywhere if there is cold sea and warm humid air. Once it is seen to start approaching, there are several safety actions to be applied:
1. Slow to a safe speed. 2. Start sound signals. 3. Lights on. 4. Crew on deck with lifejackets on or nearby, and all spread around to look for other vessels or anything affecting safety. 5. Radar on, and reflector up. 6. Radio your position, course, and speed to a marine station.

183
“Inversion” is a result of Fog.
Normal air temperature is warmest at sea level. Air cools as height increases. Where fog occurs, the air over cold sea water cools, and therefore a warmer temperature is above the fog. From sea level fog, higher air’s temperature rises, and thereafter as it goes even higher, normal cooling then occurs.
Over fog where higher air warms, there is “Inversion” (of temperature change):

184
An illustration makes it easier to understand “Inversion”:
Normal InversionAir temperature changes with height …
WarmestWarmerWarmCool
CoolerCold
ColderColdest
Cool/CoolerWarmerWarmCool
CoolerCold
ColderColdest
Coo
ls
Warms
Coo
ls

185
2. Radiation Fog
Fog also occurs over land – called “Radiation Fog”. Humid air, often created by water vapour ‘radiating’ from plants, if at high altitudes or where significant cooling occurs, may experience condensation – fog. If it is cooler, heavier air than the warm air near sea level, so like a river, the fog flows down and may spill out to sea but only for a few miles before it starts evaporating.

186
Land and Sea BreezesHot land next to a coast where there is cold sea, has air heating and rising during the day, and cool heavier air comes off the sea to fill the gap being created by rising hot air. A light wind blows from sea onto the land – a “Sea Breeze”. At night, high level land’s air gets colder and heavier than coast level warmer air – the heavier air flows down and over the coast out to sea a few miles – it is “Land Breeze”. Let’s see …

187
Cold sea
Sea Breeze
Hot
Hot air rises and leaves
space. Cold, heavier air moves into the space on land
Land BreezeColder, heavier air up on high ground
flows down like a river to lower
warmer areas, and
THESE ONLY HAPPEN WHEN
THERE IS NO ‘ISOBAR’ WIND!
Warmer
Colder+/- 5 n.m.
spills out to sea.

188
And That is That!
To really understand and know the “Marine Meteorology”
in this presentation, be prepared to go through one or more
sections several times. Then when at sea, watch what is happening, have regular checks
(3 hourly?) on barometric changes, clouds, wind direction changes, and look for and get
forecasts when possible.

189
Thank You!
Thank you for taking the time to work through this whole presentation on
‘Marine Meteorology”.
If you have any queries, ideas, or suggestions, or if you are aware of any
errors, please email me at [email protected]
www.sailingtrainingcd.com