Embed Size (px)
Citation preview
2017-11-08 – BOULE DIAGNOSTICS (1) Copyright © 2013, Boule Medical AB
Boule Diagnostics ABCompany presentation and Q3 report November 8, 2017
Fredrik Dalborg, CEO and Group PresidentChristina Rubenhag, CFO
Hematologyis in our blood
2017-11-08 – BOULE DIAGNOSTICS (2) Copyright © 2013, Boule Medical AB
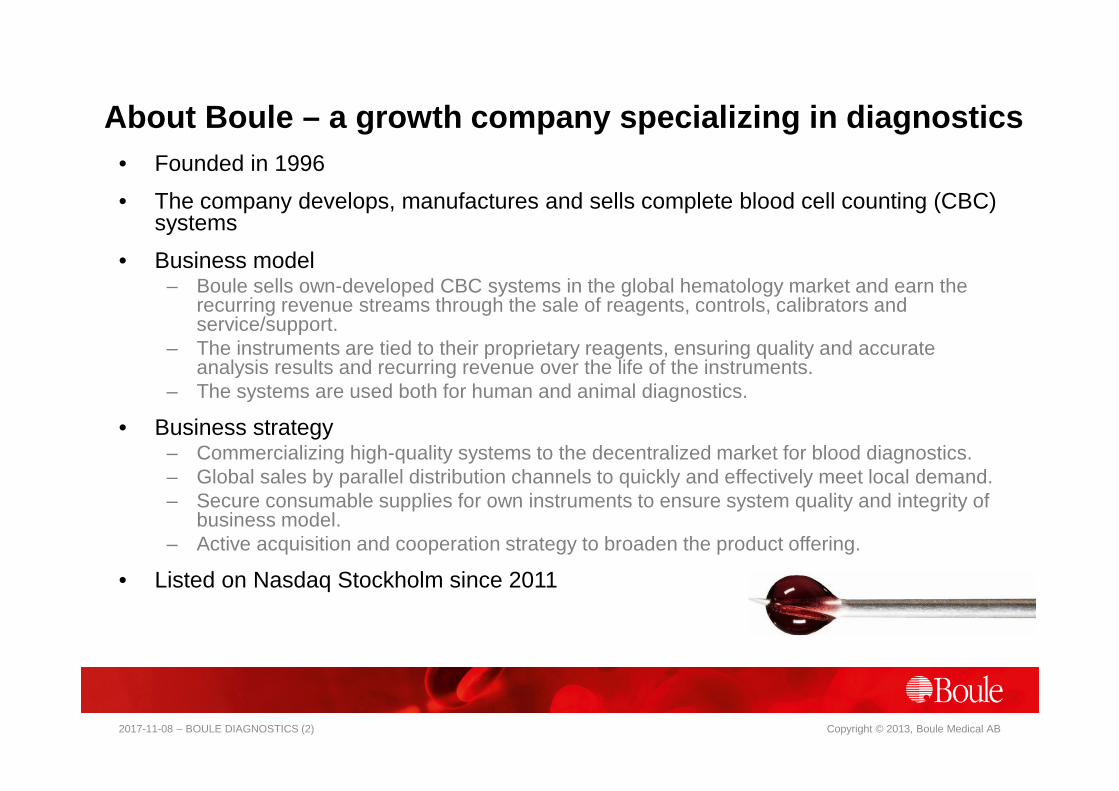
About Boule – a growth company specializing in diagnos tics• Founded in 1996
• The company develops, manufactures and sells complete blood cell counting (CBC) systems
• Business model– Boule sells own-developed CBC systems in the global hematology market and earn the
recurring revenue streams through the sale of reagents, controls, calibrators and service/support.
– The instruments are tied to their proprietary reagents, ensuring quality and accurate analysis results and recurring revenue over the life of the instruments.
– The systems are used both for human and animal diagnostics.
• Business strategy – Commercializing high-quality systems to the decentralized market for blood diagnostics.– Global sales by parallel distribution channels to quickly and effectively meet local demand.– Secure consumable supplies for own instruments to ensure system quality and integrity of
business model.– Active acquisition and cooperation strategy to broaden the product offering.
• Listed on Nasdaq Stockholm since 2011

2017-11-08 – BOULE DIAGNOSTICS (3) Copyright © 2013, Boule Medical AB
Complete blood count (CBC) – how it works
1 2 3
Clinical relevance
Red blood cells Platelets White blood cells– Anemia – Coagulation disorder – Bacterial infection– Bleeding – Chemotherapy – Viral infection– Pregnancy – Hemophilia – Parasitic infection– Metabolic disorder – Infection – Leukemia
– Allergy
Result in one minute
Analysis in an automated blood cell counterBlood sample
– Red blood cells(oxygen supply)
– Platelets(coagulation)
– White blood cells(immune system)

2017-11-08 – BOULE DIAGNOSTICS (4) Copyright © 2013, Boule Medical AB
The Boule offer

2017-11-08 – BOULE DIAGNOSTICS (5) Copyright © 2013, Boule Medical AB
Q3 2017 in summary• Strong quarter with good margins
– Net sales was SEK 109.7 million with a growth of 1.1% compared to the record third quarter of 2016. Adjusted for exchange rates the growth was 2.6%. Growth vs Q2 2017 was 5.2%
– Instrument unit sales grew by 4% to a total of 1,116 (1,071)– In September we shipped 592 instrument, a new record– Strong gross margin at 51.8% and EBIT margin at 25.7%– The quarterly result has been positively affected by SEK 4.5 million for reversed provisions relating to employee bonus and
option programs as well as the shutdown of the Chinese production facility. – Rolling 12 months net sales was SEK 426.4 million (383.3), a growth of 11.2%
• Product launches in the veterinary market– Boule is launching a new generation of hematology instrument together with a new clinical chemistry system – both for the
veterinary market.
• Strategic agreements to strengthen and expand the product portfolio.– Boule has signed a global distribution agreement with CellaVision for their newly developed product for smaller and medium
sized laboratories, starting in 2018– Boule has signed an agreement with Orion Diagnostica Oy to commence sales and distribution of the QuickRead go CRP
system through Boule’s own sales organization in Mexico
• Key events after the quarter– Christina Rubenhag joined Boule as CFO on 9 October– Local production of reagents will start in the important Russian market to boost our growth and profitability– Major tender won in Mexico for hematology systems with a initial value of SEK 3 million– A development project has been started that will lead to the launch of our next generation hematology platform. During the
course of the project the share of capitalized R&D is expected to increase
2017-11-08 – BOULE DIAGNOSTICS (6) Copyright © 2013, Boule Medical AB
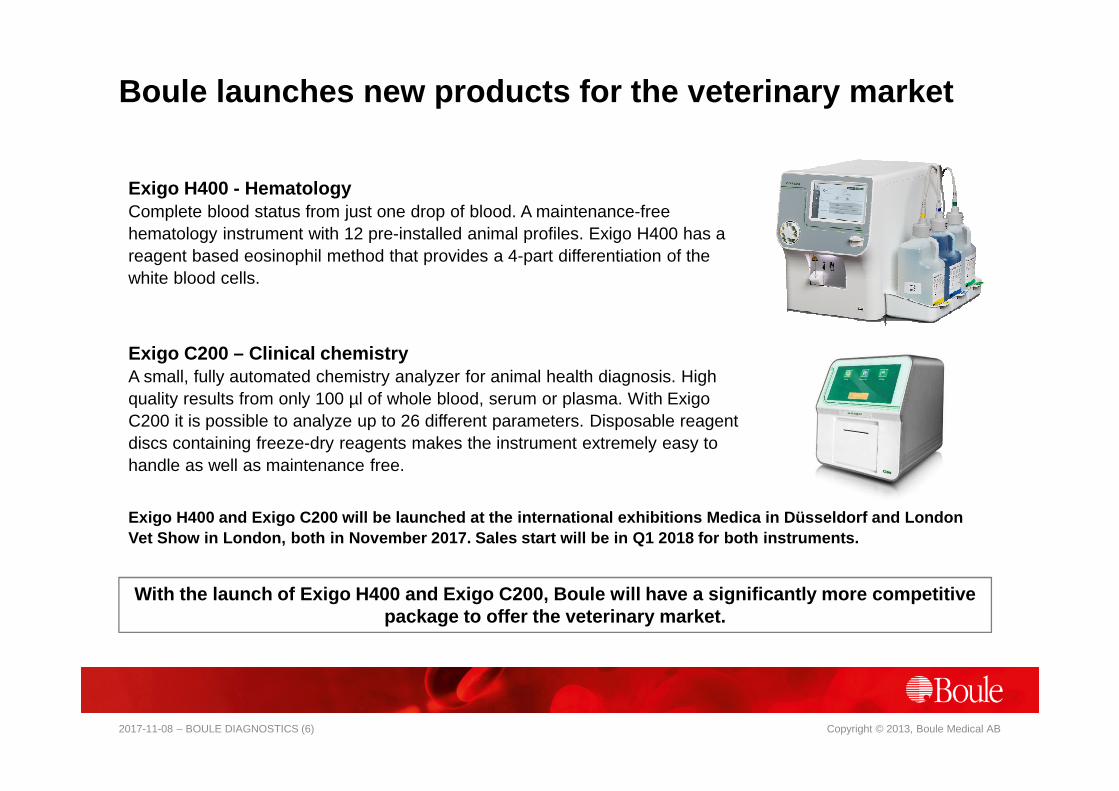
Exigo H400 - HematologyComplete blood status from just one drop of blood. A maintenance-free hematology instrument with 12 pre-installed animal profiles. Exigo H400 has a reagent based eosinophil method that provides a 4-part differentiation of the white blood cells.
Exigo C200 – Clinical chemistryA small, fully automated chemistry analyzer for animal health diagnosis. High quality results from only 100 µl of whole blood, serum or plasma. With Exigo C200 it is possible to analyze up to 26 different parameters. Disposable reagent discs containing freeze-dry reagents makes the instrument extremely easy to handle as well as maintenance free.
Exigo H400 and Exigo C200 will be launched at the i nternational exhibitions Medica in Düsseldorf and Lo ndon Vet Show in London, both in November 2017. Sales st art will be in Q1 2018 for both instruments.
With the launch of Exigo H400 and Exigo C200, Boule will have a significantly more competitive package to offer the veterinary market.
Boule launches new products for the veterinary market

2017-11-08 – BOULE DIAGNOSTICS (7) Copyright © 2013, Boule Medical AB
Q3 revenues growing at 1.1% (2.6% currency adjusted) v s previous record quarter 2016Growth 5.2% compared to Q2 2017
• Growth for the period Jan-Sep 2017 was 8.7%
• Rolling 12 months growth was 11.2%
SEK million
Growth vs.
previous year
-5
0
5
10
15
20
25
30
35
0
20
40
60
80
100
120
Q1 2015 Q2 2015 Q3 2015 Q4 2015 Q1 2016 Q2 2016 Q3 2016 Q4 2016 Q1 2017 Q2 2017 Q3 2017
Net sales and growth
Net sales Growth
2017-11-08 – BOULE DIAGNOSTICS (8) Copyright © 2013, Boule Medical AB
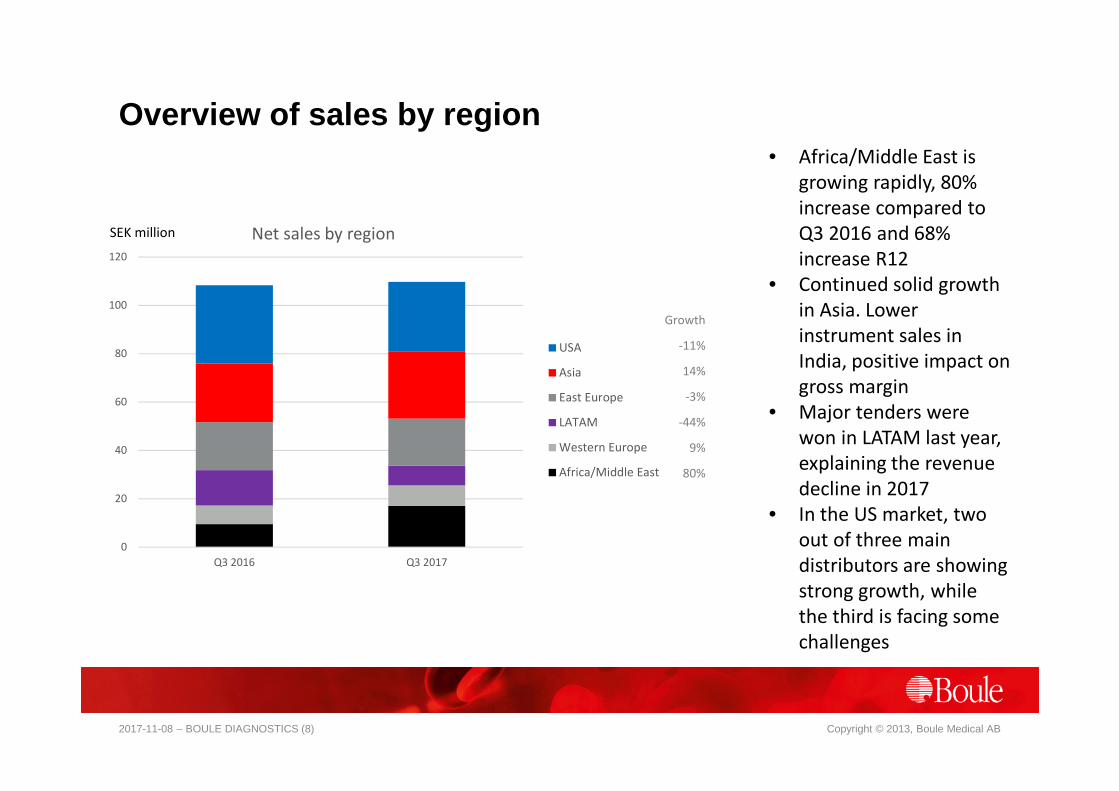
Overview of sales by region
Growth
-11%
14%
-3%
-44%
9%
80%
SEK million
• Africa/Middle East is
growing rapidly, 80%
increase compared to
Q3 2016 and 68%
increase R12
• Continued solid growth
in Asia. Lower
instrument sales in
India, positive impact on
gross margin
• Major tenders were
won in LATAM last year,
explaining the revenue
decline in 2017
• In the US market, two
out of three main
distributors are showing
strong growth, while
the third is facing some
challenges
0
20
40
60
80
100
120
Q3 2016 Q3 2017
Net sales by region
USA
Asia
East Europe
LATAM
Western Europe
Africa/Middle East

2017-11-08 – BOULE DIAGNOSTICS (9) Copyright © 2013, Boule Medical AB
Net sales by region and product
Net sales by regionMSEK
Jul-Sep2017
Jul-Sep2016 Change
Oct 16-Sep 17
(R12)
Oct 15-Sep 16
(R12)Change
(R12)
USA 28.7 32.3 -11% 128.5 122.7 5%
Asia 27.9 24.3 14% 110.3 85.1 30%
Eastern Europe 19.4 19.9 -3% 63.6 52.6 21%
Latin America 8.2 14.6 -44% 29.3 52.9 -45%
Western Europe 8.4 7.7 9% 36.4 35.5 3%
Africa/Middle East 17.1 9.5 80% 58.3 34.6 68%
Total 109.7 108.5 1% 426.3 383.3 11%
Net sales by productMSEK
Jul-Sep2017
Jul-Sep2016 Change
Oct 16-Sep 17
(R12)
Oct 15-Sep 16
(R12)Change
(R12)
Instruments 43.3 42.9 1% 164.8 147.4 12%
Consumables own instruments 43.6 42.1 4% 160.8 145.3 11%
Consumables OEM and CDS-Brand 13.2 15.5 -15% 65.4 58.1 13%
Other 9.6 8.0 15% 35.3 32.5 13%
Total 109.7 108.5 1% 426.3 383.3 11%
2017-11-08 – BOULE DIAGNOSTICS (10) Copyright © 2013, Boule Medical AB
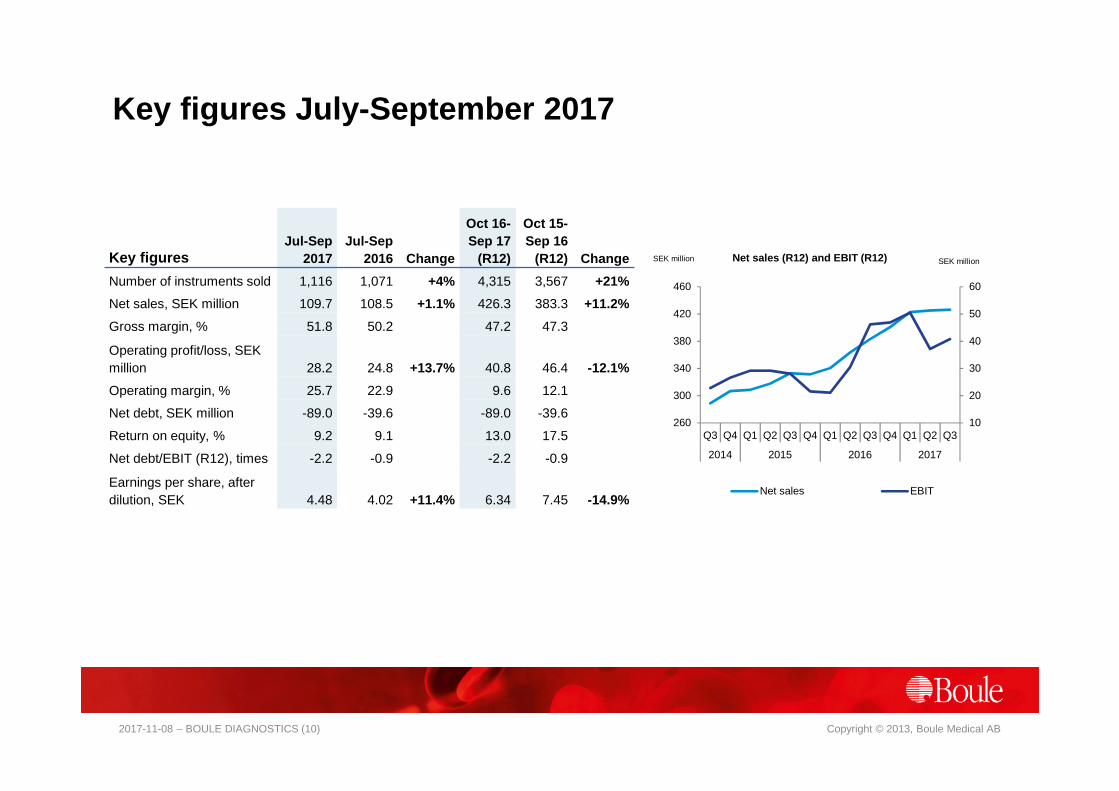
Key figures July-September 2017
Key figuresJul-Sep
2017Jul-Sep
2016 Change
Oct 16-Sep 17
(R12)
Oct 15-Sep 16
(R12) Change
Number of instruments sold 1,116 1,071 +4% 4,315 3,567 +21%
Net sales, SEK million 109.7 108.5 +1.1% 426.3 383.3 +11.2%
Gross margin, % 51.8 50.2 47.2 47.3
Operating profit/loss, SEK million 28.2 24.8 +13.7% 40.8 46.4 -12.1%
Operating margin, % 25.7 22.9 9.6 12.1
Net debt, SEK million -89.0 -39.6 -89.0 -39.6
Return on equity, % 9.2 9.1 13.0 17.5
Net debt/EBIT (R12), times -2.2 -0.9 -2.2 -0.9
Earnings per share, afterdilution, SEK 4.48 4.02 +11.4% 6.34 7.45 -14.9%
10
20
30
40
50
60
260
300
340
380
420
460
Q3 Q4 Q1 Q2 Q3 Q4 Q1 Q2 Q3 Q4 Q1 Q2 Q3
2014 2015 2016 2017
SEK millionSEK million Net sales (R12) and EBIT (R12)
Net sales EBIT
2017-11-08 – BOULE DIAGNOSTICS (11) Copyright © 2013, Boule Medical AB
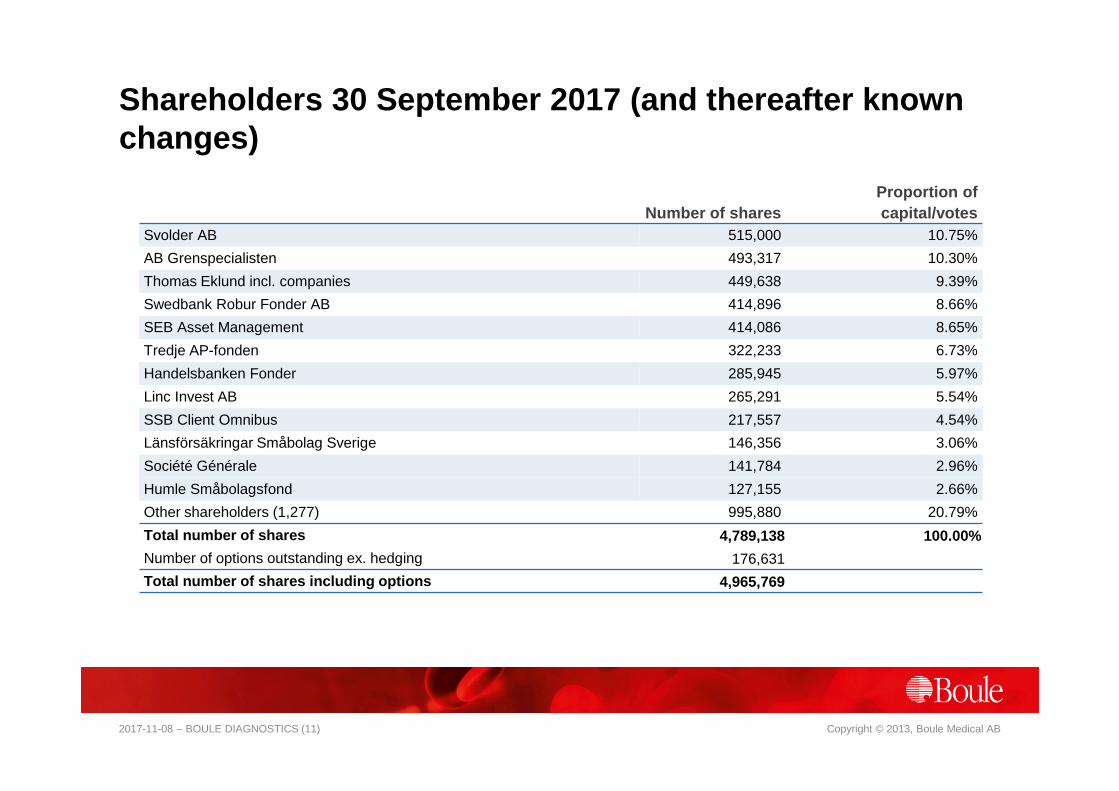
Shareholders 30 September 2017 (and thereafter knownchanges)
Number of sharesProportion ofcapital/votes
Svolder AB 515,000 10.75%
AB Grenspecialisten 493,317 10.30%
Thomas Eklund incl. companies 449,638 9.39%
Swedbank Robur Fonder AB 414,896 8.66%
SEB Asset Management 414,086 8.65%
Tredje AP-fonden 322,233 6.73%
Handelsbanken Fonder 285,945 5.97%
Linc Invest AB 265,291 5.54%
SSB Client Omnibus 217,557 4.54%
Länsförsäkringar Småbolag Sverige 146,356 3.06%
Société Générale 141,784 2.96%
Humle Småbolagsfond 127,155 2.66%
Other shareholders (1,277) 995,880 20.79%
Total number of shares 4,789,138 100.00%
Number of options outstanding ex. hedging 176,631
Total number of shares including options 4,965,769
2017-11-08 – BOULE DIAGNOSTICS (12) Copyright © 2013, Boule Medical AB
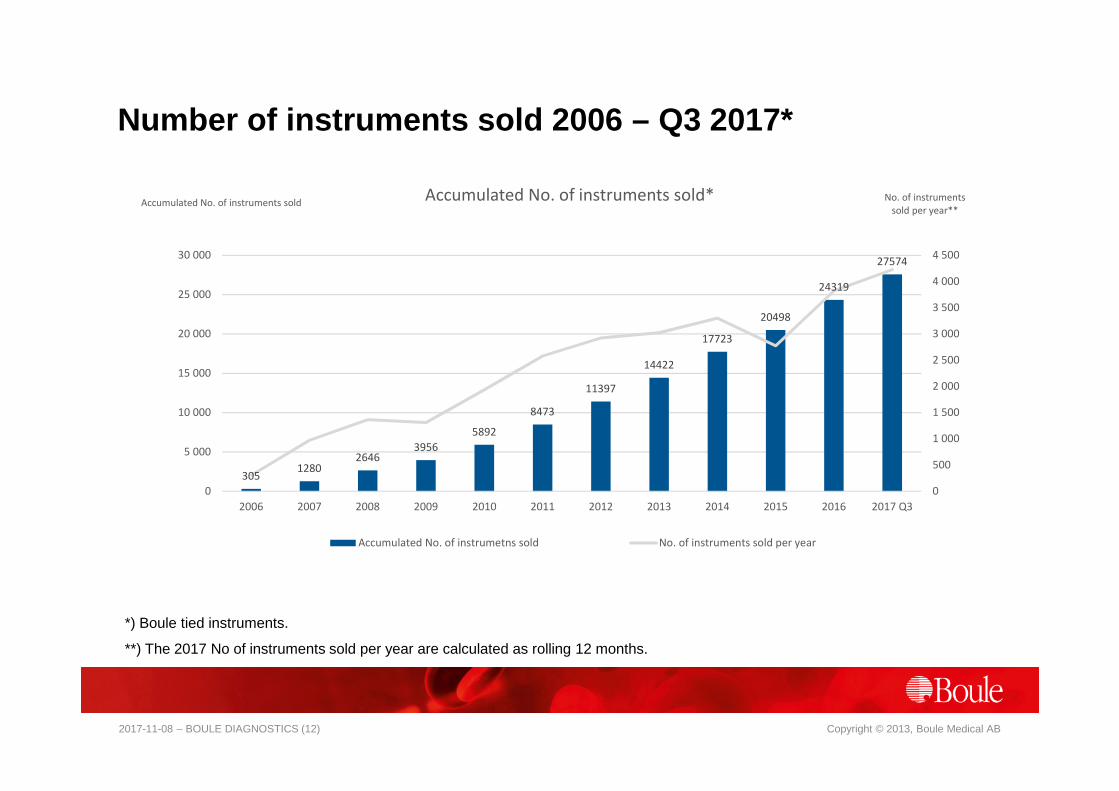
Number of instruments sold 2006 – Q3 2017*
*) Boule tied instruments.
**) The 2017 No of instruments sold per year are calculated as rolling 12 months.
3051280
26463956
5892
8473
11397
14422
17723
20498
24319
27574
0
500
1 000
1 500
2 000
2 500
3 000
3 500
4 000
4 500
0
5 000
10 000
15 000
20 000
25 000
30 000
2006 2007 2008 2009 2010 2011 2012 2013 2014 2015 2016 2017 Q3
No. of instruments
sold per year**Accumulated No. of instruments sold
Accumulated No. of instruments sold*
Accumulated No. of instrumetns sold No. of instruments sold per year
2017-11-08 – BOULE DIAGNOSTICS (13) Copyright © 2013, Boule Medical AB
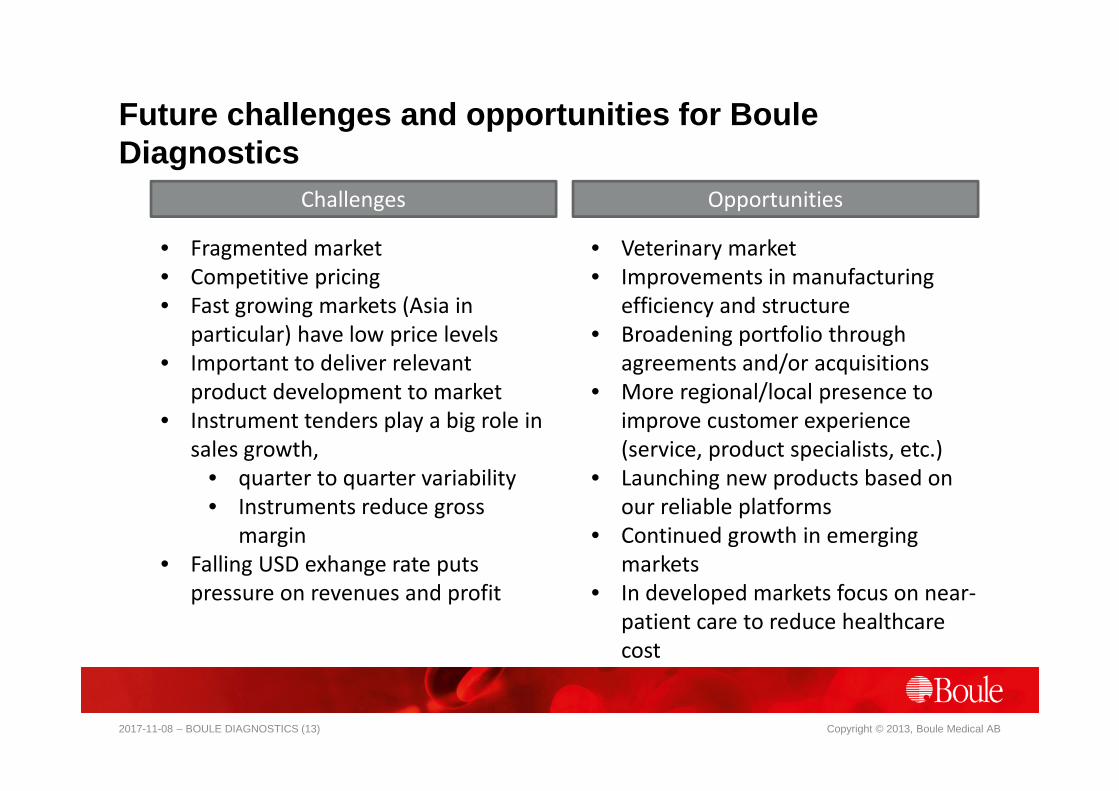
Future challenges and opportunities for Boule Diagnostics
Challenges Opportunities
• Fragmented market
• Competitive pricing
• Fast growing markets (Asia in
particular) have low price levels
• Important to deliver relevant
product development to market
• Instrument tenders play a big role in
sales growth,
• quarter to quarter variability
• Instruments reduce gross
margin
• Falling USD exhange rate puts
pressure on revenues and profit
• Veterinary market
• Improvements in manufacturing
efficiency and structure
• Broadening portfolio through
agreements and/or acquisitions
• More regional/local presence to
improve customer experience
(service, product specialists, etc.)
• Launching new products based on
our reliable platforms
• Continued growth in emerging
markets
• In developed markets focus on near-
patient care to reduce healthcare
cost

2017-11-08 – BOULE DIAGNOSTICS (14) Copyright © 2013, Boule Medical AB
Our priorities are clear
1. Further measures to support and strengthen the company's sales and profitability growth.
2. To continue to improve current products and develop new ones.
3. To strengthen and expand our product portfolio via distribution agreements, OEM contracts and possible acquisitions.
In parallel we will continue our process efficiency programs and assess how our manufacturing structure can be optimized, as well as maintaining high levels of quality and regulatory compliance.
2017-11-08 – BOULE DIAGNOSTICS (15) Copyright © 2013, Boule Medical AB
Thank you!