Embed Size (px)
Citation preview

I 1 I

I 2 I
BARCLAYS
GLOBAL CONSUMER
STAPLES CONFERENCE
Emmanuel Faber, CEO
September 6, 2017
I 3 I
• This document contains certain forward-looking statements concerning Danone. In some cases, you can identify these forward-looking statements by forward-looking words, such as “estimate,” “expect,” “anticipate,” “project,” “plan,” “intend,” “believe,” “forecast,” “foresee,” “likely,” “may,” “should,” “goal,” “target,” “might,” “will,” “could,” “predict,” “continue,” “convinced”, and “confident”, the negative or plural of these words and other comparable terminology.
• Although Danone believes its expectations are based on reasonable assumptions, these forward-looking statements are subject to numerous risks and uncertainties, which could cause actual results to differ materially from those anticipated in these forward-looking statements. For a detailed description of these risks and uncertainties, please refer to the section “Risk Factors” in Danone’s Registration Document (the current version of which is available on www.danone.com).
• Subject to regulatory requirements, Danone does not undertake to publicly update or revise any of these forward-
looking statements. This document does not constitute an offer to sell, or a solicitation of an offer to buy DANONE shares.
• All references in this presentation to like-for-like changes, recurring operating income, recurring operating margin, recurring net income, recurring income tax rate, recurring EPS, free cash-flow, free cash-flow excluding exceptional items, and net financial debt correspond to financial indicators not defined by IFRS used by Danone, which are defined at the end of this presentation.
• Due to rounding, the sum of values presented in this document may differ from totals as reported. Such differences are not material.
I 4 I
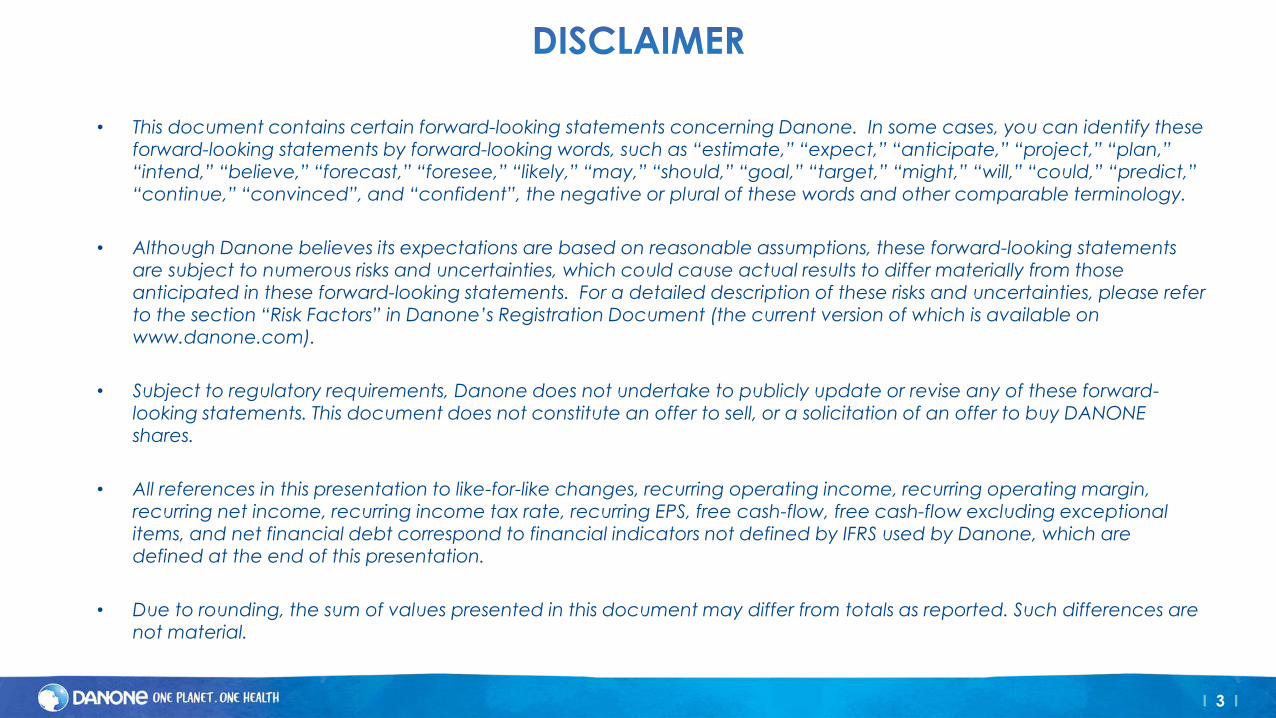
• New Governance • New Comex team
2014 2016 2015 2017 2020…
2014 – 2016
Deliver start of transformation
2017 – 2020
Accelerated transformation agenda
Nutrition, agricultural policy
I 5 I
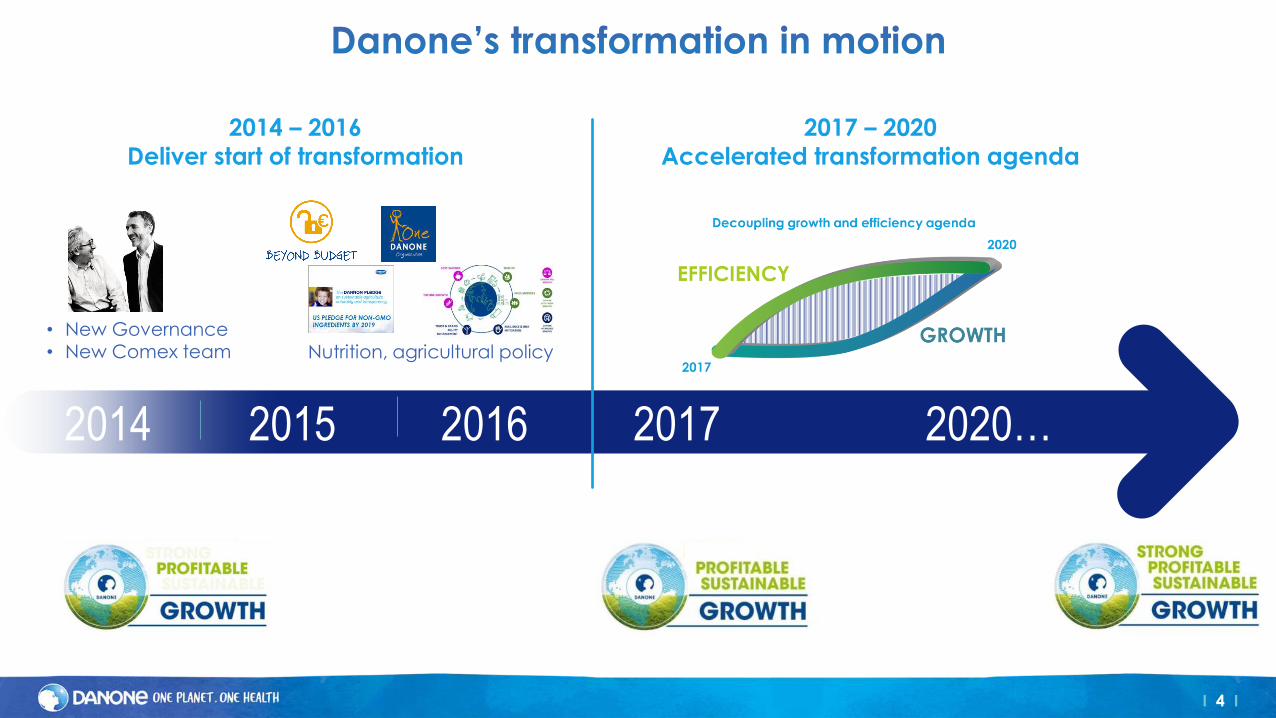
+4.7%
2014
+4.4%
2015
+2.9%
2016
12.6% 12.9%
13.8%
2014 2015 2016
€2.62 €2.93
€3.10
2014 2015 2016
Like-for-like sales growth
Sustained improvement in
recurring operating margin
Consistent recurring
EPS growth
+4.0%
2014-16
+8.8%
GROWTH PROFIT
CONSISTENCY AGILITY
2014-16
CAGR
2014-16
CAGR
cumulative +120bps
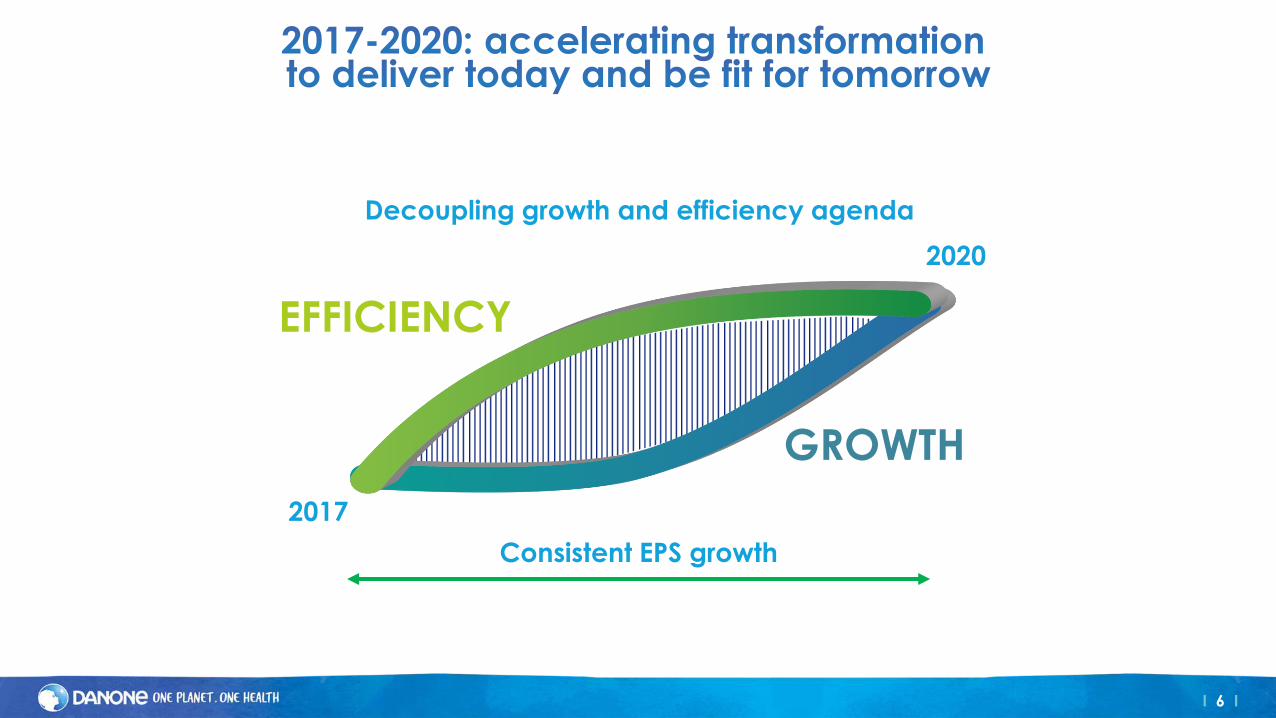
I 6 I
2017
GROWTH
2020
EFFICIENCY
Decoupling growth and efficiency agenda
Consistent EPS growth
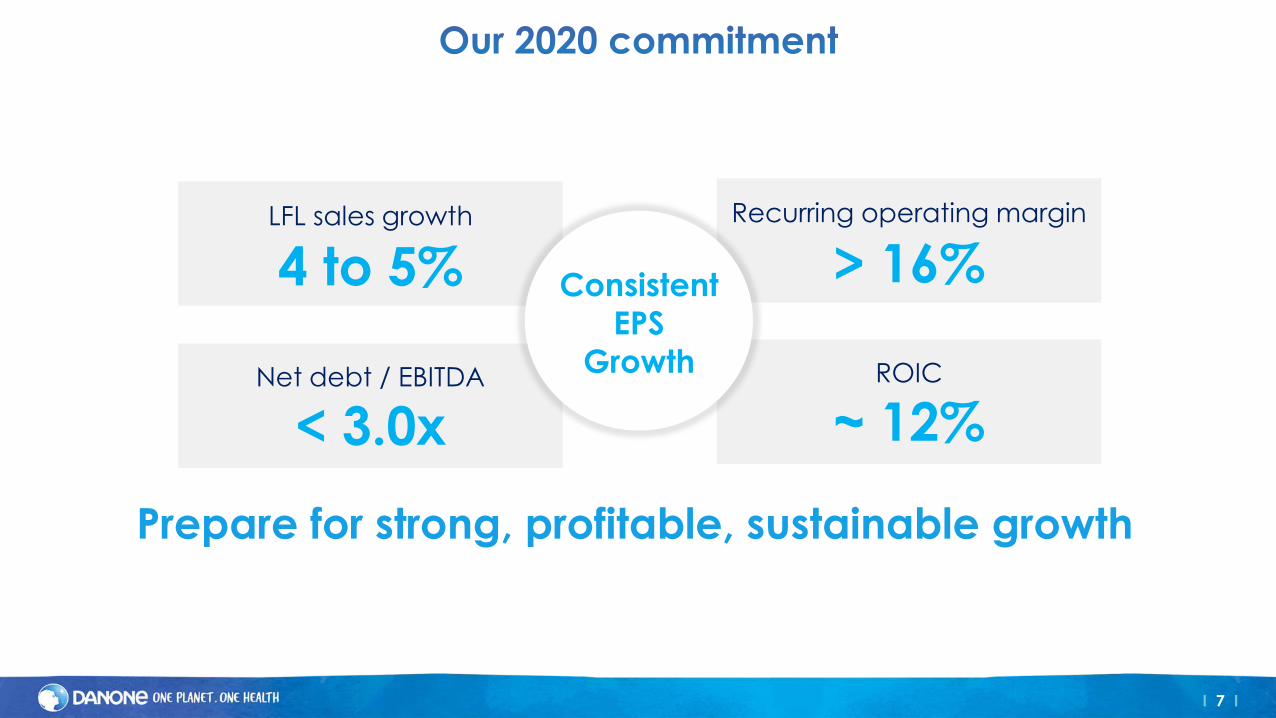
I 7 I
< 3.0x Net debt / EBITDA
LFL sales growth
4 to 5% Recurring operating margin
> 16%
ROIC
~ 12%
Consistent
EPS
Growth
Prepare for strong, profitable, sustainable growth
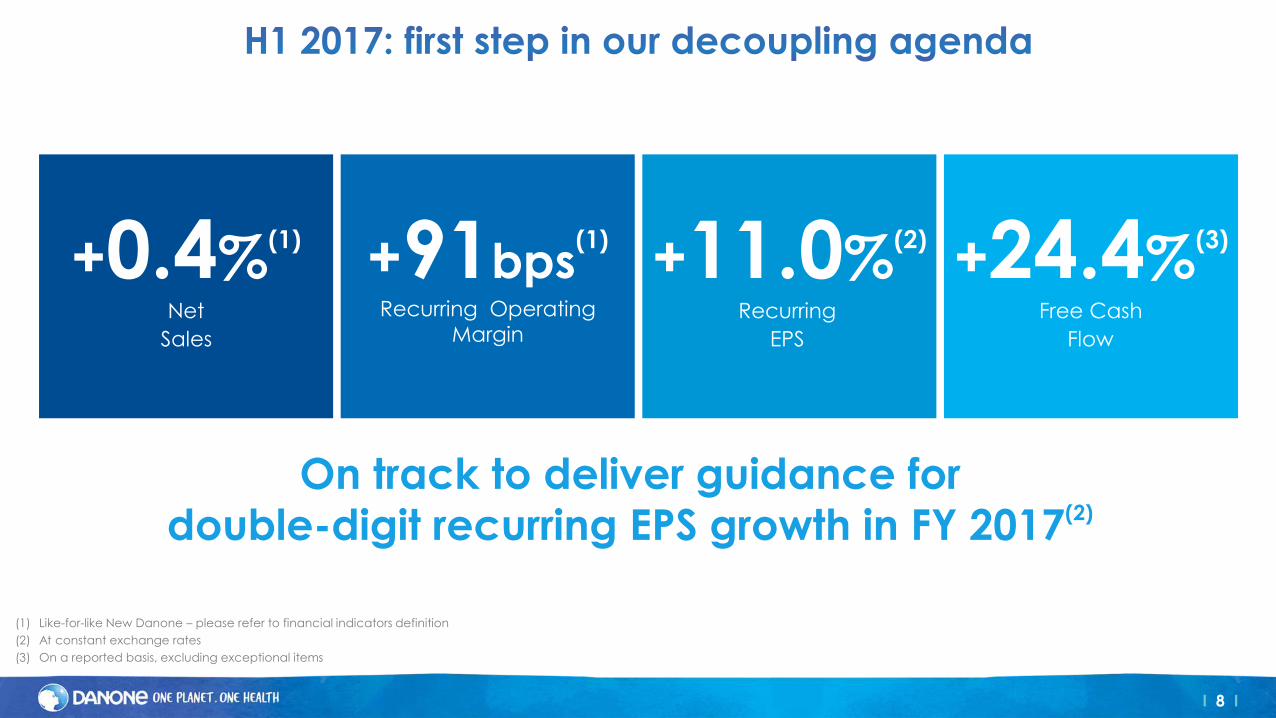
I 8 I
+0.4%(1)
Net
Sales
+91bps(1)
Recurring Operating
Margin
+11.0%(2)
Recurring
EPS
+24.4%(3)
Free Cash
Flow
(1) Like-for-like New Danone – please refer to financial indicators definition
(2) At constant exchange rates
(3) On a reported basis, excluding exceptional items
On track to deliver guidance for
double-digit recurring EPS growth in FY 2017(2)
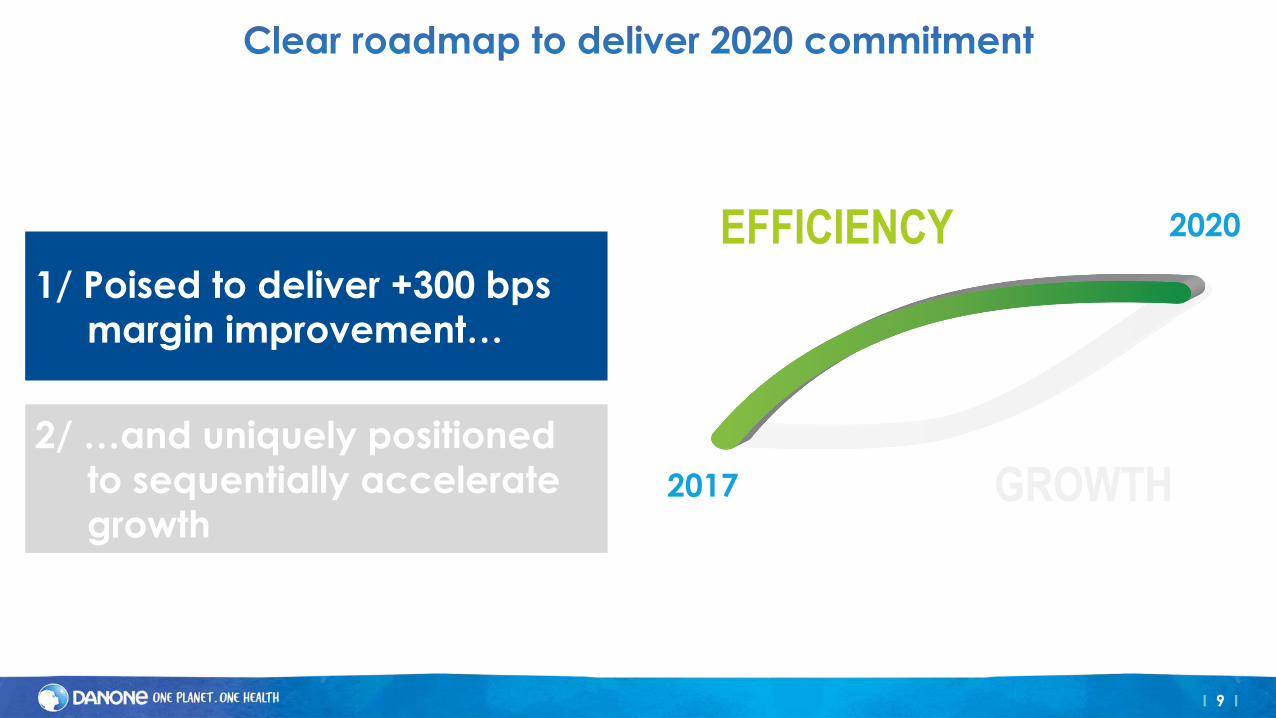
I 9 I
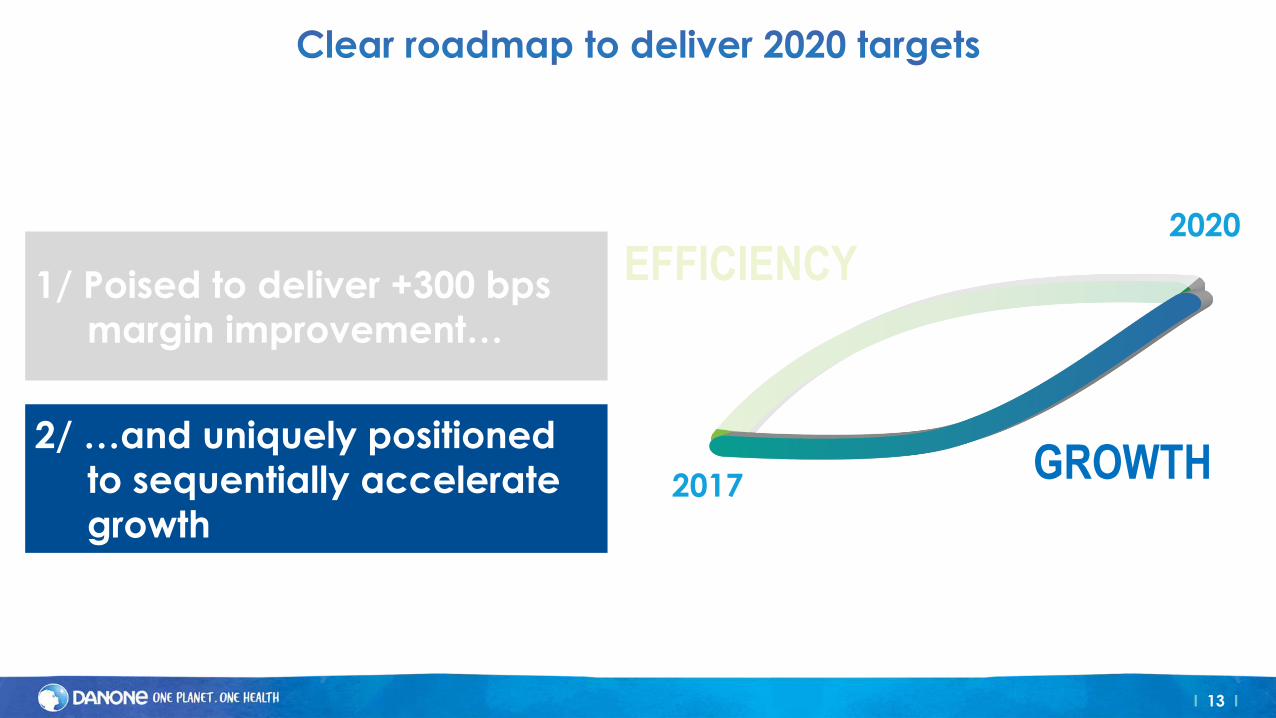
EFFICIENCY 2020
GROWTH 2017
1/ Poised to deliver +300 bps
margin improvement…
2/ …and uniquely positioned
to sequentially accelerate
growth
I 10 I
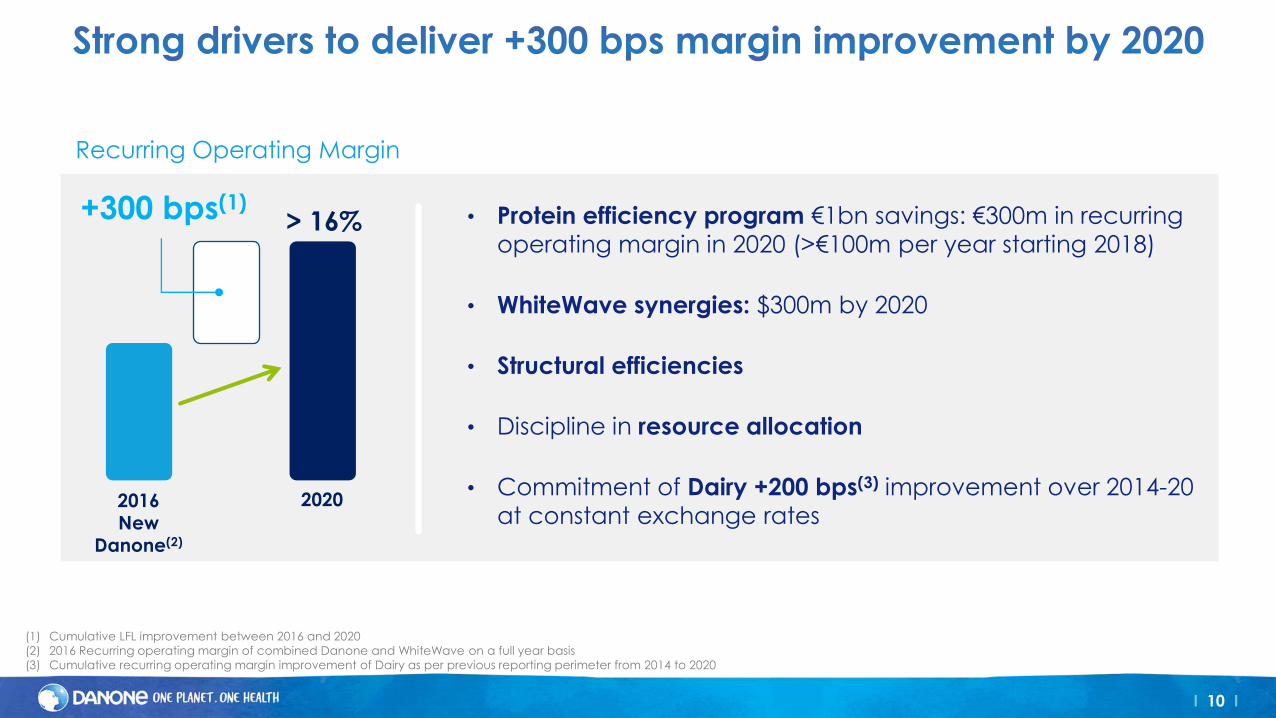
> 16%
2020
+300 bps(1)
2016 New
Danone(2)
(1) Cumulative LFL improvement between 2016 and 2020
(2) 2016 Recurring operating margin of combined Danone and WhiteWave on a full year basis
(3) Cumulative recurring operating margin improvement of Dairy as per previous reporting perimeter from 2014 to 2020
• Protein efficiency program €1bn savings: €300m in recurring
operating margin in 2020 (>€100m per year starting 2018)
• WhiteWave synergies: $300m by 2020
• Structural efficiencies
• Discipline in resource allocation
• Commitment of Dairy +200 bps(3) improvement over 2014-20
at constant exchange rates
Recurring Operating Margin
I 11 I
I 12 I
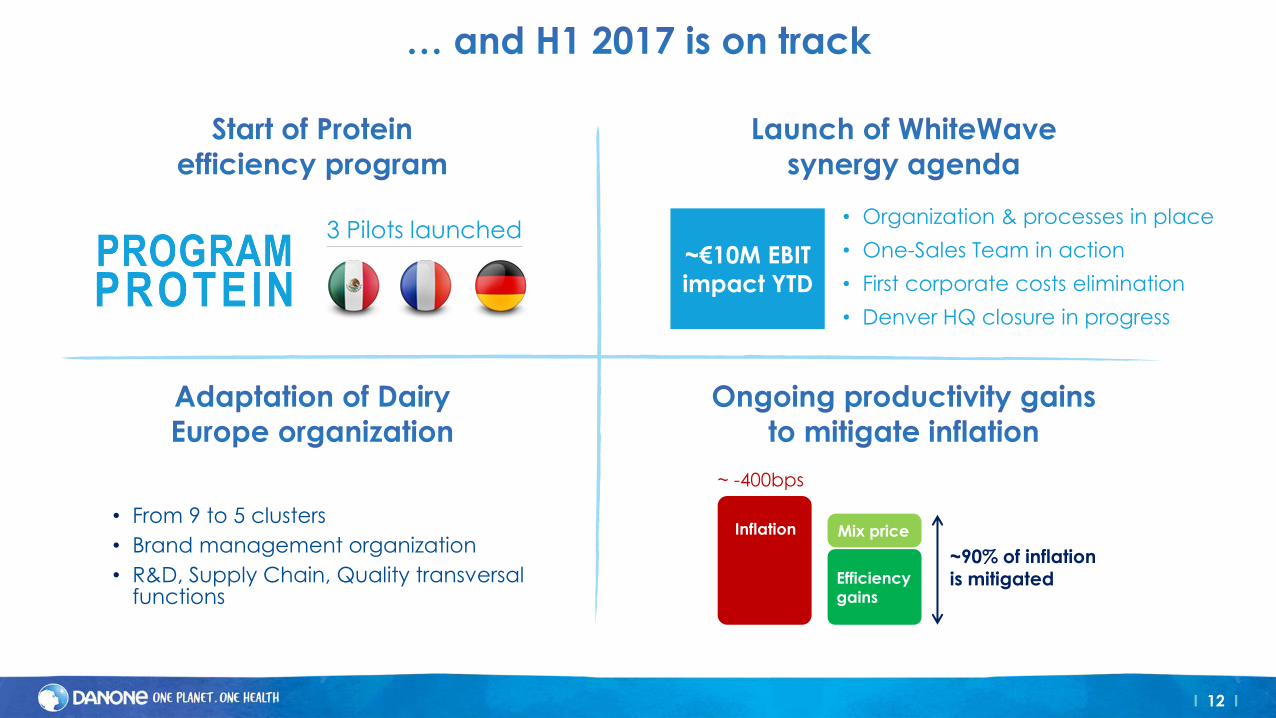
3 Pilots launched
• From 9 to 5 clusters
• Brand management organization
• R&D, Supply Chain, Quality transversal functions
• Organization & processes in place
• One-Sales Team in action
• First corporate costs elimination
• Denver HQ closure in progress
~€10M EBIT
impact YTD
Inflation
Efficiency
gains
Mix price
~ -400bps
~90% of inflation is mitigated
I 13 I
EFFICIENCY
2017 GROWTH
2020
1/ Poised to deliver +300 bps
margin improvement…
2/ …and uniquely positioned
to sequentially accelerate
growth
I 14 I
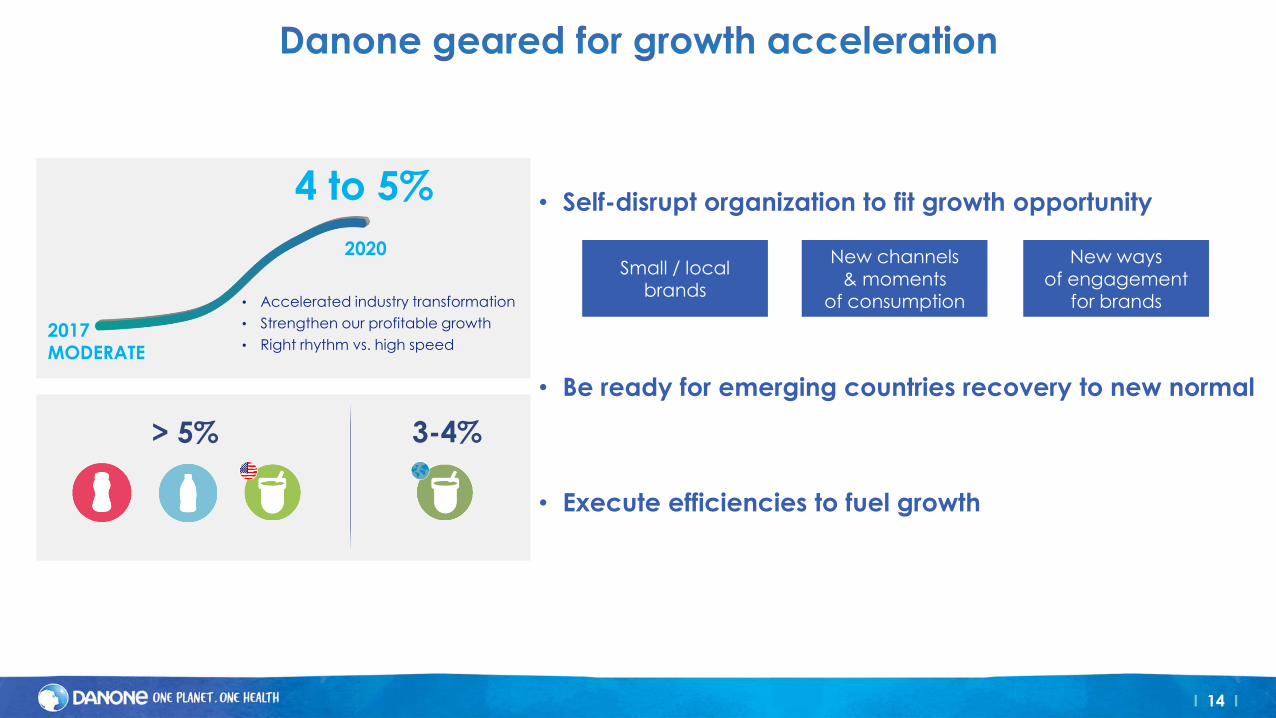
• Accelerated industry transformation
• Strengthen our profitable growth
• Right rhythm vs. high speed
4 to 5%
2017 MODERATE
> 5% 3-4%
2020
• Self-disrupt organization to fit growth opportunity
• Be ready for emerging countries recovery to new normal
• Execute efficiencies to fuel growth
Small / local brands
New channels & moments
of consumption
New ways of engagement
for brands
I 15 I
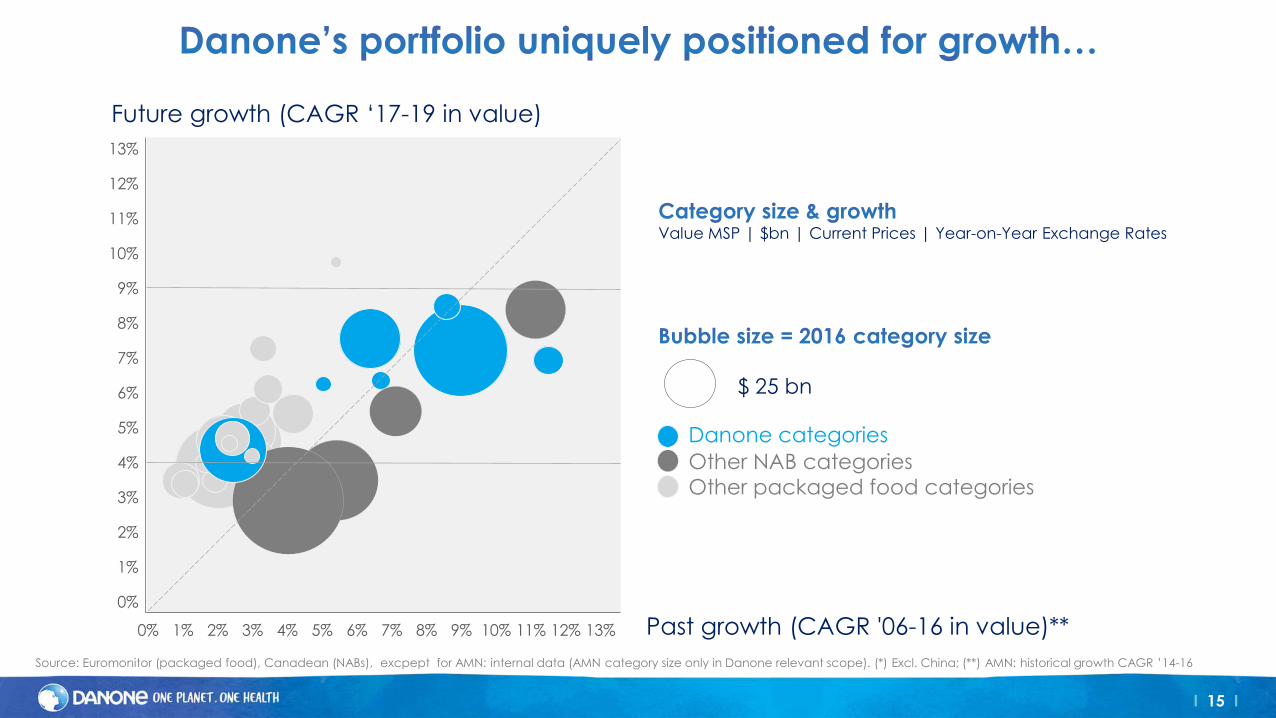
Source: Euromonitor (packaged food), Canadean (NABs), excpept for AMN: internal data (AMN category size only in Danone relevant scope). (*) Excl. China; (**) AMN: historical growth CAGR ’14-16
Past growth (CAGR '06-16 in value)**
Future growth (CAGR ‘17-19 in value)
13%
12%
11%
10%
9%
8%
7%
6%
5%
4%
3%
2%
1%
0%
13% 12% 11% 10% 9% 8% 7% 6% 5% 4% 3% 2% 1% 0%
Other packaged food categories
Danone categories
Other NAB categories
$ 25 bn
Value MSP | $bn | Current Prices | Year-on-Year Exchange Rates
I 16 I
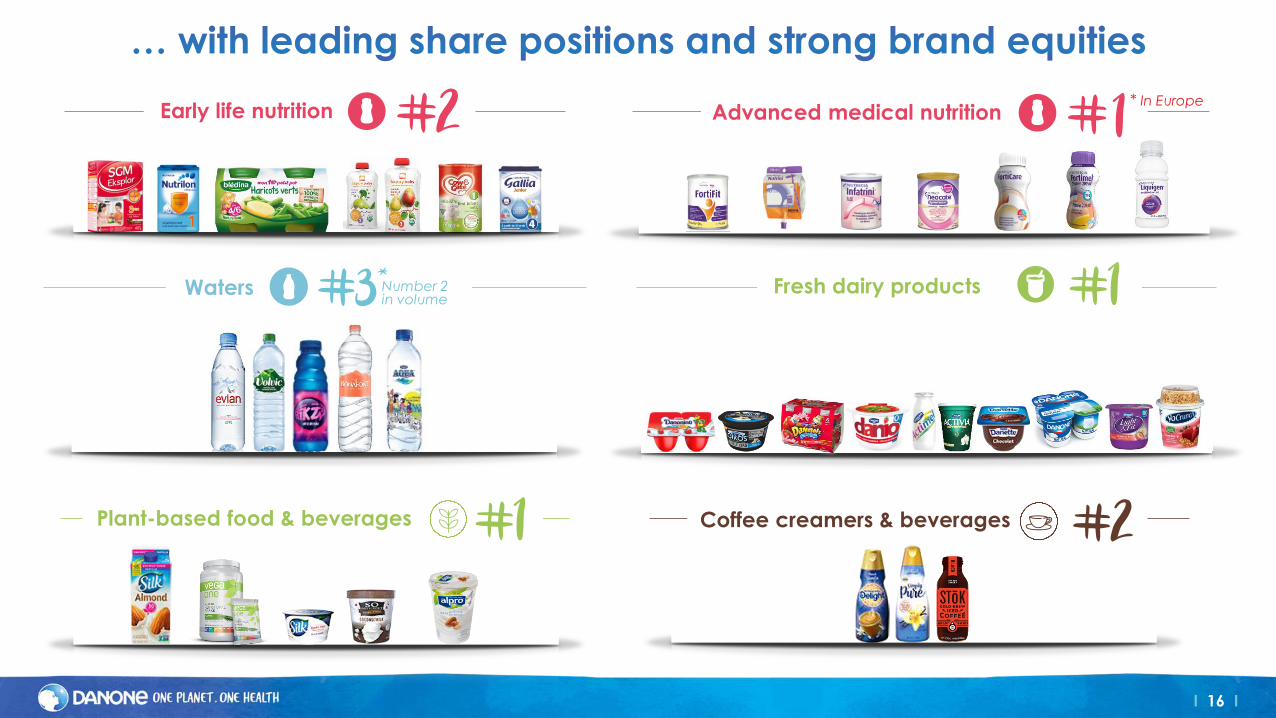
Coffee creamers & beverages Plant-based food & beverages
Number 2 in volume
Waters
Early life nutrition
Fresh dairy products
Advanced medical nutrition * In Europe
I 17 I
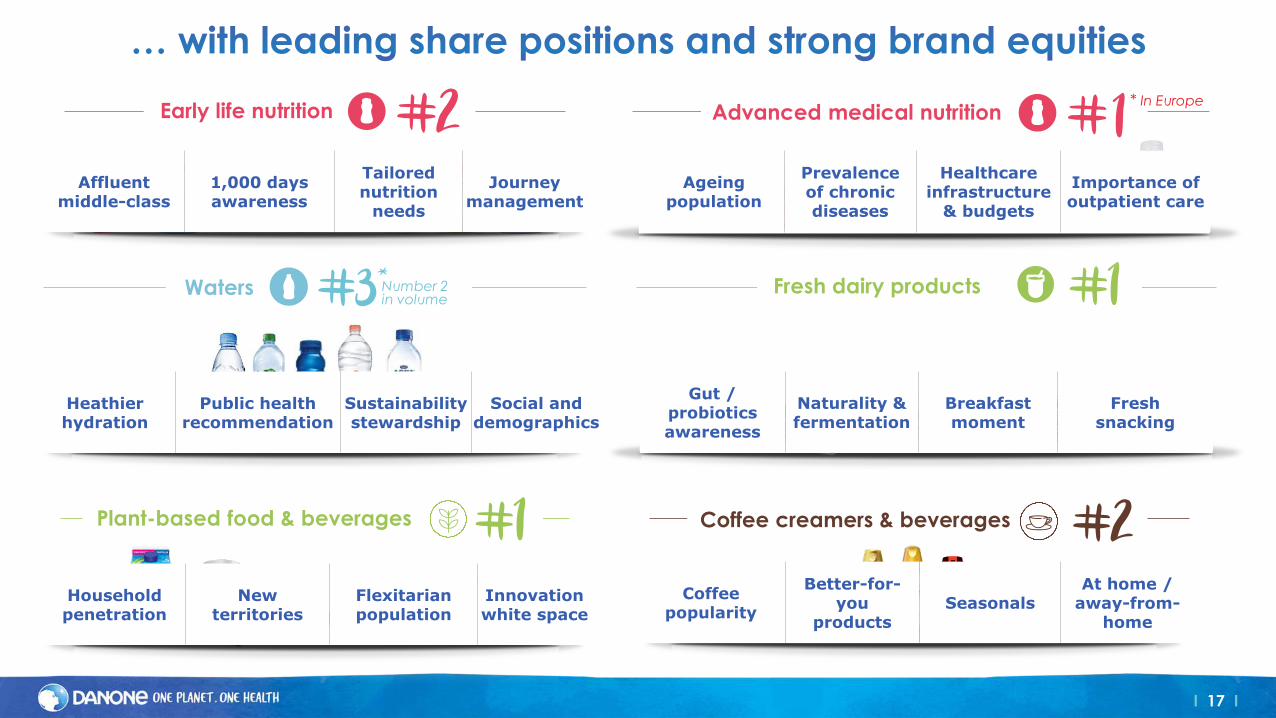
Coffee creamers & beverages Plant-based food & beverages
Number 2 in volume
Waters
Early life nutrition
Affluent middle-class
1,000 days awareness
Tailored nutrition
needs
Journey management
Heathier hydration
Public health recommendation
Sustainability stewardship
Social and demographics
Fresh dairy products
Gut / probiotics awareness
Naturality & fermentation
Breakfast moment
Fresh snacking
Household penetration
New territories
Flexitarian population
Innovation white space
Coffee popularity
Better-for-you
products Seasonals
At home / away-from-
home
Advanced medical nutrition
Ageing population
Prevalence of chronic diseases
Healthcare infrastructure
& budgets
Importance of outpatient care
* In Europe
I 18 I
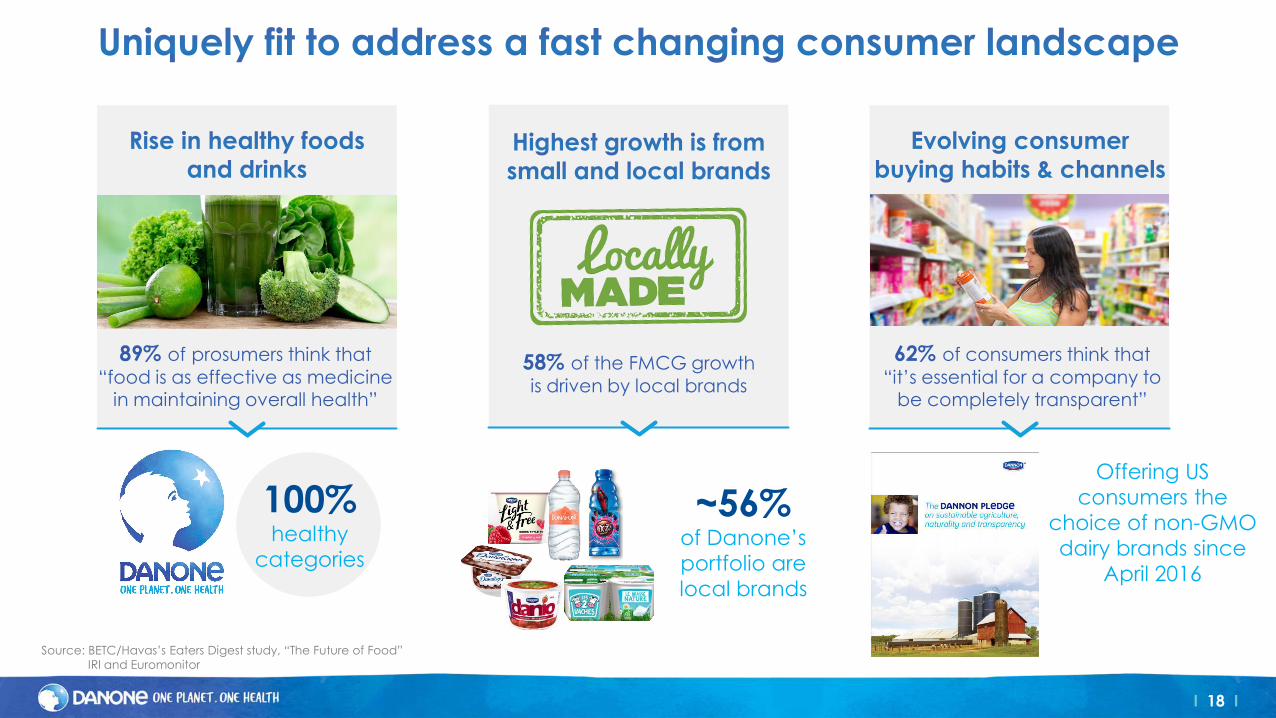
89% of prosumers think that
“food is as effective as medicine
in maintaining overall health”
Source: BETC/Havas’s Eaters Digest study, “The Future of Food”
IRI and Euromonitor
100% healthy
categories
RUSSIA - BELARUS - KAZAKH
~56% of Danone’s
portfolio are
local brands
58% of the FMCG growth
is driven by local brands
62% of consumers think that
“it’s essential for a company to
be completely transparent”
Offering US
consumers the
choice of non-GMO
dairy brands since
April 2016
I 19 I
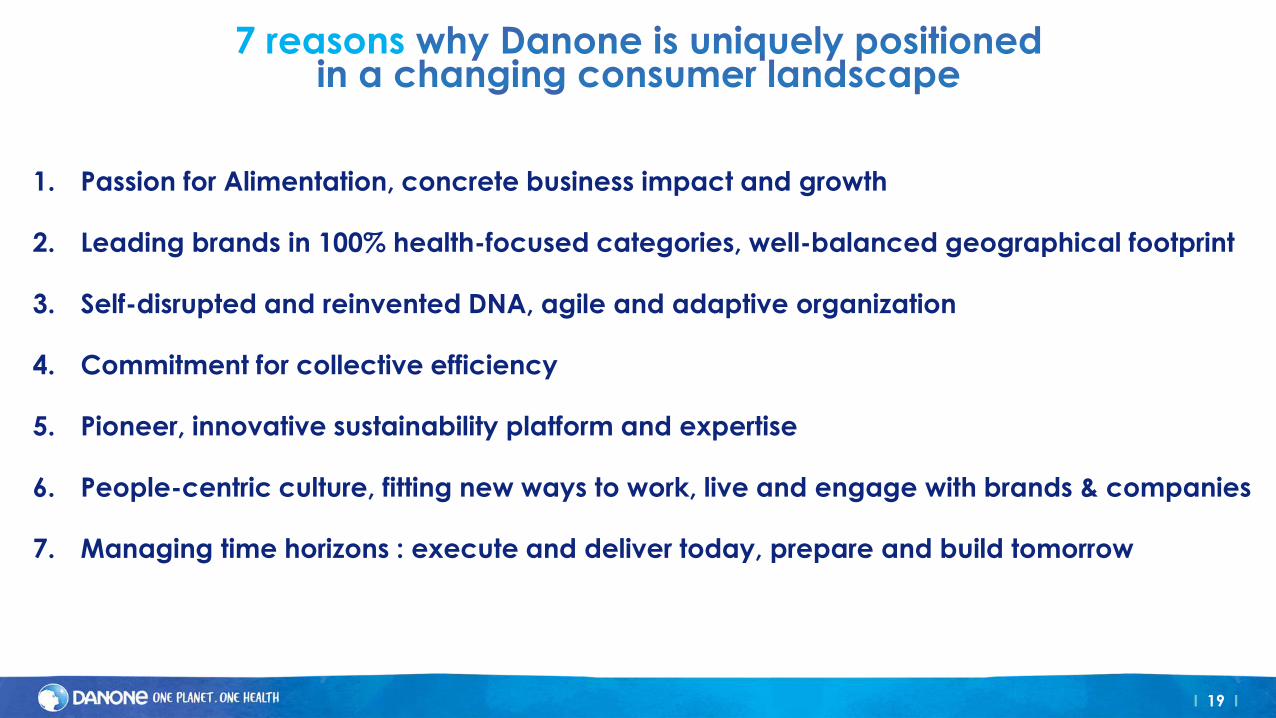
7 reasons
1. Passion for Alimentation, concrete business impact and growth
2. Leading brands in 100% health-focused categories, well-balanced geographical footprint
3. Self-disrupted and reinvented DNA, agile and adaptive organization
4. Commitment for collective efficiency
5. Pioneer, innovative sustainability platform and expertise
6. People-centric culture, fitting new ways to work, live and engage with brands & companies
7. Managing time horizons : execute and deliver today, prepare and build tomorrow
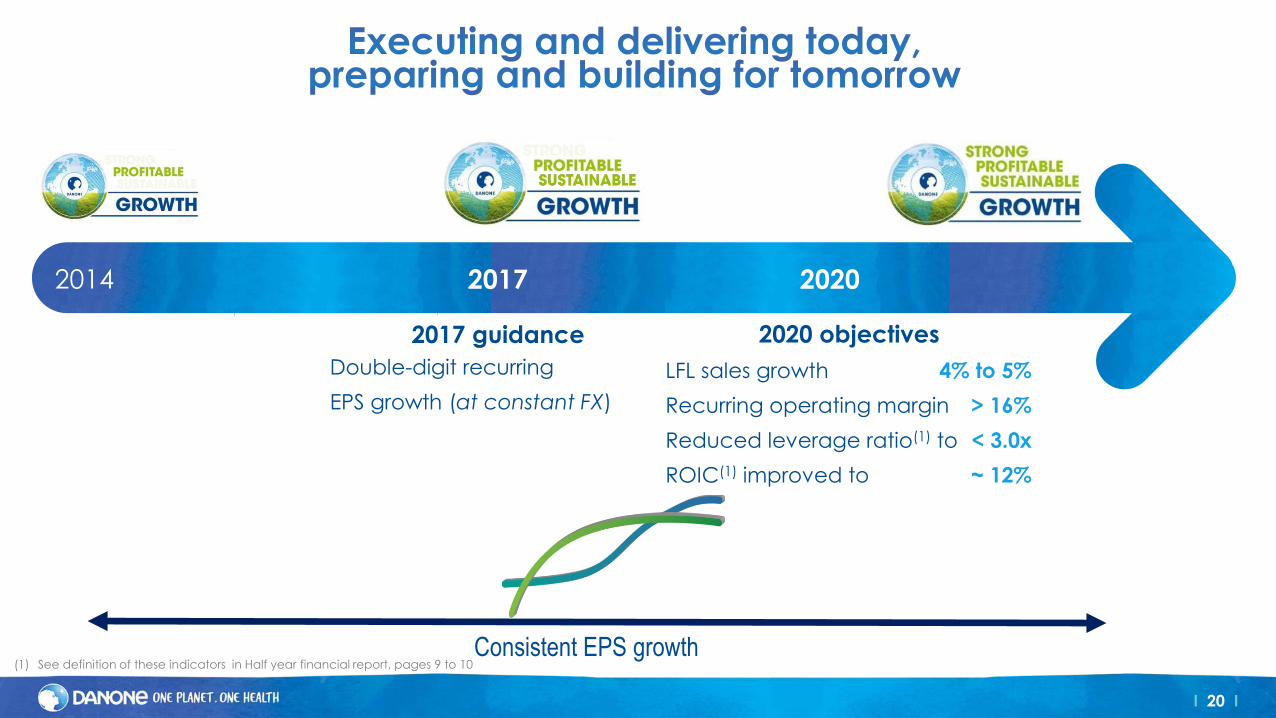
I 20 I
2017 2015 2016 2020 2014
2017 guidance
Double-digit recurring
EPS growth (at constant FX)
Consistent EPS growth
2017
2020 objectives
LFL sales growth 4% to 5%
Recurring operating margin > 16%
Reduced leverage ratio(1) to < 3.0x
ROIC(1) improved to ~ 12%
(1) See definition of these indicators in Half year financial report, pages 9 to 10

I 21 I
APPENDIX
I 22 I
Additional indicator of like-for-like changes: “like-for-like New Danone” changes
Since completion of WhiteWave acquisition, WhiteWave and Danone’s activities have been combined and are generating synergies. Separate reporting of WhiteWave and Danone in their pre-acquisition forms thus no longer reflects their real performance. In consequence, Danone has decided to monitor and then report its performance by integrating the contribution of WhiteWave as a whole to its organic growth from the time of the acquisition by using an additional indicator - “like-for-like New Danone” changes.
This indicator is a variation on the ”like-for-like” changes indicator used by Danone, such variation integrating WhiteWave’s performance starting at the date of acquisition:
• for periods in previous years compared, and
• based on WhiteWave reported data after restatement to allow comparison with Danone data.
This indicator is used starting with the second quarter of 2017 and running through the end of 2018.
Danone does not publish like-for-like New Danone changes for prior periods given the way they are computed. Finally, Danone does not monitor internally nor publish like-for-like changes and will not do so until year-end 2018. Like-for-like changes would not reflect accurately the Company’s real performance, which is reflected in like-for-like New Danone changes and, by extension, the difference between like-for-like changes and like-for-like New Danone changes would not accurately reflect the contribution of WhiteWave and its companies to the real performance.
These indicators are calculated as follows:
Like-for-like changes in sales and recurring operating margin reflect Danone's organic performance and essentially exclude the impact of:
• changes in consolidation scope, with indicators related to a given fiscal year calculated on the basis of previous-year scope;
• changes in applicable accounting principles;
• changes in exchange rates, (i) with both previous-year and current-year indicators calculated using the same exchange rates (the exchange rate used is a projected annual rate determined by Danone for the current year and applied to both previous and current year), and (ii) correcting differences caused by the exceptional volatility of inflation in countries that are structurally subject to hyperinflation, which would otherwise distort any interpretation of Danone's organic performance.
I 23 I
Since inflation in Argentina—already structurally high—accelerated further in 2014, in particular following the sharp, steep devaluation of the peso in January, using an identical exchange rate to compare 2014 figures with those for the prior year did not accurately reflect Danone's organic performance in that country.
As a result, the Company fine-tuned the definition of like-for-like changes to include in its exchange-rate impact the differences caused by the exceptional volatility in structurally hyperinflationary countries.
Danone is applying this methodology, which is applicable only to Argentina, starting from the release of 2014 full-year results. Danone is closely following the economic and monetary situation in Argentina and the volatility of the country’s inflation.
This methodology leads to (i) limiting the inflation of price and cost of goods sold per kilo to their average level over three years and (ii) capping Recurring operating margin at its prior-year level; this methodology has been applied to each division operating in Argentina. With respect to 2014, adjustment for the full year was recorded in the fourth quarter of 2014.
“Like-for-like New Danone” changes (or “Like-for-like including WhiteWave starting April 2017” changes) in sales and recurring operating margin reflect the organic performance of Danone and WhiteWave combined. This indicator corresponds to like-for-like changes for Danone and WhiteWave combined, considering the activity of WhiteWave as a whole by integrating its companies during the fiscal years prior to and following their acquisition in April 2017:
• from April 1 to December 31 for periods compared until 2017 included;
• from January 1 to December 31 for periods compared in 2018.
WhiteWave Base effect corresponds primarily to the contribution of WhiteWave over the period from April 1 to June 30, 2016 and to adjustments for the impact of using different reference periods for H1 2017 reported and for H1 2017 like-for-like New Danone data. The contribution of WhiteWave and its companies for the period from April 1-12, 2017 must be deducted as it is effectively included in the like-for-like New Danone changes and excluded from reported data.
I 24 I
Recurring operating income is defined as Danone’s operating income excluding Other operating income and expenses. Other operating income and expenses is defined under Recommendation 2013-03 of the French ANC (format of consolidated financial statements for companies reporting under international reporting standards), and comprises significant items that, because of their exceptional nature, cannot be viewed as inherent to its recurring activities. These mainly include capital gains and losses on disposals of fully consolidated companies, impairment charges on goodwill, significant costs related to strategic restructuring and major external growth transactions, and costs related to major crisis and major litigations. Furthermore, in connection with IFRS 3 (Revised) and IAS 27 (Revised) relating to business combinations, the Company also classifies in Other operating income and expenses (i) acquisition costs related to business combinations, (ii) revaluation profit or loss accounted for following a loss of control, (iii) changes in earn-outs relating to business combinations and subsequent to acquisition date.
Recurring operating margin is defined as Recurring operating income over Sales ratio.
Non-recurring results from associates include significant items that, because of their exceptional nature, cannot be viewed as inherent to the recurring activity of those companies and distort the reading of their performance. They include primarily (i) capital gains and losses on disposal and impairment of Investments in associates, and (ii) when material, non-recurring items as defined by Danone included in the net income from associates.
Recurring net income (or Recurring net income – Group Share) corresponds to the Group share in the consolidated recurring net income. The recurring net income measures Danone’s recurring performance and excludes significant items that, because of their exceptional nature, cannot be viewed as inherent to its recurring performance. Such non-recurring income and expenses mainly include other income and expenses, non-recurring results from associates, capital gains and losses on disposals and impairments of Other non-fully-consolidated entities and tax income and expenses related to non-recurring income and expenses. Such income and expenses excluded from Net income are defined as Non-recurring net income and expenses.
Recurring income tax rate measures the income tax rate related to Danone’s recurring performance and corresponds to the ratio Tax income and expenses related to recurring income and expenses over Total Recurring net income.
Recurring EPS (or Recurring net income – Group Share, per share after dilution) is defined as Recurring net income over Diluted number of shares ratio.
Free cash-flow represents cash-flows provided or used by operating activities less capital expenditure net of disposals and, in connection with IFRS 3 (Revised), relating to business combinations, excluding (i) acquisition costs related to business combinations, and (ii) earn-outs related to business combinations and paid subsequently to acquisition date.
Free cash-flow excluding exceptional items represents free cash-flow before cash-flows related to initiatives deployed within the framework of the plan to generate savings and adapt Danone’s organization in Europe.
Net financial debt represents the net debt portion bearing interest. It corresponds to current and non-current financial debt (i) excluding Liabilities related to put options granted to non-controlling interests and (ii) net of Cash and cash equivalents, Short term investments and Derivatives – assets managing net debt.


![ASO2017 RFS EN [P]...RECURRING OPERATING INCOME (2,004) (6,666) Other operating income and expenses 6.3 (157) (315) OPERATING INCOME (2,161) (6,981) Net borrowing costs (36) (67) Other](https://img.pdfslide.us/doc/110x75/610792459080553b0d46678c/aso2017-rfs-en-p-recurring-operating-income-2004-6666-other-operating.jpg)