Embed Size (px)
Citation preview
(Heimann 1960). In 1831,50 Cuban cigar rollers relo- cated to Key West, Florida, where they successfully transplanted the business (Ortiz 1947). During this period, trade was primarily local; most towns had at least one cigar factory (Heimann 1960).
Many kinds and shapes of cigars were smoked during the early nineteenth century. The most expen- sive were the Havanas, made either in Cuba or in American factories that imported Cuban leaf. La Co- rona was made exclusively with Havana leaf. The most popular shape of La Corona was the Perfecto, a large cigar that tapered from the middle. The Panatella was a long, straight cigar, open at the end that was to be lit. The Parejo was similar, but open at both ends. Cigars other than La Corona included the Oscuro, which was made from a much darker leaf; Maduro, made from a brown-black leaf; Maduro Col- orado, made from a dark brown leaf; Colorado Claro, made from a light brown leaf; and several others (Cabrera Infante 1985).
In the early nineteenth century, Connecticut- grown tobacco was used to make cheap cigars (Akehurst 1968). Cigars manufactured with domestic leaf often used flavored Bright and Virginia tobacco with wrappers from Connecticut-grown tobacco. These cigars were called Conestogas, after a type of covered wagon, or “stogies” for short. Long Nines were 9 inches (3.5 cm) long and pencil-thin. Short Sixes were 6 inches (2.4 cm) long and less expensive. Prices varied from two cigars for a penny to as much as a 10 cents per cigar (Heimann 1960). Pipe and chewing tobaccos were inexpensive compared with the finer, more costly tobacco used for snuff and ci- gars, and pipe smoking was the most popular form of tobacco smoking during the first half of the nineteenth century. Persons of low-income groups used pipes and plug, while persons of high-income groups used snuff and cigars (Robert 1967).
After the Louisiana Purchase was made in 1803, settlers brought the tobacco culture to the West. By 1830, the western United States produced approxi- mately one-third of the nation’s tobacco used for plug and pipes (Wagner 1971). The southern states also produced tobacco for plug and pipe smoking and continued to produce most of the tobacco for snuff. Virginia, North Carolina, and Ohio led production (57 million, 12 million, and 10.5 million pounds, respec- tively). However, the cultivation of tobacco for cigars remained concentrated in the Northeast. By 1849, Connecticut, Pennsylvania, and Massachusetts were producing large amounts of cigar leaf (1,267,624; 912,651; and 138,246 pounds, respectively) (Jacobstein 1907). Just before the Civil War, $1.4 million worth of
cigars was produced in Philadelphia and $1 .l million in New York City. Before the war, the total value of manufactured cigars was $9 million; the value of to- baccos for chewing and pipe smoking was $21 million (Heimann 19601.
The popularity of tobacco, combined with in- creasing urbanization, encouraged some merchants to enlarge their manufacturing activities and aggres- sively market their products. The first center of activ- ity for pipe and plug tobacco was Richmond, Virginia. In 1830, James Thomas, Jr., one of the earliest manufacturer-merchants of Richmond, opened his factory and distributed plug tobacco to many parts of the country. Thomas relocated in California during the gold rush of the 1840s and soon established an almost total monopoly on pIug sales in the territory by shipping the manufactured product from his eastern factories. By 1860, approximately 50 factories in Rich- mond manufactured tobacco; these firms employed 3,400 workers and produced goods valued at almost $5 million per year (Robert 1967).
Lorillard was perhaps the largest tobacco manu- facturing facility during the first half of the nineteenth century. Pierre Lorillard had opened a snuff factory in Manhattan in 1760 and owned one of the two mills that survived British opposition to colonial produc- tion After the American Revolution, he constructed a new mill on the Bronx River, which expanded into warehouses, a facility for packing snuff and smoking tobacco, workers’ quarters, and his own home. The company outgrew this complex, and Lorillard opened a new facility across the Hudson River in Jersey City (Heimann 1960).
Tobacco products were not highly differentiated until the mid-1800s. Lorillard was one of the first to appreciate the significance of marketing. After the Civil War, his company began to affix tin tags to its plugs, which distinguished a Lorillard product from others; one Lorillard brand was called Tin Tag. Other manufacturers followed suit, and soon the tin tags were collected as novelties, just like cigarette cards in later years (Heimann 1960). The use of brand names for plug products became common in the 1840s and were used to differentiate products by additives, fla- vorings, and varieties of tobacco (Robert 1967).
Because financial centers were located in the North, tobacco financing was easier to obtain by man- ufacturing firms concentrated in that part of the coun- try. By the 185Os, much of Virginia’s crop was sent to New York firms on consignment; these firms then sold the crop to wholesale jobbers. These firms were so well established that southern manufacturers and retailers were obliged to use the northern firms. This
dependence served as another irritant between the North and South before the Civil War. Indeed, the system of U.S. tobacco manufacturing in the 1850s strongly resembled that of the 1770s when colonial tobacco farmers chafed at Britain’s stranglehold. The financial panic of 1857 did much to inflame relations further since many New York manufacturers de- faulted on their financial obligations, which caused seven of the eight Richmond tobacco manufacturers to suspend operations (Wagner 19711.
The Civil War had far-reaching effects on the tobacco industry. In the South, the cotton farmers fully supported the Confederacy, but the tobacco farmers were divided in their loyalties. Virginia, North Carolina, and Tennessee seceded from the Union, but Maryland, Kentucky, and Missouri re- mained. During the war, tobacco production in Ken- tucky surpassed that in Virginia. Some southern tobacco was smuggled through the lines, but Confed- erate planters clearly suffered during this period.
Farmers in the Bright Belt continued to plant and harvest tobacco despite the war. Because of the Union blockade of Confederate ports and fear of invasion, tobacco supplies were moved from Richmond to Dan- ville, Virginia, which became a major center of the tobacco industry. Durham, North Carolina, also grew in importance and, in time, outranked Richmond as the leading manufacturer of plug.
In 1862, to stimulate production of much-needed foodstuffs, the Confederate government prohibited cotton and tobacco cultivation, a moot policy, since neither cotton nor tobacco products could elude the Union blockade. In the same year, funds were needed to finance the Civil War, and tobacco products were among the commodities taxed (Jacobstein 1907). But tobacco production continued, perhaps because the price of tobacco increased as the fighting progressed (Robert 1967; Coulter 1926).
Invading Union armies looted tobacco ware- houses and, during lulls in the fighting, traded their food and coffee for tobacco from the Confederate troops. Some Union soldiers looted a Durham ware- house owned by John Ruffin Green who, in 1858, had created a fine smoking and chewing tobacco known as Bull Durham. The soldiers tried the cured, granulated tobacco, and after the war, they purchased the tobacco and introduced it to others (Tilley 1948). Just as six- teenth-century sailors introduced tobacco to the rest of the world, the Union soldiers brought a demand back to the North for some of the sweeter, milder, southern tobaccos they had discovered.
Within the tobacco industry, attention was fo- cused on the success of Bull Durham, which had
transformed Durham from a small southern town to a thriving tobacco center. In 1875, not only was Bull Durham used for pipe smoking and chewing, but some smokers had started to roll cigarettes with it, thus taking business away from the small companies that manufactured pipe and loose chewing tobaccos. The success of Bull Durham also contributed to the growth of the North Carolina tobacco industry. In 1870, Virginia grew 15 times more tobacco than North Carolina, but 10 years later, Virginia produced five times less (Tilley 1948).
The Manufacturing of Cigarettes Although demand for manufactured cigarettes
had increased gradually from the 1850s to the 187Os, cigarettes were still an insignificant part of the tobacco industry. The Duke family were small tobacco farm- ers and dealers in the Durham area. The family’s patriarch, Washington Duke, was a Confederate vet- eran who returned to a gutted farm after the Civil War. He found a small cache of Bright, which he sold under the name Pro Bono Publico. Duke and his sons planted Pro Bono Public0 and peddled their crop from town to town. The Dukes did a prosperous business, and in 1873 moved to Durham to be closer to the railroads that transported their product to market (Tilley 1948).
By the end of the 187Os, growth in the Duke business had leveled off. James Duke traveled throughout the country selling Pro Bono Publico, but like all the other manufacturers, Duke found it diffi- cult to compete with Bull Durham (Robert 1967; Sobel 1978). In 1881, James, then the acknowledged head of the firm, started to manufacture cigarettes called Duke of Durham.
Duke was successful from the start. A combina- tion of shrewd merchandising and aggressive price- cutting led to the increased popularity of Duke of Durham and other Duke brands. With the assistance of Edward Featherston Small, one of the first cigarette promoters, Duke merchandised his product effec- tively. At the time, manufacturers used cigarette cards to stiffen the soft packs; Duke cigarette cards were the most imaginative and sought after (Wagner 1971). Within a few years, cigarettes manufactured by Duke sold in many cities in the South and Midwest. In 1883, when the federal government reduced the tobacco tax from $1.75 to 50 cents per pound, most manufacturers passed part of the savings to customers through lower prices. Duke not only lowered his prices, he adver- tised his policy: “The Dukes are ambitious for a very large cigarette business, and to obtain such are dir,iliing their profits with the dealers and consumers”
28 Historicn[ Co7ztrxt
(Tilley 1948, p. 557). Cigarettes manufactured by Duke sold for five cents for a package of 10. They were now the least expensive on the market, and sales in- creased dramatically (Wagner 1971).
Even before Duke turned his attention to the manufacturing process, several inventors had been working to produce a cigarette-manufacturing ma- chine that would replace the workers who rolled cig- arettes by hand. But most manufacturers believed that the future of cigarettes was doubtful; they ques- tioned whether a machine capable of producing tens of thousands of cigarettes was truly needed.
In 1881, James Bonsack, announced the inven- tion of his cigarette-making machine, which was re- jected by several firms. Duke, however, was interested and, with his engineer, helped Bonsack per- fect the machine. By 1884, the Bonsack model could produce more than 200 cigarettes per minuteA6.8 million cigarettes per year. Twenty of these machines could have satisfied the entire national demand for cigarettes for 1885.
Bonsack signed a long-term contract with Duke, giving Duke rights to the machine. Although Bonsack was free to license his machine to others, his contract provided Duke with rebates, thus reducing Bonsack’s net royalties. Later, Bonsack agreed that Duke’s pay- ments would be at least 25 percent less than those paid by other firms (Sobel 1978). The Duke firm then had the lowest production costs in the tobacco industry, which gave it victory in price wars and a very high profit margin. Before the Bonsack machine was incor- porated into the process, most cigarettes sold for 10 cents for a pack of 10 cigarettes; after incorporation, for five cents.
In 1880, Duke’s total monthly payroll was $500; five years later, it was $15,000. From 1885 to 1886, production increased significantly-from 9 million to 30 million cigarettes. In August 1887, the Duke firm produced 60 million cigarettes (Tilley 1948). The firm realized high profits, which allowed Duke to acceler- ate his advertising and promotion campaigns.
Most other tobacco manufacturers continued to believe that great profits were based in the production of smoking tobacco, chewing tobacco, and cigars. At the time, Duke gave no indication of entering those market areas. Duke was the only large firm in the tobacco industry that concentrated on manufacturing cigarettes (Sobell974).
Duke believed that cigarettes would be most popular in urban areas. The firm relocated to New York where it soon became the largest cigarette manufacturer in the city. Allen & Ginter, located in Richmond, was the only serious competitor of Duke’s
in the late 1880s. Tobacco manufacturers competed fiercely for the purchase of tobacco, and dealer and smoker loyalty and price wars were frequent (Robert 1967). But cigarettes became increasingly popular, and consumer changeover was dramatic. In 1884, four cigars were sold for every cigarette. Three years later, the ratio was less than two to one-largely owing to the impact of the Bonsack machine.
The Popularity of Cigarettes In 1890, Duke became The American Tobacco
Company (ATC), the foremost tobacco manufacturer. Between 1895 and 1905, it was the second largest U.S. industrial firm in capitalization (behind U.S. Steel) and was more than three times the size of General Electric Company, Inc., the third largest enterprise (Nelson 1959). Expansion continued with the organization of American Snuff in 1900 (Sobell978). Reorganized as a holding company in 1901, ATC dominated the ciga- rette, snuff, smoking tobacco, and plug markets and soon purchased a controlling interest in United Cigar Stores. The firm did not enter into cigar production, primarily because cigars were rolled manually, which made competitive pricing difficult. However, cigars still accounted for 60 percent of the value of manufac- tured tobacco, and in order to enter this lucrative market, Duke established the American Cigar Com- pany in 1901 with an investment of $10 million. The firm controlled several significant factories, including Havana Tobacco, American Stogie, and Havana Com- mercial, but did not dominate the cigar industry. ATC had only a small market share of the cigar business (14 percent) but a large market share of cigarettes (86 percent), smoking tobacco (76 percent), and snuff (96 percent) (Lehman Brothers 1955). The dominance of ATC in cigarette production was significant because cigarettes were rapidly dominating the tobacco mar- ket (Jacobstein 1907).
The cigarette’s success can be measured by the excise taxes collected on tobacco varieties after the Civil War. In 1878, revenues from excise taxes on cigars and cheroots and on manufactured tobacco were considerably higher than those on cigarettes ($11.4 million, $25.3 million, and $300,000, respec- tively). When taxes were reduced by 50 percent in 1879, consumption of tobacco increased. Although taxes were reduced further in 1889, consumption did not increase enough to compensate for the lower tax rate. By 1890, tax revenues were $1.1 million for cigars and cheroots, $18.3 million for manufactured tobac- cos, and $1 .l million for cigarettes. When funds were needed for the Spanish-American War, taxes were temporarily increased (Arnold 1897; Jacobstein 1907).
Hisfnricfl1 CCJllfYSf 29
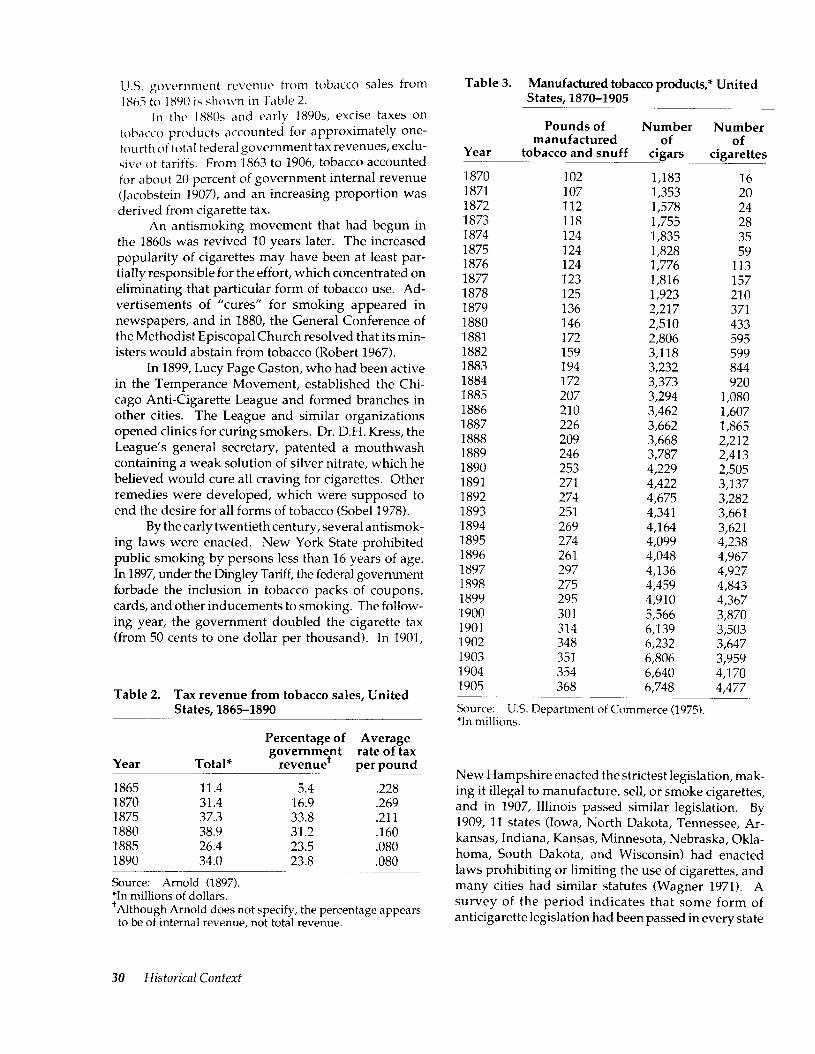
U.S. g~~vcrnment rc\vnuc from tobacco sales from 1865 to IXYO is shown in Table 2.
ln the 1880s and early 189Os, excise taxes on tobacco products accounted for approximately one- fourth of tota 1 federal government tax revenues, excIu- si\rc of tariffs. From 1863 to 1906, tobacco accounted for about 20 percent of government internal revenue (Jacobstein 1907), and an increasing proportion was derived from cigarette tax.
An antismoking movement that had begun in the 1860s was revived 10 years later. The increased popularity of cigarettes may have been at least par- tially responsible for the effort, which concentrated on eliminating that particular form of tobacco use. Ad- vertisements of “cures” for smoking appeared in newspapers, and in 1880, the General Conference of the Methodist Episcopal Church resolved that its min- isters would abstain from tobacco (Robert 1967).
In 1899, Lucy Page Gaston, who had been active in the Temperance Movement, established the Chi- cago Anti-Cigarette League and formed branches in other cities. The League and similar organizations opened clinics for curing smokers. Dr. D.H. Kress, the League’s general secretary, patented a mouthwash containing a weak solution of silver nitrate, which he believed would cure all craving for cigarettes. Other remedies were developed, which were supposed to end the desire for all forms of tobacco (Sobell978).
By the early twentieth century, several antismok- ing laws were enacted. New York State prohibited public smoking by persons less than 16 years of age. In 1897, under the Dingley Tariff, the federal government forbade the inclusion in tobacco packs of coupons, cards, and other inducements to smoking. The follow- ing year, the government doubled the cigarette tax (from 50 cents to one dollar per thousand). In 1901,
Table 2. Tax revenue from tobacco sales, United States, 1865-1890
Percentage of Average rate of tax
Year Total* government
revenue+ per pound
1865 11.4 5.4 ,228 1870 31.4 16.9 .269 1875 37.3 33.8 .211 1880 38.9 31.2 .160 1885 26.4 23.5 .OBO 1890 34.0 23.8 .OBO
Source: Arnold (1897). *In millions of dollars. ‘Although Arnold does not specify, the percentage appears
to be of internal revenue, not total revenue.
30 Historical Context
Table 3. Manufactured tobacco products,* United States, X470-1905
Year
Pounds of manufactured
tobacco and snuff
1870 102 1871 107 1872 112 1873 118 1874 124 1875 124 1876 124 1877 123 1878 125 1879 136 1880 146 1881 172 1882 159 1883 194 1884 172 1885 207 1886 210 1887 226 1888 209 1889 246 1890 253 1891 271 1892 274 1893 251 1894 269 1895 274 1896 261 1897 297 1898 275 1899 295 1900 301 1901 314 1902 348 1903 351 1904 354 1905 368
Number of
cigars ~___- 1,183 1,353 1,578 1,755 1,835 1,828 1,776 1,816 1,923 2,217 2,510 2,806 3,118 3,232 3,373 3,294 3,462 3,662 3,668 3,787 4,229 4,422 4,675 4,341 4,164 4,099 4,048 4,136 4,459 4,910 5,566 6,139 6,232 6,806 6,640 6,748
Number of
cigarettes
16 20 24 28 35 59
113 157 210 371 433 595 599 844 920
1,080 1,607 1,865 2,212 2,413 2,505 3,137 3,282 3,661 3,621 4,238 4,967 4,927 4,843 4,367 3,870 3,503 3,647 3,959 4,170 4,477 __________.
Source: U.S. Department of Commerce (1975). *In millions.
New Hampshire enacted the strictest legislation, mak- ing it illegal to manufacture, sell, or smoke cigarettes, and in 1907, Illinois passed similar legislation. By 1909, 11 states (Iowa, North Dakota, Tennessee, Ar- kansas, Indiana, Kansas, Minnesota, Nebraska, Okla- homa, South Dakota, and Wisconsin) had enacted laws prohibiting or limiting the use of cigarettes, and many cities had similar statutes (Wagner 1971). A survey of the period indicates that some form of anticigarette legislation had been passed in every state
except Wyoming and Louisiana. In general, effort to control the use of cigarettes was stronger in the Mid- west than in the West and weakest in the East (Wagner 1971; Sobel 1978). Most of the state laws were re- scinded by the middle to late 1920s.
ATC and several other tobacco companies re- sponded in the 14 states that banned cigarette smok- ing. One strategy was to sell “the makings” (i.e., smoking tobacco and cigarette paper) because ciga- rettes, not the materials themselves, were prohibited. In states where the sale of cigarettes was illegal but smoking was permitted, tobacco companies sug- gested that merchants provide free cigarettes and charge for matches. Cigarettes were also illegally transported to the states that banned cigarette sales (Sobel1978).
It is difficult to assess whether antismoking ef- forts were effective. At the turn of the century, the price of plug tobacco declined drastically, and many cigarette smokers may have switched to plug. Con- versely, the economic boom that began in 1897 may have motivated former cigar smokers, who had con- verted to cigarettes during a previous economic downturn, to return to cigars. The net effect was that cigarette sales peaked in 1896 at 4,947 million units and then declined to 3,503 million in 1901 before again turning upward (Table 3).
Although ATC was secure enough financially to survive the decline in cigarette consumption, most competitors were not, and many cigarette manufac- turers went out of business, further increasing Duke’s market share. ATC accounted for slightly more than 80 percent of cigarette sales in 1894 and more than 90 percent in 1900 (Sobel 1978). Thus, the temporary decline in cigarette consumption served to narrow competition, a portend of further developments in the twentieth century.
Urbanization in the second half of the nineteenth century contributed to the dominance of cigarettes in the tobacco market. The cigarette first gained popu- larity in cities, where the pace of life was faster than in small towns and rural areas. The desire for “a quick smoke” could be satisfied more easily with cigarettes than with cigars or pipes. Moreover, because ciga- rettes cost less than other tobacco products, smokers may have given little thought to lighting up a cigarette. Chewing tobacco, which posed few aesthetic prob- lems outdoors, caused concern in offices and factories. Informal social contact was more prevalent in cities than in rural areas. Offering someone a cigarette had a certain social cachet; it was an inexpensive way of socializing. Urban women were unlikely to smoke cigars, use snuff or pipes, or chew tobacco. But in the early twentieth century, educated women in the higher socioeconomic groups had already begun smoking cigarettes.
The Emergence of the Tobacco Companies, 1900 to the Present
Early Growth and Consolidation Once cigarette smoking became established as
the chief form of tobacco ingestion in the United States, the history of tobacco was dominated by the growth of large transnational corporations (TNCs) in the United States and the United Kingdom. ATC was one of the earliest and largest TNC in the United States (Wilkins 1970). During the 188Os, in an attempt to expand demand for his products, Duke sent represen- tatives on world tours to procure business, and by the 189Os, almost one-third of U.S. cigarette output was exported to the Far East. ATC had almost complete control of U.S. cigarette exports (Tennant 19501, and when tariff barriers prevented exports, Duke established local manufacturing plants (as in Canada, Japan, Ger- many, and Australia) (U.S. Bureau of Corporations
[USBOC] 1909). Britain’s cigarette industry also ex- panded rapidly during this period, although growth was mainly confined to British colonial preserves and spheres of influence and was not as rapid as in the U.S. industry (Alford 1973; Corina 1975). By the mid- 189Os, agents for W.D. & H.O. Wills (by then the largest U.K. firm) and ATC were directly competing in India, Australia, Japan, and China (Alford 1973).
By 1901, Duke had consolidated ATC’s control over all segments of the U.S. tobacco industry (except cigars), and he decided to enter the U.K. market (USBOC 1909). His decision was influenced by the wave of antismoking hostility in the United States, which resulted in prohibitions in 14 states and a de- pression in sales between 1896 and 1906 (Tate 19891. In addition, some shift in market preference toward
Turkish tobacco cigarettes led to new competition from small independents. To better compete with ATC, several English firms, under the leadership of Wills, merged into the Imperial Tobacco Company (ITC), and the two firms soon began to compete world- wide. ITC was about to enter the U.S. market when the two competitors came to terms (Corina 1975; Alford 1973).
The 1903 Cartel
The settlement created a classic cartel. Ogden’s Imperial Tobacco Ltd., a small tobacco firm, was sold to ITC in exchange for 14 percent of its securities; ATC and ITC agreed not to encroach on each other’s mar- kets; and a new London-based company, British- American Tobacco Company Ltd. (BAT), was orga- nized to control business outside the United Kingdom, the United States, Cuba, and Puerto Rico. Two-thirds of the initial E5.2 million capital was allocated to ATC and one-third to ITC in exchange for overseas opera- tions and export trade. Agreements were also made to ensure consultation and inhibit cheating (USBOC 1909; Alford 1973; Corina 1975).
In 1903, BAT was a transnational corporation of impressive size, comparable to current TNCs in its number of overseas operations. By the end of World War I, it was the world’s largest cigarette manufac- turer. Although some Chinese boycotted the firm’s products, BAT’s expansion was particularly extensive in China, BAT’s largest market for many years (Cochran 1975; Wang 1960). BAT entered the U.S. market by acquiring a small Kentucky firm (Brown & Williamson Tobacco Corporation) in the late 1920s (Shepherd 1983). BAT also expanded rapidly in Latin America and in other markets outside the United States and the United Kingdom.
The Antitrust Case of 1911
Meanwhile, the structure of the tobacco industry in the United States was undergoing profound change. The practices used by ATC in gaining and maintaining its market elicited opposition from to- bacco growers, leaf traders, small manufacturers, wholesalers, retailers, and organized labor (Tilley 1948; USBOC 1909,1911). These groups wanted better leaf prices for growers, more accessible market entry, increased price competition, and larger margins for retailers and jobbers (Tennant 1950; Cox 1933). The Supreme Court dissolved ATC in 1911 (U.S. 11. Amer- ican Tobacco Co. 221 U.S. 106 119111; Tennant 1950; Cox 1933; Corina 1975) and ordered that the conglomerate be split into several successor companies: Liggett & Myers Tobacco Company, Lorillard, a new ATC, and
R.J. Reynolds Tobacco Company. Distribution of ATC stockholdings was required, and several permanent and temporary injunctions against recombination were issued. Although this action probably did not accomplish the desired results, the case did have long- term effects on the international tobacco industry and upset the structure of the domestic industry enough to stimulate nonprice domestic competition (Cox 1933).
In 1913, R.J. Reynolds, which had not previously produced cigarettes, quickly launched a new type of cigarette, the American blend, with flavored Burley tobaccos. This cigarette, Camel, revolutionized the U.S. cigarette business and was quickly imitated by the new ATC’s Lucky Strike and Liggett & Myers’s Chesterfield. The advent of the American blend stim- ulated cigarette consumption and set off a long period (1913 to 1950) of extremely rapid, domestic growth known as the standard brand era (Sobel 1978). From 1911 to 1949, annual total U.S. cigarette output in- creased significantly (from 10 billion to 393 billion), while per capita consumption increased nearly twen- tyfold (Tennant 1950; Nicholls 1951). Sands (1961) concluded that the cigarette industry had the highest growth rate in physical output of all U.S. manufactur- ing industries for 1904 to 1947 and was second only to motor vehicles for 1904 to 1937. The average quin- quennial growth rate for output was 88 percent for cigarettes versus only 15 percent for all U.S. manufac- turing from 1904 to 1947 (Sands 1961). Growth in domestic consumption and output was so spectacular throughout that period that none of the firms showed any interest in developing foreign operations or ex- ports (Shepherd 1983).
During this same period, the dilution of ATC’s two-thirds holding in BAT meant that the concen- trated one-third shareholding of ITC was eventually controlled by BAT. Thus, in the early 192Os, BAT became a British-controlled corporation. Because U.S. antitrust law had no jurisdiction over either BAT or ITC, except in their U.S. leaf-buying operations, the BAT/ITC market allocation agreements of 1903 were continued in Britain until the early 1970s. In the ab- sence of British antitrust action, ITC continued to dom- inate the U.K. domestic market, while BAT controlled markets outside the United States. Even after the Eu- ropean Economic Community regulations forced the formal repudiation of the BAT/ITC market division in Europe in the 197Os, BAT/ITC relations remained close because the British Monopolies Commission did not take remedial action (Corina 1975).
As a result, brands developed by ATC became the property of BAT outside the United States and for export from the United States (Cox 1933). This severely
32 Historical Context
limited the new ATC from expanding overseas be- cause many of its top-selling domestic brands (e.g., Pall Mall and Lucky Strike) had been ATC brands before the agreement. As the new ATC came to be one of the major U.S. firms, this constraint powerfully reinforced the domestic orientation of the industry. Finally, although the ruling declared the formal cartel illegal, the arrangements persisted exactly as before: U.S. firms marketed domestically; ITC dominated the British domestic market; and BAT remained the pre- dominant international force outside theunited States and United Kingdom well into the 1960s. Thus, U.S. cigarette firms enjoyed relative protection in expand- ing sales in the large, rapidly growing U.S. market.
World War II provided the opportunity for sig- nificantly increased exports for U.S. firms. European production facilities had been destroyed, and Ameri- can cigarettes became a coveted commodity due to the popularization of everything American. However, U.S. manufacturers did little to take advantage of this situation (Shepherd 1983). International markets were viewed as unstable and unlikely to provide fu- ture growth. The long period of expansive domestic growth made overseas markets pale in comparison. A near doubling of sales during the war and the reemer- gence of the overwhelming dominance of R.J. Reynolds,
Liggett & Myers, and ATC made the struggle for do- mestic market shares more important than ever.
Stagnation Domestically and Growth Abroad
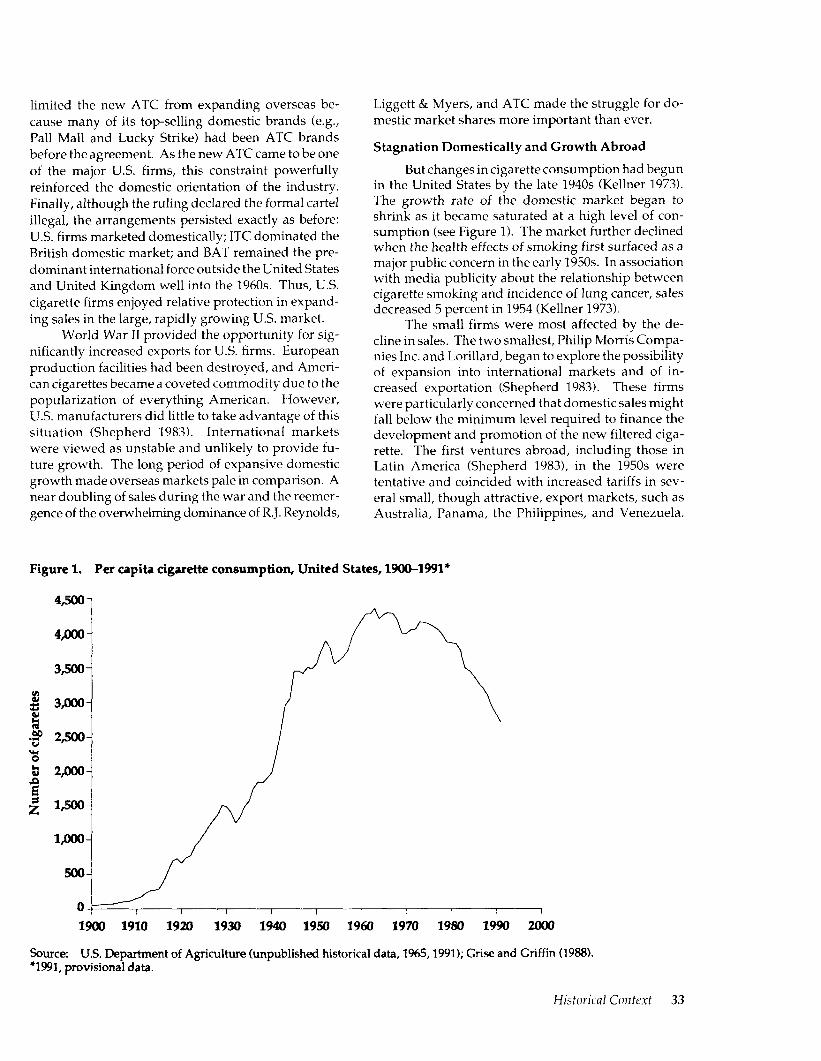
But changes in cigarette consumption had begun in the United States by the late 1940s (Kellner 1973). The growth rate of the domestic market began to shrink as it became saturated at a high level of con- sumption (see Figure 1 j. The market further declined when the health effects of smoking first surfaced as a major public concern in the early 1950s. In association with media publicity about the relationship between cigarette smoking and incidence of lung cancer, sales decreased 5 percent in 1954 (Kellner 1973).
The small firms were most affected by the de- cline in sales. The two smallest, Philip Morris Compa- nies Inc. and Lorillard, began to explore the possibility of expansion into international markets and of in- creased exportation (Shepherd 1983). These firms were particularly concerned that domestic sales might fall below the minimum level required to finance the development and promotion of the new filtered ciga- rette. The first ventures abroad, including those in Latin America (Shepherd 1983), in the 1950s were tentative and coincided with increased tariffs in sev- eral small, though attractive, export markets, such as Australia, Panama, the Philippines, and Venezuela.
Figure 1. Per capita cigarette consumption, United States, WOO-199l*
Source: U.S. Department of Agriculture (unpublished historical data, 1%5,1991); Grise and Griffin (1988). *1991, provisional data.
Historical Cmtrxt 33
Philip Morris did establish a partly owned subsidiary in Australia, but most of the U.S. ventures consisted of licensing agreements with local firms. In general, domestic orientation remained strong, and U.S. pro- ducers did not take advantage of the potential inter- national popularity of American blend cigarettes. The reluctance, particularly among the large companies, to pursue international markets may have been related to the success of filtered cigarettes, which revived high domestic growth rates in the late 1950s. Nonetheless, the smaller firms continued to acquire interests in foreign operations and were quite successful on a limited scale. In this way, Philip Morris positioned itself for a substantial advantage over the rest of the U.S. cigarette industry.
The business impact of filtered cigarettes was temporary (Kellner 1973). In 1962, the U.S. govern- ment initiated an inquiry into the health hazards of smoking (Eritschler 1975). In the resulting report of the Surgeon General, which received considerable at- tention, smoking was linked to several serious dis- eases (Public Health Service 1964). The publication of the report had immediate impact on U.S. cigarette sales (USDHHS 1989). The expression of public con- cern in the early 195Os, followed 10 years later by this formal statement of adverse health consequences, made it apparent that the health issue would probably continue to affect sales adversely in the future. During 1900 to 1950, U.S. aggregate cigarette sales failed to exceed those of the previous year only four times, but from 1950 to 1977, sales decreased seven times (Shepherd 1983). After 1964, every U.S. cigarette firm sought to acquire both foreign cigarette manufacturing opera- tions and domestic nontobacco businesses (Taylor 1984). As sales continued to stagnate, pressure grew to diversify out of the U.S. cigarette market (Miles and Cameron 1982; Shepherd 1983,1985).
Thus, the upsurge in direct foreign investment and licensing abroad by U.S. cigarette firms was prob- ably attributable to the stagnation of the U.S. market that resulted from the smoking and health issue (Warner 1977). Health concerns provided the decisive push in the search for alternative markets for the smallest firms in the 195Os, and after 1964, for the larger firms as well. Some traditional economic moti- vations-such as defensive investment, maintenance of export markets, and protection of a technologically based oligopoly-probably played a less important role (Shepherd 1983).
Few patterns were discernible in the flow of investment and licensing abroad, and firms did not necessarily explore markets with high growth rates. Much activity targeted Europe, for example, where per capita consumption was already fairly high.
Likewise, cigarette companies did not necessarily seek large markets nor penetrate high-income markets and then low-income markets; firms entered both markets simultaneously. Rates of growth, market size, levels of cigarette consumption, income, and other market characteristics appeared less important than the im- mediate concern of stagnation in the United States (Shepherd 1983).
Given the pressure to diversify quickly, most of the overseas subsidiaries established by U.S. firms were acquired rather than newly established. Of the traceable foreign subsidiary operations established during 1950 to 1976, 76 percent were acquisitions of foreign manufacturing firms by U.S. companies (Shepherd 1985). Thus, U.S. firms began foreign oper- ations by using established national brands and work- ing through existing distribution networks. Completely new subsidiaries emerged only where the local tobacco industry was so underdeveloped that no local firms were available for acquisition or where TNC competitors already owned the entire industry. As an illustration, 77 percent of the 22 subsidiaries established in Latin America were acquired rather than newly founded (Shepherd 1985).
Diversification
In their post-1964 efforts to diversify holdings, cigarette firms used the same strategy of acquiring existing companies that they had used earlier. In the first of three stages of diversification, cigarette firms focused on acquiring nontobacco businesses. By the late 197Os, TNCs derived a significant and growing share of their sales and income from nontobacco pur- suits (35 to 50 percent of sales and 10 to 30 percent of earnings were the norm for the larger firms)(Miles and Cameron 1982). The proportions were somewhat higher for the smaller enterprises (Shepherd 1983). For a time, diversification seemed successful, and it appeared that some firms might become prototypes of a new form of conglomerate TNC. For example, dur- ing the 198Os, BAT spent US$7 billion on nontobacco acquisitions, the same amount as the company’s mar- ket capitalization at the end of 1988 (Euromonitor Consultancy, Volume I, 1989).
However, the premise upon which this early diversification was based proved false. The continuing association of cigarette smoking with certain chronic diseases and the resulting decline in consumption could not be easily countered with nontobacco acquisi- tions. Diversification was not well received by inves- tors-the newly acquired nontobacco companies earned less than the cigarette companies did (White 1988). Thus, mergers with nontobacco firms lowered
34 Historical Cmt~xf
financial results dramatically. Furthermore, investors tended to judge stocks on the basis of future prospects rather than current earnings, and tobacco activity was deemed risky. Nontobacco acquisitions did not raise the market price of cigarette stocks; instead, the value of stocks in nontobacco firms were reduced when these firms were acquired by cigarette companies (Burrough and Helyar 1990; Euromonitor Consul- tancy, Volume I, 1989).
A second phase of takeovers began in the 1980s. Cigarette firms began to vary their diversification; some companies continued with new acquisitions, while others sold their nontobacco holdings (Anony- mous 1983; Blum and Wroblewski 19851. However, all firms suffered from low price-earnings ratios, and their stocks were worth far less than their assets or real current earnings potential. Nearly all of these firms were viewed as takeover targets (Nordby 1989) be- cause of the high cash flow from their core cigarette business. ITC was taken over by Hanson Trust Ltd. in 1986 (Euromonitor Consultancy, Volume I, 19891, Nabisco Inc. by R.J. Reynolds in 1988, and the two latter companies by Kohlberg Kravis Roberts & Com- pany in 1989 (Burrough and Helyar 1990). BAT nar- rowly escaped a takeover of this sort in 1989 (Euromonitor Consultancy, Volume I, 1989; Tobacco Reporter 1989b).
By the late 198Os, diversification was entering its third stage, in which company strategies diverged markedly. Some firms, such as R.J. Reynolds, BAT, and Hanson Trust, focused more on cigarettes, while others, such as Philip Morris, ATC, and Loews Corpo- ration (its tobacco holding is Lorillard), continued to grow through nontobacco acquisitions (Sherman 1989; Winters et al. 1988; Matlick 1990a,b). For all of these firms, however, diversification provided greater power and leverage to protect the cigarette business from further erosion (White 1988). Diversification aided in opposing smoking restrictions, product liabil- ity suits, and advertising and press coverage of health hazards (McGill 1988), and it broadened political co- alitions against anticigarette legislation (White 1988).
International Competition
Entry of U.S. cigarette firms abroad after 1964 generated new competition within the industry, especially with BAT. Philip Morris and, to a much lesser extent, R.J. Reynolds were BAT’s primary com- petitors. Liggett & Myers was almost wholly unsuc- cessful abroad, and Lorillard, which pursued a strategy of overseas licensing, eventually sold the rights to its brands abroad to BAT in 1978. ATC’s brands in overseas markets were already largely owned by
BAT. ATC concentrated almost all of its overseas manufacturing in the U.K. domestic market after ac- quiring Gallaher Tobacco Ltd. in the late 1960s (Corina 1975). Nevertheless, as U.S. firms continued to ex- pand in the 1960s and 197Os, it became apparent that the Anglo-American understanding on separate develop- ment was over. ATC, through Gallaher, competed withITCin theUnitedKingdom,whilePhilipMorrisand R.J. Reynolds competed with BAT almost everywhere. In the early 197Os, Philip Morris became the world’s second-largest tobacco company, and Marlboro be- came the world’s largest-selling brand. Although it lagged slightly behind BAT in world cigarette volume in the 198Os, Philip Morris’s sales value and growth were much higher, and it became the world’s largest cigarette firm (Euromonitor Consultancy, Volume I, 1989).
Despite these developments, some de facto spheres of influence have remained. In all but the largest national markets, only a few TNCs are usually present. These historical spheres of influence and pat- terns of mutual forbearance are most obvious in Asia and Africa where European firms have dominated, except for U.S. licensing in the Philippines. Until the 198Os, U.S. firms tended to restrict their operations to more familiar terrain in Latin America and Western Europe. The larger markets of Western Europe, Can- ada, and Latin America have been areas of fairly com- petitive activity (Shepherd 1985). But on the whole, oligopolistic competition, market allocation, and re- straint have characterized TNC operations.
In general, the normal pattern has not been ag- gressive, although several markets have been con- tested. For example, in Brazil and Argentina, after several years of advertising and new brand launchings, the parties tended to come to terms, expenses for demand creation were reduced, and new market shares and a more settled equilibrium evolved (Shepherd 1985).
The Current Structure of the Industry By the late 198Os, a new transnational equilib-
rium appeared to have been established. The industry regrouped along a three-tiered stratification of firms. The first tier included four truly transnational firms: BAT, Philip Morris, R.J. Reynolds, and Rothmans International Tobacco Ltd. Second-tier firms, like American Brands, Inc., and Reemtsma GmbH & Com- pany, were still international but not global in scope. These firms continued to retain important foreign markets but were largely confined to a specific region, such as Europe. Finally, smaller cigarette firms like Loews, ITC, and Liggett & Myers retired to their
Historical Context 35
respective national markets and became increasingly marginalized. After the late 197Os, the creation of new subsidiaries and licensing agreements slowed, a de- velopment which contributed to the period of consol- idation in the 1980s and the subsequent equilibrium (Shepherd 1985).
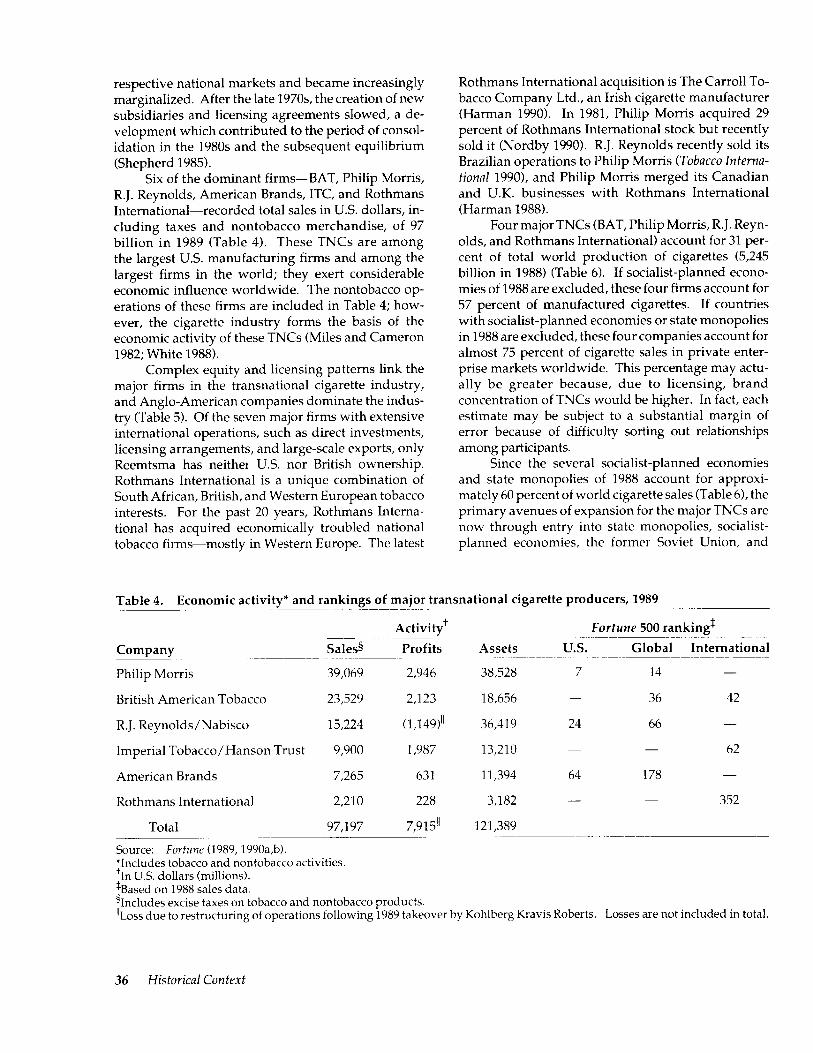
Six of the dominant firms-BAT, Philip Morris, R.J. Reynolds, American Brands, ITC, and Rothmans International-recorded total sales in U.S. dollars, in- cluding taxes and nontobacco merchandise, of 97 billion in 1989 (Table 4). These TNCs are among the largest U.S. manufacturing firms and among the largest firms in the world; they exert considerable economic influence worldwide. The nontobacco op- erations of these firms are included in Table 4; how- ever, the cigarette industry forms the basis of the economic activity of these TNCs (Miles and Cameron 1982; White 1988).
Complex equity and licensing patterns link the major firms in the transnational cigarette industry, and Anglo-American companies dominate the indus- try (Table 5). Of the seven major firms with extensive international operations, such as direct investments, licensing arrangements, and large-scale exports, only Reemtsma has neither U.S. nor British ownership. Rothmans International is a unique combination of South African, British, and Western European tobacco interests. For the past 20 years, Rothmans Interna- tional has acquired economically troubled national tobacco firm-mostly in Western Europe. The latest
Rothmans International acquisition is The Carroll To- bacco Company Ltd., an Irish cigarette manufacturer (Harman 1990). In 1981, Philip Morris acquired 29 percent of Rothmans International stock but recently sold it (Nordby 1990). R.J. Reynolds recently sold its Brazilian operations to Philip Morris (Tobacco Interna- tional 19901, and Philip Morris merged its Canadian and U.K. businesses with Rothmans International (Harman 1988).
Four major TNCs (BAT, Philip Morris, R. J. Reyn- olds, and Rothmans International) account for 31 per- cent of total world production of cigarettes (5,245 billion in 1988) (Table 6). If socialist-planned econo- mies of 1988 are excluded, these four firms account for 57 percent of manufactured cigarettes. If countries with socialist-planned economies or state monopolies in 1988 are excluded, these four companies account for almost 75 percent of cigarette sales in private enter- prise markets worldwide. This percentage may actu- ally be greater because, due to licensing, brand concentration of TNCs would be higher. In fact, each estimate may be subject to a substantial margin of error because of difficulty sorting out relationships among participants.
Since the several socialist-planned economies and state monopolies of 1988 account for approxi- mately 60 percent of world cigarette sales (Table 6), the primary avenues of expansion for the major TNCs are now through entry into state monopolies, socialist- planned economies, the former Soviet Union, and
Table 4. Economic activity” and rankings of maior transnational cigarette producers, 1989
Company Sales5
Philip Morris 39,069
British American Tobacco 23,529
R.J. Reynolds/Nabisco 15,224
Imperial Tobacco/Hanson Trust 9,900
American Brands 7,265
Rothmans International 2,210
Total 97,197 - Source: Forfllne (1989,1990a,b). *Includes tobacco and nontobacco activities. ‘In U.S. dollars (millions). TBased on 1988 sales data.
,
Activity+
Profits
2,946
2,123
(1,149)”
1,987
631
228
7,915”
Assets
38,528
18,656
36,419
13,210
11,394
3,182
121,389
Fortune 500 ranking$ U.S. Global International
7 14 -
- 36 42
24 66 -
- 62
64 178
- 352
%ncludes excise taxes on tobacco and nontobacco products. “Loss due to restructuring of operations following 1989 takeover by Kohlberg Kravis Roberts. Losses are not included in total.
36 Historical Context
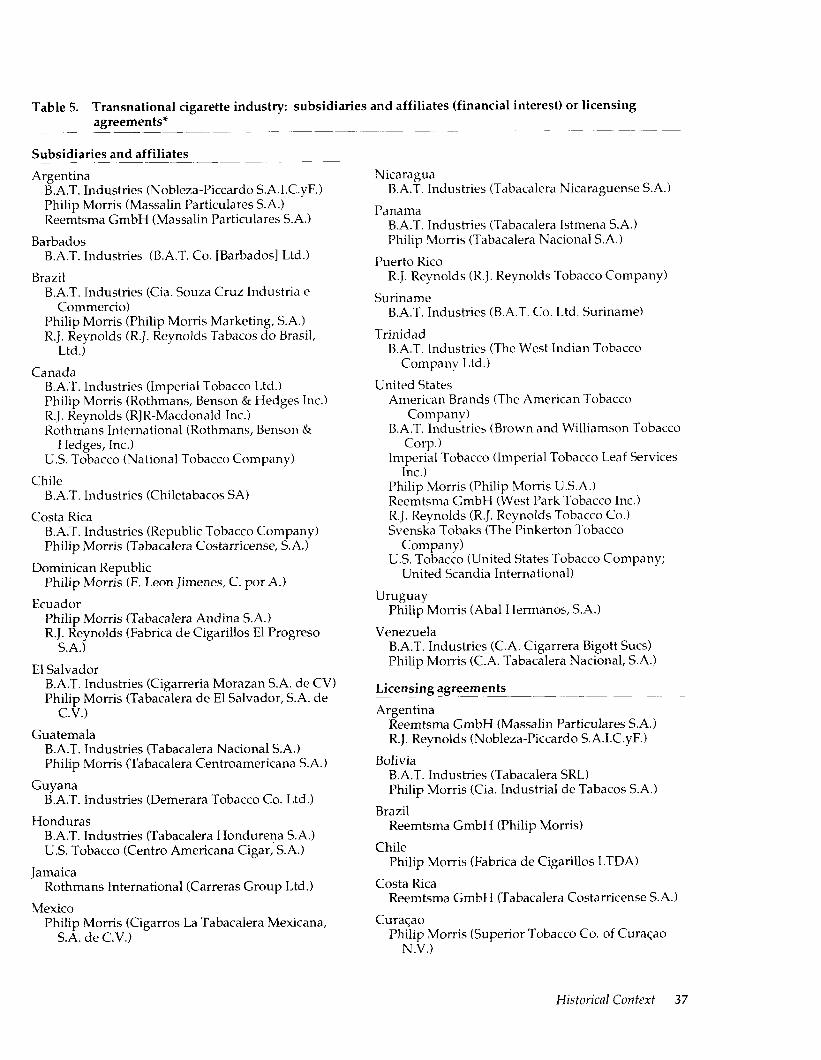
Table 5. Transnational cigarette industry: subsidiaries and affiliates (financial interest) or licensing agreements* -___--~
Subsidiaries and affiliates
Argentina B.A.T. Industries (Nobleza-Piccardo S.A.I.C.yF.1 Philip Morris (Massalin Particulares S.A.) Reemtsma GmbH (Massalin Particulares S.A.)
Barbados B.A.T. Industries (B.A.T. Co. [Barbados] Ltd.)
Brazil B.A.T. Industries (Cia. Souza Cruz Industria e
Commercio) Philip Morris (Philip Morris Marketing, S.A.) R.J. Reynolds (R.J. Reynolds Tabacos do Bras&
Ltd.)
Canada B.A.T. Industries (Imperial Tobacco Ltd.) Philip Morris (Rothmans, Benson & Hedges Inc.) R.J. Reynolds (RJR-Macdonald Inc.) Rothmans International (Rothmans, Benson &
Hedges, Inc.) U.S. Tobacco (National Tobacco Company)
Chile B.A.T. Industries (Chiletabacos SA)
Costa Rica B.A.T. Industries (Republic Tobacco Company) Philip Morris (Tabacalera Costarricense, S.A.)
Dominican Republic Philip Morris (E. Leon Jimenes, C. por A.)
Ecuador Philip Morris (Tabacalera Andina S.A.) R.J. Reynolds (Fabrica de Cigarillos El Progreso
S.A.)
El Salvador B.A.T. Industries (Cigarreria Morazan S.A. de CV) Philip Morris (Tabacalera de El Salvador, S.A. de
C.V.)
Guatemala B.A.T. Industries (Tabacalera National S.A.) Philip Morris (TabacaIera Centroamericana S.A.)
Guyana B.A.T. Industries (Demerara Tobacco Co. Ltd.)
Honduras B.A.T. Industries (Tabacalera Hondurena S.A.) U.S. Tobacco (Centro Americana Cigar, S.A.)
Jamaica Rothmans International (Carreras Group Ltd.)
Mexico Philip Morris (Cigarros La Tabacalera Mexicana,
S.A. de C.V.)
Nicaragua B.A.T. Industries (Tabacalera Nicaraguense S.A.)
Panama B.A.T. Industries (Tabacalera Istmena S.A.) Philip Morris (Tabacalera National S.A.)
Puerto Rico R.J. Reynolds (R.J. Reynolds Tobacco Company)
Suriname B.A.T. Industries (B.A.T. Co. Ltd. Suriname)
Trinidad B.A.T. Industries (The West Indian Tobacco
Company Ltd.)
United States American Brands (The American Tobacco
Company) B.A.T. Industries (Brown and Williamson Tobacco
Corp.) Imperial Tobacco (Imperial Tobacco Leaf Services
Inc.) Philip Morris (Philip Morris U.S.A.) Reemtsma GmbH (West Park Tobacco Inc.) R.J. Reynolds (R.J. Reynolds Tobacco Co.) Svenska Tobaks (The Pinkerton Tobacco
Company) U.S. Tobacco (United States Tobacco Company;
United Scandia International)
Uruguay Philip Morris (Abal Hermanos, S.A.)
Venezuela B.A.T. Industries (C.A. Cigarrera Bigott SUCS) Philip Morris (C.A. Tabacalera National, S.A.)
Licensing agreements
Argentina Reemtsma GmbH (Massalin Particulares S.A.) R. J. Reynolds (Nobleza-Piccardo S.A.I.C.yF.1
Bolivia B.A.T. Industries (Tabacalera SRL) Philip Morris (Cia. Industrial de Tabacos S.A.)
Brazil Reemtsma GmbH (Philip Morris)
Chile Philip Morris (Fabrica de Cigarillos LTDA)
Costa Rica Reemtsma GmbH (Tabacalera Costarricense S.A.)
Curaqao Philip Morris (Superior Tobacco Co. of Curaqao
N.V.)
Historical Context 37
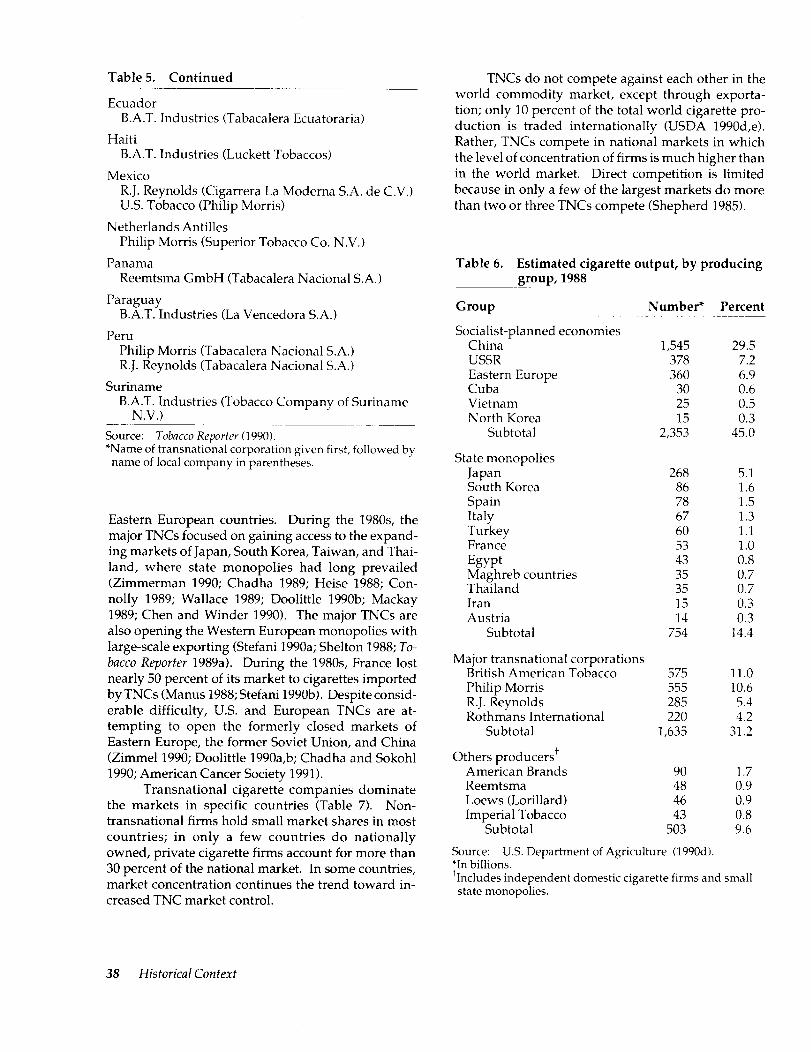
Table 5. Continued
Ecuador B.A.T. Industries (Tabacalera Ecuatoraria)
Haiti B.A.T. Industries (Luckett Tobaccos)
Mexico R.J. Reynolds (Cigarrera La Moderna S.A. de C.V.) U.S. Tobacco (Philip Morris)
Netherlands Antilles Philip Morris (Superior Tobacco Co. N.V.)
Panama Reemtsma GmbH (Tabacalera National S.A.)
Paraguay B.A.T. Industries (La Vencedora S.A.)
Peru Philip Morris (Tabacalera National S.A.) R.J. Reynolds (Tabacalera National S.A.)
Suriname B.A.T. Industries (Tobacco Company of Suriname
N.V.) Source: Tobucco~~~orfer(1990). “Name of transnational corporation given first, followed by
name of local company in parentheses.
Eastern European countries. During the 198Os, the major TNCs focused on gaining access to the expand- ing markets of Japan, South Korea, Taiwan, and Thai- land, where state monopolies had long prevailed (Zimmerman 1990; Chadha 1989; Heise 1988; Con- nolly 1989; Wallace 1989; Doolittle 1990b; Mackay 1989; Chen and Winder 1990). The major TNCs are also opening the Western European monopolies with large-scale exporting (Stefani 1990a; Shelton 1988; To- bacco Reporter 1989a). During the 198Os, France lost nearly 50 percent of its market to cigarettes imported by TNCs (Manus 1988; Stefani 1990b). Despite consid- erable difficulty, U.S. and European TNCs are at- tempting to open the formerly closed markets of Eastern Europe, the former Soviet Union, and China (Zimmel 1990; Doolittle 1990a,b; Chadha and Sokohl 1990; American Cancer Society 1991).
Transnational cigarette companies dominate the markets in specific countries (Table 7). Non- transnational firms hold small market shares in most countries; in only a few countries do nationally owned, private cigarette firms account for more than 30 percent of the national market. In some countries, market concentration continues the trend toward in- creased TNC market control.
TNCs do not compete against each other in the world commodity market, except through exporta- tion; only 10 percent of the total world cigarette pro- duction is traded internationally (USDA 1990d,e). Rather, TNCs compete in national markets in which the level of concentration of firms is much higher than in the world market. Direct competition is limited because in only a few of the largest markets do more than two or three TNCs compete (Shepherd 1985).
Table 6. Estimated cigarette output, by producing group, 1988
29.5 7.2 6.9 0.6 0.5 0.3
45.0
Group Number* Percent
Socialist-planned economies China 1,545 USSR 378 Eastern Europe 360 Cuba 30 Vietnam 25 North Korea 15
Subtotal 2,353
State mor.opolies
&%% Korea 268
86 Spain 78 Italy 67 Turkey 60 France 53 Egypt 43 Maghreb countries 35 Thailand 35 Iran 15 Austria 14
Subtotal 754
Major transnational corporations British American Tobacco 575 Philip Morris 555 R.J. Reynolds 285 Rothmans International 220
Subtotal 1,635
Others producers+ American Brands 90 Reemtsma 48 Loews (Lorillard) 46 Imperial Tobacco 43
Subtotal 503
5.1 1.6 1.5 1.3 1.1 1.0 0.8 0.7 0.7 0.3 0.3
14.4
11.0 10.6
5.4 4.2
31.2
1.7 0.9 0.9 0.8 9.6
Source: US. Department of Agriculture (1990d) *In billions. ‘Includes independent domestic cigarette firms and small
state monopolies.
38 Historical Context

Table 7. Cigarette market share of major transnational firms and affiliates,* selected countries, 1988
Americas
Argentina British American Tobacco (Nobleza Piccardo, 57.21 Philip Morris (Massalin Particulares, 42.8)
Brazil British American Tobacco (Souza Cruz, 79.6) Philip Morris (Santa Cruz, 8.0) R.J. Reynolds (R.J. Reynolds Tobacos de Brasil, 9.5) Other (2.9)
Canada British American Tobacco (Imperial, 54.3) Rothmans (Rothmans, 30.81 R.J. Reynolds (Macdonald, 14.7) Other (0.2)
El Salvador British American Tobacco (Cigarreria Morazan,
78.4) Philip Morris (Tocasa/Tasasa, 21.6)
Guatemala British American Tobacco (Tabacalera National,
48.9) Philip Morris (Tabacalera Centro-Americana, 51 .l)
Jamaica Rothmans (Cigarette Company of Jamaica Ltd.,
100.0)
Mexico British American Tobacco (La Moderna, 58.8) Philip Morris (Tabacalera Mexicana, 39.8) Other (1.4)
Nicaragua British American Tobacco (British American
Tobacco, 99.9) Other (0.1)
Panama British American Tobacco (Tabacalera Istmena,
S.A., 60.4) Philip Morris (Tabacalera National, S.A., 39.6)
United States British American Tobacco (Brown & Williamson,
10.9) Philip Morris (Philip Morris, 39.31 R.J. Reynolds (R.J. Reynolds, 31.8) American Brands (American Brands, 7.0) Other+ (11 .O)
Venezuela British American Tobacco (Bigott Sues, 79.6) Philip Morris (Tabacalera National, 20.3)
Other countries
Australia British American Tobacco (Wills, 30.9) Philip Morris (Philip Morris, 33.2) Rothmans (Rothmans, 35.1) Other (0.8)
Belgium British American Tobacco (British American
Tobacco, 12.1) Philip Morris (Weltab, 18.1) Rothmans (Tabacofina, 39.1) R.J. Reynolds (R.J. Reynolds, 7.3) Reemtsma (Cinta, 16.7) Other (6.7)
Denmark British American Tobacco (Skandinavisk
Tobakskompagni, 98.2) Other (1.81
Finland British American Tobacco (Suomen Tupakka, 19.8) R.J. Reynolds (Rettig, 15.4) Othert (64.8)
West Germany British American Tobacco (British American
Tobacco, 22.3) Philip Morris (Philip Morris, 27.61 Rothmans (Brinkman, 10.7) R.J. Reynolds (H. Neuerbur, 9.2) Reemtsma (Reemtsma, 25.0) Other (5.2)
Ghana British American Tobacco (British American
Tobacco, 89.01 Rothmans (Rothmans, 6.0) Other (5.0)
India British American Tobacco (India Tobacco
Company/Vizar Sultan Tobacco Company, 68.0)
Philip Morris (Godfrey Philips [India] Ltd., 15.0) Other (17.0)
Kenya British American Tobacco (British American
Tobacco, 99.8) Other (0.2)
Malaysia Philip Morris (Philip Morris, 3.3) Rothmans (Rothmans, 46.3) R.J. Reynolds (R.J. Reynolds, 16.31 Other (34.1)
Historical Context 39
Table 7. Continued
Netherlands British American Tobacco (British American
Tobacco, 23.0) Philip Morris (Philip Morris, 18.0) Rothmans (Rothmans, 40.0) Other (19.0)
Pakistan British American Tobacco (Pakistan Tobacco
Company Ltd., 53.0) Other (47.0)
Sri Lanka British American Tobacco (British American
Tobacco, 99.9) Other (0.1)
United Kingdom Philip Morris (Philip Morris, 5.1) Rothmans (Carreras Rothmans, 9.2) R.J. Reynolds (R.J. Reynolds, 3.4) American Brands (Gallaher, 39.4) Others (42.9)
Zaire British American Tobacco (British American
Tobacco, 42.0) Rothmans (Rothmans, 58.0)
Source: Maxwell (1989a,b, 1990a,b,c,d). ‘Name of transnational corporation given first, followed by name of local company and market share (percentage) in parentheses.
+Lorillard/Loews, 8.2 percent; Liggett & Myers, 2.8 percent. SExtensive licensing of locally owned tobacco companies by
transnational firms. ’ %cludes Imperial Tobacco/Hanson Trust, 34.6 percent.
The cigarette industry is also dominated by only a few top-selling brands (Table 8). The top two brands account for large shares of most of the world’s large cigarette markets outside of countries with socialist- planned economies (in 1988 and 1989). The top 10 brands comprise most sales in these markets (from a low of 71 percent in Italy to 100 percent in Brazil and France). In 1987, the top 25 brands accounted for 25.5 percent of world sales by volume, or 46 percent of sales in countries that did not have socialist-planned econ- omies at the time. Philip Morris’s Marlboro was the best-selling brand (293 billion cigarettes). This vol- ume was approximately equal to total cigarette sales in Japan, or the equivalent of total combined sales for the United Kingdom, Italy, and France. Outside of countries with socialist-planned economies (includes the former Soviet Union), more than one cigarette in
10 sold is a Marlboro (Euromonitor Consultancy, Vol- ume II, 1989).
Barriers to Entry
Barriers to market entry affect the current structure of the international cigarette industry. Three major barriers are commonly cited (Bain 1956): (1) absolute cost advantages for existing firms, (2) economy of scale (or other advantages of large- scale production), and (3) consumer preference for the products of existing firms. The last fact& is probably the most important.
Several factors ensure sustained consumer pref- erence for the existing products: the location of plants or sales outlets, the provision of exceptionally good service by the firms, the technology to produce phys- ical differences in the product, and the creation of a favorable image of the product (Scherer 1980). All four factors contribute to the creation of demand by the cigarette industry. The first two factors result from the manufacturer’s investment in distribution net- works, sales forces, and market research, but they are unlikely to be as decisive in most markets as are the second two factors.
The third factor, technology for producing dif- ferences in products or packaging, has permitted TNCs to gain a foothold in the foreign market. How- ever, the advantages gained by firms on the frontier of product technology are usually short-term, mainly because the differences are easy to copy. Examples in which a competitor has copied a new product form
Table 8. Percentage of sales by top cigarette brands in selected countries, 1988-1989
Country Top two Top five Top ten
Australia 41.3 63.3 77.6
Brazil 66.3 94.2 100.0
Canada 41.1 67.3 81.2
France 67.7 85.6 100.0
Italy 48.8 62.2 71.4
Mexico 42.1 71.7 87.7
United Kingdom 31.5 57.0 74.0
United States 35.6 53.3 71.8
West Germany 40.3 58.7 73.2
Source: Maxwell (1989a,b, 1990b,d).
40 Historical Context
and eventually became the market leader for that type of cigarette are common in the history of the cigarette industry (Kellner 1973). Consequently, although these innovations are a barrier to entry for potential competitors, they do not usually ensure the major TNCs a durable monopoly.
The fourth factor, the creation of favorable brand images through mass advertising and other types of promotion, reinforce differences in product form and packaging. Most industry analysts agree that estab- lished consumer preferences for existing products constitute the major obstacle to new entrants and that demand creation (i.e., marketing) has been the most important source of the high degree of concentration in the industry (Tennant 1950; Nicholls 1951; Kellner 1973; Cox 1933; United Nations Conference on Trade and Development [UNCTADI 1978). The term marketing, however, is a misnomer; it implies some process of adaptation to a given, autonomous market when, in fact, the activities described above often con- trol and change or, in effect, transcend the market.
The consumer loyalty that existing brands have gained from previous and current promotional activ- ities is a powerful barrier. According to fragmentary market research from the 197Os, approximately 50 percent of U.S. cigarette smokers have never changed brands, and an additional 25 to 30 percent have smoked the same brand for three or more years (Key 1976). Profound product-form modifications, such as the introduction of filters in the 1950s or the change to low-tar brands in the 1970s and 198Os, tend to alter brand loyalties, but these modifications are infrequent (USDHHS 1989). Furthermore, since a new brand has to overcome not only current advertising of existing brands but also the effect of previous advertising, a high level of expenditure is required to introduce a new brand, even by existing firms. A potential com- petitor must spend more than the established firms do on advertising. Thus, cigarette advertising is an in- vestment (although it is not treated as such by account- ing conventions or tax laws) (Comanor and Wilson 19751, and the return on investment may continue for many years (Weiss 1969).
Profitability
The high barriers to entry and high levels of concentration in the industry have led to oligopolistic price-setting, a development which implies profits in excess of a competitive profit-rate equilibrium. Before cigarettes were proven to be harmful, this characteristic was the main complaint about the industry in the United States (Tennant 1950) and the main concern of the literature on the cigarette industry. Two major U.S. antitrust cases against the industry ensued in 1911
and 1946 (Tennant 1950; Nicholls 1951; Cox 1933; USBOC 1909,1915; Kellner 1973). These same consid- erations led to an inquiry into concentration, pricing, and excess profit in Britain (U.K. Monopolies Commis- sion 1961).
Despite official concern, and even after cigarette smoking was linked to certain chronic diseases in the post-World War II period, the industry’s high levels of profitability continued. The U.S. tobacco industry led all U.S. industries in profitability, return to investors, and minimization of import penetration (Miles and Cameron 1982). Throughout the 1960s and 197Os, profitability of the post-World War11 TNCs continued to be well above the average for all manufacturing firms (Kellner 1973; Shepherd 1983,1985).
Available measures of profitability for the U.S. tobacco industry are conservative because they in- clude the small tobacco firms that do not make ciga- rettes, for which profitability is presumed to be lower, as well as the nontobacco operations of tobacco firms (Table 9). Nonetheless, the more profitable firms have done very well. Philip Morris averaged a 33 percent return on domestic sales in 1984 through 1988 and 9.5 percent internationally, for a weighted average of 16 percent (Euromonitor Consultancy, Volume 1, 1989). Despite its recognition as a cigarette company, Philip Morris was a popular stock in the 1980s because of its performance (Sherman 1989). To the extent that the figures can be compared, profitability in the 1980s appears similar to that enjoyed by U.S. firms during the height of the American cigarette industry-from 1911 to 1950. This level of profitability has been char- acterized as “far above competitive levels and [it] be- speaks a high degree of market control vigorously exercised” (Tennant 1950, p. 342).
In the United States, increased profitability in the 1980s has been related to both decreased overall sales and a diminished regulatory environment for busi- ness. Because of the long history of antitrust concerns, tobacco companies avoided for decades any obvious price-setting patterns, even as they continued to regu- larly raise prices. In the deregulated business climate of the 1980s (Burrough and Helyar 19901, however, the cigarette firms started raising prices regularly, begin- ning with four increases in 1982 and continuing to the present with semiannual (June and December) increases (USDA 1987, 1990a). The price of tobacco products has outpaced the consumer price index since 1983 by an ever wider margin (USDA 1990a,c), although some of this increase is attributable to taxation. This pattern has resulted because, in an unregulated oligopoly, dwindling sales are balanced by higher prices and thus higher profit margins from sales to the remaining, presumably less price-elastic, “hard-core” smokers.
Historical Context 41
The distribution of returns from cigarette sales highlights the increased profitability of the industry in the 1980s (Table 10). By 1985, the federal excise tax and leaf growers’ shares had declined substantially. Total excise taxes decreased from almost 50 percent of the consumer dollar spent on cigarettes to less than a third, and the U.S. farm value fell to only 5 percent. Although cigarette producers’ 22 percent share in 1980 was not significantly different from their 21 percent share in 1950, it increased to 34 percent in 1985 (Table 10). More efficient manufacturing (better equipment and increased use of tobacco stems and reconstituted tobacco sheets), greater use of cheaper imported to- bacco (about one-third of U.S. cigarettes in the mid- 198Os), and product form changes (filter tips and slim cigarettes) all contributed to the increase in profitability (USDA 1987,1990a,d), as did the decisive use of mar- ket power in the 1980s.
The high and increasing profitability of the in- dustry in the United States is of concern because the richer the industry becomes, the more powerful it
becomes and the more difficult it is to control (White 1988). The public health community faces the politi- cal, legislative, and economic strength of the tobacco industry, built up over time by the phenomenal cash flow and profitability of the cigarette business.
The Current Status in Latin America and the Caribbean
As described, a striking feature of the world cigarette industry in the last several decades has been the displacement in many countries of the nationally owned tobacco company by a TNC subsidiary. This phenomenon is perhaps most evident in Latin Amer- ica and the Caribbean, where it has major implications for the future social and health-related outcomes of smoking (Connolly 1989). An overview of the history and current aspects of the cigarette industry in the region follows.
Tobacco often figured in the economic and polit- ical struggles of the colonial era in Latin America and the Caribbean. The Comunero Rebellion in Socorro,
Table 9. Income and profitability of tobacco manufacturing corporations,* United States, 1970-1985
Profit
Percentage of Net income Per dollar of sales stockholders’ equity
(in millions of dollars) (in cents) (annual basis) Before After Before After Before After
Year Net sales income tax income tax federal tax federal tax federal tax federal tax
1970 9,839 1,098 569 11.2 5.8 30.3 15.7 1971 10,551 1,217 643 11.5 6.1 29.8 15.7 1972 11,308 1,246 676 11.1 6.0 28.4 15.4 1973 12,205 1,254 704 10.3 5.8 26.4 14.8 1974 14,267 1,354 770 9.5 5.4 26.4+ 15.0+ 1974$ 8,933 1,053 801 11.8 9.0 26.4+ 20.0+ 1975 9,987 1,396 919 14.0 9.2 26.6 16.6 1976 11,964 1,638 1,011 14.3 7.8 28.8 15.9 1977 13,969 1,938 1,239 14.2 9.1 32.0 17.5 1978 15,493 2,591 1,461 16.7 9.4 32.4 18.3 1979 15,331§
17,471§ 2,740 1,752 17.9 11.-l 30.9 19.2
1980 3,027 2,044 17.3 11.7 31.0 19.8 1981 20,228: 3,560 2,221 17.6 11.0 30.8 19.2 1982 20,126g 3,558 2,354 18.6 11.8 31.4 19.8 1983 21,185: 3,440 2,589 16.2 12.2 29.8 18.5 1984 24,13B9 4,291 3,015 18.3 12.4 34.5 20.8 1985 25,096s 3,596 3,447 22.6 13.8 34.8 21.2
Source: U.S. Department of Agriculture (1980b, 1987). “Includes nontobacco enterprises. ‘Estimated on the basis of an equity increase of 8 percent. IIndustry classification changed, and foreign subsidiary results were omitted beginning with 1974. For 1974, the new
classification resulted in net sales reduced by 37 percent and profits before taxes reduced by 22 percent. Profits after taxes increased 4 percent.
SExcludes excise taxes.
42 Historical Context
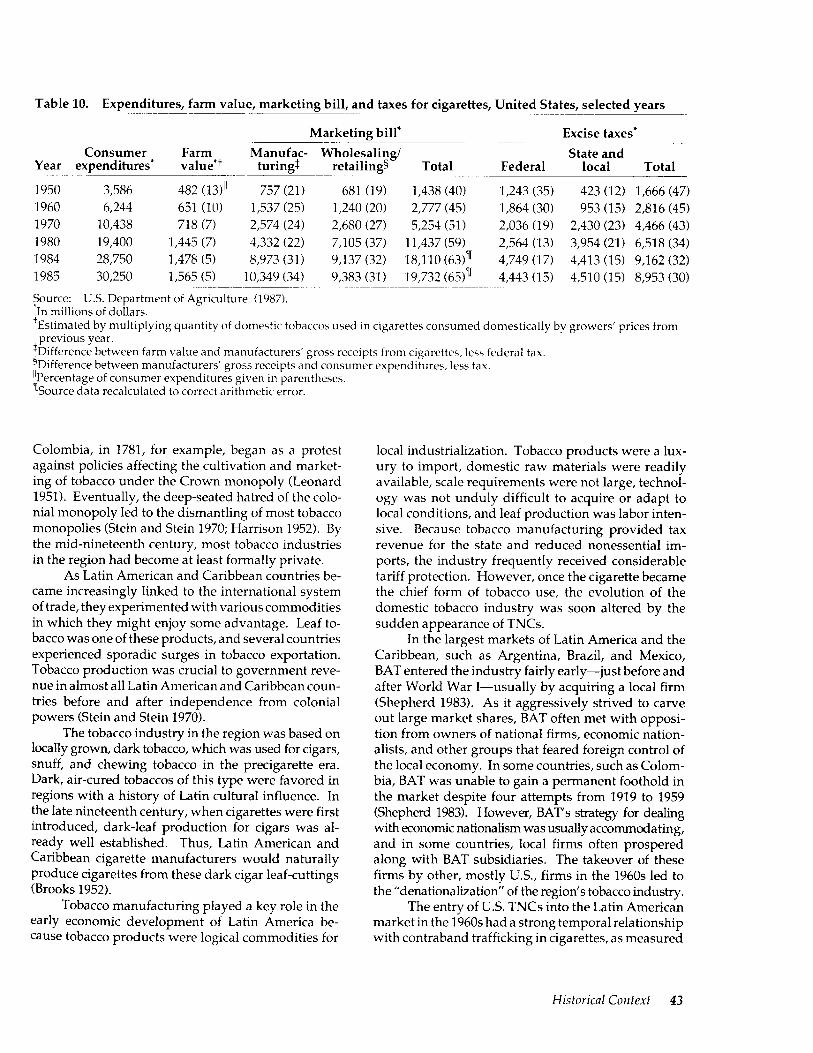
Table 10. Expenditures, farm value, marketing bill, and taxes for cigarettes, United States, selected years
Marketing bill’ Excise taxes’ Consumer Farm State and
Year expenditures* value”+ Manufac- Wholesaling/
turingj retailing5 Total Federal local Total
1950 3,586 482 (13)” 757 (21) 681 (19) 1,438 (40) 1,243 (35) 423 (12) 1,666 (47) 1960 6,244 651 (10) 1,537 (25) 1,240 (20) 2,777 (45) 1,864 (30) 953 (15) 2,816 (45) 1970 10,438 718 (7) 2,574 (24) 2,680 (27) 5,254 (51) 2,036 (19) 2,430 (23) 4,466 (43) 1980 19,400 1,445 (7) 4,332 (22) 7,105 (37) 11,437 (59) 2,564 (13) 3,954 (21) 6,518 (34) 1984 28,750 1,478 (5) 8,973 (31) 9,137 (32) 18,110 (63)’ 4,749 (17) 4,413 (15) 9,162 (32) 1985 30,250 1,565 (5) 10,349 (34) 9,383 (31) 19,732 (65)’ 4,443 (15) 4,510 (15) 8,953 (30)
Source: U.S. Department of Agriculture (1987). In millions of dollars.
‘Estimated by multiplying quantity of domestic tobaccos used in cigarettes consumed domestically by growers’ prices from previous year.
TDifference between farm value and manufacturers’ gross receipts from cigarettes, less federal tax. RDifference between manufacturers’ gross receipts and consumer expenditures, less tax. “Percentage of consumer expenditures given in parentheses. %ource data recalculated to correct arithmetic error.
Colombia, in 1781, for example, began as a protest against policies affecting the cultivation and market- ing of tobacco under the Crown monopoly (Leonard 1951). Eventually, the deep-seated hatred of the colo- nial monopoly led to the dismantling of most tobacco monopolies (Stein and Stein 1970; Harrison 1952). By the mid-nineteenth century, most tobacco industries in the region had become at least formally private.
As Latin American and Caribbean countries be- came increasingly linked to the international system of trade, they experimented with various commodities in which they might enjoy some advantage. Leaf to- bacco was one of these products, and several countries experienced sporadic surges in tobacco exportation. Tobacco production was crucial to government reve- nue in almost all Latin American and Caribbean coun- tries before and after independence from colonial powers (Stein and Stein 1970).
The tobacco industry in the region was based on locally grown, dark tobacco, which was used for cigars, snuff, and chewing tobacco in the precigarette era. Dark, air-cured tobaccos of this type were favored in regions with a history of Latin cultural influence. In the late nineteenth century, when cigarettes were first introduced, dark-leaf production for cigars was al- ready well established. Thus, Latin American and Caribbean cigarette manufacturers would naturally produce cigarettes from these dark cigar leaf-cuttings (Brooks 1952).
Tobacco manufacturing played a key role in the early economic development of Latin America be- cause tobacco products were logical commodities for
local industrialization. Tobacco products were a lux- ury to import, domestic raw materials were readily available, scale requirements were not large, technol- ogy was not unduly difficult to acquire or adapt to local conditions, and leaf production was labor inten- sive. Because tobacco manufacturing provided tax revenue for the state and reduced nonessential im- ports, the industry frequently received considerable tariff protection. However, once the cigarette became the chief form of tobacco use, the evolution of the domestic tobacco industry was soon altered by the sudden appearance of TNCs.
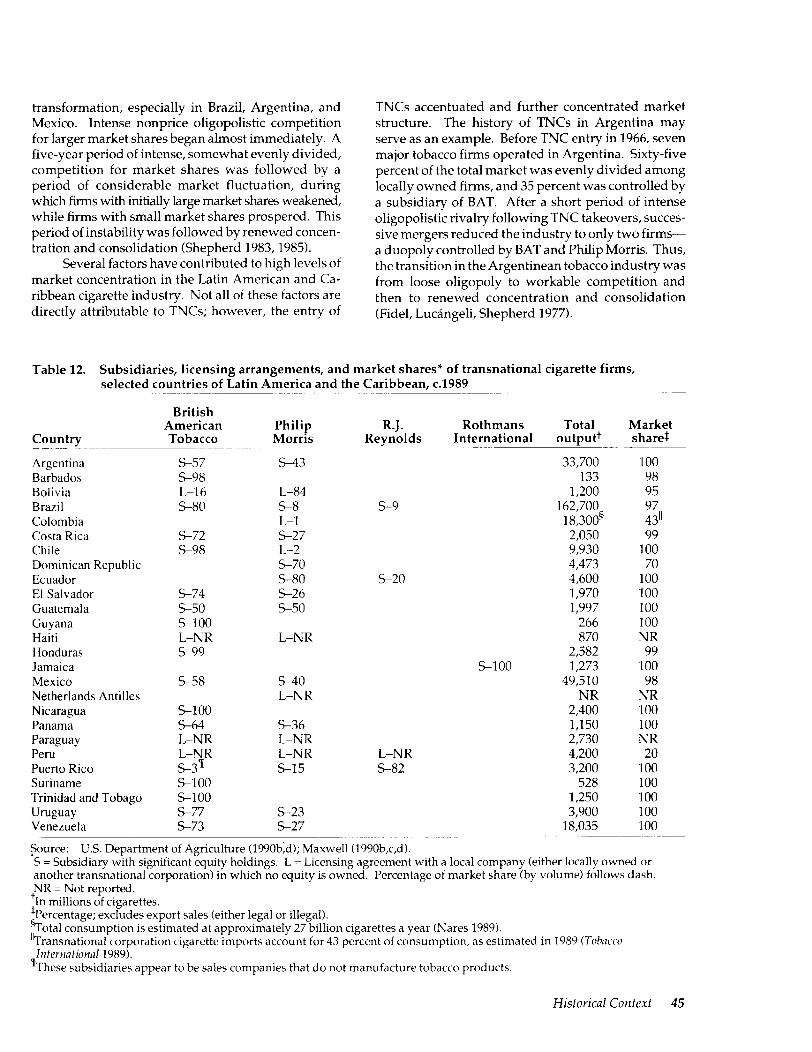
In the largest markets of Latin America and the Caribbean, such as Argentina, Brazil, and Mexico, BAT entered the industry fairly early-just before and after World War I-usually by acquiring a local firm (Shepherd 1983). As it aggressively strived to carve out large market shares, BAT often met with opposi- tion from owners of national firms, economic nation- alists, and other groups that feared foreign control of the local economy. In some countries, such as Colom- bia, BAT was unable to gain a permanent foothold in the market despite four attempts from 1919 to 1959 (Shepherd 1983). However, BAT’s strategy for dealing with economic nationalism was usually accommodating, and in some countries, local firms often prospered along with BAT subsidiaries. The takeover of these firms by other, mostly U.S., firms in the 1960s led to the “denationalization” of the region’s tobacco industry.
The entry of U.S. TNCs into the Latin American market in the 1960s had a strong temporal relationship with contraband trafficking in cigarettes, as measured
Historical Context 43
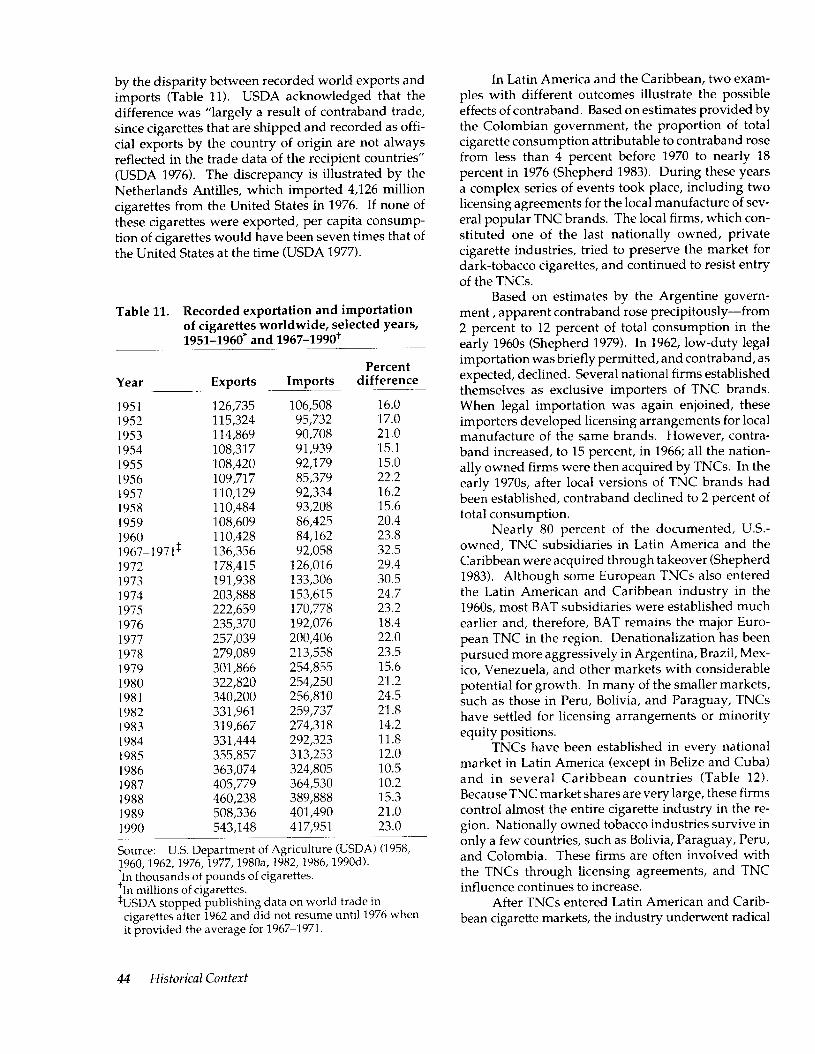
by the disparity between recorded world exports and imports (Table 11). USDA acknowledged that the difference was “largely a result of contraband trade, since cigarettes that are shipped and recorded as offi- cial exports by the country of origin are not always reflected in the trade data of the recipient countries” (USDA 1976). The discrepancy is illustrated by the Netherlands Antilles, which imported 4,126 million cigarettes from the United States in 1976. If none of these cigarettes were exported, per capita consump- tion of cigarettes would have been seven times that of the United States at the time (USDA 1977).
Table 11. Recorded exportation and importation of cigarettes worldwide, selected years, 195111960* and 1967-1990t
Year Exports ~~~
~~~ ~-~-
Percent Imports difference -~-~
1951 126,735 106,508 16.0 1952 115,324 95,732 17.0 1953 114,869 90,708 21.0 1954 108,317 91,939 15.1 1955 108,420 92,179 15.0 1956 109,717 85,379 22.2 1957 110,129 92,334 16.2 1958 110,484 93,208 15.6 1959 108,609 86,425 20.4 1960 110,428 84,162 23.8 1967~1971$ 136,356 92,058 32.5 1972 178,415 126,016 29.4 1973 191,938 133,306 30.5 1974 203,888 153,615 24.7 1975 222,659 170,778 23.2 1976 235,370 192,076 18.4 1977 257,039 200,406 22.0 1978 279,089 213,558 23.5 1979 301,866 254,855 15.6 1980 322,820 254,250 21.2 1981 340,200 256,810 24.5 1982 331,961 259,737 21.8 1983 319,667 274,318 14.2 1984 331,444 292,323 11.8 1985 355,857 313,253 12.0 1986 363,074 324,805 10.5 1987 405,779 364,530 10.2 1988 460,238 389,888 15.3 1989 508,336 401,490 21.0 1990 543,148 417,951 23.0
Source: U.S. Department of Agriculture (USDA) (1958, 1960,1962,1976,1977,1980a, 1982,1986,1990d). *In thousands of pounds of cigarettes. +In millions of cigarettes. kJSDA stopped publishing data on world trade in
cigarettes after 1962 and did not resume until 1976 when it provided the average for 1967-1971.
In Latin America and the Caribbean, two exam- ples with different outcomes illustrate the possible effects of contraband. Based on estimates provided by the Colombian government, the proportion of total cigarette consumption attributable to contraband rose from less than 4 percent before 1970 to nearly 18 percent in 1976 (Shepherd 1983). During these years a complex series of events took place, including two licensing agreements for the local manufacture of sev- eral popular TNC brands. The local firms, which con- stituted one of the last nationally owned, private cigarette industries, tried to preserve the market for dark-tobacco cigarettes, and continued to resist entry of the TNCs.
Based on estimates by the Argentine govern- ment , apparent contraband rose precipitously-from 2 percent to 12 percent of total consumption in the early 1960s (Shepherd 1979). In 1962, low-duty legal importation was briefly permitted, and contraband, as expected, declined. Several national firms established themselves as exclusive importers of TNC brands. When legal importation was again enjoined, these importers developed licensing arrangements for local manufacture of the same brands. However, contra- band increased, to 15 percent, in 1966; all the nation- ally owned firms were then acquired by TNCs. In the early 197Os, after local versions of TNC brands had been established, contraband declined to 2 percent of total consumption.
Nearly 80 percent of the documented, U.S.- owned, TNC subsidiaries in Latin America and the Caribbean were acquired through takeover (Shepherd 1983). Although some European TNCs also entered the Latin American and Caribbean industry in the 196Os, most BAT subsidiaries were established much earlier and, therefore, BAT remains the major Euro- pean TNC in the region. Denationalization has been pursued more aggressively in Argentina, Brazil, Mex- ico, Venezuela, and other markets with considerable potential for growth. In many of the smaller markets, such as those in Peru, Bolivia, and Paraguay, TNCs have settled for licensing arrangements or minority equity positions.
TNCs have been established in every national market in Latin America (except in Belize and Cuba) and in several Caribbean countries (Table 12). Because TNC market shares are very large, these firms control almost the entire cigarette industry in the re- gion. Nationally owned tobacco industries survive in only a few countries, such as Bolivia, Paraguay, Peru, and Colombia. These firms are often involved with the TNCs through licensing agreements, and TNC influence continues to increase.
After TNCs entered Latin American and Carib- bean cigarette markets, the industry underwent radical
44 Historical Context
transformation, especially in Brazil, Argentina, and Mexico. Intense nonprice oligopolistic competition for larger market shares began almost immediately. A five-year period of intense, somewhat evenly divided, competition for market shares was followed by a period of considerable market fluctuation, during which firms with initially large market shares weakened, while firms with small market shares prospered. This period of instability was followed by renewed concen- tration and consolidation (Shepherd 1983,1985).
Several factors have contributed to high levels of market concentration in the Latin American and Ca- ribbean cigarette industry. Not all of these factors are directly attributable to TNCs; however, the entry of
TNCs accentuated and further concentrated market structure. The history of TNCs in Argentina may serve as an example. Before TNC entry in 1966, seven major tobacco firms operated in Argentina. Sixty-five percent of the total market was evenly divided among locally owned firms, and 35 percent was controlled by a subsidiary of BAT. After a short period of intense oligopolistic rivalry following TNC takeovers, succes- sive mergers reduced the industry to only two firms- a duopoly controlled by BAT and Philip Morris. Thus, the transition in the Argentinean tobacco industry was from loose oligopoly to workable competition and then to renewed concentration and consolidation (Fidel, Lucsngeli, Shepherd 1977).
Table 12. Subsidiaries, licensing arrangements, and market shares* of transnational cigarette firms, selected countries of Latin Akerica and the Caribbean, c.1989
Country
Argentina Barbados Bolivia Brazil Colombia Costa Rica Chile Dominican Republic Ecuador El Salvador Guatemala Guyana Haiti Honduras Jamaica Mexico Netherlands Antilles Nicaragua Panama Paraguay Peru Puerto Rico Suriname Trinidad and Tobago Uruguay Venezuela
British American Tobacco
S57 S-98 L-l 6 S-80
S-72 598
S-74 S50 5100 L-NR !+99
558
s-100 S-64 L-NR L-NR S-3¶ SlOO S-100 S-77 S73
Philip Morris
S-43
L-84 s-8 L-l 527 L-2 S-70 S-80 S-26 S-50
L-NR
540 L-NR
S-36 L-NR L-NR s-15
s-23 %27
R.J. Reynolds
S-9
520
L-NR S-82
Rothmans Total International output+
33,700 133
1,200 162,700
18,3009 2,050 9,930 4,473 4,600 1,970 1,997
266 870
2,582 S-100 1,273
49,510 NR
2,400 1,150 2,730 4,200 3,200
528 1,250 3,900
18,035
Market share3
100 98 95 97 43” 99
100 70
100 100 100 100 NR
99 100
98 NR 100 100 NR
20 100 100 100 100 100
Source: U.S. Department of Agriculture (1990b;d); Maxwell (1990b,c,d). S = Subsidiary with significant equity holdings. L = Licensing agreement with a local company (either locally owned or another transnational corporation) in which no equity is owned. Percentage of market share (by volume) follows dash.
+NR = Not reported. In millions of cigarettes.
fpercentage; excludes export sales (either legal or illegal). *Total consumption is estimated at approximately 27 billion cigarettes a year (Nares 1989). “Transnational corporation cigarette imports account for 43 percent of consumption, as estimated in 1989 (Tobacco lnfernafiod 1989).
‘These subsidiaries appear to be sales companies that do not manufacture tobacco products.
Historical Context 45
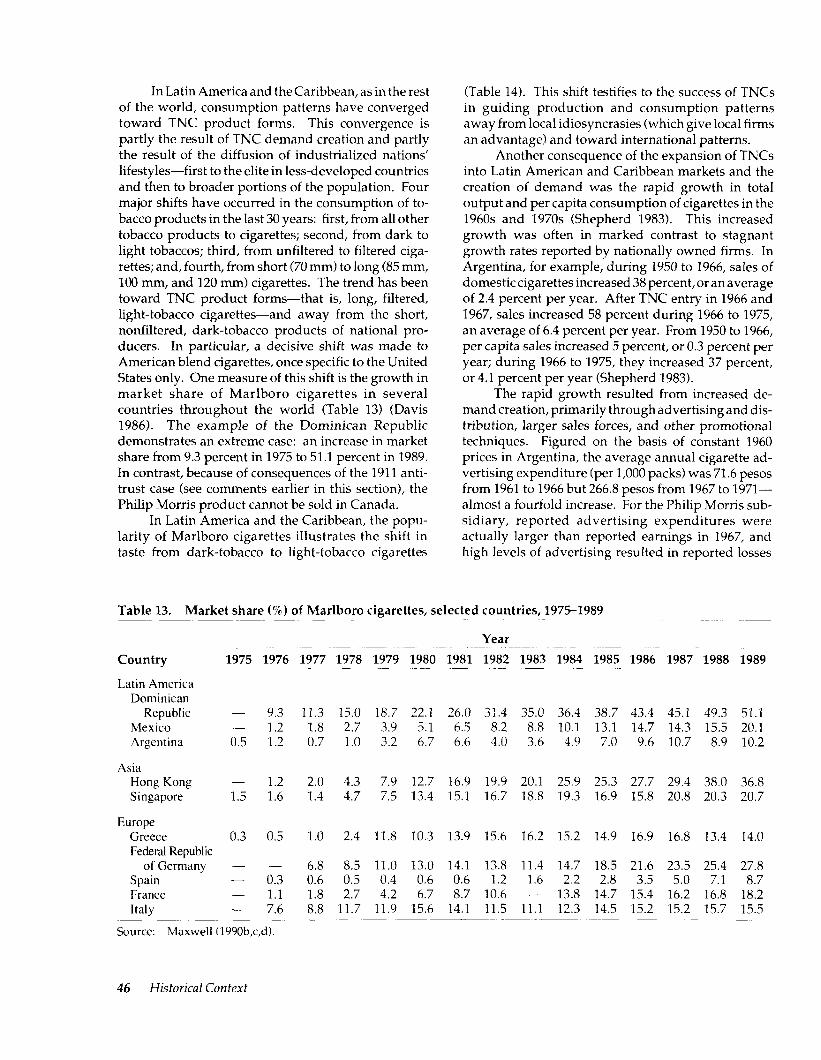
In Latin America and the Caribbean, as in the rest of the world, consumption patterns have converged toward TNC product forms. This convergence is partly the result of TNC demand creation and partly the result of the diffusion of industrialized nations’ lifestyles-first to the elite in less-developed countries and then to broader portions of the population. Four major shifts have occurred in the consumption of to- bacco products in the last 30 years: first, from all other tobacco products to cigarettes; second, from dark to light tobaccos; third, from unfiltered to filtered ciga- rettes; and, fourth, from short (70 mm) to long (85 mm, 100 mm, and 120 mm) cigarettes. The trend has been toward TNC product forms-that is, long, filtered, light-tobacco cigarettes-and away from the short, nonfiltered, dark-tobacco products of national pro- ducers. In particular, a decisive shift was made to American blend cigarettes, once specific to the United States only. One measure of this shift is the growth in market share of Marlboro cigarettes in several countries throughout the world (Table 13) (Davis 1986). The example of the Dominican Republic demonstrates an extreme case: an increase in market share from 9.3 percent in 1975 to 51.1 percent in 1989. In contrast, because of consequences of the 1911 anti- trust case (see comments earlier in this section), the Philip Morris product cannot be sold in Canada.
In Latin America and the Caribbean, the popu- larity of Marlboro cigarettes illustrates the shift in taste from dark-tobacco to light-tobacco cigarettes
(Table 14). This shift testifies to the success of TNCs in guiding production and consumption patterns away from local idiosyncrasies (which give local firms an advantage) and toward international patterns.
Another consequence of the expansion of TNCs into Latin American and Caribbean markets and the creation of demand was the rapid growth in total output and per capita consumption of cigarettes in the 1960s and 1970s (Shepherd 1983). This increased growth was often in marked contrast to stagnant growth rates reported by nationally owned firms. In Argentina, for example, during 1950 to 1966, sales of domestic cigarettes increased 38 percent, or an average of 2.4 percent per year. After TNC entry in 1966 and 1967, sales increased 58 percent during 1966 to 1975, an average of 6.4 percent per year. From 1950 to 1966, per capita sales increased 5 percent, or 0.3 percent per year; during 1966 to 1975, they increased 37 percent, or 4.1 percent per year (Shepherd 1983).
The rapid growth resulted from increased de- mand creation, primarily through advertising and dis- tribution, larger sales forces, and other promotional techniques. Figured on the basis of constant 1960 prices in Argentina, the average annual cigarette ad- vertising expenditure (per 1,000 packs) was 71.6 pesos from 1961 to 1966 but 266.8 pesos from 1967 to 1971- almost a fourfold increase. For the Philip Morris sub- sidiary, reported advertising expenditures were actually larger than reported earnings in 1967, and high levels of advertising resulted in reported losses
Table 13. Market share (‘%I of Marlboro cigarettes, selected countries, 1975-1989
Year Country 1975 1976 1977 1978 1979 1980 1981 1982 1983 1984 1985 1986 1987 1988 1989
Latin America Dominican
Republic - 9.3 11.3 15.0 18.7 22.1 26.0 31.4 35.0 36.4 38.7 43.4 45.1 49.3 51.1 Mexico - 1.2 1.8 2.7 3.9 5.1 6.5 8.2 8.8 10.1 13.1 14.7 14.3 15.5 20.1 Argentina 0.5 1.2 0.7 1.0 3.2 6.7 6.6 4.0 3.6 4.9 7.0 9.6 10.7 8.9 10.2
Asia Hong Kong - 1.2 2.0 4.3 7.9 12.7 16.9 19.9 20.1 25.9 25.3 27.7 29.4 38.0 36.8 Singapore 1.5 1.6 1.4 4.7 7.5 13.4 15.1 16.7 18.8 19.3 16.9 15.8 20.8 20.3 20.7
Europe Greece 0.3 0.5 1.0 2.4 11.8 10.3 13.9 15.6 16.2 15.2 14.9 16.9 16.8 13.4 14.0 Federal Republic
of Germany - - 6.8 8.5 11.0 13.0 14.1 13.8 11.4 14.7 18.5 21.6 23.5 25.4 27.8 Spain - 0.3 0.6 0.5 0.4 0.6 0.6 1.2 1.6 2.2 2.8 3.5 5.0 7.1 8.7 France - 1.1 1.8 2.7 4.2 6.7 8.7 10.6 - 13.8 14.7 15.4 16.2 16.8 18.2 Italy - 7.6 8.8 11.7 11.9 15.6 14.1 11.5 11.1 12.3 14.5 15.2 15.2 15.7 15.5
Source: Maxwell (1990b,c,d). - .~~___~
46 Historical Context
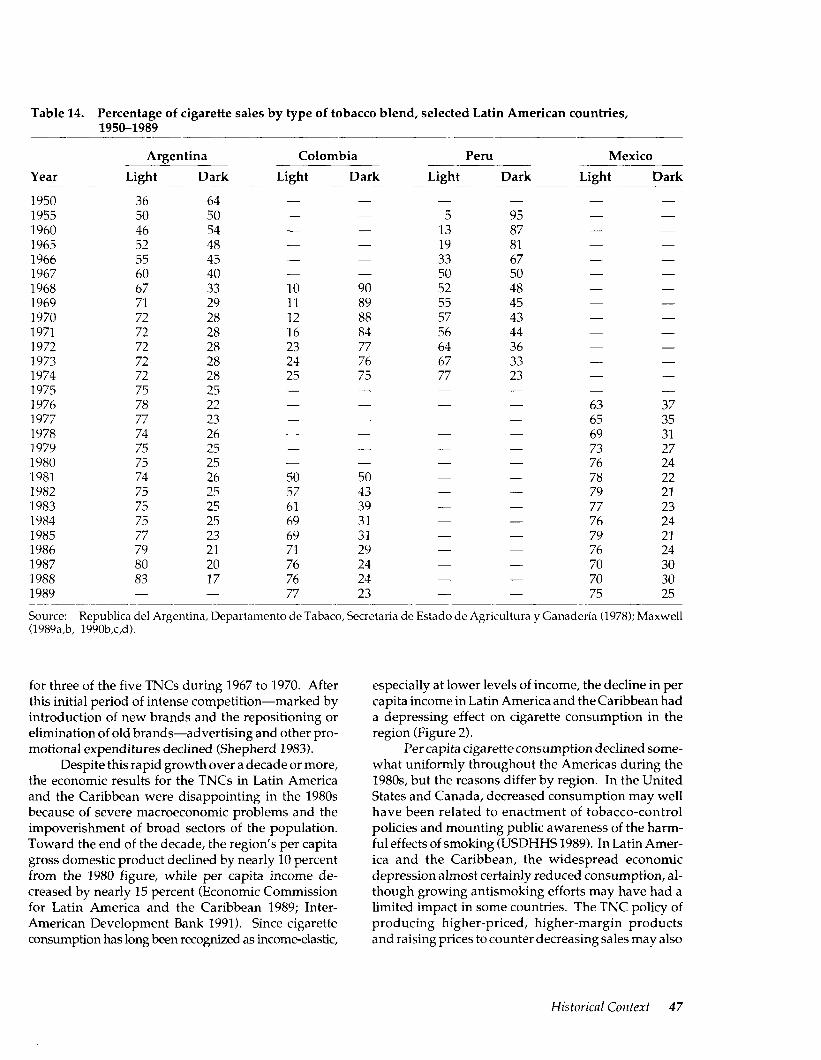
Table 14. Percentage of cigarette sales by type of tobacco blend, selected Latin American countries, 1950-1989 -
Argentina Colombia Peru Mexico
Year Light Dark Light Dark Light Dark Light Dark
1950 36 64 - - - - 1955 50 50 - 5 95 - 1960 46 54 - - 13 87 - 1965 52 48 - - 19 81 - 1966 55 45 - 33 67 - - 1967 60 40 - 50 50 - - 1968 67 33 10 90 52 48 - - 1969 71 29 11 89 55 45 - 1970 72 28 12 88 57 43 - - 1971 72 28 16 84 56 44 - 1972 72 28 23 77 64 36 - 1973 72 28 24 76 67 33 - - 1974 72 28 25 75 77 23 - 1975 75 25 - - - - - 1976 78 22 - - - 63 37 1977 77 23 - - - 65 35 1978 74 26 - - - 69 31 1979 75 25 - - - - 73 27 1980 75 25 - - - - 76 24 1981 74 26 50 50 - 78 22 1982 75 25 57 43 - - 79 21 1983 75 25 61 39 - - 77 23 1984 75 25 69 31 - 76 24 1985 77 23 69 31 - 79 21 1986 79 21 71 29 - 76 24 1987 80 20 76 24 - - 70 30 1988 83 17 76 24 - - 70 30 1989 - - 77 23 - - 75 25 --_____. ___~. __~. Source: Republica de1 Argentina, Departamento de Tabaco, Secretaria de Estado de Agriculfura y Ganadetia (1978); Maxwell (1989a,b, 1990b,c,d).
for three of the five TNCs during 1967 to 1970. After this initial period of intense competition-marked by introduction of new brands and the repositioning or elimination of old brands-advertising and other pro- motional expenditures declined (Shepherd 1983).
Despite this rapid growth over a decade or more, the economic results for the TNCs in Latin America and the Caribbean were disappointing in the 1980s because of severe macroeconomic problems and the impoverishment of broad sectors of the population. Toward the end of the decade, the region’s per capita gross domestic product declined by nearly 10 percent from the 1980 figure, while per capita income de- creased by nearly 15 percent (Economic Commission for Latin America and the Caribbean 1989; Inter- American Development Bank 1991). Since cigarette consumption has long been recognized as income-elastic,
especially at lower levels of income, the decline in per capita income in Latin America and the Caribbean had a depressing effect on cigarette consumption in the region (Figure 2).
Per capita cigarette consumption declined some- what uniformly throughout the Americas during the 198Os, but the reasons differ by region. In the United States and Canada, decreased consumption may well have been related to enactment of tobacco-control policies and mounting public awareness of the harm- ful effects of smoking (LJSDHHS 1989). In Latin Amer- ica and the Caribbean, the widespread economic depression almost certainly reduced consumption, al- though growing antismoking efforts may have had a limited impact in some countries. The TNC policy of producing higher-priced, higher-margin products and raising prices to counter decreasing sales may also
Historical Context 47
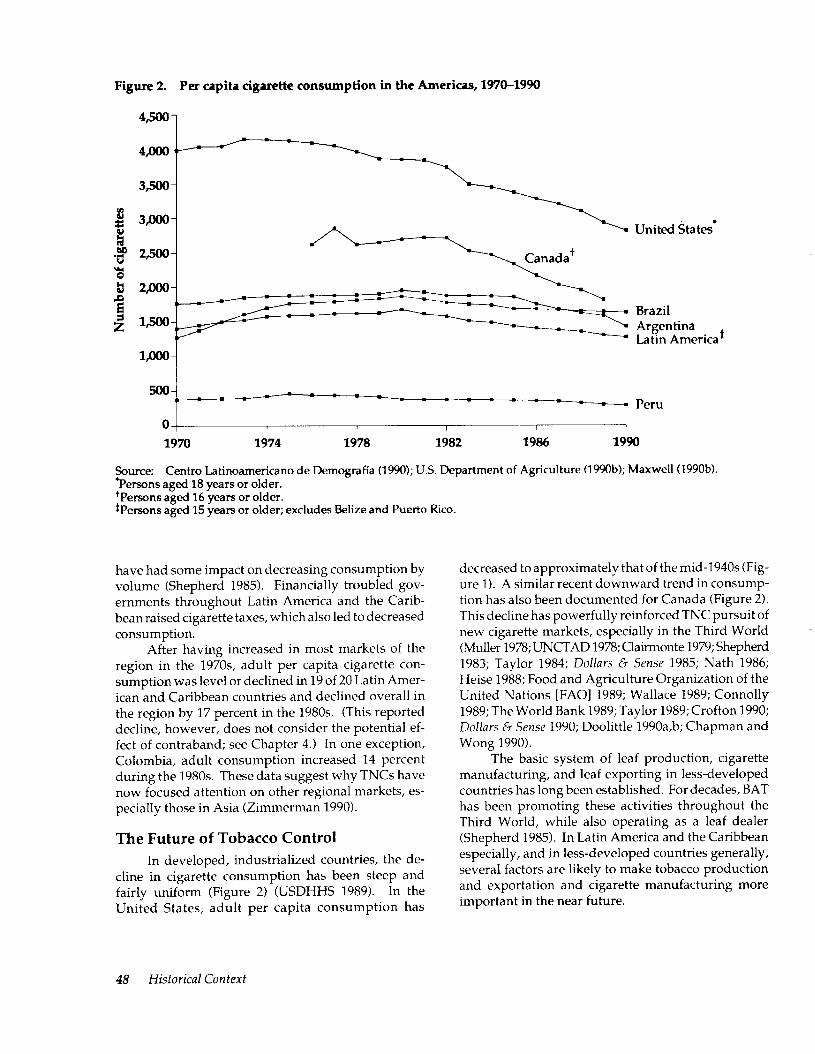
Figure 2. Per capita cigarette consumption in the Americas, 1970-1990
4w 1
United States*
Brazil Argentina Latin America*
Peru
01 I I / 1 I 1970 1974 1978 1982 1986 1990
Source: Centro Latinoarnericano de Demograffa (1990); US. Department of Agriculture (1990b); Maxwell (1990b). Persons aged 18 years or older. +Persons aged 16 years or older. tPersons aged 15 years or older; excludes Belize and Puerto Rico.
have had some impact on decreasing consumption by volume (Shepherd 1985). Financially troubled gov- ernments throughout Latin America and the Carib- bean raised cigarette taxes, which also led to decreased consumption.
After having increased in most markets of the region in the 197Os, adult per capita cigarette con- sumption was level or declined in 19 of 20 Latin Amer- ican and Caribbean countries and declined overall in the region by 17 percent in the 1980s. (This reported decline, however, does not consider the potential ef- fect of contraband; see Chapter 4.) In one exception, Colombia, adult consumption increased 14 percent during the 1980s. These data suggest why TNCs have now focused attention on other regional markets, es- pecially those in Asia (Zimmerman 1990).
The Future of Tobacco Control In developed, industrialized countries, the de-
cline in cigarette consumption has been steep and fairly uniform (Figure 2) (USDHHS 1989). In the United States, adult per capita consumption has
decreased to approximately that of the mid-1940s (Fig- ure 1). A similar recent downward trend in consump- tion has also been documented for Canada (Figure 2). This decline has powerfully reinforced TNC pursuit of new cigarette markets, especially in the Third World (Muller 1978; UNCIAD 1978; Clairmonte 1979; Shepherd 1983; Taylor 1984; Dollars 0 Sense 1985; Nath 1986; Heise 1988; Food and Agriculture Organization of the United Nations [FAO] 1989; Wallace 1989; Connolly 1989; The World Bank 1989; Taylor 1989; Crofton 1990; Dollars 0 Sense 1990; Doolittle 1990a,b; Chapman and Wong 1990).
The basic system of leaf production, cigarette manufacturing, and leaf exporting in less-developed countries has long been established. For decades, BAT has been promoting these activities throughout the Third World, while also operating as a leaf dealer (Shepherd 1985). In Latin America and the Caribbean especially, and in less-developed countries generally, several factors are likely to make tobacco production and exportation and cigarette manufacturing more important in the near future.
48 Historical Context
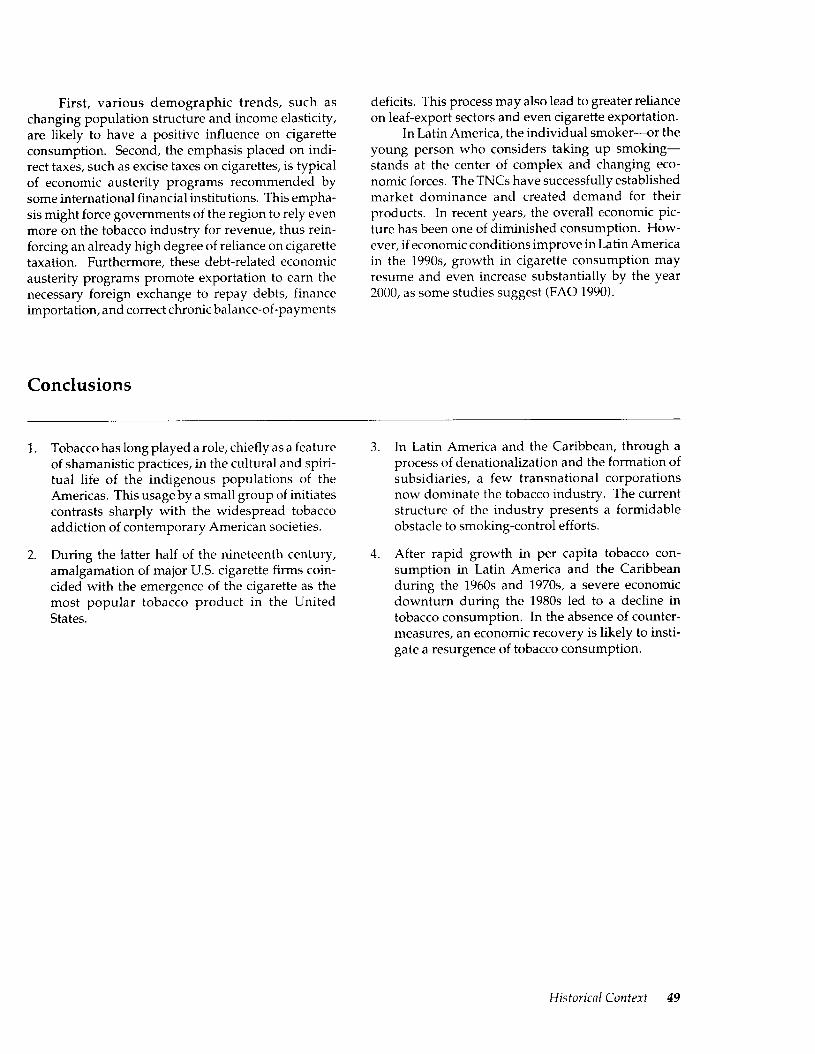
First, various demographic trends, such as changing population structure and income elasticity, are likely to have a positive influence on cigarette consumption. Second, the emphasis placed on indi- rect taxes, such as excise taxes on cigarettes, is typical of economic austerity programs recommended by some international financial institutions. This empha- sis might force governments of the region to rely even more on the tobacco industry for revenue, thus rein- forcing an already high degree of reliance on cigarette taxation. Furthermore, these debt-related economic austerity programs promote exportation to earn the necessary foreign exchange to repay debts, finance importation, and correct chronic balance-of-payments
Conclusions
deficits. This process may also lead to greater reliance on leaf-export sectors and even cigarette exportation.
In Latin America, the individual smoker-or the young person who considers taking up smoking- stands at the center of complex and changing eco- nomic forces. The TNCs have successfully established market dominance and created demand for their products. In recent years, the overall economic pic- ture has been one of diminished consumption. How- ever, if economic conditions improve in Latin America in the 199Os, growth in cigarette consumption may resume and even increase substantially by the year 2000, as some studies suggest (FAO 1990).
1. Tobacco has long played a role, chiefly as a feature 3. In Latin America and the Caribbean, through a of shamanistic practices, in the cultural and spiri- process of denationalization and the formation of tual life of the indigenous populations of the subsidiaries, a few transnational corporations Americas. This usage by a small group of initiates now dominate the tobacco industry. The current contrasts sharply with the widespread tobacco structure of the industry presents a formidable addiction of contemporary American societies. obstacle to smoking-control efforts.
2. During the latter half of the nineteenth century, 4. After rapid growth in per capita tobacco con- amalgamation of major U.S. cigarette firms coin- sumption in Latin America and the Caribbean tided with the emergence of the cigarette as the during the 1960s and 197Os, a severe economic most popular tobacco product in the United downturn during the 1980s led to a decline in States. tobacco consumption. In the absence of counter-
measures, an economic recovery is likely to insti- gate a resurgence of tobacco consumption.
Historical Context 49
References BRUCE, P.A. Economic History (of Vir,@ia in tke Sewnteenfk
AKEHURST, B.C. To&co. New York: Humanities Press, 1968.
Century, Volume I. New York: Macmillan Co. 1895. Reprint. New York: Peter Smith, 1935.
ALFORD, B.W.E. W.D. & H.O. Wills and fke Dtvelopme~~f of fke U.K. Tobacco lndusfry, 1786-1965. London: Methuen &
” Co. Ltd., 1973.
AMERICAN CANCER SOCIETY. War/d Smoking and Health 16(1):1-21,1991.
ANDREWS, K.R. Tkr Spanish Caribbean: Trade 0 Plunder, 1530-1630. New Haven, Connecticut: Yale University Press, 1978.
ANONYMOUS. Work for Ckimny-Suleepers; or, a Warning for Tabacconists, Describing the Pernicious Vse of Tabacco, No Lesse Pleasant then ProfitableforAll Sorts to Reade. London: Thomas Bushell, 1602.
BURROUGH, B., HELYAR, J. Barbariafrs at tke Gafe: The Fall of RJR Nabisco. New York: Harper & Row, 1990.
CABRERA INFANTE, G. Ho/y Smoke. New York: Harper & Row, 1985.
CARTIER, J. Bviefrecit, & succinte narration de la nauigafion faicfe es ysles de Canada, Hockelage 0 Saguenay G autres. . Paris: P.‘Roffet & A. Le Clerc, 1545.
CENTRO LATINOAMERICANO DE DEMOGRAFIA. Bolefin Demogrdfico/Demographic Bulletin. Santiago, Chile: CELADE, Year XXIII, No. 45, January 1990.
CHADHA, K.K. The prospects are enormous. Tobacco Re- porfer 116(6):32-34, June 1989.
ANONYMOUS. The business of smoking. Nezcl York State Journal of Medicine 83(13):1324-1332, December 1983.
CHADHA, K.K., SOKOHL, J. Cautious optimism in tobacco trade. Tobacco Reporter 117(3):22-23, March 1990.
ARNOLD, B.W. History of the tobacco industry in Virginia from 1860 to 1894. In: Adams, H.B. (ed.) Johns Hopkim Uniz7ersity Studies in Historical and Political Science, Volume 15. Baltimore, Maryland: The Johns Hopkins Press, January-February, 1897.
BAIN, J.S. Barriers to New Competition, Their Character and Consequences in Manufacturing Industries. Cambridge: Har- vard University Press, 1956.
BENZONI, G. La kistoria de1 mundo rz[iezlo. Biblioteca de la Academia National de la Historia, 86. 1565. Reprint. Cara- cas, Venezuela: Academia National de la Historia, 1967.
BLUM, A., WROBLEWSKI, M. Diversification in the to- bacco industry. New York Slate Journal ofMedicine 8X7):328- 334, July 1985.
BRAY, W., DOLLERY, C. Coca chewing and high-altitude stress: A spurious correlation. CurrelIt A~lfkropology 24(3):269-274,1983.
BRAY, D.W., HARDING, T.F. Cuba. In: Chilcote, R.H., Edelstein, J.C. (eds.) Latin America. The Struggle zcyitk Dep- dency and Beyorzd. New York: John Wiley & Sons, 1974.
BREEN, T.H. Tobacco Culture: The Mentality of tke Great Tidewater Planfersorl the Eveof the Rezlolution. Piinceton, New Jersey: Princeton University Press, 1985.
CHAPMAN, S., WONG, W.L. Tobacco Control irz the Tkird World: A Resource Atlas. Penang, Malaysia: International Organization of Consumers Unions, 1990.
CHEN, T.T.L., WINDER, A.E. The opium wars revisited as U.S. forces tobacco exports in Asia. American /ourmd of Public Healfk 80(6):659462, June 1990.
CLAIRMONTE, F.F. World tobacco: Dynamics of oligopo- listic annexalionism. Ecotzomic and Pokfical Week/y 14:1331- 1344, August 1979.
COCHRAN, S.G. Bis Busirless rn China: Sitlo-America?? Ri- valry irr tke Tobacco I,rdusfr!/, 1890-1930. Ph.D. diss., Yale University. Ann Arbor, Michigan: University Microfilms International, 1975.
COMANOR, W.S., WILSON, T.A. AdzJertisiq and Marhf Pozl,er. Cambridge: Harvard University Press, 1975.
CONNOLLY, G.N. The international marketing of tobacco. In: Blakeman, E.M., Engelberg, A.L. teds.) Tobacco Use irl America Colzfereme. Washington, DC: The American Medi- cal Association, 1989.
CONNOLLY, G.N., WINN, D.M., HECHT, S.S., HENNINGFIELD, J.E., WALKER, B. JR., HOFFMANN, D. The reemergence of smokeless tobacco. New England \ournal of Medicine 314(16):1020-1027, April 17, 1986.
BROOKS, J.E. TheMighty Leaf. Tobacco Tkrougk the Centuries. Boston, Massachusetts: Little, Brown and Co., 1952.
BROOKS, J.E. Tobacco: Its History Illustrated by the Books, Manuscripts, and Engravings in the Library of George Arelrts, Jr. Introductory Essay, Glossary, and Bibliographic Notes by J.E. Brooks. Volumes l-5. New York: Rosenbach, 1937-1952.
CORINA, M. Trust it1 Tobacco: The Anglo-American Struggle for Power. London: Michael Joseph, 1975.
COULTER, E.M. Tke Cizlil War and Readjustmetzt ill Kentucky. Chapel Hill, North Carolina: University of North Carolina Press, 1926.
50 Historical Context
COX, R. Competit ion in the American Tobacco Industry, 291 I- 1932: A Study of the Effects of the Partition of fhe American Tobacco Company by he United States Slrpreme Court. New York: Columbia University Press, 1933.
CRORON, J. Tobacco and the Third World. Tlrorax: Tile Joumaloflhr British Thoracic Sociefy45(3):164-169, March 1990.
D’ANGHIERA, P.M. [D’ANGHERA, P.M.] De orbe ?~o~o: The Eight Decades of Peter Martyr d’An,ghera. Translation, notes and introduction by Francis Augustus MacNutt. Two Volumes. New York: G.P. Putnam’s Sons, 1912.
FIDEL, J., LUCANGELI, J., SHEPHERD, P. Perfil y Com- portamienfo Tecnoldgico de la Industria de1 Cigarrillo en la Ar- gentina. Programa BID/CEPAL de Investigaciones en Temas de Ciencia y Tecnologia. Monografia de Trabajo No. 7. Buenos Aires, Argentina: Naciones Unidas y Banco Interamericana de Desarrollo, 1977.
FOOD AND AGRICULTURE ORGANIZATION OF THE UNITED NATIONS. The economic significance of to- bacco. Item 6(b) of the Provisional Agenda. Committee on Commodity Problems, 57th session, Rome. CCP: 89/17, June 12-16,1989.
DAVIDSON, J. Fieldnotes on tobacco use among the Aguaruna. Unpublished manuscript.
DAVIS, R.M. Promotion of cigarettes in developing coun- tries. Journal of the American Medical Association 255(8):993, February 28,1986.
DE LERY, J. Americae tertia pars. Translated and edited by Theodor de Bry. Frankfurt am Main: Wenchel, 1592.
FOOD AND AGRICULTURE ORGANIZATION OF THE UNITED NATIONS. Tobacco: Supply, Demand and Trade Projections, 2 995 and 2000. FAO Economic and Social Devel- opment Paper 86. Rome: Food and Agriculture Organiza- tion of the United Nations, 1990.
DE NAVARRETE, M.F. Coleccicin de 10s zliajes y descubrimientos qzre hicieron par mar los Espaj”‘ioles desdefines dcl si& XV. Madrid: Libreria de Moya y Plaza, 1880.
FORTUNE. The Fortune International 500. Fortune 120:280- 324, July 31,1989.
FORTUNE. The Fortune 500. Fortune 121:337-365, April 23, 1990a.
FORTUNE. The Fortune Global 500. Forhlrle 124:263-292, August 30,199Ob.
DOLE, G.E. Shamanism and political control among the Kuikuru. In: Beitriigc zur Viilkrrkundr Siidamcrikas. V~l~rkundliche Abhandlungen Volume 1. Hannover, Germany: Kommissionsverlag Miinstermann-Druck GMBH, 1964.
FRITSCHLER, A.L. Smoking and Politics: Policymaking and the Federal Blrrm~~cracy, Second Edition. Englewood Cliffs, New Jersey: Prentice-Hall, 1975.
DOLLARS & SENSE. The world is their ashtray: Cigarette companies expand their markets. Dol/ars f? Sense:5-7, Octo- ber 1985.
DOLLARS & SENSE. The Marlboro man comes to Moscow. Dollars & Sense:5, December 1990.
GEBHART, A. Fieldnotes on tobacco use among the Ship- ibo. Unpublished manuscript.
GRISE, V.N., GRIFFIN, K.F. Tire U.S. Tobacco Irldllsfry. U.S. Department of Agriculture, Economic Research Service, Commodity Economics Division. Agricultural Economic Report No. 589, September 1988.
DOOLITTLE, D.E. Export frontier broadens. Tobacco Re- porter 117(11):24-25, November 1990a.
HAMMILTON, D.W. The use of alkaline admixtures with narcotic plants. Manuscript. Cambridge: Library of Eco-
DOOLITTLE, D.E. A luxury becomes a necessity. Tobacco Reporter 117(11):22, November 1990b.
ECONOMIC COMMISSION FOR LATIN AMERICA AND THE CARIBBEAN. Economic Survey of L&n America and the Caribbean 1988. Santiago, Chile: United Nations, 1989.
nomic Botany, Harvard Botanical Museum, 1957.
HARMAN, A. Rothmans, Benson and Hedges: Poised for success. Tobacco Reporter 115(12):34-38, December 1988.
HARMAN, A. Rothmans targets Carroll. Tobacco Reporter 117(12): 20-22, December 1990.
EUROMONITOR CONSULTANCY. The World Market for Tobacco: Strategy 2000. Volumes I-II. August 1989.
HARRISON, J.P. The evolution of the Colombian tobacco trade, to 1875. Hispanic American Historical Rezlieul32(2):163-
’ FAIRHOLT, F.W. Tobacco: Its History and Associations. Lon- don: Chapman and Hall. 1859. Repiint. Detroit, Michigan: Singing Tree Press, 1968.
FERNANDEZ DE OVIEDO Y VALDES, G. Historia general y natural de las Indias, islas y tierra-firme de/ mar ockano. De 10s Rios, J.A. ted.) Four Volumes. 1535. Reprint. Madrid: Im- prenta la Real Academia de la Historia. 1851-1855.
174, May 1952.
HEIMANN, R.K. Tobacco and Amerzcans. New York: McGraw-Hil l Book Company, Inc., 1960.
HEISE, L. Unhealthy alliance: With U.S. government help, tobacco firms push their goods overseas. Worldxlatch 1(5):19-28, September4)ctober 1988.
HUMBOLDT, A. ~‘IzP Island ofC&a New York: Derby &Jack- son. 1856. Reprint. New York: Negro Universities Press, 1%9.
Historical Context 52


![[RELO] Becoming A Reflective Teacher](https://img.pdfslide.us/doc/110x75/549ebbd3b37959d7618b4773/relo-becoming-a-reflective-teacher.jpg)

![[RELO] The Contextualized English Camp](https://img.pdfslide.us/doc/110x75/549ebc08b3795989198b4599/relo-the-contextualized-english-camp.jpg)

![[RELO] American Culture Series: Black History Month](https://img.pdfslide.us/doc/110x75/5496658cb47959ec108b4701/relo-american-culture-series-black-history-month.jpg)


![[RELO] Teaching Through Emotions](https://img.pdfslide.us/doc/110x75/54966574b479599e0c8b4746/relo-teaching-through-emotions.jpg)
![[RELO] American Culture Series: Exploring Frontiers](https://img.pdfslide.us/doc/110x75/55d4b096bb61ebf4748b4597/relo-american-culture-series-exploring-frontiers.jpg)


![[RELO] Creating A Caring Classroom](https://img.pdfslide.us/doc/110x75/549ebb91ac79594b4c8b46bd/relo-creating-a-caring-classroom.jpg)

![[RELO] Digital Literacy, Who Me?](https://img.pdfslide.us/doc/110x75/5496657ab47959e4108b4707/relo-digital-literacy-who-me.jpg)
![[RELO] Making Students Write](https://img.pdfslide.us/doc/110x75/54c707954a79597c678b468b/relo-making-students-write.jpg)

![[RELO Andes] Webinar peer coaching & mentoring](https://img.pdfslide.us/doc/110x75/55b85f19bb61eb6b708b45fb/relo-andes-webinar-peer-coaching-mentoring.jpg)
![[RELO] Teaching Vocabulary](https://img.pdfslide.us/doc/110x75/54966566b47959ec108b46f7/relo-teaching-vocabulary.jpg)