Embed Size (px)
Citation preview

of Science & Information Technology (CUSIT),Peshawar, Pakistan
http:// www.cusit.edu.pk http:// www.cup.edu.pk
City
Un
ive
rsity
Re
se
arc
h J
ou
rna
l Vo
lum
e 0
6 N
um
be
r 02
Ju
ly 2
01
6 P
P 2
04
-36
3
CITY UNIVERSITY
ISSN (Print) 2220 - 9174ISSN (Online) 2409 - 0441
Volume 06 Number 02 July, 2016
RESEARCH JOURNAL
City UniversityHEC RECOGNIZED
I
City University Research Journal (CURJ) is a specified, peer-reviewed and professional journal that is published bi-annually. It has received International Standard Serial Number (ISSN - Print) 2220-9174 and (ISSN - Online) 2409-0441 from ISSN International Centre, Paris, France. CURJ invites contributions from researchers, scholars and academics in the area of Business and Management.
OBJECTIVES AND SCOPE:
The objectives of the journal are :
To open up new vistas of research for eager minds. To unify the broad array of participants involved in original scientific research in the relevant field. To explore new information, new ideas and the latest developments To facilitate scholars and researchers in conducting high quality research and to publish their ideas, results and findings. To raise the quality of research according to international standards.
The scope of the journal includes the aforementioned field. Unpublished papers and extended versions of papers presented at conferences may be submitted for possible publication in CURJ. Responsibility for the contents of a paper rests upon the authors and not upon the editors or the publisher. Surveys and tutorial papers are welcomed.
© Copyrights reserved with the City University of Science & Information Technology, Peshawar, Pakistan.
To obtain permission to reproduce or reuse text or images from CURJ, please contact the chief editor at : ([email protected])
of Science & Information Technology (CUSIT),Peshawar, Pakistan
http:// www.cusit.edu.pk http:// www.cup.edu.pk
CITY UNIVERSITY
ISSN (Print) 2220 - 9174ISSN (Online) 2409 - 0441
Volume 06 Number 02 July, 2016
RESEARCH JOURNAL
City UniversityHEC RECOGNIZED
II
EDITORDr. Fayaz Ali Shah
Assistant Professor, Management Sciences, City University of Science & InformationTechnology (CUSIT), Peshawar, Pakistan
CHIEF EDITORProf. Dr. Jehanzeb
Dean/HoD Management Sciences, City University of Science & InformationTechnology (CUSIT), Peshawar, Pakistan
ASSOCIATE EDITORSMr. Muhammad Asif, Assistant Professor, CUSIT
Mr. Said Wali, Lecturer, CUSITMr. Sohrab Arshad, Lecturer, CUSIT
RESEARCH JOURNAL
City University
PATRONProf. Engr. Dr. Attaullah Shah
Vice Chancellor, City University of Science & Information Technology (CUSIT),
Peshawar, Pakistan
EDITORIAL BOARD
III
ADVISORY BOARD
Dr. Muhammad MohsinProfessor/Director, Institute of Management Sciences,
Peshawar, Pakistan. ([email protected])
Dr. Zulfiqar Ali KhanProfessor, University of Central Punjab, Johar Town,
Lahore, Pakistan. ([email protected])
Dr. Wali RahmanAssistant Professor, Sarhad University, Peshawar
NATIONAL MEMBERS
Dr. Rosman Md. YusoffProfessor, Department of Human Resource Development,
University of Technology, Malaysia. ([email protected])
Dr. Colm Burns Research Assistant, Queen's University Management School,
Riddel Hall Block 1 02.014, Belfast, UK. ([email protected])
Dr. Nazim Zaman Lecturer in Finance in the School of Government and International Affairs.
Durham University, U.K ([email protected])
Dr. Javed Ghulam HussainProfessor of Entrepreneurial Finance at Birmingham City Business School
of Birmingham City University, UK. ([email protected])
Dr. Muhammad AzamSenior Lecturer, College of Business, University Utara Malaysia,
06010 Sintok, Kedah, Malaysia. ([email protected])
Dr. Tahir Masood QureshiAssociate Professor, College of Business Administration, American University in the Emirates,
Dubai International Academic City, 503000, Dubai UAE. ([email protected])
Dr. Zarinah YusofProfessor, Faculty of Economics and Business Administration,
University of Malaya, Malaysia ([email protected])
Prof. Dr Olga BurukinaVice-Rector for Economic and International Development,
Moscow, Russia. ([email protected])
Prof. Dr. Vladimir MaslovPh.D. Human Resource Management,
Moscow State University, Russia, ([email protected])
Prof. Dr. Amranbin Md. RasliDirector, Innovation and Commercialization Centre, Industry Centre,
UniversitiTeknologi Malaysia (UTM), ([email protected])
Bahman Kargar Shahamat, Ph.D. Management of Technology, Instructor of Management Dept, Director of Young Researcher Club,
Islamic Azad University, Astara, Iran. ([email protected])
INTERNATIONAL MEMBERS
RESEARCH JOURNALCity University

IV
Dr. Faizan AliPost-Doctoral Scholar, International Centre for Hospitality Research,
Dedman School of Hospitality,Florida State University, USA. ([email protected])
Dr. Pedro MirAssociate Professor, Marketing Management and Marketing Research,
University of Navarra, Spain.([email protected])
Dr. Zekeriya NasAssociate Professor, Human Resource Development,
Yuzuncu Yil University, Van/Turkey,([email protected])
INTERNATIONAL MEMBERS

Contents
PageTopic
204
V
1. Is Economic Value Added More Associated with Stock Price than Accounting Earnings? Evidence From Pakistan
Umair Ali Khan, Abdur Rahman Aleemi and Muhammad Azeem Qureshi
2. The Effects of Personal Determinants on Job Satisfaction of Public and Private
Universities' Academicians in Pakistan
Zekeriya Nas
3. Impact of Principal's Age and Administrative Experience on Conflict Management
Styles at Secondary School Level
Dr. Saima Batool, Dr. Sajid Rahman Khattak and Mr. Zafar Saleem
4. Quality of Healthcare Services in Public and Private Hospitals of Peshawar,
Pakistan: A Comparative Study Using Servqual
Aqsa Siddiq, Dr. Qadar B. Baloch and Dr Kausar Takrim
5. Role of Social Media on Consumer Preferences
Fazle Malik, Muhammad Asif and Said Wali
6. Causes of Service Failure: A Literature Review
Amir Ishaque, Muhammad Tufail and Muhammad Nauman Habib
7. Modelling Private Consumption in China From 1987 to 2012 Manzoor Ahmed, Khalid Khan and Abdul Salam Lodhi
8. Factors Determining Physicians' Loyalty to Pharmaceutical Brands in Peshawar Sharafat Hussain, Dr. Gohar Saeed and Altaf Hussain
9. Modeling for Tourism through Economic Indicators of Pakistan Muhammad Kamran, Amjad Alib, Alamgir and Dost Muhammad Khan
10. An Empirical Investigation into the Role of Internal Service Quality in Fostering Organizational Performance Khawaja Fawad Latif, Qadar Bakhsh Baloch and Umer Farooq Shahibzada
11. Does Size Matter in Determining Firms' Performance? A Comparative Analysis of Listed Companies Said Shah, Safdar Husain Tahir, Jamil Anwar, and Manzoor Ahmad
12. Evaluating The Role of Human Resource Management (HRM) Practices on Job Performance: An application of Employee Empowerment as Moderator Faiza Manzoor, Khuram Nawaz Sadozai, and Dawood Jan
217
229
242
269
284
256
311
321
344
354
295
204
IS ECONOMIC VALUE ADDED MORE ASSOCIATED WITH STOCK PRICE THAN ACCOUNTING EARNINGS?
EVIDENCE FROM PAKISTANUmair Ali Khan*, Abdur Rahman Aleemi** and Muhammad Azeem Qureshi***
ABSTRACT
This study seeks to provide an answer to the ongoing debate over the superiority of economic value added (EVA) upon traditional accounting based tools of performance measurement in explaining stock price of a firm. This Study was formulated to test the relative and incremental information contents provided by EVA and accounting measures of return like ROE,ROA, OCF,earnings per share after tax (EPSAT) and debt to equity ratio (DE). A total of 28 non financial firms listed at Karachi Stock Exchange were analyzedover the period 2009-2012. In order to empirically test the hypotheses, panel data regression was applied and our findings did not support the claim of EVA proponents of its superiority over accounting based measures of performance. Rather it was found that accounting measures outperformed EVA in explaining the behavior of stock prices of firms in Pakistani market. This study is the first of its kind in the context of Pakistan.
Keywords: EVA, Accounting Earnings, ROE, ROA, OCF, Information Content, Incremental Content, Relative Content
INTRODUCTION
The concept of (economic value added) EVA was developed by Stern Stewart & Co. which was founded back in 1980's. EVA basically is that economic profit which is added for the shareholders/owners by the management(Haddad, 2012). It is also referred to as performance measurement tooland a value creation measure (Abdeen & Haight, 2011). Ever since the development of the concept of EVA in 1991, which is a trade mark of Stern Stewart & Company, it has gained much attention of the media, practitioners, researchers, shareholders and the senior management of corporations.The need for EVA was felt due to some of the limitations that existed in the traditional accounting measures of return such as earnings per share (EPS), net income (NI), return on asset (ROA), return on equity (ROE) etc. It was found that these traditional measures provide limited insight into the actual performance of the firm/management as they are largely based on historical figures(Sharma & Kumar, 2010). More over the choice of different accounting treatments also adds to substantial distortions in the conventional measures(Shil, 2009).
Furthermore, as a result of the growing realization on the part of investors, shareholder and management about the importance of maximizing shareholders' value, the need was
City University Research JournalVolume 06 Number 02 July 2016 PP 204-216
*Department of Business Administration, Iqra University Main Campus, Karachi, Pakistan andcan be contacted at [email protected]**Faculty of Business Administration, Institute of Business & Technology, Karachi.Email: [email protected] ***Faculty of Business Administration, Institute of Business & Technology, Karachi.
C 2016 CURJ, CUSIT

205
felt in the financial world for discovering a more dynamic measure/tool to judge the performance of management in running the affairs of the firm. Although the debate is still on about the superiority of EVA compared with its conventional rival measures. Still it has been widely used in today's financial and economic analysis of a firm as a reliable financial metric(Biddle et al., 1997: Bacidore et al., 1997). Hence many of the previous studies have tried to tests both incremental and relative information contents of EVA, including inter alia (Obyrne, 1997: Ramana, 2005: Kim, 2006: Palliam, 2006: Sharma & Kumar, 2012: Mostafa & Dixon, 2013: Tamamy & Awad, 2014: Shah & Haldar, 2015: ). Here incremental information content refers to a situation where it tests whether one performance measure (accounting or economic) provides more information content than the other measure. Whereas relative information content means which measure has greater or superior information content than the other one(Palliam, 2006: Mohanty, 2013).
Likewise, this study seeks to provide empirical evidence on the comparative superiority of EVA over traditional accounting returns such as Operating Cash Flow (OCF), Return on Assets (ROA), Return on Equity (ROE), Debt to Equity Ratio (DE), Earnings per Share After Tax (EPSAT) particularly in Pakistani business environment.And to the best of our knowledge, this study is the first of its kind in the case of Pakistan. This comparison is done on the basis of Stock Prices (SP).The main motivation behind this study was to provide domestic perspective on the phenomenon under study and to answer the ongoing debate about the superiority of EVA over other accounting measures of performance. Another reason is that management often tends to manipulate the financial results in order to suite their interests. This is possibly due to the very nature of how accounting measures of performance are calculated and their reliance on the accounting data, which in turn depends on the accounting policies implemented by the firm, this helps the management to overstate or understate the firm's results(Brown et al., 2011). Moreover, in countries like Pakistan where inflation rates are always on the rise and poor political, law and order and economic conditions are explained as a reason that always hampers the performance of the firms. Many firms describe these and many other reasons to their shareholders in justifying the firms' results(Ayyagari et al., 2011: Ahmed, 2013). Furthermore it is argued that due to absence of strong regulatory agency and weak form of market efficiency the shareholders' interests are rather compromised(Ribstein et al., 2002: Ararat & Ugur, 2003).This condition calls for a more dynamic measure of management performance to assist shareholders to evaluate the true management performance. This measure should be independent of the many accounting distortions that may or may not be present in the firms' financial data,which led to the concept of economic value addition.
This very study aspires to provide answers to these compelling issues at hand with special focus on the Pakistan's business environmentwhich is the first of its kind effort particularly in the case of Pakistan to the best of our knowledge. This study is significant in both ways as it will not only provide a local perspective but will also add to the current literature on the phenomenon.
LITERATURE REVIEW
In one of the primary works by Stewart (1991) in his book “the quest for Value” he
C 2016 CURJ, CUSIT
Is Economic Value Added More...
206
procailmed the superiority of EVA over traditional accounitng based measures with respect to its association with market value of the firm or its stock return. To prove this (Stewart, 1991) took a sample of US firms and calculated both constant and changes in the correlations bewteen EVA and MVA. Stewart (1991) concluded that by maximizing EVA and its growth would result in added premium into the firms' market value.followed by this Stern , Stewart and Chew (1994) contended that the accounting based measures such as earnings, ROE, dividends, dividend growth, earnings growth, or even cash flow are not crucial measures of corporate performance, (Stern et al. 1994) said that EVA is a kind of measure which is more closely associated with market value of company.Later on in a research study by Bacidore, Boquist, Milbourn & Thakor (1997) on the search for optimal financial performance measure they provided a comparative empirical analysis of economic value added (EVA) and refined economic value added (REVA). They argued that REVA is relative more efficient in measuring the performance of the firm as compared to EVA. REVA is defined as the NOPAT-WACC*(adjusted book value of net capital) whereas EVA is NOPAT-WACC*Capital employed. The primary difference between the two matrices is the REVA takes into account the market values of the firm whereas EVA takes book value. Tha data of 600 randomely selected firms for the study was taken from the Stern Stewart & Company's database of 100 firms for the period of 1982 to 1992. Further accounting and market data were taken from the Standard Poors' COMPUSTAT and University of Chicago's CRSP database. Regression model was developed to first test the association of these two matrices with the abnormal returns of the firms. And second lag model was developed to test the effects of past realizations of these variables on the firm's abnormal retuns. (Bacidore, Boquist, Milbourn & Thakor, 1997) concluded that EVA was not able to explain the wealth/value creation of the firm for shareholders by management as efficiently as REVA was. The basic flaw in EVA was proved to be the fact that it based on the book value of economic capital as compared to the market values of economic capital by REVA. Following the approach of (Bacidore et al, 1997) in a later study conducted using UK companies data by (Bayldon, 1999) to find a more refined EVA metric that will be able to more accurately predict future firm performance, a market value EVA was proposed as opposed to the book value practice of calculating EVA. Although (Bayldon, 1999) did not conclusively proved this apporach as a more reliable over its predecessor due to small sample, rather this study provided a framework to considered for future studies. It was argued that EVA has the potential to be used a single metric of performance measure and decision making for the firms.
In another comparative study conducted to find out the superiority of EVA over traditional accounting measures of firm performance and their association with firm value and stock returns Biddle, Bowen & Wallace (1997) concluded that EVA was not proved be outperforming the traditional measres when it comes to explaining the relative information content. In the case of incremental information content EVA was only able to marginally contribute over and above its rivals. The study used 219 firms data from 1983 to 1994 making total observations to 2271. All the data used were taken from the databse of Stern Stewart & company's listing of 1000 firms on the basis of market capitalization. Variables included in the study were market adjusted returns as dependent, and independent variables were operating cash flow, earnings before extra
C 2016 CURJ, CUSIT
Umair Ali Khan et al.
207
ordinary items, residual income and economic value added. For the propose of reducing heteroscedasticity all the independet variables were deflated by the market value of equity. (biddle, Bowen & Wallace, 1997) used components of EVA to test the incremental value of this matix. For this they used accrual and interest expense variables. The relative information content were measured by R2 the results stated that there was no reason to believe the claim of Stern Stewart & Company that EVA is more superior in explaining relative information contents. The same was the case for incremental information content for these firms under study. Following the prvious study (Biddle, Bowen &Wallace, 1998) further investigated some other aspects of economic value added matix in order to judge its value and supriority over its rival matices. This study focused on EVA as the internal evaluation measure of a firm. It was argued by Stern Stewart & Company that those firms who adopted EVA as internal performance measurment tool and bundled their management incentives along the EVA has gained better results as compared to those firms which are using the traditonal management incentive tools. To test this proposition a sample of two groups were taken which consisted of forty firms from 1994 which had adopted residual income like incentive plans for their management. A pre and post adoption group was created and the impact was measured on four different levels. It was assumed to be tested that firms adopting residual income based incentive will tend to have higher asset dispostion and lower new investment, also overall share repurchase and dividend payout will increase in these firms, further it was tested that total assets turnover will increase in these firms and finally residual income for these adopting firm will increase as compared to those who have not adopted this measure. Ordinary least squares regression method was emplolyed to test these four hypothesis'. The results indicated that firms adopting residual based incentive programs have been able to increase their dividend payout and stock repurchase, improvement in total asset turnover, increased dispotsiotion of assets and an increase in the residual income of the firm. But interestingly (Biddle, Bowen & Wallace, 1998) noted that the market had not reacted significantly towadrs these developpments of the firms. overall this study proved the claim of EVA proponents that it helps firms to achieve higher management performance as compared to those who apply traditional performance measurmeant tools. (Rogerson, 1997) studyied the problem that managers of the firm are entrusted the responsibility of making investment decisions for the firm. Since managers' wages are planned on the performance measured by accounting earnings they tend to manupalate these decisions for their own incentives. He concluded that by applying EVA or residual income based performance measures a firm can easily resolve this problem. The paper used a principal-agent model of the relationship among shareholders and managers. Another interesting debate on the effectiveness of EVA over other performance measures of the firms is that how do we actually measure this superiority of one metric over others. This fundamental questions was raised by Gravey & Milbourn (2000) and they reported that the very basic assumtion that the traditional accounting measures explicitly explains all the attributes of the firms' stock price or return is flawed. After relaxing this assumption the researchers presented a formal empirical structure to test this phenomenon in order to come up with a more explanatory performance measure for the firm. Following this study (Austin, 2005) tried to study to set benchmark for formulating strategies of the
C 2016 CURJ, CUSIT
Is Economic Value Added More...

208
firms' operating in a monopolistic position in economy, adopting EVA as the tool for forumating policies for such firms.. Using the case of New Zealand Airways Corporation Limited (ACNZ) which has a monopolistic position, (Austin, 2005) calculated the ACNZ's earnings from time of its inception and after formulating its policies based on the results using EVA metric it proved the that EVA can be effectively used to control monopoly profits for the benefits of the firm and its stakeholders. It further helps in guiding the regulators on how to prepare policies in the interest of general public and industry. EVA metric was successfully able to provide suitable benchmark for pricing and other policies of the monopoly firms. To further prove the case of accounting based measures in a study on the share prices and accounting variables Gallizo & Salvador (2006) applied hierarchical Bayesian analysis to estimate the relevance of accounting matices in explaining the stock prices and evolution. The data for the study were taken from Worldscope database accounting information about cash flow per share and book value per share of NYSE listed cmpanies were taken for the priod of 1992 to 2000. The results validated the previous studies and showed that stock prices are determined on the basis of company life cycle theory. Large firms stocks were affected by the book value of the firm while young or smaller firms' stocks were affected by their cahs flows. Palliam (2006) studied the details about information contents of economic value added and its association with the firm value and stock returns. He took into account one hundred and eight firms which were selected at randome. Out of these thirty three firms were non users of EVA while seventy five firms were the users of EVA. the firm were using EVA for the last five years. Variables included in the study were stockholders' equity, revenue, market value, profits, assets, earnings per share, percentage cost reduction over time and total return to investor. Data from january 1998 to december 2002 were collected using Edgar database and Lexis-nexis database. Using ordinary least square methods (Palliam, 2006) arrived the conclusion which was similar to that of many previous studies that EVA was not proved to be superior to traditional accounting measures in explaining the relative information content. Further he went on to even say that EVA was unreliable or even questionable and invalid in its claim of being a superior matix of performance measurement.
Another study conducted to compare inflation adjusted EVA with nominal EVA and other accounting returns it was reported by Erasmus (2008) that there was no significant prove of the superiority of EVA real over EVA nominal and other traditional accounting reuturns. He (Erasmus, 2008) further highlighted that over EVA was not able to outperform the other accounitng returns in explaining stock returns of the firms. The study took into sample industrial shares listed on Johannesburg Securities Exchange for the priod spaning 1991 to 2005. The data was gathered using McGregor database. This study employed both relative and incremental information content model to study the phenomenon. In a study conducted by Mittal, Sinha & Singh (2008) to find out the linkage between corporate social responsibility (CSR) and economic value added (EVA), they have concluded that there is very little evidance that companies who are having and reporting their code of ethics for CSR could generate more EVA than those companies who do not have code of ethics or they report it in thei annual statements. The data sample for the study consisted of 50 firm taken from S&P CNX Nifty for the years
C 2016 CURJ, CUSIT
Umair Ali Khan et al.
209
2001 to 2005. Statistical tools applied were correlation and regression to find any linkage between the variables under study. The did not prove any significant linkage conclusively about the EVA metric and CSR activities or reporting of the firms.
Shil (2009) descibes in detail the technical aspects of calculating economic value added (EVA) . He explains that the concepts of profit maximization and wealth maximization have become age old and are being considered as somewhat absolete or irrelevant in the context of modern financial needs. (Shil, 2009) further explains that EVA is the most authentic and reliable among all other measures of performance of management. He discusses that the difficulty in calculating EVA arise from the fact that EVA uses accounting data to arrive at economic profit. As the quality and accuracy of these traditional accounitng data vary from firm to firm and economy to economy it becomes very lengthy process and requires qualified and experience persons to deal with it. According to (Shil, 2009) a business that looks to be profitable from accounting point of view might turn out to be unprofitable from economic point of view. For shareholders to know about the performance of management and the actual return that they are getting by investing in a partuclar firm, it is necessary to employ EVA as their standard of measure. As per (Shil, 2009) value maximization is the need of today's financial world, any firm who operates must have an economic justification of its existance. A firm must generate revenue or profit in excess of its cost of capital in order to be called a successful organization.A study conducted by Rompho (2009) to use EVA as capital budgeting tool in a university in order to allocate resources in a better way. (Rompho, 2009) concluded that EVA can be applied in a university to first allocate resources to non-profit ventures of the university in efficient way, and secondly to evaluate the and guide the university management to allocate resources to its for profit ventures in a more profitable manner. Also the study investigated the acceptance of EVA by stakeholders such as staff and students as a measure of resource allocation. (Rompho, 2009) tested this hypothesis using Thammasat University as sample. It was concluded that EVA can help the management of a university to efficiently guide the resource allocation, specially in a environment where unicersities are increasingly becoming autnomous. The stakeholder results also showd a positive acceptance of this measure.In their study on the portfolio strategies Leong, Pagani & Zaima (2009) used economic value added, price to earnings ratio and book to market ratio as three different metrices to select and evaluate a portolfio of of firms from the period of 1995 to 2004. All the data used in the study were taken from the database of Stern Stewart & Company, COMPUSTAT and center for research in security prices (CRSP). The comparisons between the three profolios were statistically tested by T test and Wilcoxon non-parametric test was applied to examine the mean difference between the three protfolios. The reults showed that earnings to price portfolio in line with previous studies proved that the lowest EP and the highest EP stocks proved to be the highest generaters of cumulative returns. Book to market protfolio provided the highest retusn when the BM ratio was lowest means highest deviation between book and market values. And finally economic value added porfolio tend to equal or surpass the returns of EP. However (Leong, Pagani & Zaima, 2009) concluded that there was no significant difference between the portfolios based on either of the three metrices.
Florou and Chalevas (2010) in their attempt to understand the association between
C 2016 CURJ, CUSIT
Is Economic Value Added More...
210
accounting figures and stock returns in Greece found that accounting figures pertaining to disclosures about a firm's operating performance, its growth opportunities and ability to generate profits from sales does actually have affects on its stock returns. They suggest that investors and shareholders actually take into account these informations while valuing firm's stock. For the study they used the official stock returns data available at the datastream. A period of 2004 to 2006 was taken under study with a firm sample size 287 having a total of 861 yearly observations. (Florou & Chalevas, 2010) did proved that different traditional accounting measures are actually very significant in explaining the stock return and its association with them. Following (Florou & Chalevas, 2010) a study conducted by Kumar and Sharma (2011) tried to compare the effects of EVA and accounting earnings on the market value of the firm. This study included 97 firms taken from the Bombay Stock Exchange on the basis of their market capitalization, also the period covered by the study spans from 2000 to 2008 in total they used 873 yearly observations. In this study (Sharma and Kumar, 2011) used pooled ordinary least square regression method to test relative and incremental information content of EVA with traditonal accounting measures of net operating profit after tax, operating cash flow, earnings per share return on net worth in explaining their association with the firms' market value. After empirically testing the variables they did not found evidence to support that EVA is superior performance measure than traditional accounting measures in explaining market value of the firm. The results for the relative information content showed that NOPAT and OCF clearly outperformed EVA in their superiority towards explaining market value. However the incremental information content tests showed a slightly better performance of EVA as compared to other accounting measures in explaining market value of the firm. (Sharma and Kumar, 2011) further emphasized the need to include more factors that might have singnificant impact on the market value of the firm in the future studies such as employees, community satisfaction, customers and product quality etc. In a more recent study Bahri, St-Pierre & Sakka (2011) reported in a study under taken to evaluate EVA as a useful tool to measure the performance of small and medium enterprise (SME), that EVA can be a good tool to measure SMEs' performance provided its is applied along with certain business practices. The study used a sample of 108 Canadian SME manufacturing firms data taken from PDG database. The key business practices identified by (Bahri, St-Pierre & Sakka, 2011) were sales management practices, manufacturing and equipment management practices and working capital management practices. They had concluded that while the results of some practices were visible on EVA within a year, others took more than a year to show their impact on firms performance measured by EVA.
DATA AND VARIABLES
Sample Selection
All the data for this study was gathered from secondary published sources. Major source used is State Bank of Pakistan's report on financial statements analysis of companies (non-financial) listed at Karachi stock exchange. The data for yearend stock prices was taken from Karachi Stock Market Data Portal.
Non probabilistic based convenience sampling technique was applied in the study due
C 2016 CURJ, CUSIT
Umair Ali Khan et al.
211
to the lack of evidence or non availability of data. The firms are selected on the basis of their market capitalization.The sample consisted of the non financial firms listed at Karachi Stock Exchange;financial firms were excluded due to the nature of their accounting data.
Initially a total of 30 firms were selected on the basis of highest market capitalization in the final sample. However two firms were later on removed due to non availability of data. The data pertaining to our variables were taken for the period from 2009 to 2012. The final sample contained a total of 112 annual observations.
Variables Definition
HYPOTHESES OF THE STUDY
H1:The relative information content of EVA is superior to conventional accounting measures (OCF, ROA, ROE, DE and EPSAT) in explaining stock prices
H2: The incremental information content of EVA is higher than conventional accounting measures (OCF, ROA, ROE, DE and EPSAT) in explaining stock prices
MODEL SPECIFICATION
To test the relative information content of EVA and other accounting measures, we follow (Ismail, 2006) and (Kumar & Sharma, 2011):
C 2016 CURJ, CUSIT
Table 3.2.1 Explained variable
Table 3.2.2 Explanatory variables
Is Economic Value Added More...
212
Where the subscript of it represents the firmitime periodt.
To test the incremental information contents, following models were developed which again is in line with (Ismail,2006) and (Kumar & Sharma, 2011).
EMPIRICAL RESULTS
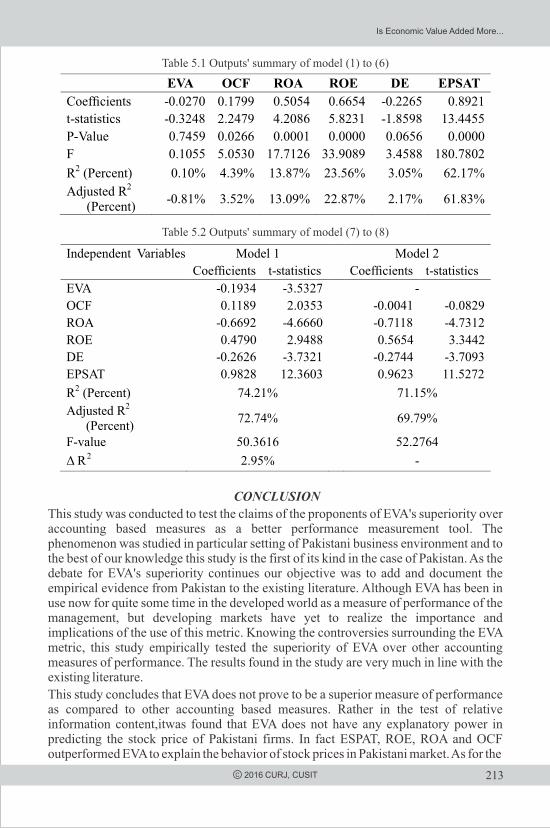
First we hereby test the relative information content of EVA. Where individual regression analysis is run on all the explanatory variables to test which one of the variables provides more information about stock price relatively. In order to normalize the data, all the variables are in natural log form. The resultsare reported in table 5.1 below which indicatesthat all the explanatory variables are significantly explaining the variations in stock prices at 0.05 level of significance, Except for EVA and DE. The adjusted R2 for EVA is negative which is stated to be zero. And the adjusted R2 for DE is 2.17 percent which is again very low. A reason for this could be that as the leverage of the firm increases it becomes unable to explain the stock variation as the higher leverage is not a positive sign for the firm. As for EVA it shows that the economic value added is not considered in valuing stock price by the Pakistani market which could be due to the fact that our investors do not consider it to be an important factor for valuing the firm.
Apart from these two explanatory variables we can see thatearnings per share (EPSAT) has the highest adjusted R2 followed by ROE, ROA and OCF that is 62.17, 23.56, 13.87 and 4.39 percent respectively. These results refute the claims of EVA proponents of its superiority upon traditional accounting measure for explaining the stock price in the case of Pakistan.Therefore our H1 is rejected as EVA fails to prove its superiority to provide more relative information content than accounting measure or rather any ability to explain the stock prices of the firms in Pakistan.
In order to test the hypothesis about the incremental information content of EVA and its superiority over accounting based measures, we run two regression models as explained earlier in equation (7) and (8). The results reported in table 5.2; Model 1 has all the explanatory variables included while model 2 does not include the EVA. An important outcome is that two of the accounting measure ROA and DE has negative beta coefficients in model 1;whereas OCF, ROA and DE have negative beta coefficients in model 2.
All explanatory variables are statistically significant at 0.05 level in model 1. Whereas except OCF the remaining explanatory variables are significant at 0.05 level in model 2. The decision criteria here was the adjusted R2 of the two models which explains that the overall change is measured with 2.95 percent increase. Although it is on the lower side but still it proves the explanatory power of the EVA and hence we fail to reject our H2; that EVA does have incremental information content over other accounting based measures. These results are in line with (Kumar & Sharma, 2011).
C 2016 CURJ, CUSIT
Umair Ali Khan et al.
213
CONCLUSION
This study was conducted to test the claims of the proponents of EVA's superiority over accounting based measures as a better performance measurement tool. The phenomenon was studied in particular setting of Pakistani business environment and to the best of our knowledge this study is the first of its kind in the case of Pakistan. As the debate for EVA's superiority continues our objective was to add and document the empirical evidence from Pakistan to the existing literature. Although EVA has been in use now for quite some time in the developed world as a measure of performance of the management, but developing markets have yet to realize the importance and implications of the use of this metric. Knowing the controversies surrounding the EVA metric, this study empirically tested the superiority of EVA over other accounting measures of performance. The results found in the study are very much in line with the existing literature.
This study concludes that EVA does not prove to be a superior measure of performance as compared to other accounting based measures. Rather in the test of relative information content,itwas found that EVA does not have any explanatory power in predicting the stock price of Pakistani firms. In fact ESPAT, ROE, ROA and OCF outperformed EVA to explain the behavior of stock prices in Pakistani market. As for the
Table 5.1 Outputs' summary of model (1) to (6)
C 2016 CURJ, CUSIT
Table 5.2 Outputs' summary of model (7) to (8)
Is Economic Value Added More...
214
incremental information content EVA although provided a small and marginal explanatory power but still it was so lower that it can be concluded that EVA is also not been able to explain the incremental information content of stock prices and traditional accounting measures.
POLICY IMPLICATIONS AND FUTURE RESEARCH
This study has important policy implications not only for Pakistani market but for overall business researchers and practitioners. It provides a framework for future studies especially in the developing countries like Pakistan. This study provides guidelines for the practitioners and researchers about how the stock prices are reacting relative to accounting based measures and economic value added.
It is suggested that in future research a more elaborate EVA model should be developed that is further decomposable into important constituting parts so that their individual effects can be captured. Also the model should include more explanatory variables with relatively larger sample to capture the unexplained variation in the model.
REFERENCESAbdeen, A. M., & Haight, G. T. (2011). A fresh look at economic value added: Empirical study of the fortune five-hundred companies. Journal of Applied Business Research (JABR), 18(2).
Ahmed, M. (2013). Fiscal Decentralisation and Political Economy of Poverty Reduction: Theory and Evidence from Pakistan (Doctoral dissertation, Durham University).
Ararat, M., & Ugur, M. (2003). Corporate governance in Turkey: an overview and some policy recommendations. Corporate Governance: The international journal of business in society, 3(1), 58-75.
Blau, P. M. (1964). Exchange and power in social life. New York: Wiley.
Austin, L. M. (2005). Benchmarking to economic value added The case of Airways Corporation of New Zealand Limited. Benchmarking: An International Journal, 12 (2), 138 - 150.
Ayyagari, M., Demirgüç-Kunt, A., & Maksimovic, V. (2012). Financing of Firms in Developing Countries: Lessons from Research. World Bank Policy Research Working Paper, (6036).
Bacidore, J. M., Boquist, J. A., Milbourn, T. T., & Thakor, A. V. (1997). The Search for the Best Financial Performance Measure. Financial Analysis Journal, 53 (3), 11 -20 .
Bahri, M., St-Pierre, J., & Sakka, O. (2011). Economic value added: a useful tool for SME performance management. International Journal of Productivity, 60 (6), 603 - 621.
C 2016 CURJ, CUSIT
Umair Ali Khan et al.
Bayldon, N. Z. (1999). Economic Value Added and Market Value Added: A Simple Version and Application. International Journal of Managerial Finance, 5 (2), 84 - 105.
Biddle, G. C., Bowen, R. M., & Wallace, J. S. (1996, October). Does EVA beat earnings? Evidence on association with stock returns and firm values. Journal of Accounting & Economics , 301 - 336.
Biddle, G. C., Bowen, R. M., & Wallace, J. S. (1998). Economic Value Added: Some Empirical EVadence. Managerial Finance, 24 (11), 60 -71.
Brown, P., Beekes, W., & Verhoeven, P. (2011). Corporate governance, accounting and finance: A review. Accounting & finance, 51(1), 96-172.
Erasmus, P. (2008). Evaluating the information content of nominal and inflation- adjusted versions of the measure of Economic Value Added (EVA). 16, 69 - 87.
Florou, C., & Chalevas, C. (2010). Key accounting value drivers that affect stock returns: evidence from Greece. Managerial Finance, 36 (11), 921 - 930.
Gallizo, J. L., & Salvador, M. (2006). Share prices and accounting variables: a hierarchical Bayesian analysis. Review of Accounting and Finance, 5 (3), 268 - 278.
Garvey, G. T., & Milbourn, T. T. (2000). EVA versus Earnings: Does It Matter Which Is More highly Correlated With Stock Returns? Journal of Accounting Research, 38, 209 - 245.
Haddad, F. S. (2012). The Relationship between economic value added and stock returns: Evidence from Jordanian banks. International Research Journal of Finance and Economics, 89, 6-14.
Kim, W. G. (2006). EVA and traditional accounting measures: which metric is a better predictor of market value of hospitality companies?. Journal of Hospitality & Tourism Research, 30(1), 34-49.
Kumar, S., & Sharma, A. (2011). Association of EVA and accounting earnings with market value: evidence from India. Asia-Pacific Journal of Business Administration, 3 (2), 83 - 96.
Mittal, R., Sinha, N., & Singh, A. (2008). An analysis of the linkage between economic value added and corporate social responsibility. Management Decision, 46 (9), 1437 - 1443.
Mohanty, M., & Pattnaik, S. (2013). Information Content of Economic Value Added: Evidence from Indian Software Industry. Asian Journal of Research in Business Economics and Management, 3(12), 11.
215C 2016 CURJ, CUSIT
Is Economic Value Added More...
Mostafa, W., & Dixon, R. (2013). The impact of earnings extremity on information content of cash flow. Review of Accounting and Finance, 12(1), 81-104.
O'Byrne, S. F. (1997). EVA and shareholder return. Financial Practice and Education, 7(1), 50-54.
Pagani, M., & Zaima, J. K. (2009). Portfolio strategies using EVA, earnings ratio or book-to-market Is one best? Review of Accounting and Finance, 8 (1), 76 - 86.
Palliam, R. (2006). Further evidence on the information content of the economic value added. Review of Accounting and Finance, 5 (3), 204 -215.
Ramana, D. V. (2005, December). Market value added and economic value added: Some empirical evidences. In 8th Capital Markets Conference, Indian Institute of Capital Markets Paper.
Ribstein, L. E. (2002). Market vs. regulatory responses to corporate fraud: A critique of the Sarbanes-Oxley Act of 2002. J. Corp. L., 28, 1
Rogerson, W. P. (1997). Intertemporal Cost Allocation and Managerial Investment Incentives: A Theory Explaining the Use of Economic Value Added as Performance Measure. Journal of Political Economy, 105 (4), 770 - 795.
Rompho, N. (2009). Application of the Economic Value Added (EVA) Protocol in a University Setting as a Capital Budgeting Tool. International Journal of Productivity and Performance Management, 7 (2), 1 -17.
Shah, R., Haldar, A., & Rao, S. V. D. (2015). Economic Value Added: Corporate Performance Measurement Tool. Corporate Board, 11(1).
Sharma, A. K., & Kumar, S., (2010). Economic Value Added (EVA) – Literature Review and Relevant Issues. International Journal of Economics and Finance, 2(2).
Sharma, A., & Kumar, S. (2012, February). EVA versus conventional performance measures–empirical evidence from India. In ASBBS Annual Conference: Las Vegas.
Shil, C. N. (2009). Performance Measure: An Application of Economic Value Added. International Journal of Business and Management, 4 (3), 169 - 177.
Stern, J.M., Stewart, G.B. III and Chew, D.H. (1994), The EVA financial management systems, Journal of Applied Corporate Finance, 7 (2), 32-46.
Stewart, G.B. III (1991), The Quest for Value, Harper Business, New York, NY
Tamamy, E., & Awad, M. (2014). Investigating the Explanatory Power of Economic Profits (Eva®) versus Accounting Profits on Stock Returns as a Measure of Shareholders Wealth Creation. An Empirical Study of the FTSE 100.
216 C 2016 CURJ, CUSIT
Umair Ali Khan et al.
217
THE EFFECTS OF PERSONAL DETERMINANTS ON JOB SATISFACTION OF PUBLIC AND PRIVATE UNIVERSITIES'
ACADEMICIANS IN PAKISTANZekeriya Nas*
ABSTRACT
Job satisfaction has always a concern of an employee and employer. Therefore, investigating its determinants is of value for the both. This study addresses this very important issue among public and private universities academicians in Pakistan. This is a survey research carried on teaching staffs working in different public and private sector universities of Pakistan. Questionnaires were administered to a list of 79 focal persons, who further distributed the subject questionnaire among 600 faculty members, selected from Higher Education Commission (HEC) recognized universities. A total of 410 responses received. Data has been analyzed using SPSS. Results demonstrated that there is a positive impact of independent variables on the dependent variable among the subject population. However, the level of personal determinants of job satisfaction differs from variable to variable. The survey concluded with the facts that academicians were generally satisfied with their current job condition, environment in Pakistani public and private universities. The research has both theoretical and practical implications. Theoretically the results would help in enriching the current body of knowledge on job satisfaction among academicians in developing countries. While practically, these results would provide guidelines to policy makers to better understand and critically look into these relationships for positive improvements to promote positive employee attitudes and behaviors. The findings can be generalized to other settings keeping all other things constant. Teaching at the university level is a highly honorable career and academicians are always boons to their societies where they are working. However, the extant literature shows that universities academicians' job satisfaction is under-researched area in terms of organizational and personal determinants particularly in the public & private sector institutions in Pakistan. So, the recent survey can contribute to address that gap. The research has all the limitations of a survey research. So this survey is limited to the public & private universities sector only. Thus, the results can be generalized to other industrial sectors to a restricted limit.
Keywords: Job satisfaction, Pakistan, Academicians' job satisfaction, Personal determinants
INTRODUCTION
An understanding of the factors relating to job satisfaction is important for an organization. Well satisfied academicians are generally innovative, productive and motivated to establish and maintain an environment conducive to learning (Schulze, 2006). Personal determinants such as department/branch, gender, age, qualification,
City University Research JournalVolume 06 Number 02 July 2016 PP 217-228
*Associate Professor, Human Resource Development, Yuzuncu Yil University, Van/Turkey,Email: [email protected]
C 2016 CURJ, CUSIT

218
education, designation, and marital status of the employees have commonly been found critical in defining job satisfaction in any organization (Nawaz & Jan, 2012). That is the education which is the most significant institutional association of a nation as it plays a vital role in the development of any nation. By developed education, nations can stand on their feet. It is observed that developing country; Pakistan gives the importance of quality of education sector. In this era of struggle government also desires to make investments in education sector. Highly qualified academicians are the cornerstone, pillars of both successful education system and developing of a country as well.
That is why, it is crucial to pay attention to academicians' job satisfaction. It is believed that an encouraging and in good physical shape university arrangement can be provided by increased academicians' job satisfaction. This situation will help improving both the learning environment and the output of any university (Khalid, Irshad, & Mahmood, 2012; Nas, 2006). That is why it has been claimed that “the future of the nation is shaped in her classrooms” (Agnihotri, 2013). And it is vital because HEIs play a key role for any association of a country in order to develop the nation (Basak, 2014). That is the universities that create and develop knowledge as constructing a modern world (Masum, Azad, & Beh, 2015).
Researchers (e.g., Nawaz & Jan, 2012) agreed that satisfied academicians are happy and happy ones are hold positive attitudes and sensitivities towards their universities. Hence, success of the universities depends on their job satisfaction. The advantage of employees having high level of job satisfaction is that they commit their time, energy and also efforts. This is one of the way helping having high level of productivity (Ayele, 2014). However, job satisfaction is a complex construct to understand. Different determiners are tested as the predictors of job satisfaction or dissatisfaction. Therefore, investigators emphasize its analysis to understand employees' attitudes (Nawaz & Jan, 2012).
Job satisfaction is dynamic. Job satisfaction is generally a complex phenomenon that is influenced by many variables. The level of job satisfaction influences the performance of academicians. It is believed that many academicians have often investigated the others job satisfaction but has less been studied their own job satisfaction whereas academicians are a unique group worth studying (Schulze, 2006). Hence, various investigations must have been conducted in order to identify which factors might increase the job satisfaction among academicians of universities (Bilal, 2012).
LITERATURE REVIEW
2.1. Job satisfaction in institutions of Higher Education
Extant literature has discussed a number of variables that contribute to the level of job satisfaction of academics in HEIs. There are several factors affecting job satisfaction such as the quality of employees' relationships with their supervisors, the physical environment quality of the job (Ololube, 2006). Variables believed to affect job satisfaction include work environment, pay, work, coworkers, having satisfactory work apparatuses, resources, instruction chances, associations with member workers, supervision, corporation strategy and support, salary, promotion and progress,
C 2016 CURJ, CUSIT
Zekeriya Nas
219
promotion, supervision, etc. (Azim, Haque, & Chowdhury, 2013; Rehman, Saif, Khan, Nawaz, & ur Rehman, 2013). According to the result of the Hawthorne studies, the more staffs were gratified with their works, the more job fulfillment could be translated into high productivity (Dwaikat & Nazzal, 2010). In other words, job satisfaction is a combination of attitudes formed by a number of factors related to the employee's job and job environment (Sevimli & Iscan, 2005).
Therefore, various studies have been conducted on academicians' job satisfaction. The main reason is that the consequence of job satisfaction is very vital for long term developing of any educational organization around the world (Dwaikat & Nazzal, 2010). Job satisfaction among academicians has more deep implication for the society as they are considered role models for the students and for their respective societies.
As job satisfaction is an emotional state related to the positive or negative appraisal of job experiences (M. E. Malik, Nawab, Naeem, & Danish, 2010). Academicians with their various positive crucial responsibilities in education, their job satisfaction affects the overall performance of universities. The number of universities in Pakistan is increasing hence academicians may face more problems in their job environments and job satisfaction (Bhatti, Hashmi, Raza, Shaikh, & Shafiq, 2011). A nation's future is linked with their teachers. Until and unless a nation hasn't effective, knowledgeable, skillful, experienced academicians, a nation cannot find its correct place in developed countries (Rehman et al., 2013).
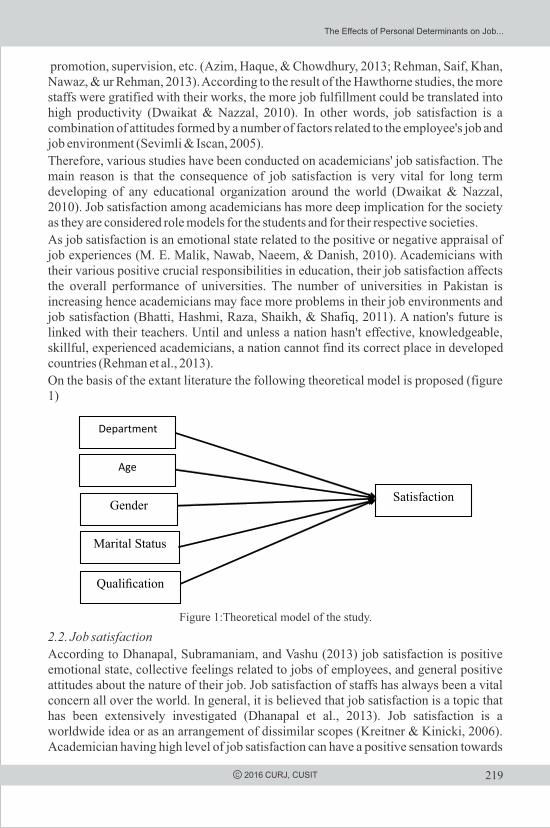
On the basis of the extant literature the following theoretical model is proposed (figure 1)
2.2. Job satisfaction
According to Dhanapal, Subramaniam, and Vashu (2013) job satisfaction is positive emotional state, collective feelings related to jobs of employees, and general positive attitudes about the nature of their job. Job satisfaction of staffs has always been a vital concern all over the world. In general, it is believed that job satisfaction is a topic that has been extensively investigated (Dhanapal et al., 2013). Job satisfaction is a worldwide idea or as an arrangement of dissimilar scopes (Kreitner & Kinicki, 2006). Academician having high level of job satisfaction can have a positive sensation towards
C 2016 CURJ, CUSIT
Figure 1: Theoretical model of the study.
The Effects of Personal Determinants on Job...

220
his/her work while one who is hopeless with the work can grip a undesirable attitude toward his/her job (Robbins & Coulter, 2005), and happy and satisfied academicians do their jobs much better (Karaman & Altınoğlu, 2007) and significantly affect the success of organization (Kinzl et al., 2005). Therefore, job satisfaction refers to how well a worker's hopes at work are in tune with products (Rehman et al., 2013).
2.3. Job satisfaction and department
Job satisfaction can be affected by a variety of variables. The results of several investigations show that there are numerous factors significantly influencing the job satisfaction. One of them is the department/branch where he/she is working. Academicians spend so much time in their department each week and they are more satisfied with their current job. It is believed that working conditions have positive impact upon the job satisfaction. Providing productivity environment in the departments much more efficiently contributes to job satisfaction as well. A department which is interesting, challenging, and which provides other amenities will be a source of satisfaction (Pisani, 2009) for the academicians serving there compared to the one which is boring and monotonous. According to Kumaş and Deniz (2010) there were significant differences among departments/branches in terms of job satisfaction of teaching staffs. On the basis of this we put the following hypothesis to test:
H1: There is a significant relationship between department and job satisfaction of public and private universities academicians in Pakistan.
2.4. Job satisfaction and age
Age is one of the variables influencing job satisfaction. A number of studies have been conducted in various countries on the effects of age on the general level of job satisfaction among academicians. Positive relationship between age and job satisfaction has empirically been found. Young people have been with low of job satisfaction as their morale is high. But with the passage of time and advancing age job satisfaction increases. It has been found out that older academicians were more satisfied than the younger ones (Dwaikat & Nazzal, 2010). Satisfaction increases with the increase in age. The reason to this is increase in adaptation due to experience (Sevimli & Iscan, 2005). Noordin and Jusoff (2009) asserted that age affected the job satisfaction level of academicians in Malaysian public university. Baş and Ardıç (2002) also stated that age has significant and positive effects on job satisfaction of academicians as overall job satisfaction increases with age. However, there are studies (e.g., Agnihotri, 2013) declared that younger teachers were significantly higher than older teachers in job satisfaction of educational institutions. On the basis of this we put the following hypothesis to test:
H2: There are no significant differences among departments regarding the factors measuring their job satisfaction of public and private universities academicians in Pakistan.
2.5. Job satisfaction and gender
Gender issues are very common across different cultures. There are divided opinions on
C 2016 CURJ, CUSIT
Zekeriya Nas

221
the impact of gender on job satisfaction. That is why for many researchers the relationship between job satisfaction and gender differences are confusing as some of them find women to be more satisfied than men while some of them find men are more satisfied than females (Azim et al., 2013). However, according to Ali and Akhter (2009) and N. I. Malik (2011), gender of academicians does not have vital impacts on the job satisfaction of academicians. And it can be said that various scholars have investigated job satisfaction across different fields on gender differences but not that much especially in education sector, universities. But it has been found out that especially female academics at higher rank were more satisfied with their jobs than male academicians. Although the interface effect of rank and gender does affect the complete job satisfaction among the university academicians, but gender itself does not affect job satisfaction of academicians (Dhanapal et al., 2013).
So it can be said that there is not a consensus related to this variable as some of them found. The reason of this difference depends on their different types of expectations from their job environment. Males and females differ in terms of job related values as female academicians place much more value on the social factor of a work while males place much more value on the opportunity for self-expression in their works (Azim et al., 2013). Agnihotri (2013) and Ahmadi and Keshavarzi (2012) asserted that female teachers were considerably higher in job satisfaction than their male coworkers in work environments. It is believed that job satisfaction varies also on male and female attitudes (Dwaikat & Nazzal, 2010). On the basis of this we put the following hypothesis to test:
H3: There is a significant relationship between age and job satisfaction of public and private universities academicians in Pakistan.
2.6. Job satisfaction and marital status
Lack of job satisfaction among academicians can lead low performance (Ofuani, 2010). Marital status is another personal characteristic that affects job satisfaction. In this regard the number of studies is limited. Generally, it is claimed that married academicians are more satisfied with their jobs than their unmarried ones (Azim et al., 2013). In contrast, according to Wong and Heng (2009), unmarried academicians have been found more significantly satisfied with their job environment than married ones. And according to Ali and Akhter (2009) unmarried males are less job satisfied than the married ones. On the basis of this available information we put the following hypothesis to test:
H4: There are no significant differences among faculty members of different age levels regarding factors measuring their job satisfaction of public and private universities academicians in Pakistan.
2.7 Job satisfaction and qualification
The general opinion concerning the relationship between qualification and job satisfaction is that there isn't a direct correlation as job satisfaction is not increasing when employee has highly the amount of formal education (Dwaikat & Nazzal, 2010). But Smith (2007) asserted that an employee who has higher, formal education has higher job satisfaction. Eyupoglu and Saner (2009) also agreed that job qualification
C 2016 CURJ, CUSIT
The Effects of Personal Determinants on Job...
222
was a reliable determinant of job satisfaction of academicians that academicians at higher qualification generally were much more satisfied with their jobs comparing to academicians at lower qualification as overall job satisfaction increases progressively with qualification. According to the findings of Baş and Ardıç (2002), the contribution of qualification to the job satisfaction of academicians is not significant. The reason is that old people have more positive attitudes. And highly qualified academicians are the cornerstone of a successful system of a nation. On the basis of this available information we put the following hypothesis to test:
H5: There is a significant relationship between gender and job satisfaction of
public and private universities academicians in Pakistan.
METHODOLOGY
The current study is a qualitative study and the type is survey. The population for the study is public and private universities academicians in Pakistan. The non-probability sampling technique was used. Survey questionnaires were distributed among six hundred and from four hundred and ten academicians completed the questionnaires by university bachelor degree or equivalent, university MS/MPhil degree, assistant professor, associated professor, and full professor working in different public and private sector universities in Pakistan such as the universities in capital city Islamabad, Quetta, Karachi, Lahore, Peshawar, Faisalabad and, etc. The questionnaire included 5 personal determinants such as department, age, gender, marital status and qualification. To measure the perception of the participants and 5-point Likert scale has been used.
For this research the scales of Dyne, Ang, and Botero (2003), Vakola and Bouradas (2003) were used. Included with each questionnaire was a cover letter explaining the importance of the survey. Participants were asked for completing the questionnaire on their own time and return it. A total of 600 questionnaires were distributed out of which 410 received back complete in all respects. This constituted a response rate of 68.3%. All the data collected was analyzed using SPSS-18.
3.1. Correlation analysis
To see whether the determinants in the study are measuring the same construct, correlation analysis was conducted on the data. Table reports the results of the correlation analysis. Results in table 1 demonstrate that the determinants are neither very highly correlated (except age with marital status and qualification which is 0.50) nor uncorrelated. From these results it is very easy to conclude that the determinants—department, age, marital status and qualification—are measuring the same construct of job satisfaction.
C 2016 CURJ, CUSIT
Zekeriya Nas

223
3.2. Department
The first personal determinant is department/field. Findings reveal some diverse perceptions among the academicians. There is no uniformity in the level of satisfaction among various departments. The cumulative R² is 0.25 which means that 25% variation in performance is explained by this variable. This means that there is a positive and significant effect of this determinant on job satisfaction of academicians in the subject population. On the basis of these statistical it can be conclude that the data supports the first hypothesis.
3.3. Age
The second personal determinant is age. Findings from the statistical analysis about this variable are also diverse. Majority of academicians has been found between 25-35 with 63.5% followed by the age group 36-45 with 22.1% and then by the age group 56 and above with the 11.4%. The cumulative R² is 0.36 which means that 36% variation in performance is explained by this variable. This means that there is a positive and significant effect of this determinant on job satisfaction of academicians in the subject population. On the basis of these statistical it can be conclude that the data supports the second hypothesis.
3.4. Gender
The third determinant in this study is gender of the academicians. Findings of this survey show that the majority of academicians of universities in Pakistan are male with 52.0% while percentage of female is 48.0%. This finding emerged that the percentage of male and female academicians are almost equal in developing country Pakistan. The results of the study show that there are no significant differences of the level of job satisfaction among male and female as their means are almost the same; male with mean of 3.69 and female with mean of 3.63. The cumulative R² is 0.42 which means that 42% variation in performance is explained by this variable. This means that there is a positive and significant effect of this determinant on job satisfaction of academicians in the subject population. On the basis of these statistical it can be conclude that the data supports the third hypothesis.
C 2016 CURJ, CUSIT
Table 1: Correlations results among the variables of the study (n=410)
The Effects of Personal Determinants on Job...
224
It can said that the findings of this study support the previous studies, e.g., Dwaikat and Nazzal (2010); Tasnim (2006) and Olorunsola (2010) showed that there were significant different level of job satisfaction among male and female employees.
3.5. Marital status
The fourth determinant in this study is marital status of the academician. It is generally presumed that married employees are much more satisfied with their jobs than their unmarried counterparts. The main reason might be that marriage enforces a wider scope of responsibilities. And this situation can make job much valued and essential job. But the results of this study have found out that male academicians were less satisfied than female academicians. However, the level of the married academicians is almost double higher than the single ones. And it can be said that universities in Pakistan prefer hiring married academicians. The cumulative R² is 0.21 which means that 21% variation in performance is explained by this variable. This means that there is a positive and significant effect of this determinant on job satisfaction of academicians in the subject population. On the basis of these statistical it can be conclude that the data supports the fourth hypothesis.
The results of the previous studies like Nayak and Nayak (2014) supports the outcomes above as marital status found to be a significant contributor to overall job satisfactions.
3.6. Qualification
The last determinant in this study is qualification of the academicians. Statistics of the sample show that the major group is with MS. MPhil with 44.5% while the second highest percentage holds Bachelor Degree with 25.4%. The highest job satisfaction of academicians of public and private universities has been found among full professor followed by the assistant professors. The cumulative R² is 0.53 which means that 53% variation in performance is explained by this variable. This means that there is a positive and significant effect of this determinant on job satisfaction of academicians in the subject population. On the basis of these statistical it can be conclude that the data supports the fourth hypothesis.
3.7. Multiple regression analysis
As we have five independent variables that presumable affect the dependent variable—job satisfaction. To check the over all effects of these five independent variables on the dependent variable multiple regression technique was applied. The R² is 0.598 which means that nearly 60% variation in performance is explained by the five independent variables. This means that there is positive and significant effect of these determinants on job satisfaction level of the academicians in the subject population. Individually, the highest effect is that of qualification followed by the gender of the academicians. The comparatively least effect has been found This is followed by age in the reverse order. On the basis of the results of the correlation analysis and regression analysis the hypotheses have been supported (though with varying degrees) by the empirical data of the study.
C 2016 CURJ, CUSIT
Zekeriya Nas

225
CONCLUSION AND RECOMMENDATION(S)
Overall it can very easily be said that job satisfaction of academics can be influenced by a variety of variables e.g. pay, work, the quality of the physical environment, department/branch, age, gender, marital status, and qualification, etc. Extant literature is replete with empirical evidence of direct and indirect effects of such determinants on the level of job satisfaction. Job satisfaction of academicians has become a serious variable in the management of educational institutions such as universities as it is one of the most important elements that affects other behaviours like productivity, absenteeism, and turnover.
The findings of this study have found consistent with the findings of the previous researches in the field. The results of this study indicate that all academicians enjoy more than moderate level of job satisfaction. The results of this study reveal all personal determinants are a positive contributor to overall job satisfaction. Their contributions to overall job satisfaction are found to be more than moderator and the overall value is good from which one can concluded that these determinants need not be ignored. With these findings it can be said that the most of academicians working in the universities in Pakistan are satisfied with their job environment.
The critical nature of job satisfaction of academicians has widely been acclaimed (Agnihotri, 2013; Dhanapal et al., 2013) because it is related to improvement and progress of universities. The universities are required to give serious note to this issue. The academicians with high job satisfaction generate high success, performance. Satisfied academicians can provide in-depth knowledge, academic development, coordinate national and international development, improvement, and innovation demands, and of course, educate students. That is why, job satisfaction of academicians has very serious implication for the management of any organization including universities (Eyupoglu & Saner, 2009).
The results of this study may be treated as sufficient eye opening realities of the management of any university (both private and public) to take serious note of the job satisfaction of their respective employees. Therefore, they need to ensure and provide a conducive job environment to the academicians in order to meet the growing demand of universities' students. Hence, in order to improve the job satisfaction of academics, it is crucial that the universities should understand the requirements of their academicians and make available what is best for them.
REFERENCES
Agnihotri, A. K. (2013). Job satisfaction among school teachers. Indian Streams
Research Journal, 3(2).
Ahmadi, S., & Keshavarzi, A. (2012). The Study of Islamic Azad University Faculty Members' Job Satisfaction. Procedia-Social and Behavioral Sciences, 46, 151- 156.
Ali, T., & Akhter, I. (2009). Job satisfaction of faculty members in private universities-
In context of Bangladesh. International Business Research, 2(4), p167.
C 2016 CURJ, CUSIT
The Effects of Personal Determinants on Job...
226
Ayele, D. (2014). Teachers' job satisfaction and commitment in general secondary schools of Hadiya Zone, in southern nation nationality and people of regional state. Jimma University, Institute of Education and Professional Development Studies.
Azim, M. T., Haque, M. M., & Chowdhury, R. (2013). Gender, Marital Status and Job Satisfaction an Empirical Study. International Review of Management and Business Research, 2(2), 488-498.
Baş, T., & Ardıç, K. (2002). A comparison of job satisfaction between public and private university academicians in Turkey. METU studies in Development, 29(1-2), 27-46.
Basak, S. K. (2014). A comparison of University academics job factors: satisfaction and dissatisfaction.
Bhatti, N., Hashmi, M. A., Raza, S. A., Shaikh, F. M., & Shafiq, K. (2011). Empirical Analysis of Job Stress on Job Satisfaction among University. International Business Research, 4(3), p264.
Bilal, H. (2012). Job satisfaction of university teachers: Impact of working conditions and compensation. Review of Integrative Business and Economics, 1(1), 101- 120.
Dhanapal, S., Subramaniam, T., & Vashu, D. (2013). Factors affecting job satisfaction among academicians: A comparative study between gender and generations. International Journal of Management Excellence, 2(1), 128-139.
Dwaikat, M., & Nazzal, M. (2010). The Effect of Job Sastisfaction on the Performance of Nursing Educators among Nursing Faculties in West Bank. Master Degree An-Najah National University, Faculty of Nursing.
Eyupoglu, S. Z., & Saner, T. (2009). Job satisfaction: Does rank make a difference. African Journal of Business Management, 3(10), 609-615.
Karaman, F., & Altınoğlu, A. E. (2007). Kamu üniversiteleri öğretim elemanlarının iş tatmini düzeyini etkileyen faktörler. Yönetim ve Ekonomi: Celal Bayar Üniversitesi İktisadi ve İdari Bilimler Fakültesi Dergisi, 14(1), 109-120.
Khalid, S., Irshad, M. Z., & Mahmood, B. (2012). Job satisfaction among academic staff: A comparative analysis between public and private sector universities of Punjab, Pakistan. International Journal of Business and Management, 7(1), p126.
C 2016 CURJ, CUSIT
Zekeriya Nas
227
Kinzl, J., Knotzer, H., Traweger, C., Lederer, W., Heidegger, T., & Benzer, A. (2005).
Influence of working conditions on job satisfaction in anaesthetists. British
Journal of Anaesthesia, 94(2), 211-215.
Kreitner, R., & Kinicki, A. (2006). Management of organizational behavior (concepts,
theories & applications). Pooyesh publication.
Kumaş, V., & Deniz, L. (2010). Öğretmenlerin iş doyum düzeylerinin incelenmesi.
Malik, M. E., Nawab, S., Naeem, B., & Danish, R. Q. (2010). Job satisfaction
and organizational commitment of university teachers in public sector of
Pakistan. International Journal of Business and Management, 5(6), p17.
Malik, N. I. (2011). Level of job satisfaction among university and college men and
women teachers. Interdisciplinary Journal of Contemporary Research in
Business, 3(3), 750.
Masum, A. K. M., Azad, M. A. K., & Beh, L.-S. (2015). Determinants of Academics' Job
Satisfaction: Empirical Evidence from Private Universities in Bangladesh.
PloS one, 10(2), e0117834.
Nas, Z. (2006). The Effects of Universities on Urban Culture and an Application:
Yuzuncuyıl University-Van Case (Vol. I). Van/Turkey: Van Municipality
Culture Publications.
Nawaz, A., & Jan, F. A. (2012). Impact of Demographic Diversities on the Job
Satisfaction and its Consequences: Case of Academicians in Higher Learning
Institutions of Pakistan. Global Journal of Management And Business
Research, 12(19).
Nayak, N., & Nayak, M. (2014). A study of job satisfaction among university teachers in
India. ZENITH International Journal of Multidisciplinary Research, 4(4), 30-
36.
Noordin, F., & Jusoff, K. (2009). Levels of job satisfaction amongst Malaysian
academic staff. Asian social science, 5(5), p122.
Ofuani, F. (2010). An analysis of factors affecting job satisfaction of women in paid
employment in Benin City. Edo Journal of Counselling, 3(1), 123-131.
Ololube, N. P. (2006). Teachers Job Satisfaction and Motivation for School
Effectiveness: An Assessment. Online Submission.
C 2016 CURJ, CUSIT
The Effects of Personal Determinants on Job...

Olorunsola, E. (2010). Job satisfaction and gender factor of administrative staff in South West Nigeria universities. Contemporary Issues in Education Research (CIER), 3(10), 51-56.
Pisani, K. (2009). Education as related to job satisfaction and health. Rehman, K., Saif, N., Khan, A. S., Nawaz, A., & ur Rehman, S. (2013). Impacts of job satisfaction on organizational commitment: a theoretical model for academicians in HEI of developing countries like Pakistan. International Journal of Academic Research in Accounting, Finance and Management Sciences, 3(1), 80-89.
Robbins, S. P., & Coulter, M. (2005). Management: International Edition: New Jersey: Pearson Prentice Hall.
Schulze, S. (2006). Factors influencing the job satisfaction of academics in higher education. South African Journal of Higher Education, 20(2), p. 318-335.
Sevimli, F., & Iscan, Ö. F. (2005). Bireysel ve is ortamina ait etkenler acisindan is doyumu. Ege Academic Review, 5(1), 55-64.
Smith, T. W. (2007). Job satisfaction in the United States.
Tasnim, S. (2006). Job Satisfaction among Female Teachers: A study on primary schools in Bangladesh.
Wong, E. S. K., & Heng, T. N. (2009). Case study of factors influencing jobs satisfaction in two Malaysian universities. International Business Research, 2(2), p86.
228 C 2016 CURJ, CUSIT
Zekeriya Nas

229
IMPACT OF PRINCIPAL'S AGE AND ADMINISTRATIVE EXPERIENCE ON CONFLICT MANAGEMENT STYLES AT
SECONDARY SCHOOL LEVELDr. Saima Batool*, Dr. Sajid Rahman Khattak** and Mr. Zafar Saleem***
ABSTRACT
Aim of this research study was to determine impact of principal's age and experience on conflict management style at secondary school level. Total 100 principals were selected from public sector schools and private sector schools as sample of the study. Reginald Adkins (2006), Conflict Management Style Questionnaire was used for data collection. Regression Analysis, t-test and Mean score comparison was used for data interpretation. Result shows that there was insignificant relationship of the principal's age and experience with conflict management styles. Collaborating conflict management style was most dominant style of conflict resolution while avoiding conflict management style was less preferred. There was significant difference between public school principals and private school principals regarding most preferred conflict management styles. On the basis of findings, several recommendations are given to improve teaching and learning environment in schools.
Keywords: Principal's age, conflict management style, administrative experience
INTRODUCTION
Effective leadership needs fundamental and critical skills to resolve conflict in the organization. Those leaders who are able in managing conflicts in effective way are perceived to be more competent and productive (Gross & Gurerro, 2011). Lack of competency in conflict management skills tend to have detrimental impact on organization productivity. Conflict management is defined in different ways. According to Stermanan (2010), conflict management is a process through which parties which are in dispute resolve their differences and come to an agreement. Conflict arise in situation where there arise differences in opinions regarding some issue or problem.
The term “Conflict management” gained it importance from the Black & Mounton (1964) leadership theory of Managerial Grid. Managerial grid divide leadership in two broad categories, one is concern for people and the second is concern for production. According to managerial grid, an individual can be rated on scale of one to nine according to their concern for people and for production (Janet Wagude, 2015). Those individuals who are inclined towards concern for production indicates a strong desire to accomplish personal objectives and goals. Those persons who are inclined towards concern for people shows desire to build and maintain strong personal relationship. Managerial grid has identified five type of conflict management styles. These are (1):
City University Research JournalVolume 06 Number 02 July 2016 PP 229-241
*HoD, Department of Management Sciences, Qurtuba University of Science and Information Technology, Peshawar. Email: [email protected] **Assistant Professor, Department of Management Sciences, Qurtuba University of Science and Information Technology, Peshawar***PhD Scholar, NUML, Islamabad
C 2016 CURJ, CUSIT
230
Smoothing (low concern for people and high concern for production), (2): withdrawing (low concern for people and production), (3): compromising (medium concern for people and production), (4): problem-solving (high concern for both people and production), and (5): forcing (low concern for people and high concern for production). An effective leader may possess one of these conflict management style to resolve issues in the organization (Janet Wagude, 2015).
Conflict is the art of coming into clash or collision with other person. It is the situation where a person feel to be in opposition or in variance with other people. It is also regarded as a tension which is experienced when people feel that their needs and desires are ignored or denied in the organization. Conflict is the state of disharmony which arise as a result of differences in attitude, impulses, desire, and needs. It is form of disagreement between two parties or persons (Vivar. 2006). Conflict does not always has bad effect on the performance of organization. Sometime conflict has sound influence on the development of interpersonal relationship in the organization or at work place. It is due to conflicting issues that managers make sure maintaining interpersonal relationship in the organization. Managing conflict in constructive manner and developing effective procedures for conflict resolution encourages development of social values, knowledge, attitude, and civic standard in the organization. Conflict has both positive and negative consequences in the organization. So it is essential for leader to analyze conflict and mange it most effectively (Fogler, et al. 1997).
Different researchers have identified two major type of conflict at work place. These conflict generally based on task or effect. Task conflict is also known as cognitive conflict and it is related with issues that emerge as a result of disagreement among team members that focus on the attainment of common objectives and common organizational goals (Ababakar, 2005). The second type of conflict which is affect conflict is also described as interpersonal conflict. It is related to issues that emerge as a result of personality clashes or emotional interaction among team members in the organization (Adeyemi. 2009). Conflict may be intrapersonal and interpersonal. Intrapersonal conflict occurs within an individual himself especially when he feels frustration in accomplishing his goals and objectives. Conflict is interpersonal if it occurs among different individuals in the organization (Akinnubi, et al. 2012).
Educational institutions also experience conflicting situations. Conflict management is not only restricted to school setting but it can also be linked to many other disciplines. It is essential for school principal to take active role in filed practice in order to embrace effective management skills that are needed for smooth running of school and effective teaching and learning process. It is imperative for school principal to recognize conflict at first hand and take strong initiative for its resolution. Principals should take collective judgment in order to overcome his personal biases. It is also important for principal to accept his realistically his strength and weaknesses for conflict management. Effective principal accept conflict as part and parcel of all social organization. An effective school principal has artistic insight and technical skills for conflict management in the school. Such principal offers timely assistance to his subordinates in resolving conflicting situation (Ghafar, 2011).
C 2016 CURJ, CUSIT
Dr. Saima Batool et al.
231
Statement of the Problem
Conflict is regarded as significant and powerful tool of change in any organization. It depends on the existing situation whether it has positive or negative result. School is an important social organization of the society and it is also replete with conflict. Conflict generally emerges between teachers and principal and some time among teachers. This study explores how principal's age and administrative experience impact his conflict management style. This research also determines to find out significant difference between public school principals and private school principals regarding conflict management styles.
OBJECTIVES OF THE STUDY
Main objectives of this research study were
1. To determine significant relationship between principals' age and conflict management styles.
2. To determine significant relationship between principals' teaching and administrative experience and conflict management styles.
3. To find out dominant conflict management styles among secondary school principals.
4. To find out significant difference between public school principal and private school principal regarding conflict management styles.
RESEARCH HYPOTHESES
H1: There is significant relationship between principals' age and conflict management styles.
H2: There is significant relationship between principals' administrative experience and conflict management styles.
H3: There is significant difference between public school principal and private school principal regarding collaborating conflict management styles.
H4: There is significant difference between public school principal and private school principal regarding competing/authoritative conflict management styles.
H5: There is significant difference between public school principal and private school principal regarding avoiding conflict management styles.
H6: There is significant difference between public school principal and private school principal regarding accommodating conflict management styles.
H7: There is significant difference between public school principal and private school principal regarding compromising conflict management styles.
LITERATURE REVIEW
The type and nature of conflict that occurs in organization is different from the conflict of other organization. This difference in the occurrence of conflict is due to the nature and structure of the organization and also the conflict management skills of the leader. Conflict is essential for change in the organization (Whetten, D. A., Cameron, K. S., & Woods, M., 2000; Vivar, 2006). In educational institution, the common type of conflict
C 2016 CURJ, CUSIT
Impact of Principal's Age and Administrative Experience...
232
is that emerges between staff members and school principals. Sometime conflict may also occurs among teachers in the school and it also needs principal's management skills in resolving issues among teachers. According to Okorie (2002), principal's personal characteristics play significant role in developing his management skills. Principal's age, his teaching and administrative experience, academic qualification, and sex cannot be divulge from the manner and ways that principal's adopt for running and managing school effectively (Hallinger, P., Bickman, L., & Davis, K., 1996; Taiwo, 2010). Those principals who have vast teaching and administrative experience perform better in motivating the teaching staff and non-teaching staff members for accomplishing school goals and objectives (Ike, 2000; Kember, D, 2016.).
Conflict is also a part of school life because different teachers are serving in school. These teachers belong from different background and they have varying ideas and opinions. Teachers have vast individual differences and it often result in conflicting situation in the school. These individual differences among teachers and principal sometime cause great damage to the smooth running teaching and learning process in the school. It is essential for school principal that he must have conflict management skills. In managing conflict effectively, it is necessary for school principal to know the reason behind conflict and how conflict will influence school system (Albert, 2001). Conflict management styles of school principal indicates that how principal interact with other teachers. Different principals have different styles of conflict management in the school. Research study of Kumar, (2012) indicated that principal's conflict management styles are related to efficiency, productivity, and effectiveness in the school system.
In a research study, Ziaee (2012), concluded that in primary school principal, accommodating style of conflict management is most effective while competing style of conflict management has least efficiency. He also concluded that applying compromising and collaborative conflict management style in training institutions showed better result in resolving conflicting issues. It was declared in the research study of Rajabi (2012) that accommodative conflict management style was the dominant styles among school principals. In the research study of Sterman (2010), it was concluded that collaborative management style of school principal create conducive environment in the school and it leads to achievement of learning objectives in effective way. It was also found that avoiding conflict management style of school principals had positive and significant relationship with school performance. Adeyemi (2011) concluded that conflict management styles of school principal has positive relationship with school effectiveness and school efficiency. However conflict management styles of principals vary according to their age, gender, and teaching and administrative experience.
A research study was conducted by Rahim, (1983) to examine relationship between principal's age and his conflict management styles on teachers' job performance. Result showed that compromising management style was the dominant conflict management style of secondary school principal while competing management style was less preferred conflict management style among secondary school principals (Cheng, 1994). It was also concluded in the research study of Janet (2015) that principals having different age had different dominant conflict management styles at secondary schools in
C 2016 CURJ, CUSIT
Dr. Saima Batool et al.
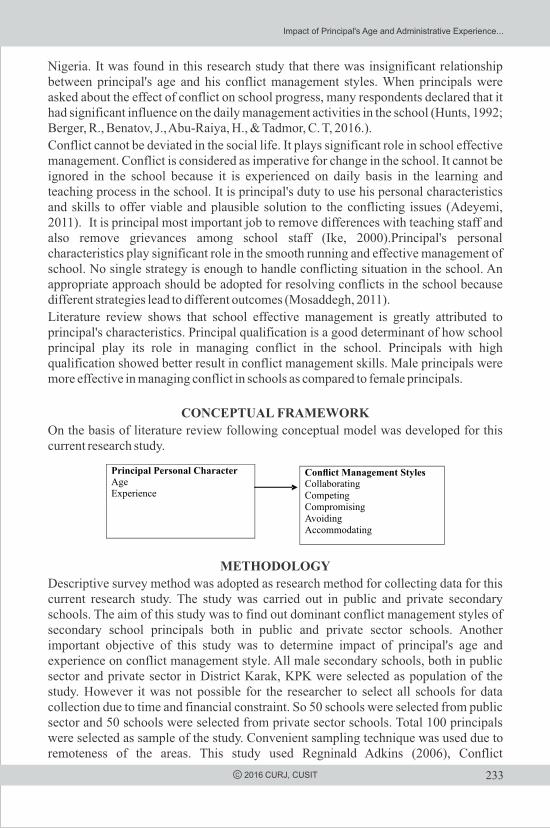
233
Nigeria. It was found in this research study that there was insignificant relationship between principal's age and his conflict management styles. When principals were asked about the effect of conflict on school progress, many respondents declared that it had significant influence on the daily management activities in the school (Hunts, 1992; Berger, R., Benatov, J., Abu-Raiya, H., & Tadmor, C. T, 2016.).
Conflict cannot be deviated in the social life. It plays significant role in school effective management. Conflict is considered as imperative for change in the school. It cannot be ignored in the school because it is experienced on daily basis in the learning and teaching process in the school. It is principal's duty to use his personal characteristics and skills to offer viable and plausible solution to the conflicting issues (Adeyemi, 2011). It is principal most important job to remove differences with teaching staff and also remove grievances among school staff (Ike, 2000).Principal's personal characteristics play significant role in the smooth running and effective management of school. No single strategy is enough to handle conflicting situation in the school. An appropriate approach should be adopted for resolving conflicts in the school because different strategies lead to different outcomes (Mosaddegh, 2011).
Literature review shows that school effective management is greatly attributed to principal's characteristics. Principal qualification is a good determinant of how school principal play its role in managing conflict in the school. Principals with high qualification showed better result in conflict management skills. Male principals were more effective in managing conflict in schools as compared to female principals.
CONCEPTUAL FRAMEWORK
On the basis of literature review following conceptual model was developed for this current research study.
METHODOLOGY
Descriptive survey method was adopted as research method for collecting data for this current research study. The study was carried out in public and private secondary schools. The aim of this study was to find out dominant conflict management styles of secondary school principals both in public and private sector schools. Another important objective of this study was to determine impact of principal's age and experience on conflict management style. All male secondary schools, both in public sector and private sector in District Karak, KPK were selected as population of the study. However it was not possible for the researcher to select all schools for data collection due to time and financial constraint. So 50 schools were selected from public sector and 50 schools were selected from private sector schools. Total 100 principals were selected as sample of the study. Convenient sampling technique was used due to remoteness of the areas. This study used Regninald Adkins (2006), Conflict
C 2016 CURJ, CUSIT
Impact of Principal's Age and Administrative Experience...

234
Management Style Questionnaire for data collection. This questionnaire assess five conflict management styles which are (a): collaborating, (b): competing, (c): avoiding, (d): accommodating, and (e): compromising. Reliability of the research instrument was checked through pilot testing. Reliability was found as .91. After calculating the reliability, questionnaires were delivered to selected principals. Data was analyzed through SPSS using t-test, regression analysis and mean score comparison to interpret and draw conclusion.
RESULT AND FINDINGS
Table 1 describes principals' frequency distribution according to their age. It is cleared from the result that maximum principals (63%) were above 50 years of age. Only 7% principals belonged to young age (30-40 year age group) and 30% principals belonged to middle age (40-50 year) group.
Table 2 represents result of principals' distribution according to their teaching and administrative experience. It is evident from the result that maximum principals (46%) had 21 or more years teaching and administrative experience. 40% principals had 11 to 20 year experience while only 14% principals had less than 10 year experience.
Table 3 shows significant differences in the responses of public school principals and private school principals regarding conflict management styles. Result shows that public school principals have collaborating (Mean = 11.3) style as most dominant conflict management style while private school principals were more inclined towards competing (Mean = 10.31) as most preferred conflict management style. Avoiding (Mean = 8.02) was less preferred style of conflict management with public school principals while accommodating (Mean = 8.81) was the less preferred conflict
C 2016 CURJ, CUSIT
Table 1: Frequency of Principals According to Their Age
Table 2: Frequency of Principals According to Experience
Table 3: School Wise Dominant Conict Management Style of School Principals
Dr. Saima Batool et al.

235
management style among private school principals.
Table 4describes age wise dominant conflict management styles of secondary school principals. Result indicates that principals of 30-40 years age group have collaborating (Mean = 11.38) as most preferred conflict management style and avoiding style was least preferred (Mean = 8.86). 41-50 years age group principals also indicated same responses about conflict management style. However principals having age between 51-60 years responded in favor of competing (Mean = 10.22) as most dominant style for conflict resolution in the school.
Table 5 shows experience wise result for dominant conflict management style. Result shows significant differences in principals' responses. Principals having 1-10 year experience responded in favor of compromising (Mean = 9.93) style as most preferred. Principals who had 11-20 year experience had collaborating (Mean = 10.45) as dominant conflict management style. Principals with 21 or more year experience declared competing or authoritative (Mean = 10.55) conflict management style as most preferred.
C 2016 CURJ, CUSIT
Table 4: Age Wise Dominant Conict Management Style of School Principals
Table 5: Experience Wise Dominant Conict Management Style of School Principals
Table 6 Relationship between Principal's Age and Management Style Model Summary b
a) Predictors (constant) Principal's ageb) dependent variable: Management Style
ANOVA
Impact of Principal's Age and Administrative Experience...
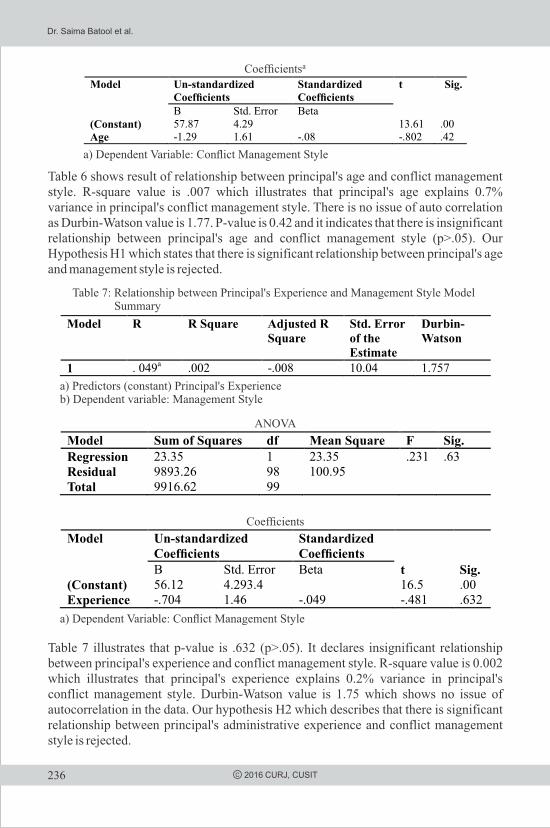
236
Table 6 shows result of relationship between principal's age and conflict management style. R-square value is .007 which illustrates that principal's age explains 0.7% variance in principal's conflict management style. There is no issue of auto correlation as Durbin-Watson value is 1.77. P-value is 0.42 and it indicates that there is insignificant relationship between principal's age and conflict management style (p>.05). Our Hypothesis H1 which states that there is significant relationship between principal's age and management style is rejected.
Table 7 illustrates that p-value is .632 (p>.05). It declares insignificant relationship between principal's experience and conflict management style. R-square value is 0.002 which illustrates that principal's experience explains 0.2% variance in principal's conflict management style. Durbin-Watson value is 1.75 which shows no issue of autocorrelation in the data. Our hypothesis H2 which describes that there is significant relationship between principal's administrative experience and conflict management style is rejected.
C 2016 CURJ, CUSIT
aCoefcients
a) Dependent Variable: Conict Management Style
Table 7: Relationship between Principal's Experience and Management Style Model Summary
a) Predictors (constant) Principal's Experienceb) Dependent variable: Management Style
ANOVA
Coefcients
a) Dependent Variable: Conict Management Style
Dr. Saima Batool et al.
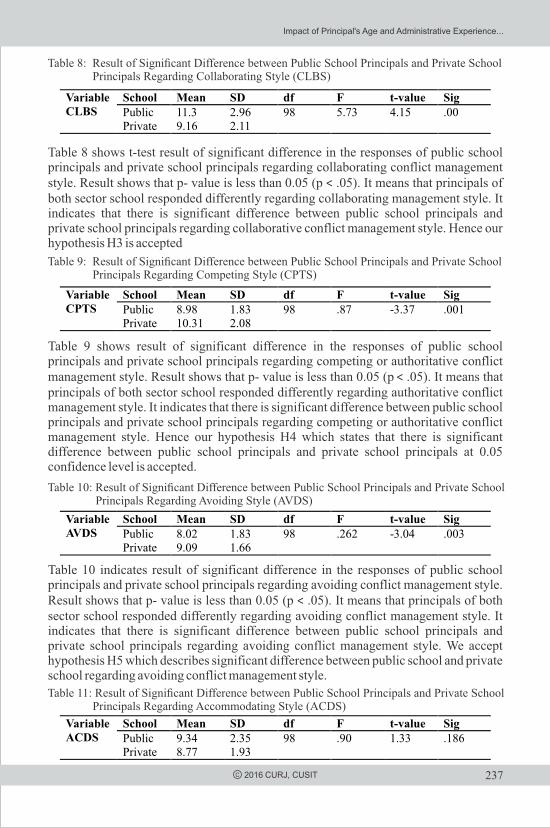
237
Table 8 shows t-test result of significant difference in the responses of public school principals and private school principals regarding collaborating conflict management style. Result shows that p- value is less than 0.05 (p ˂ .05). It means that principals of both sector school responded differently regarding collaborating management style. It indicates that there is significant difference between public school principals and private school principals regarding collaborative conflict management style. Hence our hypothesis H3 is accepted
Table 9 shows result of significant difference in the responses of public school principals and private school principals regarding competing or authoritative conflict management style. Result shows that p- value is less than 0.05 (p ˂ .05). It means that principals of both sector school responded differently regarding authoritative conflict management style. It indicates that there is significant difference between public school principals and private school principals regarding competing or authoritative conflict management style. Hence our hypothesis H4 which states that there is significant difference between public school principals and private school principals at 0.05 confidence level is accepted.
Table 10 indicates result of significant difference in the responses of public school principals and private school principals regarding avoiding conflict management style. Result shows that p- value is less than 0.05 (p ˂ .05). It means that principals of both sector school responded differently regarding avoiding conflict management style. It indicates that there is significant difference between public school principals and private school principals regarding avoiding conflict management style. We accept hypothesis H5 which describes significant difference between public school and private school regarding avoiding conflict management style.
C 2016 CURJ, CUSIT
Table 8: Result of Signicant Difference between Public School Principals and Private School Principals Regarding Collaborating Style (CLBS)
Table 9: Result of Signicant Difference between Public School Principals and Private School Principals Regarding Competing Style (CPTS)
Table 10: Result of Signicant Difference between Public School Principals and Private School Principals Regarding Avoiding Style (AVDS)
Table 11: Result of Signicant Difference between Public School Principals and Private School Principals Regarding Accommodating Style (ACDS)
Impact of Principal's Age and Administrative Experience...
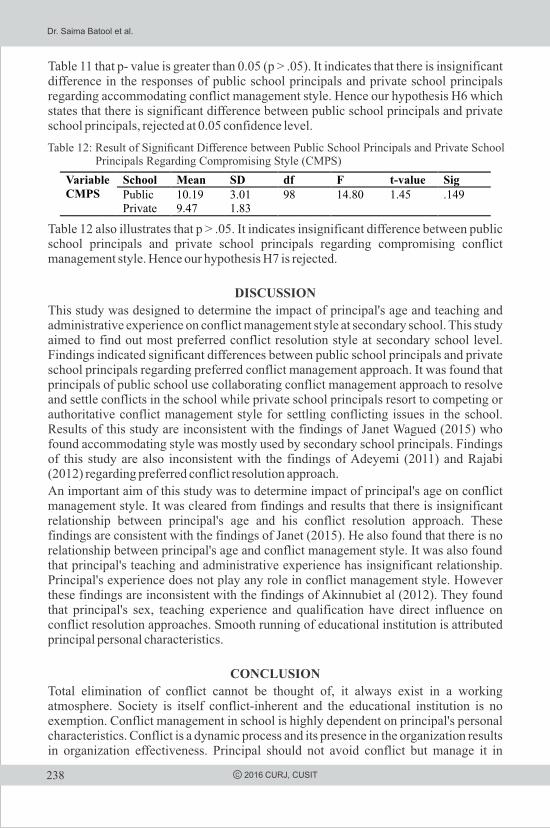
238
Table 11 that p- value is greater than 0.05 (p > .05). It indicates that there is insignificant difference in the responses of public school principals and private school principals regarding accommodating conflict management style. Hence our hypothesis H6 which states that there is significant difference between public school principals and private school principals, rejected at 0.05 confidence level.
Table 12 also illustrates that p > .05. It indicates insignificant difference between public school principals and private school principals regarding compromising conflict management style. Hence our hypothesis H7 is rejected.
DISCUSSION
This study was designed to determine the impact of principal's age and teaching and administrative experience on conflict management style at secondary school. This study aimed to find out most preferred conflict resolution style at secondary school level. Findings indicated significant differences between public school principals and private school principals regarding preferred conflict management approach. It was found that principals of public school use collaborating conflict management approach to resolve and settle conflicts in the school while private school principals resort to competing or authoritative conflict management style for settling conflicting issues in the school. Results of this study are inconsistent with the findings of Janet Wagued (2015) who found accommodating style was mostly used by secondary school principals. Findings of this study are also inconsistent with the findings of Adeyemi (2011) and Rajabi (2012) regarding preferred conflict resolution approach.
An important aim of this study was to determine impact of principal's age on conflict management style. It was cleared from findings and results that there is insignificant relationship between principal's age and his conflict resolution approach. These findings are consistent with the findings of Janet (2015). He also found that there is no relationship between principal's age and conflict management style. It was also found that principal's teaching and administrative experience has insignificant relationship. Principal's experience does not play any role in conflict management style. However these findings are inconsistent with the findings of Akinnubiet al (2012). They found that principal's sex, teaching experience and qualification have direct influence on conflict resolution approaches. Smooth running of educational institution is attributed principal personal characteristics.
CONCLUSION
Total elimination of conflict cannot be thought of, it always exist in a working atmosphere. Society is itself conflict-inherent and the educational institution is no exemption. Conflict management in school is highly dependent on principal's personal characteristics. Conflict is a dynamic process and its presence in the organization results in organization effectiveness. Principal should not avoid conflict but manage it in
C 2016 CURJ, CUSIT
Table 12: Result of Signicant Difference between Public School Principals and Private School Principals Regarding Compromising Style (CMPS)
Dr. Saima Batool et al.

239
effective way. Principal have to make him-self aware about the causes of the conflict in the school and then use effective and appropriate strategies to resolve conflict. school effective management is greatly attributed to principal's characteristics. Principal qualification is a good determinant of how school principal play its role in managing conflict in the school. Principals with high qualification showed better result in conflict management skills. Male principals were more effective in managing conflict in schools as compared to female principals. It is essential for school principal to take active role in filed practice in order to embrace effective management skills that are needed for smooth running of school and effective teaching and learning process. It is imperative for school principal to recognize conflict at first hand and take strong initiative for its resolution. Principals should take collective judgment in order to overcome his personal biases. It is also important for principal to accept his realistically his strength and weaknesses for conflict management. Effective principal accept conflict as part and parcel of all social organization.
RECOMMENDATION
Managing conflict at any level is not an easy job. It requires knowledge and skills to resolve conflicting situation in the organization. School principal also face conflict resolution issues and it needs immediate attention. It is also recommended that principals should manage conflict and do not avoid it. It is also recommended that proper training of conflict management should be given to secondary school principals at regular interval. Principals should not restrict to one single conflict management style but change it according to situations. Another recommendation is that a committee may be set up comprising principal and some
REFERENCESAdeyemi. T. O. (2009). Principals' Management of conflicts in Public Secondary
Schools in Ondo State, Nigeria. Educational Research and Review, Vol,4(9).
Akinnubi. O. P, Oyeniran. S, Fashiku. C. O, &Durosaro. A. I. (2012). Principal's Personal Charateristics and Conflict Management in Kwara State Secondary School, Nigeria. International Journal of Academic Research in Business and Social Sciences, Vol, 2(6).
Albert, I. O. (2001). Introduction to third party intervention in community conflicts. Ibadan: PETRAF/John Archers Publishers
Berger, R., Benatov, J., Abu-Raiya, H., & Tadmor, C. T. (2016). Reducing prejudice and promoting positive intergroup attitudes among elementary-school children in the context of the Israeli–Palestinian conflict. Journal of School Psychology.
Blake, R. R., Mouton, J. S., Barnes, L. B., & Greiner, L. E. (1964). Breakthrough in organization development. Harvard Business Review, 42(6), 133-155.
Folger, J. P, Poole, M. S. and Stutman, R. K. (1997). Working through conflict: Strategies for relationship, group and organizations. England: Longman
C 2016 CURJ, CUSIT
Impact of Principal's Age and Administrative Experience...

Ghafar. A. (2011). Evaluation of Conflict Management Skills: Developing a Model for Secondary School Principal. PhD thesis
Gross. M. A &Guerro. L. K. (2011).Managing Conflict Appropriately and Effectively: An Application of the Competence Model of Organizational Conflict styles. International Journal of Conflict Management and Leadership Effectiveness.
Hallinger, P., Bickman, L., & Davis, K. (1996). School context, principal leadership, and student reading achievement. The Elementary School Journal, 527-549.
Hunts RS (1992). Managing people at work. London, McGraw Hill.
Ike, G. A. (2000). The roles of managers in school administration. Oweri. Totan Publishers
Janet Wagude. (2015). Influence of Principals' Age on Conflict Management styles in Kisumu County, Kenya. International Journal of Scientific and Technology Research Vol, 4(5).
Kember, D. (2016). Motivating Students through Teaching and Learning. In Understanding the Nature of Motivation and Motivating Students through Teaching and Learning in Higher Education (pp. 79-97). Springer Singapore.
Kumar, S. (2012). Practice and Problems of Principals' Conflict management Styles and Teachers' Job Performance in Secondary Schools of Ethiopia. International Journal of Research Studies in Education, 2(1), 41-54.
MosaddeghRaad, A. M. (2011). Investigating the relationship between conflict management styles of the directors and the efficiency of schools in Isfahan. Journal of Administrative Sciences and Economics, Isfahan University,17(4), 37-24.
Okorie, A.N. (2002). The comparison of the perception of the school-based and centralized management administrators and teachers toward leadership practices. Unpublished Doctoral Dissertation. Baylor University, Waco, Texas
Rahim, M. A. (1983). A measure of styles of handling interpersonal conflict. Academy of Management Journal, 26(2), 368-376.
Rajabi, Z. (2012). Relationship of coach's conflict management style and student performance outcomes. European Journal of Education, 2(4), 1134-113
Ranigald Atkins, (2006) https://www.google.com.pk/url?sa=t&rct=j&q=&esrc=s&source=we
b&cd=1&cad=rja&uact=8&ved=0ahUKEwj1kOK15u_MAhUjUKYKHeTGBecQFggdMAA&url=http%3A%2F%2Firem.org%2FFile%2520Library%2FChapterServices%2FConflictManagementWS%2F
240 C 2016 CURJ, CUSIT
Dr. Saima Batool et al.

ActivityConflictManagementStylesAssessment.pdf&usg=AFQjCNHSF6EhyG6-hR3zT5p546H0-qW66g&bvm=bv.122676328,d.dGY
Stermanan. (2010). The Relationship between Conflict management Styles and Organizational Commitment. Journal of Education Science Vol, 12(1).
Taiwo, C. O. (2010). The Nigeria Education System: Past, present and future. Lagos: Thomas Nelson
Vivar, C. (2006). Putting conflict management into practice: a nursing case study. Journal of Educational Management, 14: 201–206
Whetten, D. A., Cameron, K. S., & Woods, M. (2000). Developing management skills for Europe. Pearson Education.
Ziaee, G. (2012). The relationship between conflict management style and the efficiency of elementary school teachers in Gorgan, MS Thesis, Tehran: Center for Public Management Education
241C 2016 CURJ, CUSIT
Impact of Principal's Age and Administrative Experience...

242
QUALITY OF HEALTHCARE SERVICES IN PUBLIC AND PRIVATE HOSPITALS OF PESHAWAR, PAKISTAN: A
COMPARATIVE STUDY USING SERVQUALAqsa Siddiq*, Dr. Qadar B. Baloch** and Dr Kausar Takrim***
ABSTRACT
Globalization trends have made patients willing to pay even more for quality healthcare services and there is no second opinion that patients' satisfaction comprehends in terms of receiving quality healthcare. Countries like Pakistan are still unable to rank themselves in the competition of quality health care services as 'quality' in healthcare is a vague concept here both from providers and patients' perspectives. Moreover the health care system of Pakistan is facing challenges of inequities and inadequacy both in terms of delivery and access of quality services. Appropriate assessment of the healthcare services quality and developing mechanisms are mandatory. The objective of this study was to quantify the healthcare quality in the hospitals of Pakistan using the modified SERVQUAL instrument (α=0.92). A convenient based sample (n=500) was comprised of patients from ten hospitals both in public and private sectors located in Peshawar, Pakistan. The results of the study identified quality GAPS in various dimensions of healthcare services. Besides private sector hospitals have comparatively low quality Gaps as compared to public sector hospitals however bridging up the existing gaps are suggested in both the sectors through continuous improvement across a range of services. There is a need for matching the patients' expectations with the contribution of healthcare services providers in Pakistan to be competitive globally in the industry.
Keywords: Quality Healthcare services, SERVQUAL
INTRODUCTION
Global forces are increasingly manipulating local and conventional managerial practices both in industrial as well as service sector. These changes encompass each aspect of social life of nations including services such as; communication, healthcare and education. In alliance with the global trends, the services sector has emerged as the leading, fastest growing and a major contributor to the global output. Unlike a product, services are intangible, perishable, variable and inseparable in nature thereby have own challenges to compete for quality (Kotler, Bloom, & Hayes, 1984).
Health organization works as a system and is a facility or set of coordinated facilities that provides health care services. Health Systems are normally appraised in terms of their ability to deliver accessible, safe, high quality, efficient, and equitable care for the sake of population health and longevity (UNDP report, 1990; WHO 2007; Malik, 2013). The worldwide changing socio-political, economic needs of the population and
City University Research JournalVolume 06 Number 02 July 2016 PP 242-255
*Assistant Professor, Faculty of Management and Information Science, University of Peshawar; [email protected]**Associate Professor, HoD Management Sci. Department, NUML University Peshawar***Assistant Professor, College of Home Economics, University of Peshawar
C 2016 CURJ, CUSIT
243
and demographic trends demand an innovation and change to develop a robust healthcare systems. The healthcare sector is undergoing significant and rapid changes and requires healthcare organizations to struggle for the advancement to be globally competitive. Like any other service or product, healthcare industry is also competing in highly intense competitive environment. Value of Healthcare services includes access to effective, adequate and efficient care as a basic requirement of any health care system (Porter, 2010). Improved quality with access to affordable healthcare service is the value based goal of the system.
Pakistan as a developing country is facing problems in its healthcare system. To achieve global competitiveness, developing a robust model for healthcare services is crucial both in public and private sectors hospitals of Pakistan. This involves the appropriate measurement of the quality dimensions, the gaps analysis and adequate recommendations for policy makers to uplift the entire system. An exclusive scale named SERVQUAL is modified and used to measure the quality of services in hospitals of Peshawar.
Quality in healthcare service delivery can help the system to outperform as that not only satisfy the customer but make them brand loyal. The aim of this study is to comparatively examine and rank the excellence of provided healthcare services in public and private sector hospitals of District Peshawar, KP, Pakistan and based on results, to suggest some milestones to be achieved making the competitive services.
REVIEW OF LITERATURE
Satisfaction is a general attitude based on customer experience and is a basic reason in formation of customers' buying behaviour in future (Mittal & Kamakura, 2001). Customer satisfaction is ones choice or rejection resulting from assessment based on a product or service's perceived and expected performance (Kotler & Armstrong, 2003). Hence, satisfaction is precisely related to consumers' expectation and experience, therefore,
Customer satisfaction = Customers Expectations – Actual Perceived Services
Quality is a driving force for improved competitiveness, customer satisfaction and profitability (Edvardsson, 1992). Service quality is the ability of an organization to meet or exceed needs, requirements and expectations of consumers (Parasuraman et al. , 1988; Carman, 1990 ; Haywood-Farmer, & Stuart, 1990 ; Bolton & Drew, 1991; Schvaneveldt, Enkawa, & Miyakawa, 1991 ; Boulding et al, 1993 ; Mattsson, 1994a ; Mattsson, 1994b; Pitt & Jeantrout, 1994; Dotchin & Oakland, Part 1, 2 & 3, 1994) as well as to maintain its competitive advantage (Yoo & Park, 2007). Service quality is known as a worthy marketing strategy for firms to achieve uniqueness of services (differentiation) and consumer satisfaction providing value (Levitt 1981, Parasuraman et al. 1985).
Quality is described as fulfilling the wants (expectations) of customer with possible low cost, preventions in procedures, timely delivery, zero-defects product and value addition to customers (Crago, 2000). Global Corporations are now considering service quality for customer satisfaction as a prime strategic value to win market share and to reach competitive advantage (Carlzon, 1989; Ghobadian, Speller, & Jones, 1994).
C 2016 CURJ, CUSIT
Quality of Healthcare Services...
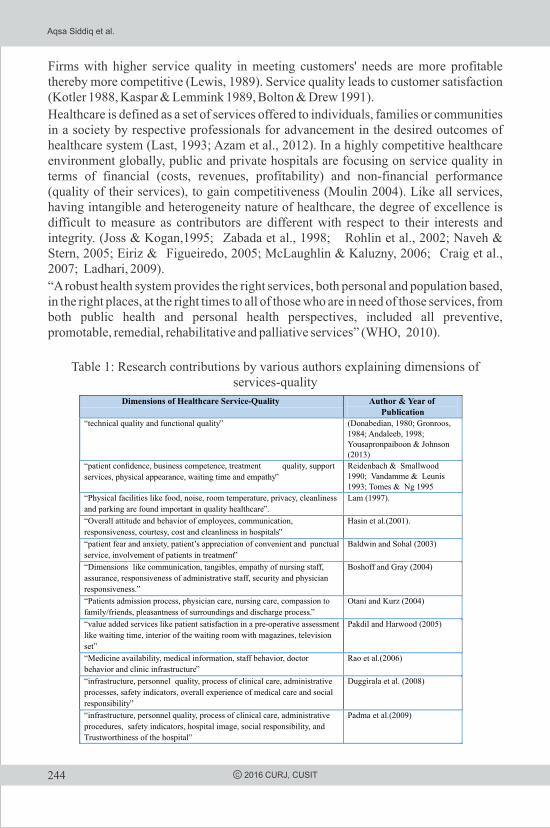
244
Firms with higher service quality in meeting customers' needs are more profitable thereby more competitive (Lewis, 1989). Service quality leads to customer satisfaction (Kotler 1988, Kaspar & Lemmink 1989, Bolton & Drew 1991).
Healthcare is defined as a set of services offered to individuals, families or communities in a society by respective professionals for advancement in the desired outcomes of healthcare system (Last, 1993; Azam et al., 2012). In a highly competitive healthcare environment globally, public and private hospitals are focusing on service quality in terms of financial (costs, revenues, profitability) and non-financial performance (quality of their services), to gain competitiveness (Moulin 2004). Like all services, having intangible and heterogeneity nature of healthcare, the degree of excellence is difficult to measure as contributors are different with respect to their interests and integrity. (Joss & Kogan,1995; Zabada et al., 1998; Rohlin et al., 2002; Naveh & Stern, 2005; Eiriz & Figueiredo, 2005; McLaughlin & Kaluzny, 2006; Craig et al., 2007; Ladhari, 2009).
“A robust health system provides the right services, both personal and population based, in the right places, at the right times to all of those who are in need of those services, from both public health and personal health perspectives, included all preventive, promotable, remedial, rehabilitative and palliative services” (WHO, 2010).
Table 1: Research contributions by various authors explaining dimensions of services-quality
C 2016 CURJ, CUSIT
Dimensions of Healthcare Service-Quality Author & Year of Publication
“technical quality and functional quality” (Donabedian, 1980; Gronroos, 1984; Andaleeb, 1998; Yousapronpaiboon & Johnson (2013)
“patient condence, business competence, treatment quality, support
services, physical appearance, waiting time and empathy”
Reidenbach & Smallwood 1990; Vandamme & Leunis 1993; Tomes & Ng 1995
“Physical facilities like food, noise, room temperature, privacy, cleanliness
and parking are found important in quality healthcare”.
Lam (1997).
“Overall attitude and behavior of employees, communication,
responsiveness, courtesy, cost and cleanliness in hospitals”
Hasin et al.(2001).
“patient fear and anxiety, patient’s appreciation of convenient and punctual
service, involvement of patients in treatment”
Baldwin and Sohal (2003)
“Dimensions like communication, tangibles, empathy of nursing staff,
assurance, responsiveness of administrative staff, security and physician
responsiveness.”
Boshoff and Gray (2004)
“Patients admission process, physician care, nursing care, compassion to
family/friends, pleasantness of surroundings and discharge process.”
Otani and Kurz (2004)
“value added services like patient satisfaction in a pre-operative assessment
like waiting time, interior of the waiting room with magazines, television
set”
Pakdil and Harwood (2005)
“Medicine availability, medical information, staff behavior, doctor
behavior and clinic infrastructure”
Rao et al.(2006)
“infrastructure, personnel quality, process of clinical care, administrative
processes, safety indicators, overall experience of medical care and social
responsibility”
Duggirala et al. (2008)
“infrastructure, personnel quality, process of clinical care, administrative
procedures, safety indicators, hospital image, social responsibility, and
Trustworthiness of the hospital”
Padma et al.(2009)
Aqsa Siddiq et al.
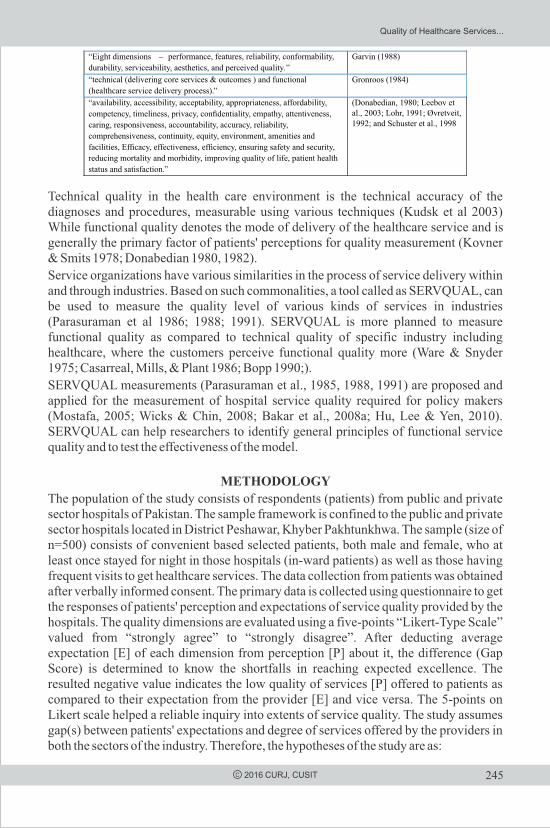
245
Technical quality in the health care environment is the technical accuracy of the diagnoses and procedures, measurable using various techniques (Kudsk et al 2003) While functional quality denotes the mode of delivery of the healthcare service and is generally the primary factor of patients' perceptions for quality measurement (Kovner & Smits 1978; Donabedian 1980, 1982).
Service organizations have various similarities in the process of service delivery within and through industries. Based on such commonalities, a tool called as SERVQUAL, can be used to measure the quality level of various kinds of services in industries (Parasuraman et al 1986; 1988; 1991). SERVQUAL is more planned to measure functional quality as compared to technical quality of specific industry including healthcare, where the customers perceive functional quality more (Ware & Snyder 1975; Casarreal, Mills, & Plant 1986; Bopp 1990;).
SERVQUAL measurements (Parasuraman et al., 1985, 1988, 1991) are proposed and applied for the measurement of hospital service quality required for policy makers (Mostafa, 2005; Wicks & Chin, 2008; Bakar et al., 2008a; Hu, Lee & Yen, 2010). SERVQUAL can help researchers to identify general principles of functional service quality and to test the effectiveness of the model.
METHODOLOGY
The population of the study consists of respondents (patients) from public and private sector hospitals of Pakistan. The sample framework is confined to the public and private sector hospitals located in District Peshawar, Khyber Pakhtunkhwa. The sample (size of n=500) consists of convenient based selected patients, both male and female, who at least once stayed for night in those hospitals (in-ward patients) as well as those having frequent visits to get healthcare services. The data collection from patients was obtained after verbally informed consent. The primary data is collected using questionnaire to get the responses of patients' perception and expectations of service quality provided by the hospitals. The quality dimensions are evaluated using a five-points “Likert-Type Scale” valued from “strongly agree” to “strongly disagree”. After deducting average expectation [E] of each dimension from perception [P] about it, the difference (Gap Score) is determined to know the shortfalls in reaching expected excellence. The resulted negative value indicates the low quality of services [P] offered to patients as compared to their expectation from the provider [E] and vice versa. The 5-points on Likert scale helped a reliable inquiry into extents of service quality. The study assumes gap(s) between patients' expectations and degree of services offered by the providers in both the sectors of the industry. Therefore, the hypotheses of the study are as:
C 2016 CURJ, CUSIT
“Eight dimensions –
performance, features, reliability, conformability,
durability, serviceability, aesthetics, and perceived quality.”
Garvin (1988)
“technical (delivering core services & outcomes ) and functional
(healthcare service delivery process).”
Gronroos (1984)
“availability, accessibility, acceptability, appropriateness, affordability,
competency, timeliness, privacy, condentiality, empathy, attentiveness,
caring, responsiveness, accountability, accuracy, reliability,
comprehensiveness, continuity, equity, environment, amenities and
facilities, Efcacy, effectiveness, efciency, ensuring safety and security,
reducing mortality and morbidity, improving quality of life, patient health
status and satisfaction.”
(Donabedian, 1980; Leebov et al., 2003; Lohr, 1991; Øvretveit, 1992; and Schuster et al., 1998
Quality of Healthcare Services...
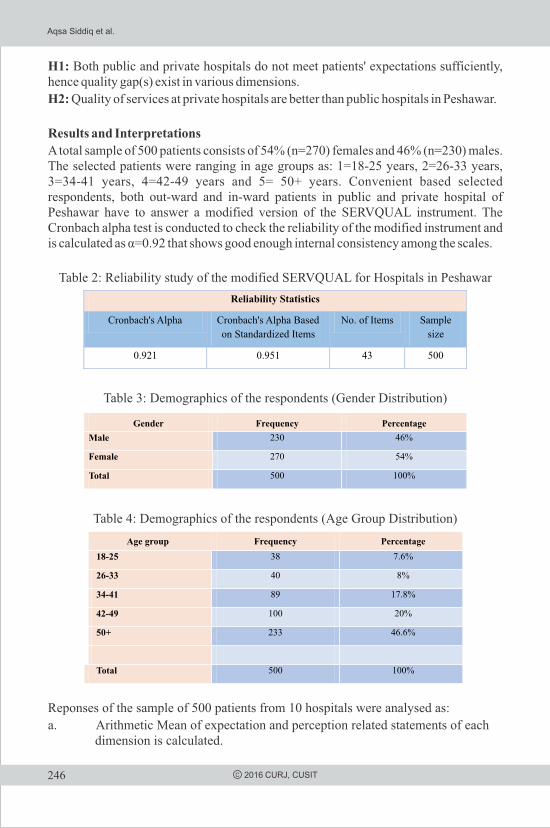
246 C 2016 CURJ, CUSIT
H1: Both public and private hospitals do not meet patients' expectations sufficiently, hence quality gap(s) exist in various dimensions.
H2: Quality of services at private hospitals are better than public hospitals in Peshawar.
Results and Interpretations
A total sample of 500 patients consists of 54% (n=270) females and 46% (n=230) males. The selected patients were ranging in age groups as: 1=18-25 years, 2=26-33 years, 3=34-41 years, 4=42-49 years and 5= 50+ years. Convenient based selected respondents, both out-ward and in-ward patients in public and private hospital of Peshawar have to answer a modified version of the SERVQUAL instrument. The Cronbach alpha test is conducted to check the reliability of the modified instrument and is calculated as α=0.92 that shows good enough internal consistency among the scales.
Table 2: Reliability study of the modified SERVQUAL for Hospitals in Peshawar
Table 3: Demographics of the respondents (Gender Distribution)
Table 4: Demographics of the respondents (Age Group Distribution)
Reponses of the sample of 500 patients from 10 hospitals were analysed as:
a. Arithmetic Mean of expectation and perception related statements of each dimension is calculated.
Reliability Statistics
Cronbach's Alpha
Cronbach's Alpha Based
on Standardized Items No. of Items Sample
size
0.921 0.951 43 500
Gender Frequency Percentage
Male 230
46%
Female 270 54%
Total 500 100%
Age group Frequency Percentage
18-25 38 7.6%
26-33 40
8%
34-41 89
17.8%
42-49 100 20%
50+ 233
46.6%
Total 500 100%
Aqsa Siddiq et al.
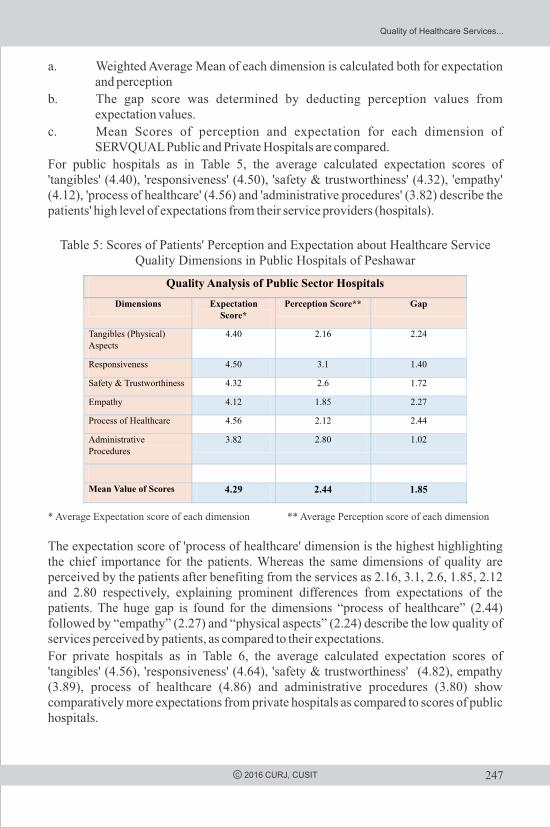
247C 2016 CURJ, CUSIT
a. Weighted Average Mean of each dimension is calculated both for expectation and perception
b. The gap score was determined by deducting perception values from expectation values.
c. Mean Scores of perception and expectation for each dimension of SERVQUAL Public and Private Hospitals are compared.
For public hospitals as in Table 5, the average calculated expectation scores of 'tangibles' (4.40), 'responsiveness' (4.50), 'safety & trustworthiness' (4.32), 'empathy' (4.12), 'process of healthcare' (4.56) and 'administrative procedures' (3.82) describe the patients' high level of expectations from their service providers (hospitals).
Table 5: Scores of Patients' Perception and Expectation about Healthcare Service Quality Dimensions in Public Hospitals of Peshawar
* Average Expectation score of each dimension ** Average Perception score of each dimension
The expectation score of 'process of healthcare' dimension is the highest highlighting the chief importance for the patients. Whereas the same dimensions of quality are perceived by the patients after benefiting from the services as 2.16, 3.1, 2.6, 1.85, 2.12 and 2.80 respectively, explaining prominent differences from expectations of the patients. The huge gap is found for the dimensions “process of healthcare” (2.44) followed by “empathy” (2.27) and “physical aspects” (2.24) describe the low quality of services perceived by patients, as compared to their expectations.
For private hospitals as in Table 6, the average calculated expectation scores of 'tangibles' (4.56), 'responsiveness' (4.64), 'safety & trustworthiness' (4.82), empathy (3.89), process of healthcare (4.86) and administrative procedures (3.80) show comparatively more expectations from private hospitals as compared to scores of public hospitals.
Quality Analysis of Public Sector Hospitals
Dimensions Expectation Score*
Perception Score** Gap
Tangibles (Physical) Aspects
4.40
2.16
2.24
Responsiveness 4.50
3.1
1.40
Safety & Trustworthiness
4.32
2.6
1.72
Empathy 4.12 1.85 2.27
Process of Healthcare
4.56
2.12
2.44
Administrative Procedures
3.82
2.80
1.02
Mean Value of Scores 4.29 2.44 1.85
Quality of Healthcare Services...
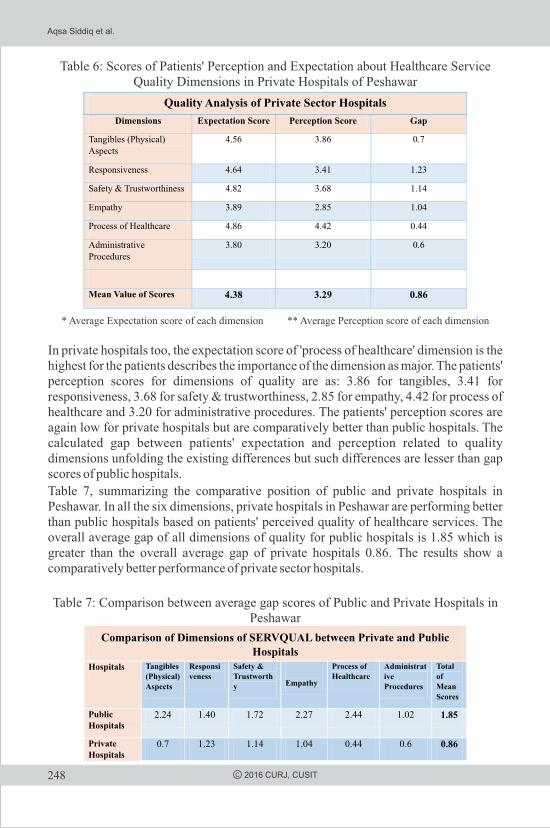
248 C 2016 CURJ, CUSIT
Table 6: Scores of Patients' Perception and Expectation about Healthcare Service Quality Dimensions in Private Hospitals of Peshawar
* Average Expectation score of each dimension ** Average Perception score of each dimension
In private hospitals too, the expectation score of 'process of healthcare' dimension is the highest for the patients describes the importance of the dimension as major. The patients' perception scores for dimensions of quality are as: 3.86 for tangibles, 3.41 for responsiveness, 3.68 for safety & trustworthiness, 2.85 for empathy, 4.42 for process of healthcare and 3.20 for administrative procedures. The patients' perception scores are again low for private hospitals but are comparatively better than public hospitals. The calculated gap between patients' expectation and perception related to quality dimensions unfolding the existing differences but such differences are lesser than gap scores of public hospitals.
Table 7, summarizing the comparative position of public and private hospitals in Peshawar. In all the six dimensions, private hospitals in Peshawar are performing better than public hospitals based on patients' perceived quality of healthcare services. The overall average gap of all dimensions of quality for public hospitals is 1.85 which is greater than the overall average gap of private hospitals 0.86. The results show a comparatively better performance of private sector hospitals.
Table 7: Comparison between average gap scores of Public and Private Hospitals in Peshawar
Quality Analysis of Private Sector Hospitals
Dimensions Expectation Score Perception Score Gap
Tangibles (Physical) Aspects
4.56
3.86
0.7
Responsiveness 4.64
3.41
1.23
Safety & Trustworthiness
4.82
3.68
1.14
Empathy 3.89 2.85 1.04
Process of Healthcare
4.86
4.42
0.44
Administrative Procedures
3.80
3.20
0.6
Mean Value of Scores 4.38 3.29 0.86
Comparison of Dimensions of SERVQUAL between Private and Public Hospitals
Hospitals Tangibles (Physical) Aspects
Responsiveness
Safety & Trustworthy
Empathy
Process of Healthcare
Administrative Procedures
Total of Mean
Scores
Public Hospitals
2.24
1.40
1.72
2.27
2.44
1.02 1.85
Private Hospitals
0.7 1.23 1.14 1.04 0.44 0.6 0.86
Aqsa Siddiq et al.

249C 2016 CURJ, CUSIT
Highest gap is found for the dimension 'process of healthcare' (2.0), indicating the massive difference of services that patients are receiving and what they are expecting from their providers in public hospitals compared to private sector hospitals. The second major gap is found for tangibles of hospitals including equipments, machinery, infrastructure and related facilities.
CONCLUSIONS
The outcomes of the study presenting a picture of healthcare services quality in Pakistan, a country with a low rank listed in Human Development Index (HDI Report, 2014). The instrument used in the study is a clear and detailed way of investigating the expectation and perception of patients (customers) regarding quality level of service providers' offerings. It is found that patients have comparatively higher expectations from private sector may be due to paying relatively higher cost(s). Although the numeric results of private hospitals are better than public in the study, still there is a need for improvements and bridging up the gaps. The findings suggest continuous improvements using participation of patients' feedback in the process of developing modern healthcare services along with related infrastructure fully equipped with facilities. A regular feedback from patients regarding their expectations from the services provided is suggested as critical specifically in public hospitals to introduce advancements in the system. Further, the value-added rewards and facilities to healthcare workforce can help to improve their responsiveness and empathetic attitude towards patients. The findings have significant hints for all the major stakeholders of private and public hospitals including owners, managers, government monitoring authorities, academics and other associates in the healthcare services. A developing country like Pakistan, with scarcity of resources and having lowest position in global HDI ranking, needs a lot of efforts in developing a robust healthcare system both in public and private hospitals. The international systems like World Health Organization (WHO) ,Canadian Healthcare, Scandinavian Health care etc. can be benchmarked and adopted. As the literature revealed, SERVQUAL scans the functional aspect of quality of services more than the technical. There is a serious need for focusing on both functional and technical aspects of healthcare service quality in Pakistan.
The study suggest researchers to replicate similar inquiry in all cities of Pakistan to bring overall improvements in entire healthcare system at national level without any inequality and discriminations. Further the study suggests the investigation into the role and quality of stakeholders specially owners, managers and administrators in enhancing the quality of healthcare services at competitive level.
Gap score Comparison
1.54
0.17
0.58
1.23
2.00
0.42 0.99
Better Performance /less gap
Private Hospitals
Private Hospitals
Private Hospitals
Private Hospitals
Private Hospitals
Private Hospitals
Private
Quality of Healthcare Services...
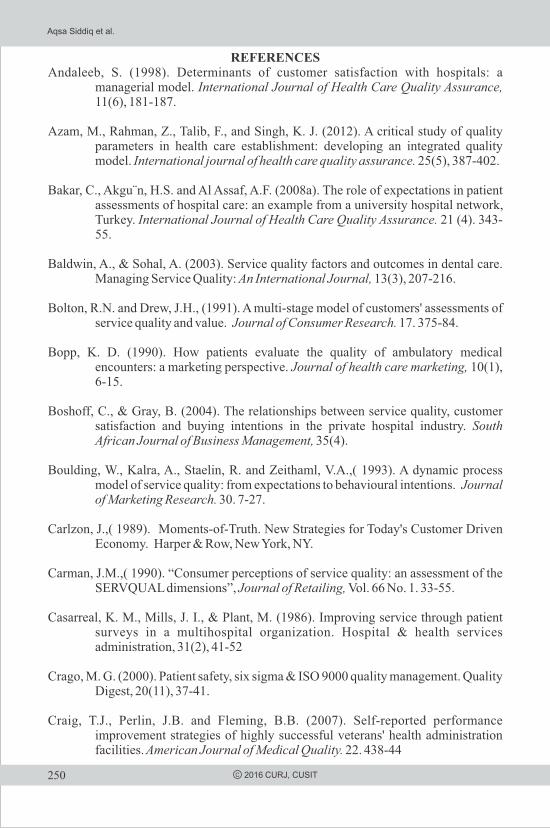
250 C 2016 CURJ, CUSIT
REFERENCESAndaleeb, S. (1998). Determinants of customer satisfaction with hospitals: a
managerial model. International Journal of Health Care Quality Assurance, 11(6), 181-187.
Azam, M., Rahman, Z., Talib, F., and Singh, K. J. (2012). A critical study of quality parameters in health care establishment: developing an integrated quality model. International journal of health care quality assurance. 25(5), 387-402.
Bakar, C., Akgu¨n, H.S. and Al Assaf, A.F. (2008a). The role of expectations in patient assessments of hospital care: an example from a university hospital network, Turkey. International Journal of Health Care Quality Assurance. 21 (4). 343-55.
Baldwin, A., & Sohal, A. (2003). Service quality factors and outcomes in dental care. Managing Service Quality: An International Journal, 13(3), 207-216.
Bolton, R.N. and Drew, J.H., (1991). A multi-stage model of customers' assessments of service quality and value. Journal of Consumer Research. 17. 375-84.
Bopp, K. D. (1990). How patients evaluate the quality of ambulatory medical encounters: a marketing perspective. Journal of health care marketing, 10(1), 6-15.
Boshoff, C., & Gray, B. (2004). The relationships between service quality, customer satisfaction and buying intentions in the private hospital industry. South African Journal of Business Management, 35(4).
Boulding, W., Kalra, A., Staelin, R. and Zeithaml, V.A.,( 1993). A dynamic process model of service quality: from expectations to behavioural intentions. Journal of Marketing Research. 30. 7-27.
Carlzon, J.,( 1989). Moments-of-Truth. New Strategies for Today's Customer Driven Economy. Harper & Row, New York, NY.
Carman, J.M.,( 1990). “Consumer perceptions of service quality: an assessment of the SERVQUAL dimensions”, Journal of Retailing, Vol. 66 No. 1. 33-55.
Casarreal, K. M., Mills, J. I., & Plant, M. (1986). Improving service through patient surveys in a multihospital organization. Hospital & health services administration, 31(2), 41-52
Crago, M. G. (2000). Patient safety, six sigma & ISO 9000 quality management. Quality Digest, 20(11), 37-41.
Craig, T.J., Perlin, J.B. and Fleming, B.B. (2007). Self-reported performance improvement strategies of highly successful veterans' health administration facilities. American Journal of Medical Quality. 22. 438-44
Aqsa Siddiq et al.

251C 2016 CURJ, CUSIT
Donabedian, A. (1980). Exploration of Quality Assessment and Monitoring, Volume 1. The Definition of Quality and Approaches to its Assessment, Health Administration Press, Ann Arbor, MI.
Dotchin, J.A. and Oakland, J.S., (1994). Total quality management in services. Part 1: understanding and classifying services. International Journal of Quality & Reliability Management. 11(3). 9-26.
Dotchin, J.A. and Oakland, J.S.,( 1994). Total quality Management in services. Part 2: service quality. International Journal of Quality & Reliability Management. 11(3). 27-42.
Dotchin, J.A. and Oakland, J.S.,( 1994). Total quality management in services. Part 3: distinguishing perceptions of service quality. International Journal of Quality & Reliability Management. 11 (4). 6-28.
Duggirala, M., Rajendran, C., & Anantharaman, R. N. (2008). Patient-perceived dimensions of total quality service in healthcare. Benchmarking: An International Journal, 15(5), 560-583.
Edvardsson, B. (1992). Service breakdowns: a study of critical incidents in an airline. International Journal of Service Industry Management, 3(4), 17-29.
Eiriz, V. and Figueiredo, J.A. (2005). Quality evaluation in healthcare services based on customer-provider relationships. International Journal of Healthcare Quality Assurance. 18(6). 404-12.
Garvin, D. A. (1988). Managing quality: The strategic and competitive edge. Simon and Schuster.
Ghobadian, A., Speller, S. and Jones, M.,( 1994). Service quality concepts and models. International Journal Of Quality & Reliability Management. 11(9). 43-66.
Grönroos, C. (1984). A service quality model and its marketing implications. European Journal of marketing, 18(4), 36-44.
Grönroos, C. (1984). A service quality model and its marketing implications. European Journal of marketing, 18(4), 36-44.
Hasin, M. A. A., Seeluangsawat, R., & Shareef, M. A. (2001). Statistical measures of customer satisfaction for health care quality assurance: a case study. International Journal of Health Care Quality Assurance, 14(1), 6-14.
Haywood-Farmer, J. and Stuart, F.I.,( 1990). An instrument to measure the 'degree of professionalism' in a professional service. Service Industries Journal. 10(2). 336-47.
Quality of Healthcare Services...

252 C 2016 CURJ, CUSIT
Hu, H. Y., Lee, Y. C., & Yen, T. M. (2010). Service quality gaps analysis based on Fuzzy linguistic SERVQUAL with a case study in hospital out-patient services. The TQM Journal. 22(5), 499-515.
Joss, R. and Kogan, M. (1995). Advancing Quality: Total Quality Management in the National Health Service, Open University Press, Buckingham.
Kasper, H., & Lemmink, J. (1989). After sales service quality: views between industrial customers and service managers. Industrial Marketing Management, 18(3), 199-208.
Kotler, P. (1988). Marketing management and strategy: a reader.
Kotler, P., & Armstrong, G. (2003). Principles of Marketing, 2003. Teora, Bucharest, 4.
Kotler, P., Bloom, P. N., & Hayes, T. J. (1984). Marketing professional services. Englewood Cliffs, NJ: Prentice-Hall.
Kovner, A. R., & Smits, H. L. (1978). Point of view: consumer expectations of ambulatory care. Health care management review, 3(1), 69-75.
Kudsk, K. A., Reddy, S. K., Sacks, G. S., & Lai, H. C. (2003). Joint Commission for Accreditation of Health Care Organizations guidelines: too late to intervene for nutritionally at-risk surgical patients. Journal of Parenteral and Enteral Nutrition, 27(4), 288-290.
Ladhari, R. (2009). A review of twenty years of SERVQUAL research. International Journal of Quality and Service Sciences. 1(2). 172-98.
Lam, S. S. (1997). SERVQUAL: A tool for measuring patients' opinions of hospital service quality in Hong Kong. Total Quality Management, 8(4), 145-152.
Last, J.M. (1993). A Dictionary of Epidemiology. Oxford University Press, New York, NY.
Leebov, W., & Ersoz, M. C. J. (2003). The health care manager's guide to continuous quality improvement Universe.
Levitt, T. (1981). Marketing intangible products and product intangibles. Cornell Hotel and Restaurant Administration Quarterly, 22(2), 37-44.
Lewis, B. R. (1989). Quality in the service sector: a review. International Journal of Bank Marketing, 7(5), 4-12.
Malik, K. (2013). Human Development Report 2013. The rise of the South: Human progress in a diverse world. The Rise of the South: Human Progress in a Diverse World (March 15, 2013). UNDP-HDRO Human Development Reports.
Aqsa Siddiq et al.
253C 2016 CURJ, CUSIT
Mattsson, J.,( 1994a). Improving service quality in person-to-person encounters: integrating findings from a multi-disciplinary review. The Services Industries Journal. 14(1). 45-61.
Mattsson, J.,( 1994b). Using service process models to improve service quality. Managing Service Quality. 4(1). 47-52.
McLaughlin, C.P. and Kaluzny, A.D. (2006). Continuous Quality Improvement in Health Care, 3rd ed. Jones and Bartlett Publishers, Sudbury, MA.
Mittal, V., & Kamakura, W. A. (2001). Satisfaction, repurchase intent, and repurchase behavior: Investigating the moderating effect of customer characteristics. Journal of marketing research, 38(1), 131-142.
Mostafa, M.M. (2005). An empirical study of patients' expectations and satisfactions in Egyptian hospitals. International Journal of Health Care Quality Assurance. 18(7). 516-32
Moulin, H. (2004). Fair division and collective welfare. MIT press.
Naveh, E. and Stern, Z. (2005). How quality improvement programmes can affect general hospital performance. International Journal of Healthcare Quality Assurance. 18 (4). 249-70.
Otani, K., Kurz, R. S., & Barney, S. M. (2004). The impact of nursing care and other healthcare attributes on hospitalized patient satisfaction and behavioral intentions. Journal of Healthcare Management, 49(3), 181.
Ovretveit, J. (1992). Health service quality. An Introduction to Quality Measures for Health Services.
Padma, P., Rajendran, C., & Sai, L. P. (2009). A conceptual framework of service quality in healthcare: perspectives of Indian patients and their attendants. Benchmarking: An International Journal, 16(2), 157-191.
Pakdil, F., & Harwood, T. N. (2005). Patient satisfaction in a preoperative assessment clinic: an analysis using SERVQUAL dimensions. Total Quality Management & Business Excellence, 16(1), 15-30.
Parasuraman, A., Zeithaml, V. and Berry, L.L. (1985). A conceptual model of service quality and its implications for future research. Journal of Marketing. 49(4). 41-50.
Parasuraman, A., Zeithaml, V. and Berry, L.L. (1988). SERVQUAL: a multiple-item scale for measuring consumer perceptions of service quality. Journal of Retailing. 64(1). 12-40.
Quality of Healthcare Services...

254 C 2016 CURJ, CUSIT
Parasuraman, A., Zeithaml, V. and Berry, L.L. (1991). Refinement and reassessment of the SERVQUAL scale. Journal of Retailing. 67(4). 420-50.
Pitt, L.F. and Jeantrout, B.,( 1994). Management of customer expectations in service firms: a study and a checklist. The Services Industries Journal. 14(2). 170-89.
Porter, M. E. (2010). What is value in health care?. New England Journal of Medicine. 363(26). 2477-2481.
Rao, K. D., Peters, D. H., & Bandeen-Roche, K. (2006). Towards patient-centered health services in India—a scale to measure patient perceptions of quality. International Journal for Quality in Health Care, 18(6), 414-421.
Reidenbach, R. E., & Sandifer-Smallwood, B. (1990). Exploring perceptions of hospital operations by a modified SERVQUAL approach. Marketing Health Services, 10(4), 47.
Rohlin, M., Schaub, R.M., Holbrook, P., Leibur, E. and Roubalikova, L. (2002). Continuous quality improvement. European Journal of Dental Education. 6(3). 67-77.
Schvaneveldt, S.J., Enkawa, T. and Miyakawa, M.,( 1991). Consumer evaluation perspectives of service quality evaluation factors and two-way model of quality. Total Quality Management. 2 (2). 149-61.
Tomes, A. E., & Chee Peng Ng, S. (1995). Service quality in hospital care: the development of an in-patient questionnaire. International journal of health care quality assurance, 8(3), 25-33.
UNDP, U. (1990). Human Development Report 1990: Concept and Measurement of human development.
Vandamme, R., & Leunis, J. (1993). Development of a multiple-item scale for measuring hospital service quality. International Journal of Service Industry Management, 4(3), 30-49.
Ware Jr, J. E., & Snyder, M. K. (1975). Dimensions of patient attitudes regarding doctors and medical care services. Medical care, 669-682
Wicks, A.M. and Chin, W.W. (2008). Measuring the three process segments of a customer's service experience for an out-patient surgery center. International Journal of Health Care Quality Assurance. 21(1). 24-38.
World Health Organization (WHO). (2007). Everybody's Business: Strengthening Health Systems to Improve Health Outcomes WHO's framework for Action. Geneva: Author
Aqsa Siddiq et al.

255C 2016 CURJ, CUSIT
World Health Organization, (2010). Western Pacific Regional Strategy for Health Systems Based on the Values of Primary Health Care: Universal Coverage for Better Health Outcomes.
Yoo, D.K. and Park, J.A. (2007). Perceived service quality – analysing relationships among employees, customers, and financial performance. International Journal of Quality & Reliability Management. 24(9). 908-26
Yousapronpaiboon, K., & C. Johnson, W. (2013). Measuring hospital out-patient service quality in Thailand. Leadership in Health Services, 26(4), 338-355.
Zabada, C.P., Rivers, A. and Munchus, G. (1998). Obstacles to the application of total quality management in healthcare organisations. Total Quality Management. 9(1). 57-66
Quality of Healthcare Services...
256
ROLE OF SOCIAL MEDIA ON CONSUMER PREFERENCESFazle Malik*, Muhammad Asif** and Said Wali***
ABSTRACT
Social media is an integral part of every individual's life where one can share his/ her experience, opinions, and feelings with others. The democratization of information through social media has brought significant changes in the purchasing behaviors of consumers. Consumers' connectivity in a wired and online world allowed them to know everything about the products and services they want particularly their availability, price, location and the desire attributes. This research aims to find the importance of social media on consumers' purchasing behaviors, which includes information acquisition, electronic word of mouth, seller created information, consumers' perceived quality, and customers' perceived risk.
Keywords: Social media, electronic word of mouth, social media marketing, and consumers' behaviors.
INTRODUCTION
The World Wide Web was introduced in 1989 and during the same years Internet was also introduced which quickly become a global network for the people of the world (Hansel and Dyes, 2010). The introduction of Web 2.0 in 2004 was a transition from more static HTML to a more dynamic web which consists of such application software's that is users friendly and which facilitate open communication and information sharing with web based users. The essence of Web 2.0 is harnessing collective intelligence. That is Web 2.0 play an important role in collecting knowledge, insights, wisdom and expertise of diverse groups and then effectively using it for better and informed decision. Such type of collective intelligence generates new ideas, solve complicated and age-old problems and help in making the right decision about the future opportunities of the organization. Web 2.0 is a marketing buzzword and it facilitates business of an organization (Tim O'Reilly and John Battele 2009).
Social media are “internet-based applications that build on the ideological and technological foundations of Web 2.0 and that allow the creation and exchange of user-generated content” (Kaplan and Haenlen 2010). To get better sense of a product consumers access their groups online through social media to know and get their opinions regarding that particular product or service (Hensel & Deis, 2010). Social media is now getting greater importance in the field of marketing, advertising and communication and its users are growing exponentially every year (Constantinida and Stagnoa 2011). When the customers have strong relationship with the company then they share their experiences with other people through social media and recommend the brands to friends in the form of EWOM promotion. All these activities ultimately lead to
City University Research JournalVolume 06 Number 02 July 2016 PP 256-268
*Sales Executive, Otsuka Pakistan Ltd (PhD Scholar)** Assistant Professor, Management Sciences, City University of Science & IT, Peshawar. ***Lecturer, Management Sciences, City University of Science & IT, Peshawar.
C 2016 CURJ, CUSIT
257
greater growth and increase customer base (Gronroos, 2007). By the introduction of internet EWOM has far reaching effects due to its accessibility and spreading of messages to million people. It is an important marketing tool in the modern era of business world due to its credibility and the urge of people to interact through social media (Gummesson, 2008).
Statement of the Research Problem
Due to globalization, consumers are now aware from a number of alternative products which are available online and offline and have similar attributes and characteristics and they satisfy the same needs and wants of the customers. The availability of information is so complete and so profound that even a new terminology is required to interpret it precisely and accurately. This inexorable flow of information which is available for consumers has changed significantly their purchasing behaviors (Eric K. Clemons, 2008). According to the same researcher consumers informedness in a wired and online world allowed them to know everything about the products and services they want particularly their availability, price, location and the desire attributes. In the same way companies can identify the un-served and unmet needs of the consumers and address them with a new product or service. Online advertisement and purchases have become common in rest of the world. Social media is an important forum where people exchange ideas and experiences that make it an important tool for the companies to advertise their products and consumers to get information about their need satisfying products. Social media is now getting greater importance in the field of marketing, advertising and communication and its users are growing exponentially every year (Constantinida and Stagnoa 2011). Increased use of social media in Pakistan calls for an investigation for its impact on consumer preferences.
Objectives of the Research:
The specific objectives of the research are;
To find out different factors of social media that can influence consumers' preferences.
To find out the impact of electronic word of mouth, seller created information, information acquisition, perceived quality, and perceived risk on consumers' preferences.
Significance of the Research:
The study in hand will be helpful for organizations that are intended to incorporate social media to create Good will and create awareness about products and services. Information acquisition, electronic word of mouth, perceived quality is the factors to be kept in mind by managers while implementing social media in their organizations. This study will be a valuable addition in the body of literature especially from the context of Pakistan. People are making new connections online with a phenomenal growth every year and they tell each other about the products and services. It is understood that friends and families are more trusted in asking during purchasing decision. So this study will help to focus on this important channel through which they communicate messages to their customers.
C 2016 CURJ, CUSIT
Role of Social Media on Consumer Preferences
258
REVIEW OF THE RELATED LITERATURE
Social media are the online tools and platforms that are used by customers, friends, relatives, groups and communities to share information, opinions and experiences in the form of insights, perception, photos, music and videos with each other (Turban E, King D, Long J 2009). It is a medium used by organizations whether large or small, profit or non- profit to create awareness regarding their products and services. Through social media e-commerce is more customer as well as community driven. Social and economic benefits are attracted with networking. Nowadays people have developed network societies to reach each other for information, education, networking and e-commerce (Albert S, Flournoy P, Lebrasseur R. 2009). According to Evans social media is in tremendous growth stage so he advises businesses to participate in for future growth and progress because many people are connected with one another through this media (Evans D, 2008). Researchers predict that social media will be a dominant force in the future for businesses as well as for individuals so they must participate in it otherwise they will be out of market (Lauder KC, Traver CG, 2010).
Fisher and Reuber (2011) in their research found that if social media is finely deployed in an organization then it definitely bring about significant changes in its sales, growth, brand image, and company reputation in the market. In the same study it was also found that there is a direct positive relationship between social media and variables like organization's sales, growth, brand image, and company reputation in the market. One of the major advantages of social media is that it communicates information and conveys it to a large population, and helps customers to select from a number of available choices and thus ease the purchasing process for the businesses worldwide (Al Kailani and Kumar 2011). Surveys conducted by Pew Research Center in 2012 and 2013 found that 71% internet users access Facbook of whom 66% men and 76% women, 22% used LinedIn of whom majority are professional people and 18% used Twitter. According to the surveys the use of Smartphone is almost ubiquitous around the world. All Smartphone owners used their phone to access facebook and other sites for interaction with their friend and groups. They get information about products' prices and availability. In these users four-in-ten used their smart phone to access the sellers and get information about products and their prices. Beside this political, religious and community issues related discussion on these sites is very common. The recent wave of changed in the Arab world particularly Tunisia and Egypt also called as Arab Spring, social media play a pivotal role in molding the political behaviors of the people. In these countries six-in-ten share their opinions and feelings about politics, religious affairs and community issues (PEW Research Center, 2012 & 2013). Social networking sites were actively used in the 2008 and 2012 US election in order to attract young people and obtained their support in the form of attending rallies, gaining their votes and raising fund for political activities. The strategic utilization of social networking sites has mobilized the youth, raised enough funds for the election campaign and thus created the difference for Barak Obama in both elections. A paradigms shift in communication takes place in recent years due to the emergence of social media. Smart companies have included social media channels in their integrated marketing communication in order to keep and grow existing customers and attract new customers for rapid growth and grabbing more market share (Mangold and Faulds 2009).
C 2016 CURJ, CUSIT
Fazle Malik et al.
259
Theories of Social Media:
There are three main social media theories. Micro-theories deal with the information available online and the communication from individual social actors. Macro-theories deal with the structure and dynamics of social actors and social media content. Pseudo-theories deal with the recently developed conceptual framework in marketing. In this theory socialgraphic and social feedback loop of consumers are important considerations. In intuitive sense this theory is logical but in practice it is yet to be tested.
Micro-Theories:In the hospitality industry the most influential and frequent source of information is advices from friends and relatives (Perdue 1993, Crotts 1999). This sort of communication comes under the heading of word of mouth theory. The information communicated from friends and relatives is considered to be more credible and communicators are not compensated for such type of referrals. Due to the introduction of Web 2.0 technologies and other social networking sites consumers are now access even strangers experiences and post purchase comments which significantly affects their purchasing behavior (Depeches 2010). The social exchange theory states that individual through social media engage with those behaviors which are rewarding for them and avoid the cost.
Macro-Theories:Macro-theory views the individuals of the community as connected actors, and such theories use mathematical models to study its structure, evolution and development (Wasserman and Faust 1994). According to this theory social media is the materialization and solidification of consumers reviews, comments and chatters. The recent phenomenal growth in multi-dimensional social media has affected consumers purchasing behaviors and its interaction between social actors and information artifacts (Contractor 2009).
Pseudo-Theories:The social media landscape is changing very fast due to the democratization of information and the low cost of innovation. Businesses need to focus on the socialgraphics of the consumers instead of demographic, geographic, psychographic, profiles of them (Jowyang, 2010). Traditional decision making has three stages information, consideration and purchase. Some consumers will use the product, make opinion about it and then at later stage talk about it. Some of the experiences will be materialized by sharing them on social media to assist others in their decision making. Harnessing the feedback loop is more important for marketers and business (Dave Evans, 2008). From the discussion on pseudo-theory it has been proved that Socialgraphic framework and Social Feedback loop framework are important for marketers to consider and focus.
Theoretical Framework:
In this research information acquisition (IA), electronic word of mouth (EWOM), seller created information (SCI), customers' perceived product quality (PQ) and customers'
C 2016 CURJ, CUSIT
Role of Social Media on Consumer Preferences
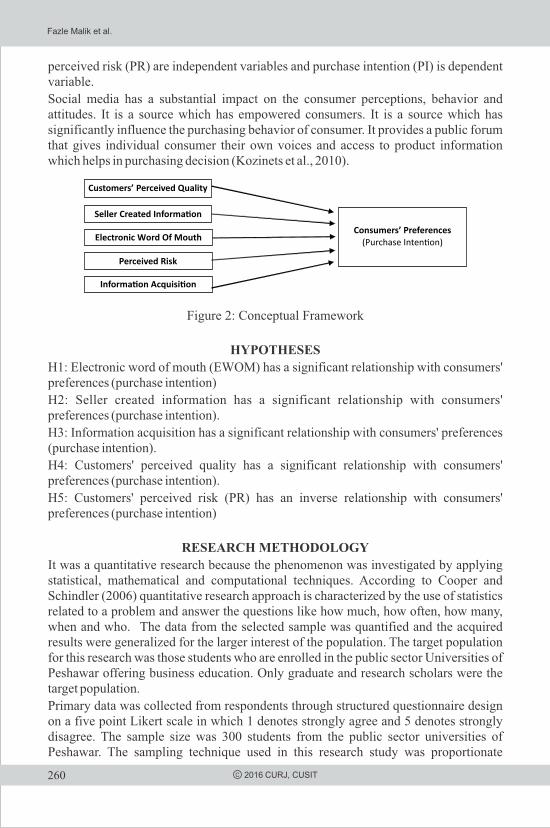
260 C 2016 CURJ, CUSIT
perceived risk (PR) are independent variables and purchase intention (PI) is dependent variable.
Social media has a substantial impact on the consumer perceptions, behavior and attitudes. It is a source which has empowered consumers. It is a source which has significantly influence the purchasing behavior of consumer. It provides a public forum that gives individual consumer their own voices and access to product information which helps in purchasing decision (Kozinets et al., 2010).
Figure 2: Conceptual Framework
HYPOTHESES
H1: Electronic word of mouth (EWOM) has a significant relationship with consumers' preferences (purchase intention)
H2: Seller created information has a significant relationship with consumers' preferences (purchase intention).
H3: Information acquisition has a significant relationship with consumers' preferences (purchase intention).
H4: Customers' perceived quality has a significant relationship with consumers' preferences (purchase intention).
H5: Customers' perceived risk (PR) has an inverse relationship with consumers' preferences (purchase intention)
RESEARCH METHODOLOGY
It was a quantitative research because the phenomenon was investigated by applying statistical, mathematical and computational techniques. According to Cooper and Schindler (2006) quantitative research approach is characterized by the use of statistics related to a problem and answer the questions like how much, how often, how many, when and who. The data from the selected sample was quantified and the acquired results were generalized for the larger interest of the population. The target population for this research was those students who are enrolled in the public sector Universities of Peshawar offering business education. Only graduate and research scholars were the target population.
Primary data was collected from respondents through structured questionnaire design on a five point Likert scale in which 1 denotes strongly agree and 5 denotes strongly disagree. The sample size was 300 students from the public sector universities of Peshawar. The sampling technique used in this research study was proportionate
Electronic Word Of Mouth
Perceived Risk
Customers’ Perceived Quality
Consumers’ Preferences (Purchase Inten�on)
Informa�on Acquisi�on
Seller Created Informa�on
Fazle Malik et al.
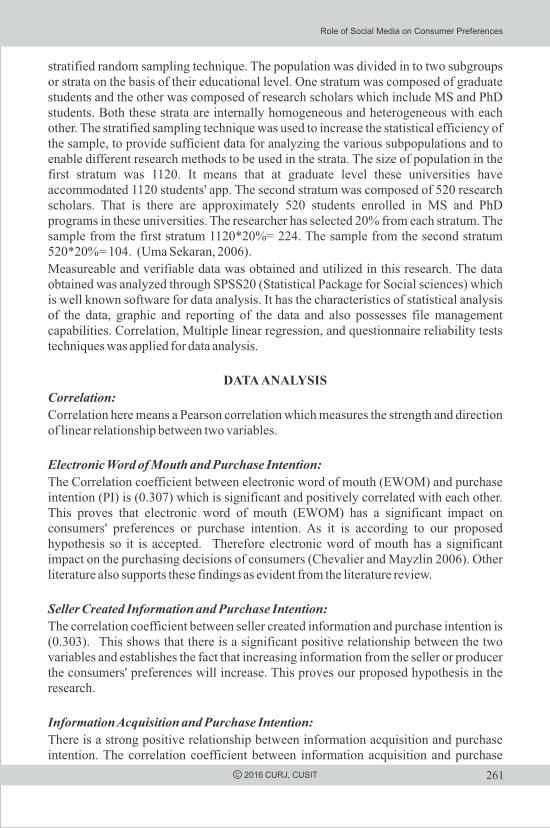
261C 2016 CURJ, CUSIT
stratified random sampling technique. The population was divided in to two subgroups or strata on the basis of their educational level. One stratum was composed of graduate students and the other was composed of research scholars which include MS and PhD students. Both these strata are internally homogeneous and heterogeneous with each other. The stratified sampling technique was used to increase the statistical efficiency of the sample, to provide sufficient data for analyzing the various subpopulations and to enable different research methods to be used in the strata. The size of population in the first stratum was 1120. It means that at graduate level these universities have accommodated 1120 students' app. The second stratum was composed of 520 research scholars. That is there are approximately 520 students enrolled in MS and PhD programs in these universities. The researcher has selected 20% from each stratum. The sample from the first stratum 1120*20%= 224. The sample from the second stratum 520*20%= 104. (Uma Sekaran, 2006).
Measureable and verifiable data was obtained and utilized in this research. The data obtained was analyzed through SPSS20 (Statistical Package for Social sciences) which is well known software for data analysis. It has the characteristics of statistical analysis of the data, graphic and reporting of the data and also possesses file management capabilities. Correlation, Multiple linear regression, and questionnaire reliability tests techniques was applied for data analysis.
DATA ANALYSIS
Correlation:
Correlation here means a Pearson correlation which measures the strength and direction of linear relationship between two variables.
Electronic Word of Mouth and Purchase Intention:
The Correlation coefficient between electronic word of mouth (EWOM) and purchase intention (PI) is (0.307) which is significant and positively correlated with each other. This proves that electronic word of mouth (EWOM) has a significant impact on consumers' preferences or purchase intention. As it is according to our proposed hypothesis so it is accepted. Therefore electronic word of mouth has a significant impact on the purchasing decisions of consumers (Chevalier and Mayzlin 2006). Other literature also supports these findings as evident from the literature review.
Seller Created Information and Purchase Intention:
The correlation coefficient between seller created information and purchase intention is (0.303). This shows that there is a significant positive relationship between the two variables and establishes the fact that increasing information from the seller or producer the consumers' preferences will increase. This proves our proposed hypothesis in the research.
Information Acquisition and Purchase Intention:
There is a strong positive relationship between information acquisition and purchase intention. The correlation coefficient between information acquisition and purchase
Role of Social Media on Consumer Preferences
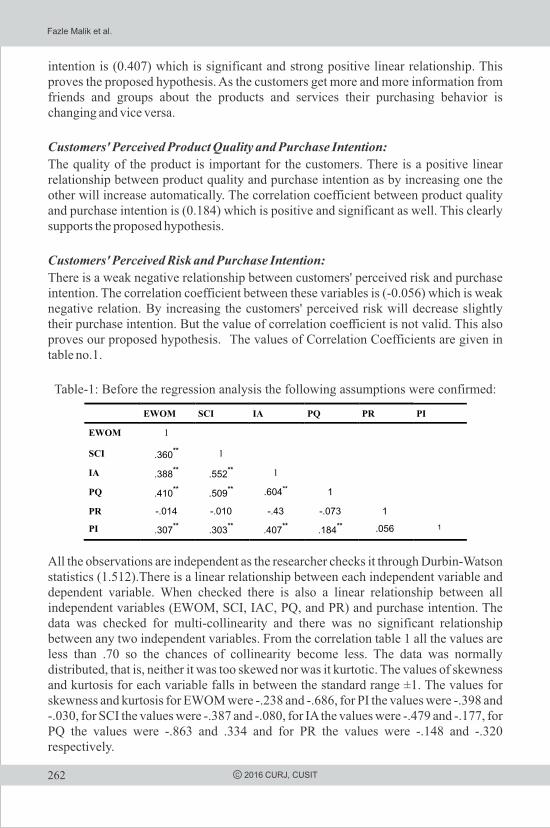
262 C 2016 CURJ, CUSIT
intention is (0.407) which is significant and strong positive linear relationship. This proves the proposed hypothesis. As the customers get more and more information from friends and groups about the products and services their purchasing behavior is changing and vice versa.
Customers' Perceived Product Quality and Purchase Intention:
The quality of the product is important for the customers. There is a positive linear relationship between product quality and purchase intention as by increasing one the other will increase automatically. The correlation coefficient between product quality and purchase intention is (0.184) which is positive and significant as well. This clearly supports the proposed hypothesis.
Customers' Perceived Risk and Purchase Intention:
There is a weak negative relationship between customers' perceived risk and purchase intention. The correlation coefficient between these variables is (-0.056) which is weak negative relation. By increasing the customers' perceived risk will decrease slightly their purchase intention. But the value of correlation coefficient is not valid. This also proves our proposed hypothesis. The values of Correlation Coefficients are given in table no.1.
Table-1: Before the regression analysis the following assumptions were confirmed:
All the observations are independent as the researcher checks it through Durbin-Watson statistics (1.512).There is a linear relationship between each independent variable and dependent variable. When checked there is also a linear relationship between all independent variables (EWOM, SCI, IAC, PQ, and PR) and purchase intention. The data was checked for multi-collinearity and there was no significant relationship between any two independent variables. From the correlation table 1 all the values are less than .70 so the chances of collinearity become less. The data was normally distributed, that is, neither it was too skewed nor was it kurtotic. The values of skewness and kurtosis for each variable falls in between the standard range ±1. The values for skewness and kurtosis for EWOM were -.238 and -.686, for PI the values were -.398 and -.030, for SCI the values were -.387 and -.080, for IA the values were -.479 and -.177, for PQ the values were -.863 and .334 and for PR the values were -.148 and -.320 respectively.
EWOM SCI IA PQ PR PI
EWOM 1
SCI .360**
1
IA .388** .552
** 1 PQ .410
**
.509
**
.604**
1
PR -.014 -.010 -.43 -.073 1
PI .307**
.303**
.407**
.184** .056 1
Fazle Malik et al.
263C 2016 CURJ, CUSIT
REGRESSION ANALYSIS
Regression analysis of Hypothesis H1 (EWOM has a direct relationship with consumers' preferences)
Table 2 shows that in the regression analysis consumers' preferences is significantly (B=.306, P=.000) affected by electronic word of mouth which is independent variable. The table gives the value of R2 (the total variation in the dependent variable due to the effect of independent variable explained by our proposed regression model). F value is also greater than 10 which shows that the propose model is fit. If t value is greater than 1.96 and P value less than .005 then the proposed hypothesis is accepted. Hence the first hypothesis of this research study is accepted.
Regression analysis of Hypothesis H2 (Seller created information has a significant relationship with consumers' preferences).
Table 2 shows that the value of R2 (explain the proportion of variation in the dependent variable explain by the regression model). Here its value is 10% which is the total variance in consumers' preferences due to seller created information. The relationship is also significant (B=.341 and P=.000). A unit change in seller created information, there is 34% change in consumers' preferences. Similarly t value is 4.652 and P value is .000 which shows that the proposed hypothesis is accepted. The F value is 21.638 which show that the model is best fit for the population from where the data has been collected.
Regression analysis of Hypothesis H3 (Information acquisition has a s ignif icant relationship with consumers' preferences).
From table 2 it is clear that R2 (explain the proportion of variation in the dependent variable explain by the regression model) and here its value is 16% that is 16% of variability in consumers' preferences is due to information acquisition. The regression model shows that the relationship between information acquisition and consumers' preferences is significant (B=.413 and P=.000). A unit change in information acquisition will bring 41% increase in consumers' preferences. The value of t= 6.203 and that of P = .000 which shows that the conditions are favorable to accept the third hypothesis.
Regression analysis of Hypothesis H4 (Customers' perceived quality has a significant relationship with consumers' preferences).
Table 2 shows that a unit changes in perceived quality will brought 17% change in consumers' preferences. The B=.171 and P=.000 which shows that there is significant relationship between perceived quality and consumers' preferences as hypotheses in the above hypothesis. The variability in consumer preferences due to perceived quality is just 3%. The t=2.614 and P=.000 which lead to the acceptance of the proposed hypothesis. The F=6.832 which shows that the regression model is fit for the population.
Regression analysis of Hypothesis H5 (Customers' perceived risk (PR) has an inverse relationship with consumers' preferences).
From table 5 it is clear that B=.043 and P=.322 which shows that there is not a significant
Role of Social Media on Consumer Preferences
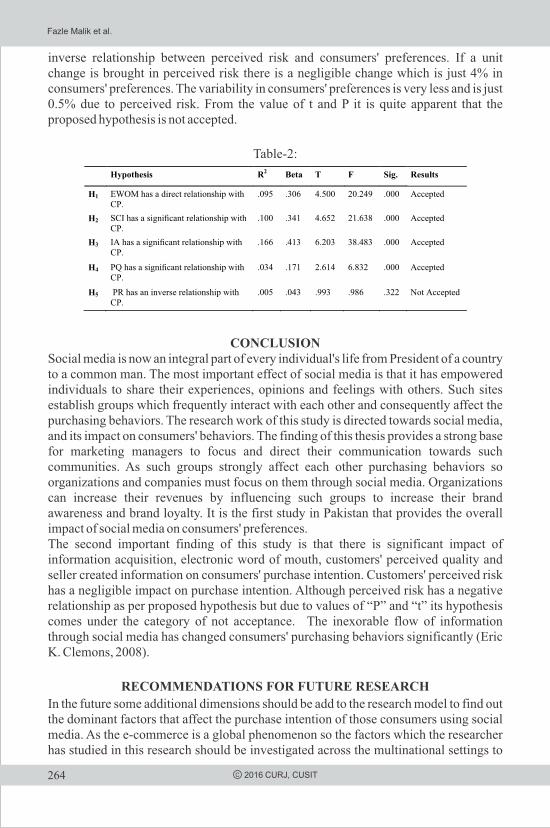
264 C 2016 CURJ, CUSIT
inverse relationship between perceived risk and consumers' preferences. If a unit change is brought in perceived risk there is a negligible change which is just 4% in consumers' preferences. The variability in consumers' preferences is very less and is just 0.5% due to perceived risk. From the value of t and P it is quite apparent that the proposed hypothesis is not accepted.
Table-2:
CONCLUSIONSocial media is now an integral part of every individual's life from President of a country to a common man. The most important effect of social media is that it has empowered individuals to share their experiences, opinions and feelings with others. Such sites establish groups which frequently interact with each other and consequently affect the purchasing behaviors. The research work of this study is directed towards social media, and its impact on consumers' behaviors. The finding of this thesis provides a strong base for marketing managers to focus and direct their communication towards such communities. As such groups strongly affect each other purchasing behaviors so organizations and companies must focus on them through social media. Organizations can increase their revenues by influencing such groups to increase their brand awareness and brand loyalty. It is the first study in Pakistan that provides the overall impact of social media on consumers' preferences. The second important finding of this study is that there is significant impact of information acquisition, electronic word of mouth, customers' perceived quality and seller created information on consumers' purchase intention. Customers' perceived risk has a negligible impact on purchase intention. Although perceived risk has a negative relationship as per proposed hypothesis but due to values of “P” and “t” its hypothesis comes under the category of not acceptance. The inexorable flow of information through social media has changed consumers' purchasing behaviors significantly (Eric K. Clemons, 2008).
RECOMMENDATIONS FOR FUTURE RESEARCH
In the future some additional dimensions should be add to the research model to find out the dominant factors that affect the purchase intention of those consumers using social media. As the e-commerce is a global phenomenon so the factors which the researcher has studied in this research should be investigated across the multinational settings to
Hypothesis R2 Beta T F Sig. Results
H1 EWOM has a direct relationship with CP.
.095 .306 4.500 20.249 .000 Accepted
H2 SCI has a signicant relationship with CP.
.100
.341
4.652
21.638
.000 Accepted
H3 IA has a signicant relationship with CP.
.166 .413 6.203 38.483 .000 Accepted
H4 PQ has a signicant relationship with CP.
.034
.171
2.614
6.832
.000 Accepted
H5 PR has an inverse relationship with CP.
.005 .043 .993 .986 .322 Not Accepted
Fazle Malik et al.
265C 2016 CURJ, CUSIT
device generalized results for multinational organizations. The researcher suggests that in future studies must focus on the impact of social media on the consumers' cognitive, affective and behavioral attitudes should be seen to draw some practical implications for organizations.
Future research may also take all segments of society such as children; professionals etc to generalized it for the whole society. Because social networking sites in social media are the hub of interaction for every individual of all age groups. The impact of a product's facebook page on consumers' preferences should be studied to draw some practical implications for the companies. The Facebook page of a product or company is like by users of social media and then it is rated on the bases of likes. It is also suggested that relationship of social media with hospitality and service industry should be investigated. The impact of social media on organization's efficiency, productivity, profitability, growth and market share should be studied to draw some practical implications for many other organizations.
REFERENCESAaker, D. A. (1991). Managing brand equity: Capitalizing on the Value of a Brand
Name. New York: The Free Press.
Akrimi, Y., & Khemakhem, R. (2012). What Drive Consumers to Spread the Word in Social Media? Journal of Marketing Research & Case Studies, 2012, 1-14.
Akrimi, Y., & Khemakhem, R. (2012). What Drive Consumers to Spread the Word in
Social Media? Journal of Marketing Research & Case Studies, 2012, 1-14. Al Kailani, M., & Kumar, R. (2011). Investigating Uncertainty Avoidance and
Perceived Risk for Impacting
Al Kailani, M., & Kumar, R. (2011). Investigating Uncertainty Avoidance and Perceived Risk for Impacting
Anderson J., Narus J., & Narayandas D. (2009). Business Market Management: Understanding, Creating, and Delivering Value (3 th ed.). New Jersey: Prentice Hall.
Anderson, C. 2008. The end of theory: The data deluge makes the scientific Method obsolete. Wired Magazine, 16(7), 16-07.
Anderson, Erin and Barton A. Weitz and (1992), "The Use of Pledges to Build and Sustain Commitment in Distribution Channels," Journal of Marketing Research, 29 (February), 18-34
Auker, Craig, Social Media and Its Application in Business Marketing (December 17, 2011). Available at SSRN: http://ssrn.com/abstract=2067223 or http://dx.doi.org/10.2139/ssrn.2067223 behaviors: Traditional mass-market, trading down, and trading out into the long tail. Electronic Commerce Research and Applications, 7, 1 (Spring 2008), 3–17.
Role of Social Media on Consumer Preferences

266 C 2016 CURJ, CUSIT
Bhatnagar, A., Misra, S., & Rao, H.R. (2000). On Risk, Convenience, and Internet Shopping Behavior.Communications of the ACM, 43, 11, 98-105.
Carlsson, L. (2010). Marknadsföring och kommunikation i sociala medier. Mölndal:Kreafon AB.
Chevalier, J. and Mayzlin, D. (2006) “The Effect of Word of Mouth on Sales: Online Book Reviews,”Journal of Marketing Research, 43, 345-354.
Clemons, E.K., and Gao, G. Consumer informedness and diverse consumer purchasingDavidsson, B., & Patel R. (2003). Forskningsmetodikens grunder: Att planera,
genomföra och rapportera en undersökning. Lund: Studentlitteratur. Dépêches 2010. Tripadvisor Becomes the First Travel Brand to Break the 40 Million
Unique Monthly Visitors Barrier, [online, 1 November] Available at: http://www.aeroweb-fr.net/depeches/2010/09/tripadvisor-becomes-the-first-travel-brand-to-break-the-40-million-unique-monthly-visitors-barrier [accessed: 1 December, 2010 ].
Dugan , L . 2012 . How Do Consumers Use Soc ia l Media to Shop? (http://www.mediabistro.com/alltwitter/consumers-use-social-media-to shop_b25544
Evans, D. 2008. Social Media Marketing: An Hour a Day. Indianapolis, IN: Sybex.
Ford D., Gadde L-E., Håkansson H., & Snehota I. (2006). The Business Marketing Course: Managing in Complex Networks (2th ed.). England: Wiley.
Goldsmith, R. E., Lafferty, B. A., & Newell, S. J. (2002). The dual credibility model: the influence of corporate and endorser credibility on attitude and purchase intention. Journal of Marketing Theory and Practice, 10(3), 1-6.
Grönroos, C. (1994). From marketing mix to relationship marketing: towards a paradigm shift in marketing. Bradford: MCB University Press.
Grönroos, C. (2007). Service management and marketing. Chichester: John Wiley & Sons.
Haenlein, M., & Michael, H.(2009). Users of the world, unite: The challenges and opportunities of Social Media, Business Horizons, 53 (1), p. 20.
Harridge-March, S., & Quinton, S. (2009). Virtual snakes and ladders: social networks and the relationship marketing loyalty ladder. The marketing review, 9(2), 171-181.
Hensel, K., Michael, H. & Deis. (2010). Using social media to increase advertising and improve marketing.
Fazle Malik et al.
267C 2016 CURJ, CUSIT
Internet Buying: A Study in Three National Cultures. International Journal of Business and Management,6(5), 76-92.
Internet Buying: A Study in Three National Cultures. International Journal of Business and Management,6(5), 76-92.
Jowyang, J. 2010. Socialgraphics Help You to Understand Your Customers: Slides and Webinar Recording. [online, January 21, 2010] Available at: http://www.web-strategist.com/blog/category/socialgraphics/ [accessed: 1 November, 2010].
Kotler, P., & Keller, K.L. (2008). Marketing Management (13th ed.). Prentice-Hall, Upper Saddle River, NJ.
Laroche, M., Habibi, M. R., Richard, M. O., & Sankaranarayanan, R. (2012). The effects of social media based brand communities on brand community markers, value creation practices, brand trust and brand loyalty.Computers in Human Behavior, 28, 1755-1767.
Laroche, M., Habibi, M. R., Richard, M. O., & Sankaranarayanan, R. (2012). The effects of social media based brand communities on brand community markers, value creation practices, brand trust and brand loyalty.Computers in Human Behavior, 28, 1755-1767.
Liker, R et al. 1934. A simple and reliable method of scoring the Thurstone attitude scales. Journal of Social Psychology: 228-238.
Mangold, W. G., & Faulds, D. J. (2009). Social media: The new hybrid element of the promotion mix. Business Horizons, 52, 357-365.
Mangold, W. G., & Faulds, D. J. (2009). Social media: The new hybrid element of the promotion mix. Business Horizons, 52, 357-365.
O ' R e i l l y, T. 2 0 0 6 . We b 2 . 0 C o m p a c t D e f i n i t i o n : Tr y i n g A g a i n . (http://radar.oreilly.com/2006/12/web-20-compact-definition-tryi.html
Olenski , S. 2012. Three Of Four CMOs Say Social Media Impacts Sales.(http://www.forbes.com/sites/marketshare/2012/08/21/three-of-four-cmos-say-social-media-impacts-sales.
Park, D., Lee, J. and Ham, I., 2007, “The effect of on-line consumer reviews on consumer purchasing intention: The moderating role of involvement,” International Journal of Electronic Commerce, Vol. 11, No. 4, pp. 125-148.
Pollay, R. W., & Mittal, B. (1993). Here's the Beef: Factors, Determinants, and Segments in Consumer Criticism of Advertising. Journal of Marketing, 57(3), 99-114
Role of Social Media on Consumer Preferences
268 C 2016 CURJ, CUSIT
Parasuraman, A., Zeithaml, V. and Berry, L.L. (1991). Refinement and reassessment of the SERVQUAL scale. Journal of Retailing. 67(4). 420-50.
Pitt, L.F. and Jeantrout, B.,( 1994). Management of customer expectations in service firms: a study and a checklist. The Services Industries Journal. 14(2). 170-89.
Porter, M. E. (2010). What is value in health care?. New England Journal of Medicine. 363(26). 2477-2481.
Rao, K. D., Peters, D. H., & Bandeen-Roche, K. (2006). Towards patient-centered health services in India—a scale to measure patient perceptions of quality. International Journal for Quality in Health Care, 18(6), 414-421.
Reidenbach, R. E., & Sandifer-Smallwood, B. (1990). Exploring perceptions of hospital operations by a modified SERVQUAL approach. Marketing Health Services, 10(4), 47.
Rohlin, M., Schaub, R.M., Holbrook, P., Leibur, E. and Roubalikova, L. (2002). Continuous quality improvement. European Journal of Dental Education. 6(3). 67-77.
Schvaneveldt, S.J., Enkawa, T. and Miyakawa, M.,( 1991). Consumer evaluation perspectives of service quality evaluation factors and two-way model of quality. Total Quality Management. 2 (2). 149-61.
Tomes, A. E., & Chee Peng Ng, S. (1995). Service quality in hospital care: the development of an in-patient questionnaire. International journal of health care quality assurance, 8(3), 25-33.
UNDP, U. (1990). Human Development Report 1990: Concept and Measurement of human development.
Vandamme, R., & Leunis, J. (1993). Development of a multiple-item scale for measuring hospital service quality. International Journal of Service Industry Management, 4(3), 30-49.
Ware Jr, J. E., & Snyder, M. K. (1975). Dimensions of patient attitudes regarding doctors and medical care services. Medical care, 669-682
Wicks, A.M. and Chin, W.W. (2008). Measuring the three process segments of a customer's service experience for an out-patient surgery center. International Journal of Health Care Quality Assurance. 21(1). 24-38.
World Health Organization (WHO). (2007). Everybody's Business: Strengthening Health Systems to Improve Health Outcomes WHO's framework for Action. Geneva: Author
Fazle Malik et al.

269
CAUSES OF SERVICE FAILURE: A LITERATURE REVIEWAmir Ishaque*, Muhammad Tufail** and Muhammad Nauman Habib***
ABSTRACT
The purpose of the paper is to provide an overview of available literature on causes of service failures. Last five years papers from leading journals addressing services marketing listed in emerald insights have been included in this study. This review has its focus on papers, which were specifically explored causes of service failures. Many papers explained the nature of service recovery but there were few papers, which specifically found and mentioned different causes of service failures in different domains of services industry. This study categorizes the different causes of service failures according to the services marketing mix that is seven Ps of services marketing. This is the only literature review that combined different causes of service failure in different industries under the umbrella of services marketing mix.
Keywords: Services Failure, Causes, Literature, Marketing
INTRODUCTION
There are always some expectations in the mind of customer when he/she buys some product or service, when expectations do not match with perceptions, service failure occurs (Shapiro, Nieman and Gonder, 2006). After facing service failure, customer evaluates this failure and shapes his/her response in terms of emotions and behavior (Bonifield and Cole, 2007). The severity of service failure does not matter at all even a minor mistake from the service provider can cause service failure and consequences can be worse (Lee and Park, 2010). Today, markets around the world are highly competitive, in this market only those organizations are successful who have loyal customers. Service failures have the ability to demolish the customer loyalty (Mattila, 2001). To reduce the service failures during service delivery is a challenging job because the reputation of the service provider is on the stake at service delivery time (Fr, 2008).
Previous research shows competitive service market does not give space for the service failure (Dutta, Venkates & Parsa, 2007). They further argued that if organization fails to give customer's expected service, it actually builds negative image in the customer's mind about the organization, so organization must attend failure to increase the positive thinking and to reduce negative consequences. The consequences of service failure are very dangerous for the organization and result in negative consequences. In this regard research shows that service failure causes customer to be angry and dissatisfied which arise negative repurchase intentions in the mind of the customer he starts spreading negative word of mouth about the service (Huang and Lin, 2011; Sabharwal, Soch and Kaur, 2010).
Above discussion tells about the severity of the consequences of services failure and its
City University Research JournalVolume 06 Number 02 July 2016 PP 269-283
* Lecturer, National University of Modern Languages, Peshawar. [email protected]** Lecturer, Abdul Wali Khan University, Mardan. [email protected] *** Assistant Professor, Management Sciences, City University of Science & I.T, Peshawar.PhD Scholar, Institute of Management Sciences, Peshawar. [email protected]
C 2016 CURJ, CUSIT
270
effect on the organization. Different researchers have worked out on the causes of service failure and point out number of reasons and incidents results in service failure (Funches, 2011; Chung and Kates, 2009; Park, Lehto and Park, 2008; Bunker and Ball, 2008; Forbes, 2008; Beverland, Baker, Meyer and Johnson, 2008; Dutta et al, 2007). There are a lot of studies which cover the service recovery strategies but they did not focus on the causes of service failure. There is no study, to our knowledge, which covers causes of service failure as a whole in scientific manner
The purpose of this study was to review the last five years literature on service failure from the leading services marketing journals to find out the reasons of the service failure. After finding the reasons researchers will scientifically categorize them into different domain and in sub domains.
Background
Researchers have conducted extensive literature review to understand different issues like Baldvinsdottir et al (2011) worked on the issue of accounting research and trust and Sangeetha and Mahalingam (2011) reviewed literature on service quality models in banking. In the same vein, causes of services failure is an important issue which has been addressed in different studies (e.g. Huang & Lin, 2011; Neira et al, 2010; Tsarenko and Tojib, 2011) from different perspectives, but there is not a single study that may comprehensively gone for a thorough review of literature that may help to understand possible causes for service failure.
METHODOLOGY
The study used five years (2007-2011) papers published in the journals that are specifically focusing services marketing and are published by Emerald group publishing. Search on the basis of keywords found a total of thirty nine papers addressing service failure but on careful scrutiny, authors were left with only seven papers that were specifically addressing causes of service failure while the rest had their focus on service recovery and its effects on consumers' future purchase behavior. A brief summary of all the articles about how studies were conducted and the area of study is presented in data preview analysis section in table 1. These studies were divided into themes for discussion and comparison. Themes among those studies were categorized into six broader categories of causes of service failure; process failure, people failure, product failure, price failure, place failure, and physical evidence failure (see table 2).
Data Preview Analysis
Service failures can vary from industry to industry but there are also some common failures identified in all the sectors of service industry. Researchers have limited numbers of articles in which other researchers mentioned causes of service failure. In last five years hotel, tourism, restaurant, banking and hospital based service providers were the focus of most of the researchers. Jones and Dawes ( 2007) have conducted online survey to gather the service failure reasons in the banking industry of the UK. Huang and Lin (2011) selected bank and hotel industry They have identified number of service failures in banking sector, for instance, errors in crediting and debeting accounts , overdrawn of charges, dealing with bank on phone, online and in branch, getting
C 2016 CURJ, CUSIT
Amir Ishaque et al.
271
information from bank, Requesting a new cash card/cheque book/credit card, account opening, take out loan mortgage and loans, intrest rates etc. The highly serious failures reported in their work are errors in crediting and debeting accounts and overdrawn of charges. They argued that bank charges can be profitable for short term but in long run bank can lose customer. These small service failures can severely affect customer loyalty and influnce negative word of mouth.
Huang and Lin (2011) further argued that avoiding service failure during service delivery is very difficult task for the organization even for the top best service providers. They use both qualitative and quantative techniques to explore the effectivness of compensation strategies for services. They reported two catagories of service failures namely inadequate delivery of service ( employee rude behavior) and unavalibility of service (unavalibiltiy of reserved room).
Gruber (2011) has used quantative technigues to explore that what treatment complaining customers wants from front line service providers when complain is handeled personnaly. He has reported different types of service failures due to the front line employees' like unsaisfactory employees handeling with customers, lack of competency, lack of attention to the customers, rude behavior, not apologizing for the service or product failure.
Funches (2011) discovered consumer anger incidents. Researcher used critical incident technique along with three samples. The key findings of the study suggest that consumer may become angry because of belief that firm is failed to deliver the value as communicated to customer or customer's conviction that they were treated by the firm or service provider in wrong and unfair way. Another reason may be arised when the customer perceives that any one in particlar organization is expressing opposition toward him. Anger plays a major role to influnce customers' decision as once customer betrayed he/she may quit the relationship with the firm.
Neira,Casielles and Iglesias (2010) introduced the concept of preferential treatment as a service failure and examine its effect on dissatisfaction. They gathered data with the help of interviews and used structural equation modelling to analyze the relationship between preferential treatment and dissatisfaction. Customers some times may think that service provider is giving priority to other customers but not to them. Other causes they have mentioned in this research are related to the behavior of the employees (not polite staff) and long ques.
Lee and Park (2010) introduced the concept of double deviation that means service failure followed by unsuccessful recovery attempt. The data were gathered from online third parties CIT. While using quantative methods, they extend the catagories proposed by Park et al (2008) and catagorized differsent causes of service failure into four catagories. These catagories are distributive justice, procedural justice, interpersonal justice and informational justice. This time they catagorized limited physical compensation, product failure, delivery failure, unfair charges and time failure under the head of distributive justice and limited accessibility, limited decision control, limited process control, limited follow up and limited flexibility were defined as sub catagories of procedural justice while no empathy, no effort, impolitness and no apology fall in interpersonal justice where as they defined no explaination and dishonesty in new category of informational justice.
C 2016 CURJ, CUSIT
Causes of Service Failure...
272
Tsang and ShuSu, (2009) examined service faliure and recovery strategy in resturant context and canvassed seriousness of servious failure. They used qualitative techniques to gather the data. In their study four hundred and thirty one incidents of service failure of chain resturents were examined. They catogorized service failure in four major catagories that is employees' response to service delivery system, employee's response to implicit/explicit customer requests, unprompted and unsolicited employee's actions and problematic customer behavior. These categories were further divided into no of sub categories. They found that when customers face Product defects, slow/unavaliable service, facility problem, unclear policy and when the dishes were not delivered in proper order service delivery becomes a failure. When dishes are not cooked properly, not served in proper order or there are some seating problems for the customers, they categorized them in the main category named as employee responses to implicit and explicit customer requests. Another important category due to the employee unprompted and unsolicited employee actions contains employee behavior, wrong order, lost order, over charging and overturning the dishes or drinks. Lastly, sometimes service fails due to problematic customer's behavior a more likely due to aberrant consumer behavior.
Park et al (2008) uncovered the dimensions of justice that make up negative experience in family travel which can encounter service failure. Reseracher gathered data from third party public complaint websites and catagorized them by using critical incident technique. They catagorized different causes of service failure into three justice dimensions that is distributive justice, procedural justice and interactional justice. They catagorized business environment, charges and payment, return and refund, false advertisment, contract and product failure into distributive justice while corporate policy, reservation and timely delivery of services fall under the head of procedural justice and third category interactional justice contained employee attatiude and quality, communication, illegal practice, minority care and lack of or inefficient service. They also found that the occurrence of complaints in distributive is higher than other dimensions but major disparity has been found in justice dimensions in the sector.
C 2016 CURJ, CUSIT
Amir Ishaque et al.

273C 2016 CURJ, CUSIT
Tab
le :
Dat
a P
revi
ew o
f S
tudi
es o
n C
ause
s of
Ser
vice
Fai
lure
Causes of Service Failure...

274 C 2016 CURJ, CUSIT
Amir Ishaque et al.
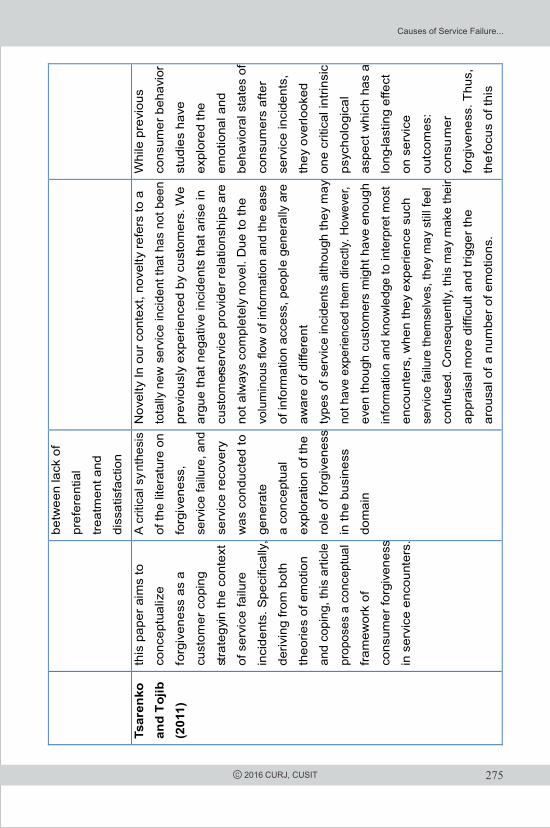
275C 2016 CURJ, CUSIT
Causes of Service Failure...
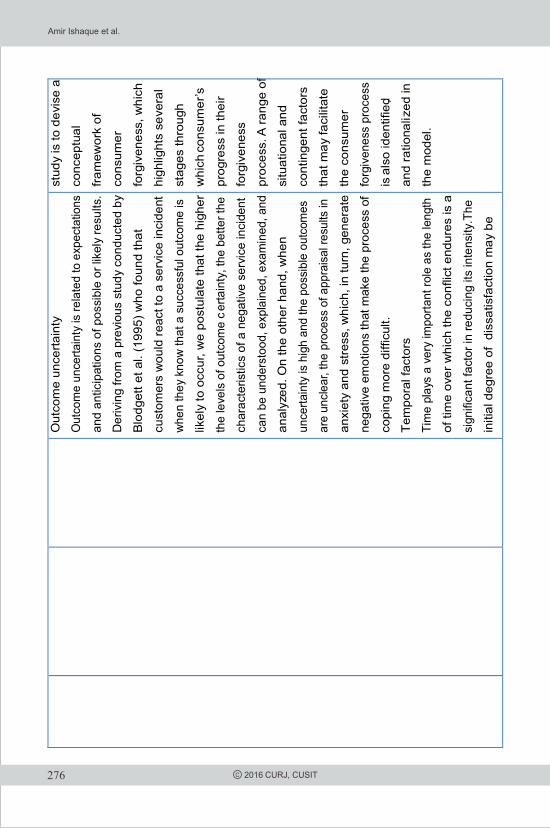
276 C 2016 CURJ, CUSIT
Amir Ishaque et al.
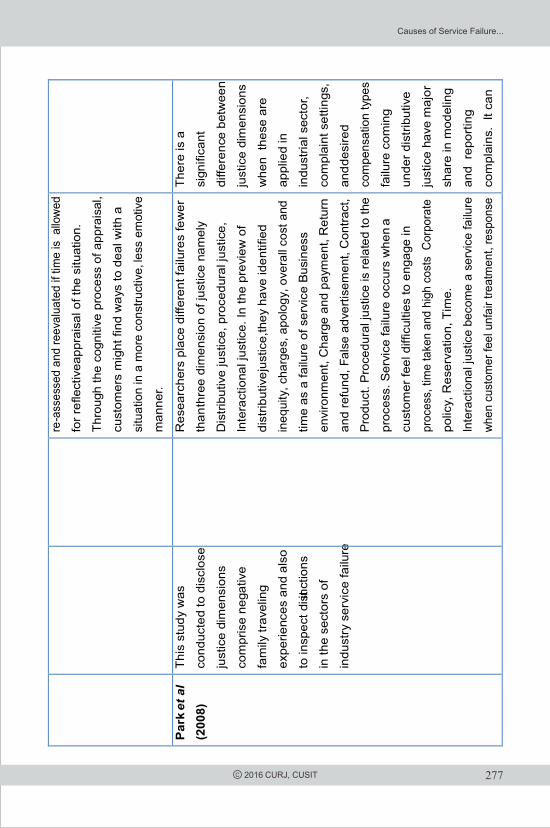
277C 2016 CURJ, CUSIT
Causes of Service Failure...

278 C 2016 CURJ, CUSIT
Amir Ishaque et al.

279
CONCLUSION
Researchers have found the contents of seven Ps mentioned by different scholars but all are focusing the positive side and results. In the past, different scholars have mentioned different types of ingredients under each services marketing mix in their research. For instance, Viganli (2001) has discussed services marketing mix and classifies different operations under each P. like he suggested that features, quality, and quantity lies in the product class. While location and number facilities comes in place, pricing level, strategy and its determents in price, sales promotions, advertisement, and public relations in promotion, laws, customs, culture, attitudes, and competencies in people, blue printing of services or product, automation, and standardized procedures in process and internal and external physical environment and decor in physical evidence.
The idea behind this study was to identify service failures and to realize the important role of these failures for different negative consequences. This study has categories these failures under the head of services marketing mix. The purpose to categorize these service failures in services marketing mix is to help managers to focus such kind of failures in their areas of practice. By classifying services marketing mix every manager staying in his/her own department can focus on the possible failures and can take steps to avoid any loss. It is necessary to mention that service-marketing mix of service is highly helpful in all means for the service provider, but on parallel side, any minute negligence can be destructive for whole image of service provider. Therefore, it will be beneficial for the service provider to ensure implementation of seven Ps at micro level by keeping in mind the failures associated with these Ps.
Further the researchers presented the key causes found in all the selected papers and categorized them according to the seven Ps of services marketing that is product, price, place, promotion, people, process and physical evidence. These categories and their sub categories are separately presented in the table 2
C 2016 CURJ, CUSIT
Causes of Service Failure...

280 C 2016 CURJ, CUSIT
Tab
le 2
: T
hem
e ba
sed
Ana
lysi
s
Amir Ishaque et al.
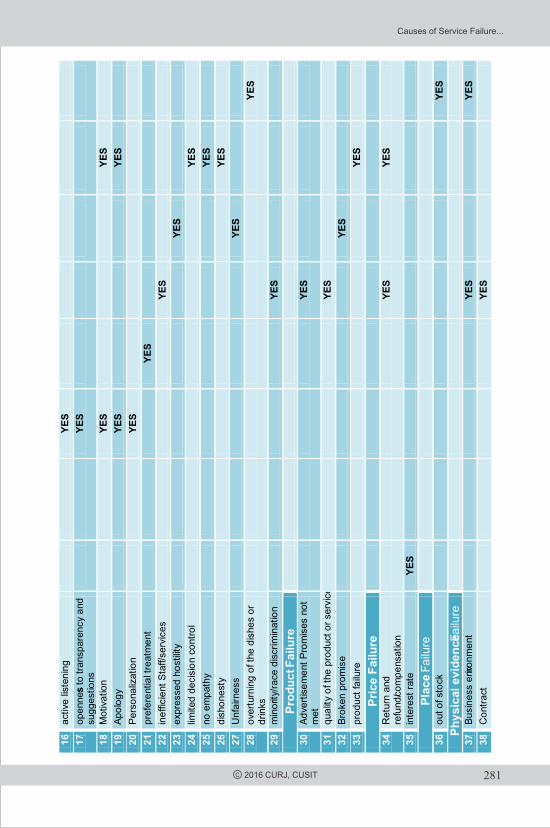
281C 2016 CURJ, CUSIT
Causes of Service Failure...
282 C 2016 CURJ, CUSIT
REFERENCESBonifield, C., & Cole, C. (2007). Affective responses to service failure: Anger, regret,and retaliatory versus conciliatory responses. Market Lett , 18, 85–99.
Chen-Tsang, & ShuSu, C. (2009). Service failures and recovery strategies of chain restaurants in Taiwan. The Service Industries Journal , 29 (12), 1779 – 1796.
Claudio Vignali, (2001). McDonald's: “think global, act local” – the marketing mix. British Food Journal, 103(2), 97 – 111
Dutta, K., Venkatesh, U., & Parsa, H. (2007). Service failure and recovery strategies in the restaurant sector; An Indo-US comparative study. International Journal of Contemporary Hospitality management , 19 (5), 351-363.
Fr, R. L. (2008). The Impact of firm reputation and failure severity on customer responses to service failures. Journal of service marketing , 22 (5), 385-398.
Funches, V. (2011). The consumer anger phenomena: causes and consequences. Journal of service marketing , 25 (6), 420-428.
Gruber, T. (2011). I want to believe they really care How complaining customers want to be treated by frontline employees. Journal of Service Management , 22 (1), 85 -110.
Heap Yih Chong, Balakrishnan Balamuralithara, Siong Choy Chong. (2011). Construction contract administration in Malaysia using DFD: a conceptual model. Industrial Management & Data Systems, 111 (9), 1449 - 1464
Huang, W.-H., & Lin, T.-D. (2011). Developing effective service compensation strategies Is a price reduction more effective than a free gift? Journal of Service Management , 22 (2), 202-216.
Jones, H., & Dawes, J. (2007). Putting it right: service failure and customer loyalty in UK banks International. Journal of Bank Marketing , 25 (3), 161-172.
Lee, E. J., & Park, J. K. (2010). Service failures in online double deviation scenarios justice theory approach. Managing service quality , 20 (1), 46-69.
Mattila, A. S. (2001). The effectiveness of service recovery in multi-idustry setting. Journal of service marketing , 15 (7), 583-596.
Park, O.-J., Lehto, X., & Park, J.-K. (2008). Service failures and complaints in the family travel market: a justic e dimensi on approach. Journal of Services Marketing , 22 (7), 520-532.
Sabharwal, N., Soch, H., & Kaur, H. (2010). Are we satisfied with incompetent services? A scale development approach for service recovery. Journal of Services Research , 10 (1), 125-142.
Amir Ishaque et al.

283C 2016 CURJ, CUSIT
Sangeetha Jaya, Mahalingam S., (2011). Service quality models in banking: a review. International Journal of Islamic and Middle Eastern Finance and Management, 4(1), 83 - 103
Shapiro, T., & Nieman-Gonder, J. (2006). Effect of communication mode in justice- based service recovery. Managing Service Quality , 16 (2), 124-144.
Varela-Neira, C., Va´zquez-Casielles, R., & Iglesias, V. (2010). Lack of preferential treatment effects on dissatisfaction after a service failure. Journal of Service Management , 21 (1), 45-68.
Causes of Service Failure...
284
MODELLING PRIVATE CONSUMPTION IN CHINA FROM 1987 TO 2012
Manzoor Ahmed*, Khalid Khan** and Abdul Salam Lodhi***
ABSTRACT
This study estimates the consumption function of China by applying the Absolute Income Hypothesis and the Permanent income Hypothesis. The study applies Autoregressive Distributed Lag model and co-integration analysis to estimate the consumption function in China, in utilizing a time series dataset from 1987 to 2012. The results of this study reveal that in the long run current income and wealth are statistically significant, whereas variables such as unemployment and interest rates are not significant vis-à-vis private consumption. However, in the short run all of the regressors are statistically significant and hence have an impact on real private consumption. The [-0.095] value of Error Correction Mechanism (-1) that maintains a negative sign and significant with certain level of significance, shows the speed of adjustment of private consumption that turns into a state of equilibrium in next period from disequilibria.
Keywords: Absolute Income Hypothesis, Permanent Income Hypothesis, Private Consumption, China
INTRODUCTION
The relationship between disposable income and consumption is a key component of Macroeconomics literature. For the first time Jon Maynard Keynes who is the founder of Keynesian economics, introduced the systematic relationship between consumption and disposable income that subsequently provides a very strong based for other theoretical and empirical studies carried out on consumption function. Keynes treated the relationship between consumption and disposable income in an ordinary sense and assigned a specific name, Psychological Law of Consumption, to this relationship. However, once Kuznets (1940) underlines certain empirical limitations in Keynes's Psychological Law of Consumption, it opened a window of opportunity for other key economists to introduce their own respective Consumption theories to deal with the Kuznets's empirical puzzle. For example, Duesenberry (1948) comes with his theory of Relative Income Hypothesis (RIH) that argues that income is the function of relative income. Similarly, Modigliani and Brumbergh (1954) introduce the famous Cycle Income Hypothesis theory of consumption. According to Cycle Income Hypothesis (CIH) the household's consumption is the function of lifetime expected income.
Among these consumption hypotheses the most prominent theory is the Permanent Income Hypothesis (PIH) that was proposed by Friedman (1957). The Permanent Income Hypothesis affirms affirms that the household response to the consumption
City University Research JournalVolume 06 Number 02 July 2016 PP 284-294
*Associate Professor, Faculty of Social Sciences, Management and IT, Lasbela University,Balochistan, Pakistan. E-mail: [email protected]**Assistant Professor, Faculty of Social Sciences, Management and IT, Lasbela University,Balochistan, Pakistan. E-mail: [email protected]***Associate Professor, Balochistan University of IT, Engineering and Mgt. Sciences, Pakistan.Email: [email protected]
C 2016 CURJ, CUSIT
285
on permanent income instead of relative or current income. However, the Permanent Income Hypothesis and Cycle Income Hypothesis have much resemblance to each other, as they reach to the same conclusion and are also derived from the same mathematical model. Hence, the majority of economists treat both the hypotheses with similar theoretical preposition. Therefore, to the economics literature the theory is understood as the Life Cycle Permanent Income Hypothesis (LCPIH).
Looking into the composition of Chinese Gross Domestic Product (GDP), one would realize that Aggregate consumption is one of the major parts of China's GDP. Thereby a curiosity always exists among the researchers and policy makers to understand and analysis the dynamics, pattern and nature of private consumption in China. Aggregate demand is a major component of economy that not only maintains the economic growth but equally it is an important source of generating more employment. As it is commonly known, the private consumption plays a key role in boosting up the aggregate demand along with the aggregate saving, which is the counterpart of aggregate consumption. Therefore, while understanding the aggregate consumption will also help in understanding the saving. Aggregate savings go to investment that help in capital accumulation and accelerate economic growth in the country.
RIH presented by Duesenberry (1948) postulates that households respond only to the relative income. Modigliani and Brumbergh (1954) introduce a new theory of consumption i.e. LCH stating that the income of a household is distributed among different phases of household life i.e. childhood, teenage, working age and life after retirement. Only in the working age phase household maintains a positive saving. Thus through saving the household tries to smooth is consumption. According to Friedman (1957) household's consumption is the function of permanent income where Permanent Income is the worth of allowance of household lifelong income and possessions. Hall (1978) applies rational expectation to the Permanent Income Hypothesis and draws a conclusion that consumption follows a Random Walk. Davidson et al. (1978) estimates the aggregate consumption function for the UK by using the error correction model. This study sat the trend for other researchers to investigate the consumption function with non-stationary time series data. Fakhraii and Mansuori (2008), with the help of the Autoregressive Distributed Lag (ARDL) approach, estimate the long run as well as short run consumption function for Iran. They conclude that there is significant link between variables that are including in the model and consumption theory. Khan et al. (2014) use annual data from 1971 to 2013 to estimate the real private consumption model for Pakistan in applying the Autoregressive Distributed Lag (ARDL) model. They show that only in the long run labor income and wealth have significant effect on real private consumption while in the short run current income; wealth unemployment and real interest rate have a strong and positive impact on the private consumption.
Caglayan (2012) studies house hold consumption expenditure in which he uses disposable income, education age, wealth and money supply as independent variables. He finds that national disposable is positively significant with household consumption expenditure.
Kazmi (2015) shows the relationship between consumption, wealth income, rate of interest and unemployment rate, using an ARDL model. The paper illustrates that both the wealth variable and unemployment are significant in determining long run
C 2016 CURJ, CUSIT
Modelling Private Consumption in China...

286
consumption growth. Furthermore, the paper presents that the parsimonious short run model has the potential to provide reliable consumption forecasts in the medium term.
Zafar and Islam's (2015) provides a time series analysis of aggregate consumption function for Pakistan by using a quarterly data from year 1973(1)-2010(4). The results of their study show that in Pakistan current consumption is a good predictor of future consumption, where 86% of the income has been consumed in the long run while rest is the saving. Their work further demonstrates that Inflation is unanticipated but not accelerating.
Lawson (2013) examines the use of what are known as random assignment schemes as a way to model household expenditure. This approach is based on the idea of predicting the behavioural response of a microsimulation unit by finding a donor, which is in some sense similar to the receiving unit.
A careful search of relevant literature reveals that a sizable research has carried out on consumption modeling using many countries and societies as case studies particularly the developed countries. However, the review of the existing literature shows that no any systematic research is conducted on private consumption behaviour in China.
The remainder of the paper is presented as follows. Second section presents and describes methodology, while third section discusses the results and discussions. Fourth section presents the conclusion.
METHODOLOGY
According to AIH PIH and LCH consumption is the function of households' income and wealth. Given these consumption hypotheses, model may be specified represent the consumption function of China.
(1)
Where, (C) is private consumption, (Y) is GDP and (W) stands for wealth in a given period while (X) is the vector of all short run determinists.
In order to estimate the Chinese consumption function we applied the Autoregressive Distributed Lag model of co-integration and estimate the short as well the long run consumption function. We apply Autoregressive Distributed Lag approach instead of other co-integration approaches that include Engle-Granger (1987), Johansen (1988) and Johansen-Juselius (1990), simply because the Autoregressive Distributed Lag co-integration analysis has some advantages over other co-integration methods of being more robust and consistent.
Moreover, the Autoregressive Distributed Lag approach derives both the long as well as the short run coefficients of this model at once. Compare to other co-integration models the Autoregressive Distributed Lag incorporates more variables into the final specification. Pattichis (1999) and Mah (2000) postulate that in a case of small samples, when the sample size is between 30 to 80 observations, the Autoregressive Distributed Lag approach is more robust than any other co-integration technique. In addition to this the Autoregressive Distributed Lag technique is applicable on data in spite of the order of integration. It shows if the the variables are integrated of order one or zero, or the variables are integrated with order – zero and one. In data generating process the
C 2016 CURJ, CUSIT
),,( XWYfC ttt
Manzoor Ahmed et al.

287
Autoregressive Distributed Lag approach takes adequate numbers of lags and considers general to specific modeling framework to obtain the optimal lag length. For this
purpose the Autoregressive Distributed Lag model estimates regressions. P is kp)1(the number of maximum lags. Likewise, K is the numbers of variables in the model.
For the model selection we used SBC, RBC, AIC and HQC criteria. Thus, keeping in view all of the advantages, as pointed out above, of ARDL model over other co-integration methods, it is plausible to chose the ARDL in order to empirically test the long and the short run consumption function in China. The ARDL model for equation (1) is specified as under:
(2)
The coefficients of short run, which contain the short run information are:
iiii4321,,, i5and while the coefficients of long run, which contain the long run information are:
The null and alternative hypotheses for co-integration are as under:
To test these hypotheses of co-integration we applied bounds test of Pesaran et al. (2001). The critical statistical values recommended by Pesaran et al. (2001) are based upon two sets, one assume that all of variables are integrated of order zero (I (0)) while the second test assumes that the included variables are Integrated with the order of one (I(1)). Considering these parameters we make decision about co-integration on the basis of following guide lines:
When the Calculated ( ) F-statistics is greater, when comparing it with the upper CFcritical statistical values, we tend to reject the null hypothesis. However, when the is less than the lower critical statistical value, we cannot reject the null hypothesis against the alternative hypothesis of the co-integration. However, when falls between upper and lower critical values we end up with the inconclusive results. Once the co-integration appears among variables in the model, then obviously we can estimate the long run relationship of the variables. For the purpose we use the following model:
(3)
To estimate the Error Correction Mechanism (ECM) factor we estimate the following equation:
(4)
C 2016 CURJ, CUSIT
Modelling Private Consumption in China...
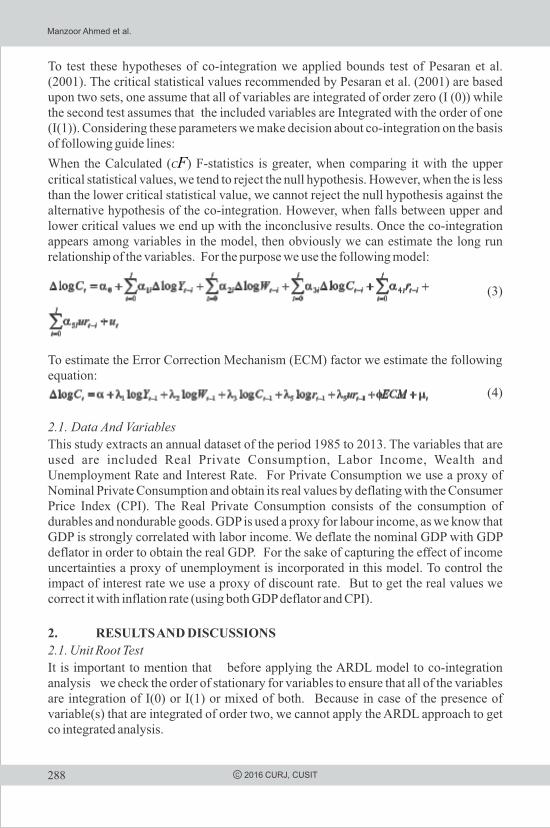
288 C 2016 CURJ, CUSIT
To test these hypotheses of co-integration we applied bounds test of Pesaran et al. (2001). The critical statistical values recommended by Pesaran et al. (2001) are based upon two sets, one assume that all of variables are integrated of order zero (I (0)) while the second test assumes that the included variables are Integrated with the order of one (I(1)). Considering these parameters we make decision about co-integration on the basis of following guide lines:
When the Calculated ( ) F-statistics is greater, when comparing it with the upper CFcritical statistical values, we tend to reject the null hypothesis. However, when the is less than the lower critical statistical value, we cannot reject the null hypothesis against the alternative hypothesis of the co-integration. However, when falls between upper and lower critical values we end up with the inconclusive results. Once the co-integration appears among variables in the model, then obviously we can estimate the long run relationship of the variables. For the purpose we use the following model:
(3)
To estimate the Error Correction Mechanism (ECM) factor we estimate the following equation:
(4)
2.1. Data And Variables
This study extracts an annual dataset of the period 1985 to 2013. The variables that are used are included Real Private Consumption, Labor Income, Wealth and Unemployment Rate and Interest Rate. For Private Consumption we use a proxy of Nominal Private Consumption and obtain its real values by deflating with the Consumer Price Index (CPI). The Real Private Consumption consists of the consumption of durables and nondurable goods. GDP is used a proxy for labour income, as we know that GDP is strongly correlated with labor income. We deflate the nominal GDP with GDP deflator in order to obtain the real GDP. For the sake of capturing the effect of income uncertainties a proxy of unemployment is incorporated in this model. To control the impact of interest rate we use a proxy of discount rate. But to get the real values we correct it with inflation rate (using both GDP deflator and CPI).
2. RESULTS AND DISCUSSIONS
2.1. Unit Root Test
It is important to mention that before applying the ARDL model to co-integration analysis we check the order of stationary for variables to ensure that all of the variables are integration of I(0) or I(1) or mixed of both. Because in case of the presence of variable(s) that are integrated of order two, we cannot apply the ARDL approach to get co integrated analysis.
Manzoor Ahmed et al.
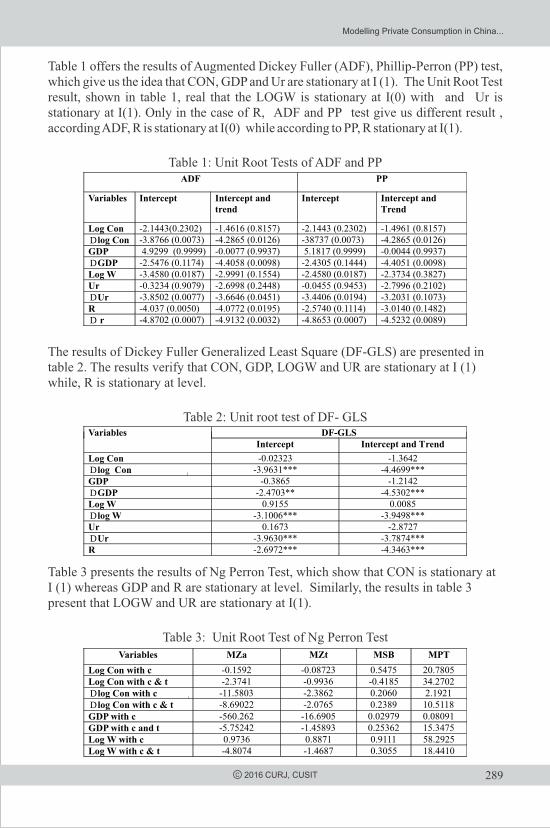
289C 2016 CURJ, CUSIT
Table 1 offers the results of Augmented Dickey Fuller (ADF), Phillip-Perron (PP) test, which give us the idea that CON, GDP and Ur are stationary at I (1). The Unit Root Test result, shown in table 1, real that the LOGW is stationary at I(0) with and Ur is stationary at I(1). Only in the case of R, ADF and PP test give us different result , according ADF, R is stationary at I(0) while according to PP, R stationary at I(1).
Table 1: Unit Root Tests of ADF and PP
The results of Dickey Fuller Generalized Least Square (DF-GLS) are presented in table 2. The results verify that CON, GDP, LOGW and UR are stationary at I (1) while, R is stationary at level.
Table 2: Unit root test of DF- GLS
Table 3 presents the results of Ng Perron Test, which show that CON is stationary at I (1) whereas GDP and R are stationary at level. Similarly, the results in table 3 present that LOGW and UR are stationary at I(1).
Table 3: Unit Root Test of Ng Perron Test
ADF PP
Variables Intercept Intercept and trend
Intercept Intercept and
Trend
Log Con -2.1443(0.2302)
-1.4616 (0.8157)
-2.1443 (0.2302)
-1.4961 (0.8157)
log Con -3.8766 (0.0073)
-4.2865 (0.0126)
-38737 (0.0073)
-4.2865 (0.0126)GDP 4.9299 (0.9999) -0.0077 (0.9937) 5.1817 (0.9999) -0.0044 (0.9937)GDP -2.5476 (0.1174)
-4.4058
(0.0098)
-2.4305
(0.1444)
-4.4051 (0.0098)Log W -3.4580 (0.0187)
-2.9991 (0.1554)
-2.4580 (0.0187)
-2.3734 (0.3827)
Ur -0.3234 (0.9079)
-2.6998 (0.2448)
-0.0455 (0.9453)
-2.7996 (0.2102)Ur -3.8502 (0.0077) -3.6646 (0.0451) -3.4406 (0.0194) -3.2031 (0.1073)R -4.037 (0.0050) -4.0772 (0.0195) -2.5740 (0.1114) -3.0140 (0.1482) r -4.8702 (0.0007) -4.9132 (0.0032) -4.8653 (0.0007) -4.5232 (0.0089)
Variables DF-GLSIntercept Intercept and Trend
Log Con -0.02323
-1.3642
log Con -3.9631***
-4.4699***
GDP -0.3865
-1.2142GDP -2.4703** -4.5302***Log W 0.9155
0.0085
log W -3.1006***
-3.9498***
Ur 0.1673 -2.8727Ur -3.9630*** -3.7874***R -2.6972*** -4.3463***
Variables MZa MZt MSB MPT
Log Con with c -0.1592 -0.08723 0.5475 20.7805Log Con with c & t -2.3741 -0.9936 -0.4185 34.2702 log Con with c -11.5803 -2.3862 0.2060 2.1921 log Con with c & t
-8.69022
-2.0765
0.2389 10.5118GDP with c -560.262
-16.6905
0.02979 0.08091GDP with c and t -5.75242
-1.45893
0.25362 15.3475Log W with c 0.9736
0.8871
0.9111 58.2925Log W with c & t -4.8074
-1.4687
0.3055 18.4410
Modelling Private Consumption in China...

log W with c -9.8151 -2.2075 0.2248 2.52600 log W with c & t -10.5389
-2.2953
0.2178 8.6474
Ur with c 1.3076 0.7416 0.5672 28.1555Ur with c & t -9.8583
-2.1394
0.2170 9.5788
Ur with c -11.7444
-1.9309
0.1644 3.7778
Ur with c & t -11.9048
-2.0976
0.1762 9.2884R with c -8.9195
-2.1050
0.2360 2.7720 r with c & t -20.0592
-3.1643
0.1577 4.558590 % CL with c & t
-14.2000
-2.62000
0.18500 6.6700095 % CL with c & t -17.3000 -2.91000 0.16800 5.4800099 % CL with c & t -23.8000 -3.42000 0.14300 4.0300090 % CL with c -5.70000 -1.62000 0.27500 4.4500095 % CL with c -8.10000 -1.98000 0.23300 3.1700099 % CL with c 3.8000 -2.58000 0.17400 1.78000
290 C 2016 CURJ, CUSIT
Where: c for constant, c & t for constant and trend and CL is confidence level
Table 4 shows that all variables are cointegrated of either I (1) or 1 (0). Hence, it clearly shows that we can apply the ARDL to co-integration model.
Table 4: Orders of Integration
2.1. Co-integration for ARDL Approach
To test and check the co-integration among the included variables the study applies Bound test of Pesaran and Pesaran (1997), and the results of this test are presented in
table 5. As shown in the table, the calculated value of F-test ( ) is equal to 23.7851 that CFis greater than the value of upper bound at the significance level of 10%, 5 % and 1 %, respectively. This therefore reveals that that there is long run association among the included variables of the model.
Table 5: Bound Critical Values for Co-integration among Variables
Table 6 presents the results that are obtained using the ARDL model of co-integration. The results show that all of the variables that are included in the model appear to be statistically significant except of the lag of the unemployment variable. For the estimation of the model and choosing the lag length of the variables, we use both SBC and AIC criteria a for lag section SBC and AIC respectively. Moreover, the model qualifies all of the standard diagnostic tests except functional form. The results of diagnostic test are presented in table 7.
Variables ADF PP DF-GLS NG - PerronCon I(1)
I(1)
I(1)
I(1)
GDP I(1)
I(1)
I(1)
I(1)Wealth I(0) I(0) I(1) I(1)Ur I(1)
I(1)
I(1)
I(1)
R I(0) I(1) I(0) I(0)
F statistics calculated
The level of Signicance Bound Critical Values
23.7851
I(0)
I(1)
10 % 2.67 3.585%
3.27
4.30
1% 4.61 5.96
Manzoor Ahmed et al.
291C 2016 CURJ, CUSIT
Table -6: ARDL (1, 0, 1, 1, 0)
Table 7: Diagnostic test
Table 8 portrays the coefficients of the model, reported for long run, showing that the coefficients of GDP, wealth are significant in the long run, while the coefficients of unemployment rate and interest rate are insignificant. The coefficients of GDP and wealth report that 1% increase in the GDP follows by an increase of the private consumption by 0.62% on average. Similarly 1 percent increase in wealth leads to add to private consumption by 0.52 percent. Looking at the results in table 8 we observe that the coefficients of Gross Domestic Product and wealth are close to each other in the long run. It therefore reveals that in the long run the households have the ability to predict their future income. In addition to this, it also important to underline that, the liberalization of financial market in China is helped households in transferring their future income to present consumption through the relaxation of the liquidity constraint.
Table 8: Long Run Results of ARDL
The empirically results from Error Correction Mechanism (ECM) using ARDL approach are presented in table 9. The results show that the coefficient of ECM which is considered by adjustment parameter is [-0.0951]. It shows that the speed of variables from the disequilibrium to the equilibrium in next period.
Table 9: Error Correction Mechanism (ecm) Of Ardl Approach
ARDL (1,0,1,1,0): selected based on SBC ARDL (1,0,1,1,1): selected based AICVariables Coefcients P- Values Coefcients P- ValuesLog Con(-1) 0.9049
0.000
0.9191
0.000GDP -.2043
0.381
-0.1907
0.401
Log W 0.8617
0.000
0.8313 0.000
Log W(-1) -0.7525 0.000 -0.7446 0.000
Ur -0.05018
0.109
-0.0797
0.040
Ur (-1)
0.0557
0.178R -0.00888 0.000 -0.0092 0.000R (-1) 0.00568 0.009
Name of Diagnostic test CHSQ P- ValuesResidual Serial Correlation
Test using
Lagrange
Multiplier2.5298 0.112
Ramsey's RESET Test of Functional Form 3.6602 0.056Jarque-Bere , Normality test
0.6119 0.736
Based on the regression of squared residuals on squared tted values
3.1049 0.078
ARDL ( 1,0,1,1,0) : selected based on SBC
ARDL (1,0,1,1,1) : selected based AIC
Variables Coefcients
P-
Values
Coefcients
P- ValuesGDP -0.214 0.245 -0.235 0.225Wealth 1.1484 0.000 1.0717 0.000Ur -0.5277
0.174
-0.0468
0.109
R -0.0336 0.115 -0.2969 0.494
ARDL ( 1,0,1,1,0) : selected based on SBC
ARDL (1,0,1,1,1): selected based AIC
Variables Coefcients P- Values Coefcients P- ValuesGDP -0.204
0.380
-0.197
0.400
Modelling Private Consumption in China...
292 C 2016 CURJ, CUSIT
It is interesting to mention that the model meets the criteria of normal diagnostic tests. For the stability test of the model, Cumulative Sum of Recursive Residuals (CUSUM) and Cumulative Sum of Squares Recursive Residuals (CUSUMSQ) are used. In figures 1 and 2 the graphs of CUSUM and CUSUMSQ respectively are plotted. Both of the graphs lie within the statistically critical bounds of 5%. It confirms the structural stability of the model.
Figure 1: Plot of Cumulative Sum of Recursive Residuals
Figure 2: Plot of Cumulative Sum of Squares of Recursive Residuals
CONCLUSION
This study is designed to estimate the consumption function of Chinese society in light of two key and traditional consumption models, the AIH and the PIH. The used the ARDL model of co-integration to estimate the long run and short run relationship of the variables of real private consumption and income, wealth, unemployment rate and interest rate. It is interesting to note that the empirical results of this paper show positive,
W 0.8617 0.000 0.8313 0.000Ur -0.0501
0.107
-0.0797
0.039
r -0.00888
0.000
-0.00924
0.000Ecm (-1) -0.0951 0.027 -0.8080 0.057
ARDL ( 1,0,1,1,0) selected based on SBC ARDL (1,0,1,1,1) selected based AICR - Squared 0.9168
R
-
Squared
0.9255
SE of regression
0.0395
S.E of regression
0.0385DW 2.2902
DW
2.229AIC 42.36 AIC 42.730SBC 38.09 SBC 37.863
F- Sata. 49.63 (0.000) F- Sata. 52.82 (0.000)
Manzoor Ahmed et al.
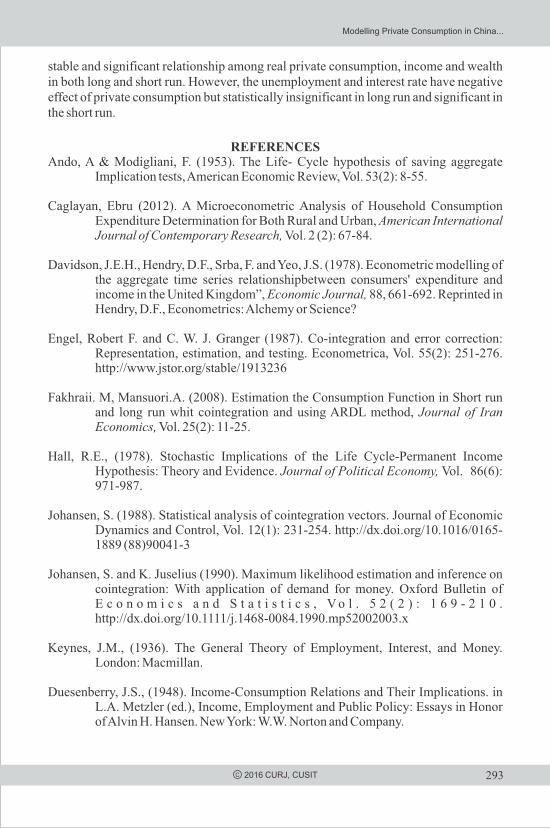
293 C 2016 CURJ, CUSIT
stable and significant relationship among real private consumption, income and wealth in both long and short run. However, the unemployment and interest rate have negative effect of private consumption but statistically insignificant in long run and significant in the short run.
REFERENCESAndo, A & Modigliani, F. (1953). The Life- Cycle hypothesis of saving aggregate
Implication tests, American Economic Review, Vol. 53(2): 8-55.
Caglayan, Ebru (2012). A Microeconometric Analysis of Household Consumption Expenditure Determination for Both Rural and Urban, American International Journal of Contemporary Research, Vol. 2 (2): 67-84.
Davidson, J.E.H., Hendry, D.F., Srba, F. and Yeo, J.S. (1978). Econometric modelling of the aggregate time series relationshipbetween consumers' expenditure and income in the United Kingdom”, Economic Journal, 88, 661-692. Reprinted in Hendry, D.F., Econometrics: Alchemy or Science?
Engel, Robert F. and C. W. J. Granger (1987). Co-integration and error correction: Representation, estimation, and testing. Econometrica, Vol. 55(2): 251-276. http://www.jstor.org/stable/1913236
Fakhraii. M, Mansuori.A. (2008). Estimation the Consumption Function in Short run and long run whit cointegration and using ARDL method, Journal of Iran Economics, Vol. 25(2): 11-25.
Hall, R.E., (1978). Stochastic Implications of the Life Cycle-Permanent Income Hypothesis: Theory and Evidence. Journal of Political Economy, Vol. 86(6): 971-987.
Johansen, S. (1988). Statistical analysis of cointegration vectors. Journal of Economic Dynamics and Control, Vol. 12(1): 231-254. http://dx.doi.org/10.1016/0165-1889 (88)90041-3
Johansen, S. and K. Juselius (1990). Maximum likelihood estimation and inference on cointegration: With application of demand for money. Oxford Bulletin of E c o n o m i c s a n d S t a t i s t i c s , V o l . 5 2 ( 2 ) : 1 6 9 - 2 1 0 . http://dx.doi.org/10.1111/j.1468-0084.1990.mp52002003.x
Keynes, J.M., (1936). The General Theory of Employment, Interest, and Money. London: Macmillan.
Duesenberry, J.S., (1948). Income-Consumption Relations and Their Implications. in L.A. Metzler (ed.), Income, Employment and Public Policy: Essays in Honor of Alvin H. Hansen. New York: W.W. Norton and Company.
Modelling Private Consumption in China...
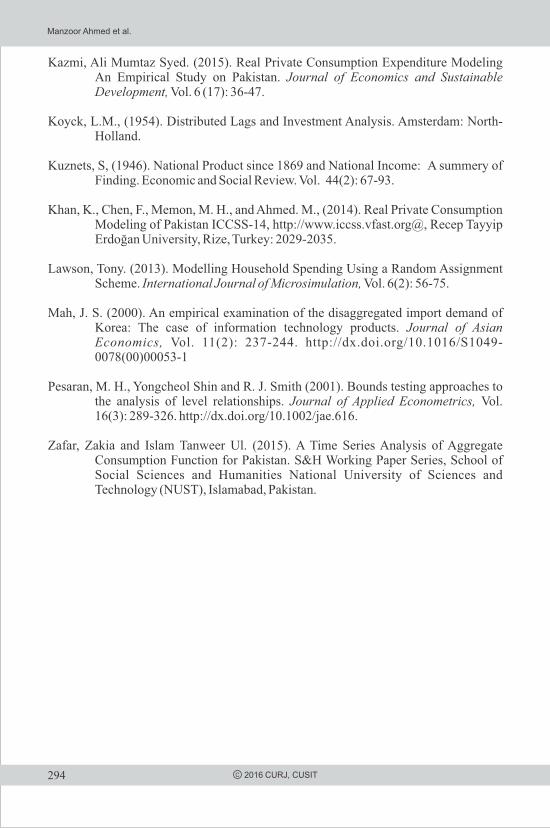
294 C 2016 CURJ, CUSIT
Kazmi, Ali Mumtaz Syed. (2015). Real Private Consumption Expenditure Modeling An Empirical Study on Pakistan. Journal of Economics and Sustainable Development, Vol. 6 (17): 36-47.
Koyck, L.M., (1954). Distributed Lags and Investment Analysis. Amsterdam: North-Holland.
Kuznets, S, (1946). National Product since 1869 and National Income: A summery of Finding. Economic and Social Review. Vol. 44(2): 67-93.
Khan, K., Chen, F., Memon, M. H., and Ahmed. M., (2014). Real Private Consumption Modeling of Pakistan ICCSS-14, http://www.iccss.vfast.org@, Recep Tayyip Erdoğan University, Rize, Turkey: 2029-2035.
Lawson, Tony. (2013). Modelling Household Spending Using a Random Assignment Scheme. International Journal of Microsimulation, Vol. 6(2): 56-75.
Mah, J. S. (2000). An empirical examination of the disaggregated import demand of Korea: The case of information technology products. Journal of Asian Economics, Vol. 11(2): 237-244. http://dx.doi.org/10.1016/S1049-0078(00)00053-1
Pesaran, M. H., Yongcheol Shin and R. J. Smith (2001). Bounds testing approaches to the analysis of level relationships. Journal of Applied Econometrics, Vol. 16(3): 289-326. http://dx.doi.org/10.1002/jae.616.
Zafar, Zakia and Islam Tanweer Ul. (2015). A Time Series Analysis of Aggregate Consumption Function for Pakistan. S&H Working Paper Series, School of Social Sciences and Humanities National University of Sciences and Technology (NUST), Islamabad, Pakistan.
Manzoor Ahmed et al.
295
FACTORS DETERMINING PHYSICIANS' LOYALTY TO PHARMACEUTICAL BRANDS IN PESHAWARSharafat Hussain*, Dr. Gohar Saeed** and Altaf Hussain***
ABSTRACT
The present study on Factors Determining Physicians' Loyalty to Pharmaceutical Brands in Peshawar was undertaken with purpose to determine the relationship between physicians' loyalty to pharmaceutical brands in the context of product quality, brand image and regular visits of medical representatives. Product quality, brand image and regular visits of medical representatives were three independent variables and Physicians' Loyalty was the dependent variable of the study. A sample size of 120 out of 550 doctors as respondents were selected through simple random sampling practicing in Peshawar city. Data was collected through a five-point Likert scale questionnaire. There were total 16 questions in the questionnaire and each variable contained 4 questions. The data was analyzed using descriptive statistics, factor analysis, Pearson's correlations and multiple-regression through SPSS. The results of the research revealed that regular visits of medical representatives have the most significant and positive relationship with physicians' loyalty to pharmaceutical brands. Product quality and brand image also showed significant positive relationship with physicians' loyalty to pharmaceutical brands. Organizations can enhance physician's loyalty by focusing product quality, brand image and continuous interactions of medical sales representatives with physicians, which in turn, will be helpful in achieving good market share and increased revenue.
Keywords: Product Quality, Brand Image, Regular Visits of Medical Representatives, Physicians' Loyalty, Pharmaceutical Brands, Brand Loyalty
INTRODUCTION
In view of the fact that the world has turned into a global marketplace, therefore competition among enterprises has turned out to be more exceptional and thus to take hold of challenging place in the marketplace, specialists propose and employ different strategic plans and policies to ensure a firm's achievement for a long-haul and one of the vital strategy is building and sustaining customer's brand loyalty. Loyalty is viewed as an important choice by organizations (Mao, 2010).
From the last few years, pharmaceuticals are on the track to get competitive advantage and good market share by working on strategies to make more and more loyal customers, increasing customer understanding and providing more appealing as well as attractive promotional activities. For pharmaceuticals, captivating physicians' loyalty means achieving huge market share and competitive advantage by health care professionals (doctors) in the tough marketplace. Therefore in order to secure more and
City University Research JournalVolume 06 Number 02 July 2016 PP 295-310
*Sales Executive, ICI Pakistan Limited**Field Research Specialist, Pakistan Academy for Rural Development (PARD), Peshawar***Lecturer/HoD, Department of Economics, Islamia College University, Peshawar
C 2016 CURJ, CUSIT

296
prescriptions, it should be the most important aim to make few physicians who are not loyal to their products and thus do not advise to their patients (Hartley, 2013).
Executive of pharmaceutical companies have started bearing cost of marketing strategies to scrutinize brand loyalty as well as to investigate why customers become disloyal because brand loyalty is thought to be the most forceful and essential channel. They are also on the track to act specifically and take appropriate remedies because they realize that are part of such challenging environment where to stay competitive, they will have to plan which includes products/services and resources to create commitment and customer loyalty. Dealing with doctors' loyalty does not intend to secure short-term success but to create strategies that guide to enduring loyalty (Hartley, 2013).
It is vital to spotlight aspects that persuade customer loyalty in developing countries like Pakistan since fresh contestants are invading aggressively (Hafeez & Hansu, 2010).
Hence, for organizations it is viewed as an essential issue to find out the variables that influence customer loyalty.
Significance of the Study
The study will help to understand the role of product quality, brand image and regular visits of the medical representatives in determining physicians' loyalty to pharmaceutical brands and consequently will lead to development of strategies that would be helpful for the pharmaceutical companies to achieve physician s' loyalty and ultimately to attain competitive advantage in the market.
Objectives of the Study
The objectives of the study:
1) To identify variables that may affect the brand loyalty of physicians.
2) To establish the relationship between physicians' loyalty to pharmaceutical brands.
3) To extend recommendations for strengthening the physicians' loyalty to pharmaceutical brands.
LITERATURE REVIEW
Past work done by researchers provides guideline and forms an understanding into the existing knowledge. An overview of existing literature was done by the researcher with a specific end goal to build up a profound understanding and to assess the practical features emerging beyond researches. An overview of work done by researchers on pharmaceuticals, doctors, role of medical sales representatives and brand loyalty was done. Below segment demonstrates a significant analysis of past work done by the researchers related to the current research study.
Brand Loyalty
Zikmund, McLeod, and Gilbert (2012) defined customer loyalty as the customer commitment or attachment to a product, producer, distributor or other essence focused about positive and constructive behaviors and attitudinal responses, that is, procure a brand repeatedly.
C 2016 CURJ, CUSIT
Sharafat Hussain et al.
297
Ahmed, Ahmad, and Haq (2014) in their research paper stated that now-a-days customers are much educated about the brands and prefer to purchase that brands which they feel that the brands have right qualities to fulfill their needs, attributes and affording cost. In addition they will not tend to buy the same brands from other options available and despite the availability of cheaper products, customers will not disloyal to their brands of choice.
For organizations operating in today's challenging environment, brand loyalty is thought to be of indispensable significance. According to Upamannyu, Gulati, and Mathur (2014), customers are not impressed by tricks and actions of competitors as their brand loyalty boosts. Loyal customers always prepared to pay a higher price. Loyal customers becomes the reference of the brand too because they advise their brands of choice to loved ones whenever they get the opportunity and in this way they show their commitment to the brand or brands.
Product Quality:
Today's customers are significantly more well-read and learned because of the influence of the search engines and thus, they will have a tendency to buy those products which provide them value for money. Also customers will not waste time and have a tendency to know precisely what they need to buy to fulfill their needs and wants (Alex & Thomas, 2015). Jan, Hussain, and Khan (2013) stated that long haul achievement thoroughly relies upon customer loyalty and product quality play vital role in connection with customer loyalty.
Waheed (2011) highlighted that physicians manufacture viewpoint regarding the quality of the drug based on the results they obtain through recommended treatments. If the product is found to be functional then physicians prescribe the recommended product again and again in treating diseases in upcoming patients.
Brand Image:
Customer's brand loyalty and trust considerably exaggerated by image of a brand and therefore, an organization must spotlight its promotional plans to create image of a brand in customers' perception as it is vital in today's world (Alhaddad, 2015).
As suggested by Anwar, Gulzar, Sohail, and Akram (2011), marketers must spotlight brand image to enhance brand loyalty because brand loyalty is significantly influenced by good brand image. They found that brand image has a noteworthy impact on brand loyalty.
A well-established and renowned image of a brand is one of the advantageous resources for any organization because brand image contributes in attaining superior customer loyalty which ultimately results in greater profit and revenue as well as better mutual aid and assistance (Olson, 2009).
Keller (1993) in his research paper suggested that enhancement in brand loyalty, equity, purchase pattern of customer and as a whole performance of a product is the resultant of a positive image. Aaker (1991) in his research paper suggested that it is imperative to value the advancement of image creation and its outcomes such as loyalty and satisfaction because building and sustaining brand image is the key element of an
C 2016 CURJ, CUSIT
Factors Determining Physicians' Loyalty...

298
organization's promotional and product strategy. He further stated that brand image can create difference because image of brand facilitates customers to differentiate the product, gives rationale to buy, crafts productive/positive mind-set and gives a reason for brand extension. It also facilitates customers to collect information about products.
Regular Visits of Medical Representatives
Personal selling is the primary tool pharmaceutical firms depend upon to promote their products because the target customers are special who are not consumers rather simply influencers, the physicians, and medical representatives are considered to be the face of promoting firms that make a difference by interacting physicians. Passing on the information effectively is the core responsibility of medical representatives to healthcare professionals and thus medical representatives are trained and skilled by pharmaceutical firms because they have to interact with the most educated and knowledgeable audience i-e physicians (Inamdar & Kolhatkar, 2012).
According to doctors' opinion, the most imperative source of information in order to decide which company's product to prescribe to patients are medical sales representatives (Alkhateeb et al, 2009).
Day (2000) explained that medical sales representatives are polite and decent persons with excellent product knowledge and communication proficiencies and capable of providing correct and unbiased information about their brands. Today representatives of pharmaceutical companies are given proper trainings to respond queries by doctors about product features and functions. They visit doctors mainly to get more and more prescriptions of their products. No doubt medical sales representatives attain good share of prescriptions by doctors but it is equally an opportunity for the doctor to obtain necessary information about the medicine (product) the doctor prescribes to the patients.
Theoretical Framework of the Study
On the basis of the above analyses of literature review, it was observed that product quality, brand image, and regular visits of medical representatives have been instrumental in developing the brand loyalty of physicians. Based on the analyses, this study had been designed to determine the relationship among these variables. Two types of variables were discussed in the study, i.e. independent and dependent. There were three independent variables namely product quality, brand image, and regular visits of medical representatives and one dependent variable that is physicians' loyalty to pharmaceutical brands, as shown in the figure below:
Figure 1: Theoretical Framework of the Study
C 2016 CURJ, CUSIT
I.V D.V
Physicians’ LoyaltyBrand Image
Regular Visits of Medical
Representa�ves
Product Quality
Sharafat Hussain et al.

299C 2016 CURJ, CUSIT
HYPOTHESES
On the basis of review of theoretical framework, the following hypotheses are described:
H1: Product quality has significant positive effect on physicians' loyalty to pharmaceutical brands.
H2: Brand image has significant positive effect on physicians' loyalty to pharmaceutical brands.
H3: Regular visits of medical representatives have significant positive effect on physicians' loyalty to pharmaceutical brands.
RESEARCH METHODOLOGY
The study was conceived to determine the relationship between physicians' loyalty to pharmaceutical brands. For this purpose, a comprehensive methodology was adopted to collect and analyze the data in order to achieve the results. Therefore, the research methodology for the study is narrated as below:
Universe of the Study:
Total population frame was 550 doctors. List of the doctors belonging to different specialties were collected from the administration of concerned institutions and final list contained 550 specialty doctors thus the population size was 550. Research work was conducted in the region of Peshawar. Doctors of major institutions like Lady Reading Hospital (LRH), Khyber Teaching Hospital (KTH), Hayatabad Medical Complex (HMC), Institute of Kidney Diseases (IKD), Rehman Medical Institute (RMI), North West General Hospital (N.W.G.H), Institute of Radiology and Nuclear Medicine (IRNUM) and few major general practitioners were included in population of this current research study. Reason for including few major general practitioners (GPs) in the current study was that there are some general practitioners in Peshawar who are key opinion leaders (KOLs) and majority of patients prefer to get treatment by them and thus a huge number of patients pool visit them so the researcher felt that taking opinion from those major general practitioners will be highly valuable for the study.
Sampling and Sample Size:
In order to select sample from the population, simple random sampling method was administered to choose the respondents for the sample from the population frame. The respondents were selected through draw out of the list of the doctors. Sample size of 120 doctors was selected out of population frame 550 doctors. Data was collected through a five-point Likert scale questionnaire.
Sources of the Instrument
Below in Table 1, the sources of instruments are given.
Factors Determining Physicians' Loyalty...
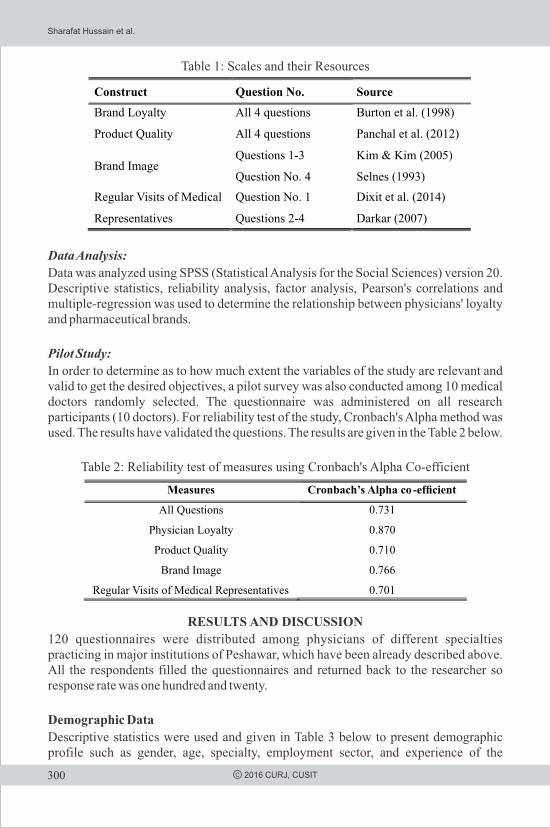
300 C 2016 CURJ, CUSIT
Table 1: Scales and their Resources
Data Analysis:
Data was analyzed using SPSS (Statistical Analysis for the Social Sciences) version 20. Descriptive statistics, reliability analysis, factor analysis, Pearson's correlations and multiple-regression was used to determine the relationship between physicians' loyalty and pharmaceutical brands.
Pilot Study:
In order to determine as to how much extent the variables of the study are relevant and valid to get the desired objectives, a pilot survey was also conducted among 10 medical doctors randomly selected. The questionnaire was administered on all research participants (10 doctors). For reliability test of the study, Cronbach's Alpha method was used. The results have validated the questions. The results are given in the Table 2 below.
Table 2: Reliability test of measures using Cronbach's Alpha Co-efficient
RESULTS AND DISCUSSION
120 questionnaires were distributed among physicians of different specialties practicing in major institutions of Peshawar, which have been already described above. All the respondents filled the questionnaires and returned back to the researcher so response rate was one hundred and twenty.
Demographic Data
Descriptive statistics were used and given in Table 3 below to present demographic profile such as gender, age, specialty, employment sector, and experience of the
Construct
Question No.
Source
Brand Loyalty
All 4 questions
Burton et al. (1998)
Product Quality
All 4 questions
Panchal et al. (2012)
Brand Image Questions 1-3 Kim & Kim (2005)
Question No. 4
Selnes (1993)
Regular Visits of Medical
Representatives
Question No. 1
Questions 2-4
Dixit et al. (2014)
Darkar (2007)
Measures
Cronbach’s Alpha co-efcient
All Questions
0.731
Physician Loyalty 0.870
Product Quality 0.710 Brand Image
0.766
Regular Visits of Medical Representatives 0.701
Sharafat Hussain et al.

Characteristics Frequency %
GenderMale 80 66.7%Female 40 33.3%
120 100%
Age
21-30 42 35%31-40
51
42.5%41-50
21
17.5%51-60
6
5%
120
100%
Specialty
Physician
29
24.2%Surgeon
20
16.7%Paediatrician
13
10.8%Gynaecologist
9
7.5%Oncologist
11
9.2%
Urologist
9
7.5%Cardiologist 5 4.2%Nephrologist 9 7.5%Pulmonologist
11
9.2%
General Practitioner
4
3.3%
120
100%
Employment Sector
Public Institute
90
75%Private Institute
30
25%
120
100%
Practicing Years
1-5
36
30%6-10
46
38.3%11-15
20
16.7%16-20 6 5%21-25 6 5%26-30 3 2.5%31-35 2 1.7%36-40 1 0.8%
120 100%
301C 2016 CURJ, CUSIT
respondents.
Table 3: Demographic Profile of the Respondents
RELIABILITY ANALYSIS
Cronbach's alpha is a well-known approach to measure reliability of the instruments. In the current study, 16 items were used in the measurement of three independent variables and one dependent variable and found that items in the study were more reliable and standard because the value of Cronbach's alpha was well above the standard and acceptable value of 0.70. Values of Cronbach's alpha are given in Table 4 below:
Table 4: Reliability of the Constructs
Variables
Number of Items
Cronbach’s Alpha
Physicians’ Loyalty
4
0.865
Factors Determining Physicians' Loyalty...
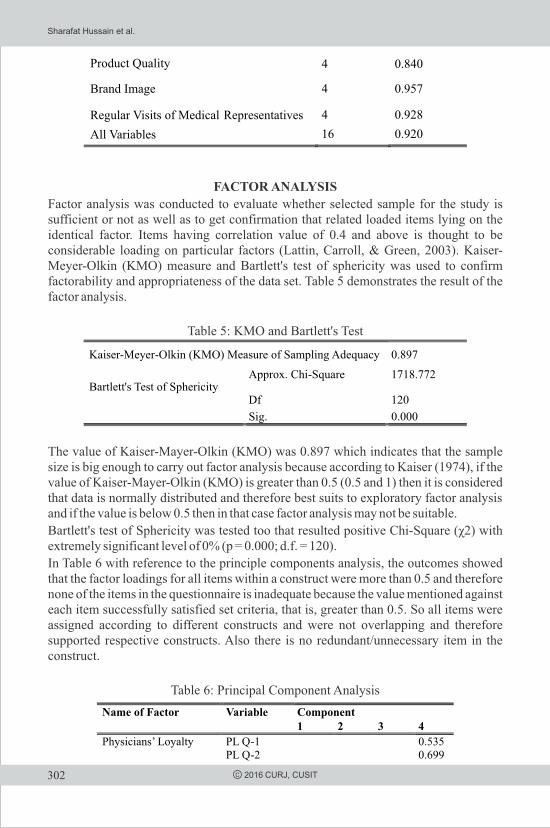
302 C 2016 CURJ, CUSIT
FACTOR ANALYSIS
Factor analysis was conducted to evaluate whether selected sample for the study is sufficient or not as well as to get confirmation that related loaded items lying on the identical factor. Items having correlation value of 0.4 and above is thought to be considerable loading on particular factors (Lattin, Carroll, & Green, 2003). Kaiser-Meyer-Olkin (KMO) measure and Bartlett's test of sphericity was used to confirm factorability and appropriateness of the data set. Table 5 demonstrates the result of the factor analysis.
Table 5: KMO and Bartlett's Test
The value of Kaiser-Mayer-Olkin (KMO) was 0.897 which indicates that the sample size is big enough to carry out factor analysis because according to Kaiser (1974), if the value of Kaiser-Mayer-Olkin (KMO) is greater than 0.5 (0.5 and 1) then it is considered that data is normally distributed and therefore best suits to exploratory factor analysis and if the value is below 0.5 then in that case factor analysis may not be suitable.
Bartlett's test of Sphericity was tested too that resulted positive Chi-Square (χ2) with extremely significant level of 0% (p = 0.000; d.f. = 120).
In Table 6 with reference to the principle components analysis, the outcomes showed that the factor loadings for all items within a construct were more than 0.5 and therefore none of the items in the questionnaire is inadequate because the value mentioned against each item successfully satisfied set criteria, that is, greater than 0.5. So all items were assigned according to different constructs and were not overlapping and therefore supported respective constructs. Also there is no redundant/unnecessary item in the construct.
Table 6: Principal Component Analysis
Product Quality 4 0.840
Brand Image
4
0.957
Regular Visits of Medical Representatives 4
0.928
All Variables 16 0.920
Kaiser-Meyer-Olkin (KMO) Measure of Sampling Adequacy
0.897
Bartlett's Test of Sphericity Approx. Chi-Square 1718.772
Df
120
Sig. 0.000
Name of Factor Variable Component1 2 3 4
Physicians’ Loyalty PL Q-1 0.535PL Q-2
0.699
Sharafat Hussain et al.
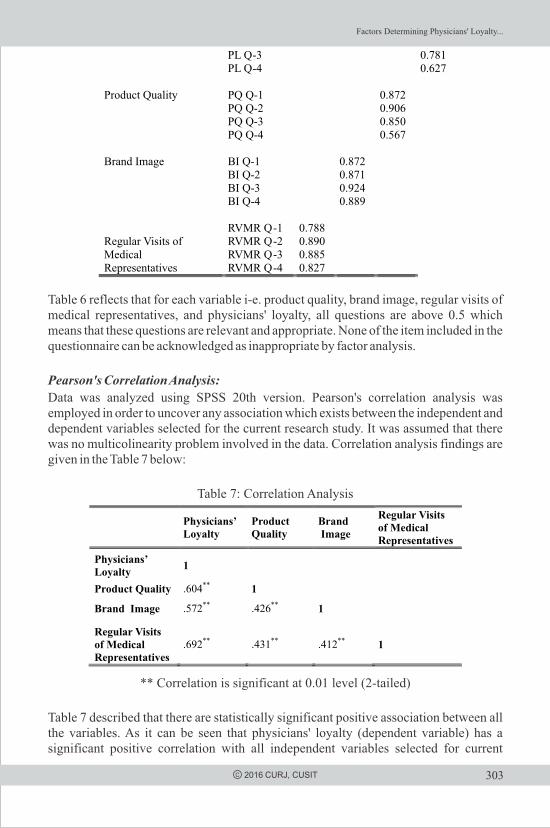
303C 2016 CURJ, CUSIT
Table 6 reflects that for each variable i-e. product quality, brand image, regular visits of medical representatives, and physicians' loyalty, all questions are above 0.5 which means that these questions are relevant and appropriate. None of the item included in the questionnaire can be acknowledged as inappropriate by factor analysis.
Pearson's Correlation Analysis:
Data was analyzed using SPSS 20th version. Pearson's correlation analysis was employed in order to uncover any association which exists between the independent and dependent variables selected for the current research study. It was assumed that there was no multicolinearity problem involved in the data. Correlation analysis findings are given in the Table 7 below:
Table 7: Correlation Analysis
** Correlation is significant at 0.01 level (2-tailed)
Table 7 described that there are statistically significant positive association between all the variables. As it can be seen that physicians' loyalty (dependent variable) has a significant positive correlation with all independent variables selected for current
Physicians’ Loyalty
Product Quality
Brand
Image
Regular Visits of Medical Representatives
Physicians’ Loyalty
1
Product Quality .604** 1 Brand Image
.572**
.426**
1
Regular Visits of Medical Representatives
.692** .431** .412** 1
PL Q-3 0.781PL Q-4 0.627
Product Quality
PQ Q-1
0.872
PQ Q-2
0.906PQ Q-3
0.850
PQ Q-4 0.567
Brand Image
BI Q-1
0.872
BI Q-2
0.871
BI Q-3
0.924
BI Q-4
0.889
Regular Visits of Medical Representatives
RVMR Q-1 0.788RVMR Q-2 0.890RVMR Q-3 0.885RVMR Q-4 0.827
Factors Determining Physicians' Loyalty...
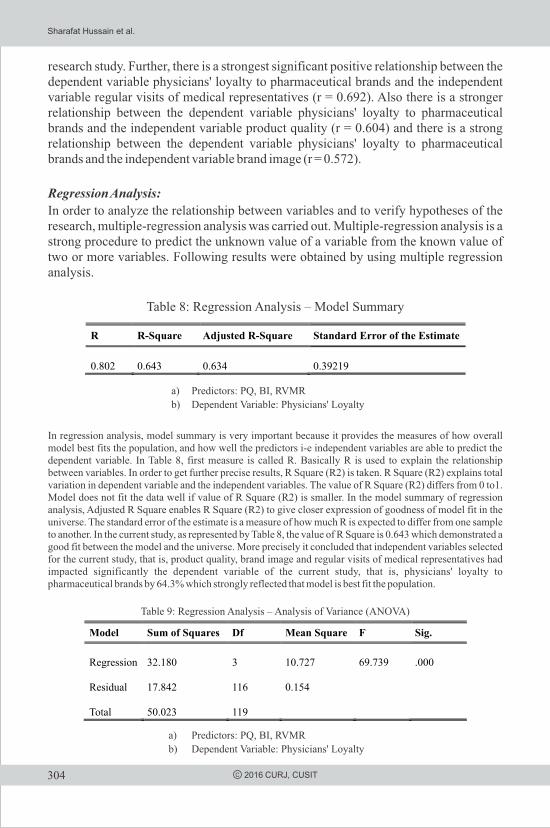
304 C 2016 CURJ, CUSIT
research study. Further, there is a strongest significant positive relationship between the dependent variable physicians' loyalty to pharmaceutical brands and the independent variable regular visits of medical representatives (r = 0.692). Also there is a stronger relationship between the dependent variable physicians' loyalty to pharmaceutical brands and the independent variable product quality (r = 0.604) and there is a strong relationship between the dependent variable physicians' loyalty to pharmaceutical brands and the independent variable brand image (r = 0.572).
Regression Analysis:
In order to analyze the relationship between variables and to verify hypotheses of the research, multiple-regression analysis was carried out. Multiple-regression analysis is a strong procedure to predict the unknown value of a variable from the known value of two or more variables. Following results were obtained by using multiple regression analysis.
Table 8: Regression Analysis – Model Summary
a) Predictors: PQ, BI, RVMR
b) Dependent Variable: Physicians' Loyalty
In regression analysis, model summary is very important because it provides the measures of how overall model best fits the population, and how well the predictors i-e independent variables are able to predict the dependent variable. In Table 8, first measure is called R. Basically R is used to explain the relationship between variables. In order to get further precise results, R Square (R2) is taken. R Square (R2) explains total variation in dependent variable and the independent variables. The value of R Square (R2) differs from 0 to1. Model does not fit the data well if value of R Square (R2) is smaller. In the model summary of regression analysis, Adjusted R Square enables R Square (R2) to give closer expression of goodness of model fit in the universe. The standard error of the estimate is a measure of how much R is expected to differ from one sample to another. In the current study, as represented by Table 8, the value of R Square is 0.643 which demonstrated a good fit between the model and the universe. More precisely it concluded that independent variables selected for the current study, that is, product quality, brand image and regular visits of medical representatives had impacted significantly the dependent variable of the current study, that is, physicians' loyalty to pharmaceutical brands by 64.3% which strongly reflected that model is best fit the population.
Table 9: Regression Analysis – Analysis of Variance (ANOVA)
a) Predictors: PQ, BI, RVMR
b) Dependent Variable: Physicians' Loyalty
R R-Square
Adjusted R-Square
Standard Error of the Estimate
0.802 0.643
0.634
0.39219
Model Sum of Squares
Df
Mean Square
F
Sig.
Regression 32.180
3
10.727
69.739 .000
Residual 17.842
116
0.154
Total 50.023 119
Sharafat Hussain et al.
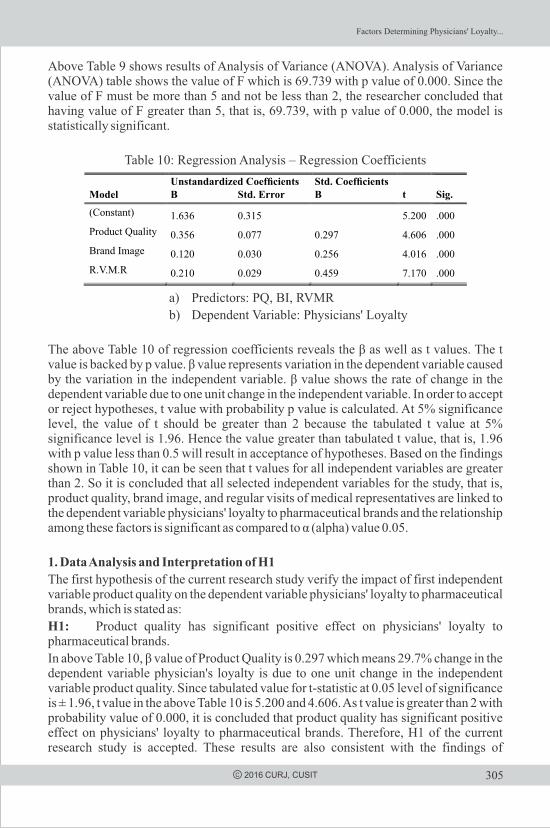
305
Above Table 9 shows results of Analysis of Variance (ANOVA). Analysis of Variance (ANOVA) table shows the value of F which is 69.739 with p value of 0.000. Since the value of F must be more than 5 and not be less than 2, the researcher concluded that having value of F greater than 5, that is, 69.739, with p value of 0.000, the model is statistically significant.
Table 10: Regression Analysis – Regression Coefficients
a) Predictors: PQ, BI, RVMR
b) Dependent Variable: Physicians' Loyalty
The above Table 10 of regression coefficients reveals the β as well as t values. The t value is backed by p value. β value represents variation in the dependent variable caused by the variation in the independent variable. β value shows the rate of change in the dependent variable due to one unit change in the independent variable. In order to accept or reject hypotheses, t value with probability p value is calculated. At 5% significance level, the value of t should be greater than 2 because the tabulated t value at 5% significance level is 1.96. Hence the value greater than tabulated t value, that is, 1.96 with p value less than 0.5 will result in acceptance of hypotheses. Based on the findings shown in Table 10, it can be seen that t values for all independent variables are greater than 2. So it is concluded that all selected independent variables for the study, that is, product quality, brand image, and regular visits of medical representatives are linked to the dependent variable physicians' loyalty to pharmaceutical brands and the relationship among these factors is significant as compared to α (alpha) value 0.05.
1. Data Analysis and Interpretation of H1
The first hypothesis of the current research study verify the impact of first independent variable product quality on the dependent variable physicians' loyalty to pharmaceutical brands, which is stated as:
H1: Product quality has significant positive effect on physicians' loyalty to pharmaceutical brands.
In above Table 10, β value of Product Quality is 0.297 which means 29.7% change in the dependent variable physician's loyalty is due to one unit change in the independent variable product quality. Since tabulated value for t-statistic at 0.05 level of significance is ± 1.96, t value in the above Table 10 is 5.200 and 4.606. As t value is greater than 2 with probability value of 0.000, it is concluded that product quality has significant positive effect on physicians' loyalty to pharmaceutical brands. Therefore, H1 of the current research study is accepted. These results are also consistent with the findings of
C 2016 CURJ, CUSIT
ModelUnstandardized Coefcients Std. Coefcients
t Sig.Β
Std. Error
Β
(Constant) 1.636
0.315
5.200 .000
Product Quality 0.356 0.077 0.297 4.606 .000
Brand Image 0.120
0.030
0.256
4.016 .000
R.V.M.R 0.210 0.029 0.459 7.170 .000
Factors Determining Physicians' Loyalty...
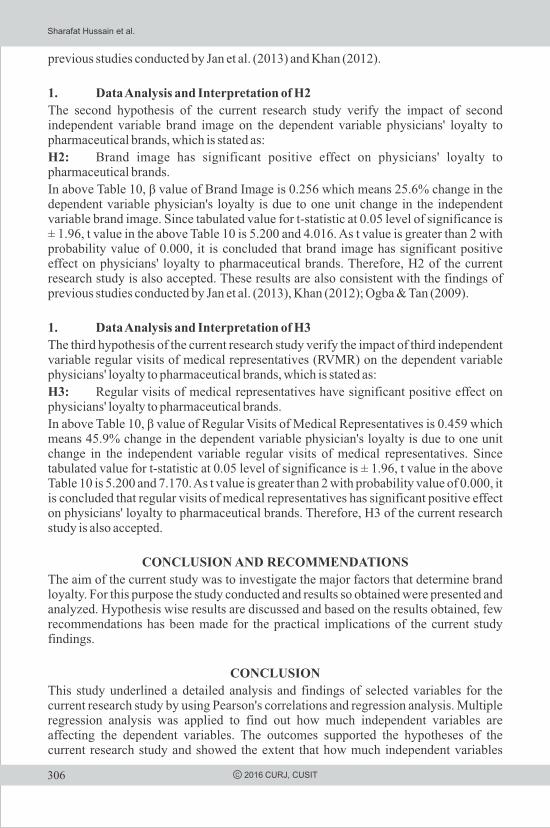
306 C 2016 CURJ, CUSIT
previous studies conducted by Jan et al. (2013) and Khan (2012).
1. Data Analysis and Interpretation of H2
The second hypothesis of the current research study verify the impact of second independent variable brand image on the dependent variable physicians' loyalty to pharmaceutical brands, which is stated as:
H2: Brand image has significant positive effect on physicians' loyalty to pharmaceutical brands.
In above Table 10, β value of Brand Image is 0.256 which means 25.6% change in the dependent variable physician's loyalty is due to one unit change in the independent variable brand image. Since tabulated value for t-statistic at 0.05 level of significance is ± 1.96, t value in the above Table 10 is 5.200 and 4.016. As t value is greater than 2 with probability value of 0.000, it is concluded that brand image has significant positive effect on physicians' loyalty to pharmaceutical brands. Therefore, H2 of the current research study is also accepted. These results are also consistent with the findings of previous studies conducted by Jan et al. (2013), Khan (2012); Ogba & Tan (2009).
1. Data Analysis and Interpretation of H3
The third hypothesis of the current research study verify the impact of third independent variable regular visits of medical representatives (RVMR) on the dependent variable physicians' loyalty to pharmaceutical brands, which is stated as:
H3: Regular visits of medical representatives have significant positive effect on physicians' loyalty to pharmaceutical brands.
In above Table 10, β value of Regular Visits of Medical Representatives is 0.459 which means 45.9% change in the dependent variable physician's loyalty is due to one unit change in the independent variable regular visits of medical representatives. Since tabulated value for t-statistic at 0.05 level of significance is ± 1.96, t value in the above Table 10 is 5.200 and 7.170. As t value is greater than 2 with probability value of 0.000, it is concluded that regular visits of medical representatives has significant positive effect on physicians' loyalty to pharmaceutical brands. Therefore, H3 of the current research study is also accepted.
CONCLUSION AND RECOMMENDATIONS
The aim of the current study was to investigate the major factors that determine brand loyalty. For this purpose the study conducted and results so obtained were presented and analyzed. Hypothesis wise results are discussed and based on the results obtained, few recommendations has been made for the practical implications of the current study findings.
CONCLUSION
This study underlined a detailed analysis and findings of selected variables for the current research study by using Pearson's correlations and regression analysis. Multiple regression analysis was applied to find out how much independent variables are affecting the dependent variables. The outcomes supported the hypotheses of the current research study and showed the extent that how much independent variables
Sharafat Hussain et al.
307C 2016 CURJ, CUSIT
influencing the dependent variable. The outcomes of all hypotheses were accepted by applying statistical tests. No doubt the importance of quality of product can never be compromised nor neglected, but from the findings of the current study it was found that regular visits of medical representatives has positive and most significant impact on physicians' loyalty to pharmaceutical brands. Medical representatives are backbone of pharmaceutical industry. Medical sales representatives are the most effective and efficient means to convince physicians to prescribe medicines. It can also be concluded from the current study that regular visits by representatives helps in building relationship with key opinion leaders (doctors) which ultimately results in increased prescription to the patients by doctors. Increased prescription means increased profit and hence increased market share. Consistent interactions with key opinion leaders (doctors) by sales representatives are of pivotal importance as these interactions help doctors remember medicine names and by doing so they get more and more prescriptions of their medicines.
Product quality also plays a pivotal role in making customer loyal. It can also be concluded from the current study that there is an important link between physicians' loyalty to pharmaceutical brands with good product quality. Jan et al. (2013) stated that long term achievement thoroughly relies upon customer loyalty and product quality play vital role in connection with customer loyalty. Waheed (2011) stated that specialists develop knowledge about the nature of the drug on the premise of the result they get by their endorsed medicines and if the drug is found to be effective and valuable, the specialist prescribe the same brand to the patients for the comparable sort of disease or infection. Hence the researcher, in view of results from present study, concluded that product quality also has a positive and significant impact on physicians' loyalty to pharmaceutical brands.
Brand image also has a positive and significant impact on physicians' loyalty to pharmaceutical brands as the researcher found that respondents do value good image of a brand in recalling brand name and helping in patronizing it to patients. According to the Data (2003), when the brand/product makes a powerful place in the psyche of the customers, and enhances their confidence, they start emotion with the brand and would not prefer to replace it.
Limitations of the Study/Recommendations for the Future Research
Despite the fact that this study took a positive methodology in looking into past work done by researchers as well as utilizing latest statistical tools, there are few constraints which are important to be given consideration:
1) First of all the sample size of the current study as compared to all practicing doctors of Peshawar may impact on possible generalization of the research findings and thus call for further research using a larger sample size.
2) Second, due to less resources (time, money) this study was only limited to few major institutes of Peshawar region. So by considering the resources, one can extend his/her research to two or more cities of Pakistan.
3) Third, this study included only three independent variables i-e product quality, brand image and regular visits of medical representatives. One can include few more variables to read the impact of those variables on customer loyalty.
Factors Determining Physicians' Loyalty...
308 C 2016 CURJ, CUSIT
RECOMMENDATIONS FOR MANAGERS
1) Persistent interactions of med reps with doctors is one of the major factors that influence physicians' brand loyalty and helps companies to gain huge revenue and good reputation. Basically physicians are customers for pharmaceuticals and are very much knowledgeable individuals and in order to convince them on the products, more knowledgeable, skillful and dedicated individuals (medical representatives) are required. Medical representatives should follow their monthly/weekly/daily working plans to ensure consistent interactions with their respected doctors so that there should be a good liaison with them in order to get good prescriptions as the H3 of the current study has revealed that physicians do regard regular visits of medical representatives. Since the emphasis in sales has become more customer-oriented, therefore pharmaceutical companies should invest in developing the most effective field force they can to achieve their strategic goals.
2) Quality of the medicines is considered to be the most critical variable in expanding customer loyalty, so companies must focus on it. In order to maintain and prolong the loyalty of doctors, marketing managers/business unit heads of pharmaceutical companies must give attention to the quality of the products (medicines) because quality of the products is the most critical variable in expanding customer loyalty and they must not compromise on quality of the products because the end-user is a patient which is suffering from a disease and needs intense care and cure and sub-standard or low-quality medicines can hamper/slow the recovery process or perhaps tend towards treatment failure and in diseases like cancer or other dangerous diseases it may lead to increased risk of patient's mortality.
3) Managers must focus brand image to enhance brand loyalty because brand loyalty is significantly influenced by good brand image. Pharmaceutical companies ought to give value to its every single customer (doctor) whether the customer is the new or old one. In order to construct the organization's as well as products' good image in the mind of their customers (doctors); marketing/business unit heads managers should create a respectful and humble liaison with their customers (doctors).
REFERENCESAaker, D.A. (1991). Managing brand equity: capitalizing on the value of a brand name.
New York: The Free Press.
Ahmed, Z., Ahmad, M., & Haq, M. (2014). Effect of brand trust and customer satisfaction on brand loyalty in Bahawalpur. Journal of Sociological Research, 5(1), 306-326.
Alex, D., & Thomas, S. (2015). Impact of product quality, service quality and contextual experience on customer perceived value and future buying intentions. European Journal of Business and Management, 3(3), 307-315.
Alhaddad, A. (2015). A structural model of the relationships between brand image, brand trust and brand loyalty. International Journal of Management Research and Review, 5(3), 137-144.
Sharafat Hussain et al.
309C 2016 CURJ, CUSIT
Alkhateeb, F.M., Khanfrab, N.M., & Clauson, K.A. (2009). Characteristics of physicians who frequently see pharmaceutical sales representatives. Journal of Hospital Marketing and Public Relations, 19(1), 2-14.
Anwar, A., Gulzar, A., Sohail, F.B., & Akram, S.N. (2011). Impact of brand image, trust and affect on consumer brand extension attitude: the mediating role of brand loyalty. International Journal of Economics and Management Sciences, 1(5), 73-79.
Burton, S., Lichtenstein, D.R., Netemeyer, R.G., & Garretson, J.A. (1998). A scale of measuring attitude toward private label products and an examination of its psychological and behavioral correlates. Journal of the Academy of Marketing Science, 26(4), 293-306.
Darekar, M.S. (2007). The role of medical representative in the pharmaceutical marketing: assessment of opinion for customer expectation from medical representative. ASM's International E-Journal of Ongoing Research in Management and IT, e-ISSN-2320-0065.
Datta, R.P. (2003). The determinants of brand loyalty. The Journal of American Academy of Business, Cambridge, 3(12), 138-144.
Day, R. (2000). How to make the most of a visit from a pharmaceutical company representative. Australian Prescriber 2000, 23(5), 97-99.
Dixit, R., Patil, P., Chadrashekar, CS, R., Madhuri, S., & Mane, A. (2014). Drug promotional activities as a source of medical information and its influence on prescribing. International Journal of Pharmacy and Biological Sciences, 4(3), 113-119.
Hafeez, S., & Hansu, S. (2010). Customer satisfaction for cellular phones in Pakistan: a case study of Mobilink. Bus.Econ.Res.J. 1(3), 34-44.
Hartley, T. (2013). How loyalty insights strengthen doctor/brand connections. Quirk's Marketing Research Media.
Inamdar, I.S., & Kolhatkar, M.J. (2012). Doctor's expectations from pharmaceutical products (medicines) which will influence their prescription behaviour. National Monthly Refereed Journal of Research in Commerce and Management, 1(4), 14-20.
Jan, S., Hussain, S., & Khan, K. (2013). Issues, causes and consequences with customer loyalty. International Review of Social Sciences, 1(1), 1-10.
Kaiser, H.F. (1974). An index of factorial simplicity. Psychometrika, 39(1), 31-36. Keller, K.L. (1993). Conceptualizing, measuring, and managing customer-
based brand equity. Journal of Marketing, 57(1), 1-22.
Factors Determining Physicians' Loyalty...
310 C 2016 CURJ, CUSIT
Khan, S (2012). Contribution of brand awareness and brand characteristics towards customer loyalty: A study of milk industry of Peshawar Pakistan. Asian Economic and Social Society, 2(8), 170-176.
Kim, H.B., & Kim, W.G. (2005). The relationship between brand equity and firm's performance in luxury hotels and chain restaurants. Tourism International, 26(4), 549-560.
Lattin, J.M., Carroll, J.D., & Green, P.E. (2003). Analyzing Multivariate Data, Thomson Learning, Inc.
Mao, J. (2010). Customer brand loyalty. International Journal of Business and Management, 5(7), 213-217.
Ogba, I.E., & Tan, Z. (2009). Exploring the impact of brand image on customer loyalty and commitment in China. Journal of Technology Management in China, 4(2), 132-144.
Olson, T. (2009). Build business using social networks. PC World.
Panchal, K.S., Khan, M.B., & Ramesh, S. (2012). Importance of 'brand loyalty, brand awareness and perceived quality parameters' in building brand equity in the Indian pharmaceutical industry. Journal of Medical Marketing, 12(2), 81-92.
Selnes, F. (1993). An examination of the effect of product performance on brand reputation, satisfaction and loyalty. European Journal of Marketing, 27(9), 19-35.
Upamannyu, N., Gulati, C., & Mathur, G. (2014). Effect of brand trust, brand image on customer brand loyalty in Fast Moving Consumer Group (FMGC) at Gwalior region. International Refereed Multidisciplinary Journal of Contemporary Research, 2(2), 83-93.
Waheed, A.K. (2011). Prescription loyalty behavior of physicians: an empirical study in India. International Journal of Pharmaceutical and Healthcare Marketing, 5(4), 279-298.
Zikmund, G.W., McLeod, R., & Gilbert, W.F. (2012). Customer relationship management: integrated marketing strategy and information technology, page 79. India Wiley (Pvt) Ltd.
Sharafat Hussain et al.
311
MODELING FOR TOURISM THROUGH ECONOMIC INDICATORS OF PAKISTAN
Muhammad Kamran*, Amjad Alib**, Alamgir*** and Dost Muhammad Khan****
ABSTRACT
The purpose of this study is to find an appropriate model for tourism data of Pakistan. Log tourism has been used as a dependent variable while Financial Exchange Rate, Gross Domestic Product, Employment, Visitor Exports and Investment are taken as independent variables. Data has been collected from secondary source Tourism Department of Pakistan and Economic survey of Pakistan 2014, for the period of 2004-2014. For final model selection, the model selection techniques; all possible regression, forward selection procedure and backward elimination procedure have been used. The final selected model can be used for future prediction of tourism. According to our findings two independent variables; employment and GDP significantly contribute to tourism. This model can be used for short run predication, because our data consist of very few years, which is the main hurdle that this model cannot be applied for long run prediction.
Keywords: Tourism, all possible regression, forward selection and backward selection.
INTRODUCTION
Since the beginning of recorded history, humans are driven to travel for the purpose of business (trade), exploration, food, water and safety. In the intervening time, the purpose of trading has increased to entertainment and delight. Traveling also increased due to advanced technologies, which facilitate the people to move easily from one place to another. In the past, travelers used to walk or ride on tamed animals. With the advancement in different field specifically, the invention of the wheel, planes and sea ships provided new mode of traveling. There is always a gradual increase with advancement, like chain of roads increased, governments stabilized and interest in traveling increased for sightseeing, education and religious purposes.
Tourism not only provides the inner pleasure to the tourists but also gives strength to the nation. The impact of tourism has many positive effects on the economy like, increased employment ratio, better currency exchange rate, diverse education, cultural exchange and improving hoteling etc. According to UNWTO World Tourism in 2009 the number of world tourist is 880 million, whereas, it is estimated that it to be1.6 billion by 2020. In the last few decades, the tourism industry in Pakistan was badly affected due to unstable condition of Pakistan (Getz, 2009; Wall & Mathieson, 2006). Tourism and economic growth has long history. There are too many consequences of economic growth on tourism, and there are many developed techniques in order to estimate the economic
City University Research JournalVolume 06 Number 02 July 2016 PP 311-320
* Department of Management Science, City University of Sc. & IT, Peshawar **Department of Statistics, Islamia College Peshawar, KPK, Pakistan*** Department of Statistics, University of Peshawar, KPK, Pakistan****Department of Statistics, Abdul Wali Khan University Mardan, KPK, Pakistan.
C 2016 CURJ, CUSIT
312
impact on tourism (Andersson, Armbrecht, & Lundberg, 2008).
In Asia, tourism is considered to be more important factor for economic growth. Through tourism, increased employment, per capita income, foreign exchange rate, trade in commodities is obvious. This foreseen high economic growth attracts the tourist for business tours and exchange programs. Tourism is an important sector for authorities, consultants and tourism developers for measuring the economic developments and its impact on tourism.
Generally, tourism is an assortment of industry, services and activities that distributes travel experience. According to the World Tourism Organization (WTO) presently tourism is the largest industry in the world, with annual revenues of over $3 trillion and it also provides more than 6 million jobs only in US. This industry contributes more than 10% in the world GDP, also this is the source for the income of generation, job developments and so many other advantages can be obtained for a state. According to the world tourism organisation, global incomes from tourism in 2002 were high up to $ 474 billion which is likely to increase 1.5 trillion by 2011 (WTTC, 2010).
Unfortunately, due to political instability, war in terror, floods, bomb attacks or suicide attacks, tourism is neglected in Pakistan and the most beautiful valleys are affected in the war of terrorism. Recently created Pakistan has recovered all the deficiencies. The elevation of tourism in the country stared in the 1960 in the shape of a small department of tourism which was created in 1960 as a cell in the Ministry of Railway. And afterward the Department of Tourism was transferred from one Minister to another. Now the Tourism in Pakistan department has gained the status of tourism Department under the Ministry of Tourism (Khan et al. 2011).
Objectives of the study:
The main objectives of the present study is to investigate the best model for tourism in Pakistan selection through model selection criterion, as well as to find the best sub set of predictors and identified that the final model can be used for prediction or not.
LITERATURE REVIEWS
Several researchers have discussed the importance of tourism industry and its contribution in economic growth all over the world, impact on cultural, social, environmental growth (Deery & Jago, 2010; Dogan, 1989; Gösslingt & Hall, 2008; Lankford & Howard, 1994; Pizam, 1978; Turner & Ash, 1975). According to Kulendran and Wilson (2002) are studied the empirical analysis of China and Australia, they observed form their study a strong relationship between international tourism and economic growth. Further they concluded that through international and domestic tourist not only caused increase economic growth but this also increased the opportunity of employment and trade etc.
Similarly, the excellence in economic growth attracts people for business tours and they openly invest money in the developed industry as a result labor force and employment also might be increased (Bahmani- Oskooee & Alse, 1993; Chow, 1987; Marin, 1992). According to UN World Tourism Barometer (2009) total 924 million visitors were seen worldwide by the end of 2008 which was 2% high compared to 2007. This results show that the number of visitor's increases year by year but now in the present conditions
C 2016 CURJ, CUSIT
Muhammad Kamran et al.
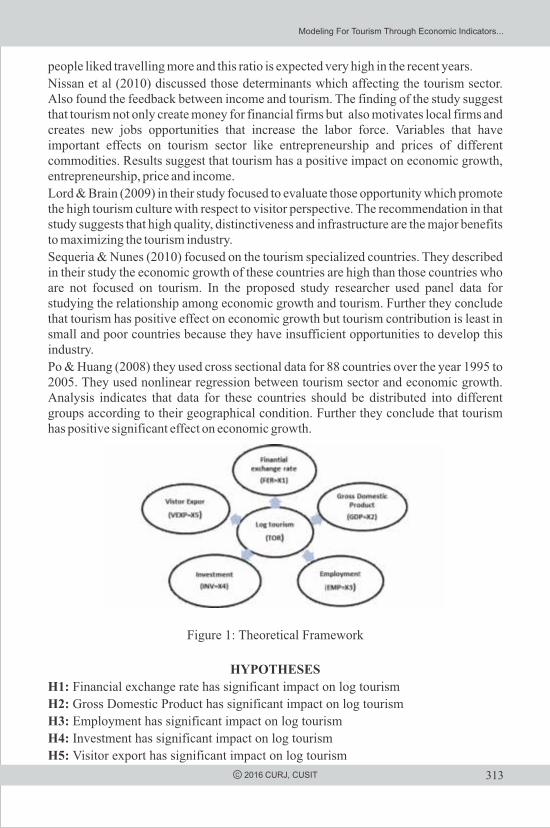
313
people liked travelling more and this ratio is expected very high in the recent years.
Nissan et al (2010) discussed those determinants which affecting the tourism sector. Also found the feedback between income and tourism. The finding of the study suggest that tourism not only create money for financial firms but also motivates local firms and creates new jobs opportunities that increase the labor force. Variables that have important effects on tourism sector like entrepreneurship and prices of different commodities. Results suggest that tourism has a positive impact on economic growth, entrepreneurship, price and income.
Lord & Brain (2009) in their study focused to evaluate those opportunity which promote the high tourism culture with respect to visitor perspective. The recommendation in that study suggests that high quality, distinctiveness and infrastructure are the major benefits to maximizing the tourism industry.
Sequeria & Nunes (2010) focused on the tourism specialized countries. They described in their study the economic growth of these countries are high than those countries who are not focused on tourism. In the proposed study researcher used panel data for studying the relationship among economic growth and tourism. Further they conclude that tourism has positive effect on economic growth but tourism contribution is least in small and poor countries because they have insufficient opportunities to develop this industry.
Po & Huang (2008) they used cross sectional data for 88 countries over the year 1995 to 2005. They used nonlinear regression between tourism sector and economic growth. Analysis indicates that data for these countries should be distributed into different groups according to their geographical condition. Further they conclude that tourism has positive significant effect on economic growth.
Figure 1: Theoretical Framework
HYPOTHESES
H1: Financial exchange rate has significant impact on log tourism
H2: Gross Domestic Product has significant impact on log tourism
H3: Employment has significant impact on log tourism
H4: Investment has significant impact on log tourism
H5: Visitor export has significant impact on log tourism
C 2016 CURJ, CUSIT
Modeling For Tourism Through Economic Indicators...

314
MATERIALS AND METHODS
In the present study, annual data has been used from 2004 to 2014 which has been collected from the secondary source like, Tourism department of Pakistan and Economic survey of Pakistan-2014. Log tourism (LnTUR) used as response / dependent variable and five independent variables financial exchange rate (FER), gross domestic product (GDP), employment (EMP), visitor export (VEXP) and investment (INV) have been included.
Augmented Dickey Fuller (ADF) test has been used for testing the stationarity of the variables; all the original variables are stationary at level. The test for stationarity is important for long term relation and for prediction purpose. Furthermore all possible regression, forward selection procedure and backward elimination criteria were used for model selection on the basis of R-Square, Adjusted R- Square and Mean Square Error (MSE). Data has been analyzed in Statistical Software for Social Sciences (SPSS).
Analysis and Discussion:
According to the objectives of present study researchers use various statistical tools to carry out their analysis. In the present study we used three different statistical tools, to identify best model out of all possible regression models and also to find the best sub set of predictors. For this purpose, we used all possible regression, backward elimination and forward selection procedures.
All Possible Regression:
All possible regression means to identify the best sub-set of predictor's regression model out of all possible regression models. In the present study used five explanatory
5variables which established 2 -1=31 models. For best model selection criterion were used such as coefficient of determination (R-Square), Adjusted R-Square and Mean square Error (MSE). In Table-1 have been used five single variable regression models in which just only one regression model with (X3) independent variable have been selected, having R-square is 76.2% indicates that 76.2% of the variability explained in dependent variable by its linear relationship with the independent variable (X3) and remaining is unexplained due to other factors. Also in this model Adjusted R-square value is maximum 73.5% and the mean square error is too minimum out of all single variable models.
Now for the two independent variables we have ten possible regression models in which (X2,X3) have been selected having R-square value is 84.4%, indicates that 84.4% of the variability in dependent variable explained by its linear relationship with the independent variable (X2,X3) and remaining due to other factors, this also indicates that (X2) is an important variables. The value of Adj R-square 80.5% is also increased as compared to single variable model. Further if we observed the value of mean square error remain same as single variable model. Now for the three independent variable we have also ten models in which (X2,X3,X4) have been selected, having high R-square 88.7%, indicates that 88.7% of the variability in dependent variable explained by its linear relationship with the independent variable (X2,X3,X4) and remaining is unexplained due to other factors. Also the value of Adj R-Square value 81.2% increased as compared to two variable model, indicate that (X4) has significant effect on
C 2016 CURJ, CUSIT
Muhammad Kamran et al.
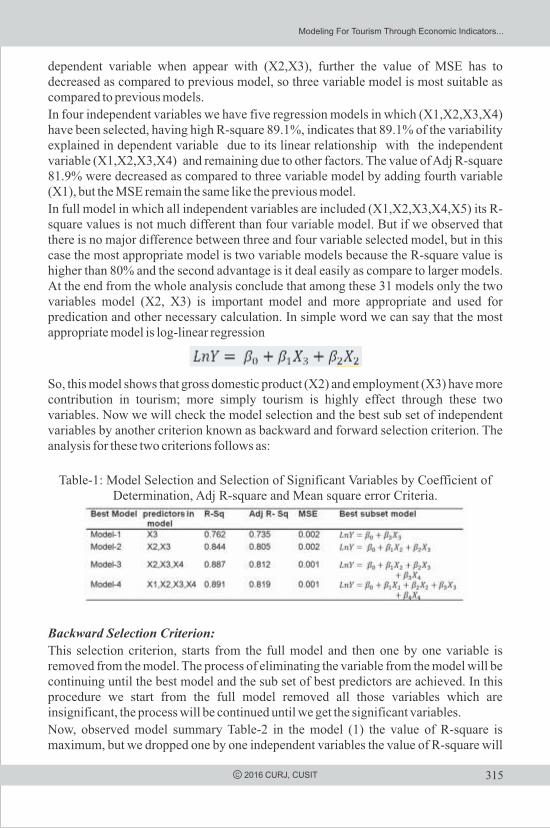
315C 2016 CURJ, CUSIT
dependent variable when appear with (X2,X3), further the value of MSE has to decreased as compared to previous model, so three variable model is most suitable as compared to previous models.
In four independent variables we have five regression models in which (X1,X2,X3,X4) have been selected, having high R-square 89.1%, indicates that 89.1% of the variability explained in dependent variable due to its linear relationship with the independent variable (X1,X2,X3,X4) and remaining due to other factors. The value of Adj R-square 81.9% were decreased as compared to three variable model by adding fourth variable (X1), but the MSE remain the same like the previous model.
In full model in which all independent variables are included (X1,X2,X3,X4,X5) its R-square values is not much different than four variable model. But if we observed that there is no major difference between three and four variable selected model, but in this case the most appropriate model is two variable models because the R-square value is higher than 80% and the second advantage is it deal easily as compare to larger models. At the end from the whole analysis conclude that among these 31 models only the two variables model (X2, X3) is important model and more appropriate and used for predication and other necessary calculation. In simple word we can say that the most appropriate model is log-linear regression
So, this model shows that gross domestic product (X2) and employment (X3) have more contribution in tourism; more simply tourism is highly effect through these two variables. Now we will check the model selection and the best sub set of independent variables by another criterion known as backward and forward selection criterion. The analysis for these two criterions follows as:
Table-1: Model Selection and Selection of Significant Variables by Coefficient of Determination, Adj R-square and Mean square error Criteria.
Backward Selection Criterion:
This selection criterion, starts from the full model and then one by one variable is removed from the model. The process of eliminating the variable from the model will be continuing until the best model and the sub set of best predictors are achieved. In this procedure we start from the full model removed all those variables which are insignificant, the process will be continued until we get the significant variables.
Now, observed model summary Table-2 in the model (1) the value of R-square is maximum, but we dropped one by one independent variables the value of R-square will
Modeling For Tourism Through Economic Indicators...

316 C 2016 CURJ, CUSIT
be decreased. If one can compared the value of R-square of model (1) and model (4) there is no major difference among these two models clearly shows the values which are 0.892 and 0.844 respectively. In the last model (4) we included two variables which are (X2, X3) and the R-square value also greater than 80%.Another side, if we compared Adj R-square values, for the first model is too minimum among all four models. This indicates that in the full model some insignificant variables are present by which the Adj R-square is smaller. But in the last model the value of Adj R-square is high compared to the first model and the standard error also minimum. So again according to this criterion two variable models is best one.
Table-2: Model Summary
Table-3: ANOVA
Table-4: Coefficients
In Table-3 clearly observed the residual sum of squares, which is least in the suggested model, is 0.012, and the value of F-statistic is 21.642, shows that the overall model is highly significant. This criterion also suggests the two variable model when we removed variables from the model the performance of the model also increased. In the (Table -4), only discussed the finalized model coefficients and the significance of variables. In first stage we added all explanatory variables and then one by one
Muhammad Kamran et al.

317C 2016 CURJ, CUSIT
insignificant variables will be eliminated until the significant variables were left. At the end two variables are left in the model, which is our final model, X2 has negative significant and X3 has positive significant impact on dependent variable.
Forward Selection Criterion
This criterion is the reciprocal of backward selection criterion, in this criterion, we taking start from constant with no predictors at the first stage, and the second stage we added one highly significant variable in the model, in this way we obtained one best variable in the model. In the second stage we obtained the second significant variable. The process will continue until all insignificant variables are left. In Table-5 R-square, with X3 alone (step 1), 76.2% of the variance was accounted for both X3 and X2 (step 2), 84.4% of the variance was accounted for.
Table-5: Model Summary
Table-6: ANOVA
Table-7: Coefficients
This Table-7 now gives two F-test one for each step of the procedure. Both steps had overall significant results. Table-8 gives beta coefficients so that we can construct the regression equation. Betas shows change, in dependent variable, depending on which predictors are included in the model. These are the weights that we want, , for an
Modeling For Tourism Through Economic Indicators...
318 C 2016 CURJ, CUSIT
an equation that includes just X3 and X2 (the two best predictors). The equation would be;
All the three different selection procedure gives the same results. So we can conclude from the whole analysis the two variable model “employment” and “gross domestic product” is the best one. These two variables can be used to predict the tourism.
Results for Research Hypothesis:
According to selected model, our first alternative is rejected, because financial exchange rate has no significant effect on tourism. The second alternative hypothesis is accepted GDP has negative significant effect on tourism. Third alternative hypothesis also accepted employment has positive significant effect on tourism and the fourth and fifth hypothesis has been rejected.
CONCLUSION
In present study, we used log tourism as dependent variable financial exchange rate, gross domestic product, employment, visitor exports and investment as independent variables. Ten year data has been used, collected from the secondary source,
Three different statistical tools were applied for data analysis, all possible regression, backward elimination and forward selection procedures, to achieve the objectives and research hypothesis. From three different results we obtained the same results. In all possible regression, total number of possible regression equations are 32, in which one is constant model with no predictors, five are one variables models, ten are with two variables models, ten are with three variables models, five are four variables models and the last model is full variable model mean with five predictors.
This method suggest us two variable model is more efficient out of all models, which has maximum R-square, Adj R-squared and minimum MSE, named of these two variables are employment (X3) and gross domestic product (X2). Backward elimination and forward selection procedure also suggest discussed model. According to selected model, our first alternative is rejected, because financial exchange rate has no significant effect on tourism. The second alternative hypothesis is accepted GDP has negative significant effect on tourism. Third alternative hypothesis also accepted employment has positive significant effect on tourism and the fourth and fifth hypothesis also rejected.
Alternative hypothesis Accepted Rejected
H1 ×
H2
×
H3 ×
H4 ×
H5 ×
Muhammad Kamran et al.

319C 2016 CURJ, CUSIT
The finalized model can be used for short run predication, because our data consist of very few years, which are the main cause this model cannot be used for long run prediction.
REFERENCESAndersson, T. D., Armbrecht, J., & Lundberg, E. (2008). Impact of Mega-Events on the
Economy. Asian Bus Manage, 7(2), 163-179.
Bahmani-Oskooee, M., & Alse, J. (1993). Export growth and economic growth: An application of Cointegration and error correction modeling. Journal of Developing Areas, 27, 535–542.
Chow, P. C. Y. (1987). `Causality between export growth and industrial development: Empirical evidence from the NICs. Journal of Development Economics, 26, 55–63.
Deery, M., & Jago, L. (2010). Social impacts of events and the role of anti-social behavior. International Journal of Event and Festival Management, 1(1), 8
-28.
Dogan, H. Z. (1989). Forms of adjustment: Socio-cultural impacts of tourism. Annals of Tourism Research, 16(2), 216-236.
Getz, D. (2009). Policy for sustainable and responsible festivals and events: institutionalization of a new paradigm. Journal of Policy Research in Tourism, Leisure and Events, 1(1), 61 - 78.
Gössling, S., & Hall, M. C. (2008). Swedish Tourism and Climate Change Mitigation: An Emerging Conflict? Scandinavian Journal of Hospitality and Tourism, 8(2), 141 - 158.
Khan, J. A., Syed, S., Zaman, K., & Ahmad, F. (2011).Students' Perception toward Social, Economic and Environmental Impacts of Tourism in Chiral–Pakistan. Journal of International Academic Research, 11(1).
Kulendran, N., & Wilson, K. (2000). Is there a relationship between international trade and international travel? Applied Economics, 32, 1001–1009.
Lankford, S. V., & Howard, D. R. (1994).Developing a tourism impact attitude scale. Annals of Tourism Research, 21(1), 121-139.
Lord Cultural Resources & Brain Trust. (2009). "Ontario cultural and heritage tourism product research paper.”
Marin, D. (1992). Is the export-led hypothesis valid for industrialized countries? Review of Economics and Statistics, 74, 678–688.
Nissan, E., Galindo, M., & Mendez, M. (2010)."Relationship between tourism and economic growth." The Services Industries Journal, 31(10), 1567–1572.
Modeling For Tourism Through Economic Indicators...
320 C 2016 CURJ, CUSIT
Pizam, A. (1978). Tourism's Impacts: The Social Costs to the Destination Community as Perceived by Its Residents. Journal of Travel Research, 16(4), 8-12.
Po, W. & Huang, B. (2008)."Tourism development and economic growth – a nonlinear approach." Physica A, 387 (2008), 5535–5542.
Sequeria, T. & Nunes, P. (2010). "Does tourism influence economic growth? A dynamic panel data approach." Applied Economics, 40(18), 2431–2441.
Turner, L., & Ash, J. (1975).The golden hordes: international tourism and the pleasure periphery. New York: St. Martin's Press.
UNWTO (2009). UNWTO World Tourism Barometer, Jan 2009 Edition. Retrieved from:<http://www.unwto.org/facts/eng/pdf/barometer/UNWTO_Baro09_2_enexcerpt.pd [accessed 24 February 2010].
Wall, G., & Mathieson, A. (2006).Tourism: changes, impacts, and opportunities (2. Ed.). Harlow, Eng. New York: Pearson Prentice Hall.
World Tourism Organization (2002). News from the World Tourism Organization. Retrieved July 22, 2002 from http://www.world-tourism.
WTTC (2010). World Travel and Tourism Council. Travel and Tourism Economic Impact: Pakistan. Retrieved from: <http://www.wttc.org/bin/pdf/original_pdf_file/pakistan.pdf> [accessed 11 March 2010].
Muhammad Kamran et al.

321
An Empirical Investigation into the Role of Internal Service Quality in Fostering Organizational Performance
Khawaja Fawad Latif*, Qadar Bakhsh Baloch** and Umer Farooq Shahibzada***
ABSTRACT
The study seeks to evaluate the role of ISQ in improving organizational performance.The sample included 80 bank branches, the data was collected from the employees working in different bank branches located within the city of Peshawar. Banks selected as part of the population required to have more than five branches. Stratified random sampling technique was utilized to collect the data from different banks operating in the city of Peshawar. A total of 564 questionnaires were distributed in 80 different branches of medium and large sized banks. In the present study 404 questionnaires were returned, constituting the response rate of 71.63%. A total of 63 questionnaires were rejected. The total number of questionnaires usable for the study was 341.The objective measures for bank performance used in the present study included Return on Equity (ROE), Earnings per Share (EPS) and Return on Assets (ROA). The study ascertains that ISQ has a significant influence in predicting both subjective and objective organizational performance measures. The present research strengthens the theoretical assertions that unless ISQ is not strengthened, the organization will not be able to attain external service quality, growth and profit. The effect of ISQ is important to top management, implying their responsibility for investing to create an environment that nurtures trust, understanding, commitment, provision of timely service, and positivity in attitude and behavior. Management which expects to reap benefits of service quality must understand the need of better ISQ and should invest in the intangible factors that have been proven to affect the tangible profits. The research study affirms that it is not only external service quality that adds to the profitability of the organizations. Therefore, it is found imperative for the banks to foster ISQ in their workplace environment.
Keywords: Internal Service Quality, Subjective Organizational Performance,
Objective Organizational Performance
INTRODUCTION
Organizations operate in an extremely competitive, vibrant, challenging, and dynamic business environment. In response to the pressures of running business in such an environment, organizations seek ways to add value to the services offered and improve their service quality. One way to achieve optimal level of service quality is through focus on the human resources. Lack of attention towards human resources can seriously hamper the value of service. This is because in customer contact businesses, quality of
City University Research JournalVolume 06 Number 02 July 2016 PP 321-343
*Assistant Professor, COMSAT Institute of Information & Technology, Attock.
**Associate Professor, HoD Management Sciences Department, NUML University
Peshawar***Lecturer, Department of Management Sciences, Abasyn University, Peshawar.
C 2016 CURJ, CUSIT

322
service delivered is strongly linked with the quality of service providers. It is for this reason that the need for quality improvement continues unabated both in the manufacturing and service sector (Longenecker & Scazzero, 2000). The challenge to provide efficient and effective service is dictated by the fact that today's customers are more informed, knowledgeable, and experienced about the variety of products and services being offered in the market. This awareness about product quality, shape customers' expectations about the product, and compels the business world to meet the expectations and anticipations of the customers (Prakash & Mohanty, 2012).
Parasuraman (2002) stressed that scholarly literature attests to the benefits of providing superior customer service. Emphasis is laid on the business to create meaningful, memorable customer experiences (Prakash & Mohanty, 2012). This user satisfaction will come from service quality (Hernon & Whitman, 2001; Wang & Shieh, 2006). Service quality is an important tool that not only ensures survival but growth in the extremely competitive business environment. Service quality has been identified as one of the key features that ultimately leads to organizational success; however a decline in service quality leads to deterioration in the level of customer satisfaction (Frost & Kumar, 2000) which adversely affects organizational performance. However, increased level of service quality has been found to produce greater satisfaction amongst customers that could lead to patronage intentions and increased sales (Prakash & Mohanty, 2012).
Service Quality takes two different forms i-e,external and internal. External service quality relates to assessment based on what the customers' value and what they are willing to pay for (Dinitzen & Bohlbro, 2010). External service quality is strongly contingent to internal service i-e, employees receiving high quality internal services would strive to provide higher quality external service. Internal service quality (ISQ), on the other hand, points to services provided by distinctive organizational units or the people working in different departments to other departments or employees within the organization (Stauss, 1995). Thus, in order to achieve optimal level of ISQ, organizations will have to focus on its employees. This is imperative for most services, as the delivery of services occurs through human interaction (Boshoff & Mels, 1995). While human factors are significant in all quality enhancement initiatives, they are c r i t ica l in serv ice indus t r ies (Longenecker & Scazzero , 2000) .
Extensive research is available on service quality from the external customer perspective, however, relatively few studies have concentrated on the relationship between (Internal Customers) service quality especially in commercial banks and its relationship with organizational performance. It is important to note that business organizations have been complacent in recognizing the severe repercussions of their sluggish ISQ and its influence on organizations' overall performances (Vanniarajan & Subbash, 2011). Hence, the present study is operationalized among banks. The banking sector is a demand driven industry and represents a vital section of the services industry in any country (Mishkin, 2001). The current rapidly changing environment is compelling the attention of banking institutions towards service quality, and retail banks are striving towards increasing customer satisfaction through improved service quality(Choudury, 2014). This is becausegrowth in the banking sector and the ever increasing competition among banks has clearly highlighted the need for customer
C 2016 CURJ, CUSIT
Khawaja Fawad Latif et al.
323
satisfaction and optimization of customer service for a surge in market shares and profitability (Anderson et al., 1994). It is however important to note that for many organizations, quality means meeting customers' requirements. However, customer may not refer to people outside the organization only, Juran (1988) defined customers as persons who are not only the organization's customers but also its employees. He included all persons in customers who are affected by an organization's processes and products. Organizations understanding of how a person working within the organization is affected by the activities within the organization can not only aid in designing strategies and practices that would offer a more congenial business environment but also make employee reciprocate with level of performance desired by the organization.
LITERATURE REVIEW
Two main streams of literature have been utilized for building our model and hypotheses. The first stream relates to internal service quality, the second stream relates to organizational performance.
Internal Service Quality (ISQ)
Employees working in an organization can only produce fruitful results for the business if the communication, coordination, and relationship among them is efficient and effective. Employees are strongly reliant on each other to produce the required level of service, this service delivered and received is referred to as ISQ. ISQ is defined as the quality of service delivered by different departments or the people working in these departments, to other departments or to workers within the organization . The person delivering the service is referred to as the supplier, while the person receiving the service is the internal customer. Hammer (2001) dened ISQ as “an organized group of related activities that together create a result of value to customers.” (p. 52). It can be asserted that the former definition highlights the system of ISQ while the latter identifies the ultimate objective of ISQ. The concept of ISQ used in this research reflects Heskett et al.'s (1994) statement that ISQ is determined by the attitudes employees have towards each other and the way people serve each other within the organization. In simple terms, ISQ refers to the quality of interaction, support, and level of communication between different individuals working in an organization.
Management and staff in organizations rarely understand that employees and functions are actually customers of each other.Acknowledging the view that employees are also customers involve managing people's skills to make each person feel valued and communicating the importance of each job role across the team. There must be a feeling of reliability among staff and they shall share mutual respect. This will lead to an attitude of satisfaction.When the internal customers are completely satisfied, the workforce is ready to satisfy its customers (Papasolomou & Vrontis, 2006). This satisfactory service received by the internal customers (Employees) within the organization translates into the business ability to please the external customers. This argument is supported by various researchers who have argued that both internal and external customers are equally important, and successful quality of service received by the internal customers
C 2016 CURJ, CUSIT
An Empirical Investigation into the Role...
324
would lead to efficient and effective external service as it would result in more effective performance, lower waste and lower costs (Marshall, Baker, & Finn, 1998; Stanley & Wisner, 2001). The kind of treatment the internal customers receive severely affects the external customers; managements' inconsiderate behavior towards employees (Poor working conditions, Low pay, limited career opportunities, lack of training and development) can stimulate negative attitude in staff that would result in negative behavior towards the external customer (Christensen et al., 2007). The indecent behavior by the management towards the employees can also lead to hostile relations between the coworkers, resulting in retaliation from employees in the form of delays in completion of tasks, sharing of incorrect information, lack of willingness to help and cooperate with coworkers. Bouranta, Chitiris and Paravantis (2009) assert the view that if managers wish to improve the external service quality they should focus on ISQ issues.
Business has laid much of their focus on the external service quality. Hays (1996) highlighted the ground for this management behavior and further observed that the excitement and passion surrounding the drive and excellence to serve external customers often outdo the internal activities and processes. The management must understand that if staff in one department fails to provide timely service to their co-workers in another department, this will surely result in delayed service to external customers, thus resulting in negative credibility and loss of reputation. This slowness in focus towards ISQ is changing.Business organizations are realizing the fact that an adequate level of service received within the organization would translate into satisfactory external service quality.Thus the ultimate objective of ISQ is to provide quality service to external customers that actually relies on delivering service quality across internal units (Brandon-Jones & Silvestro, 2010).
Heightened level of internal service experience between the employees can help in creation of an improved service experience for the customer. It is thus important to note that an organization that wants to better serve its customer cannot only focus its energies on spending time and money on finding ways to provide enhanced service to its customers, but on its internal service units as well(Hays, 1996). Cook (2004) endorsed the assertion that many businesses invest their time and effort in measuring external customer perception, but they fail to recognize that external service is a reflection of what is happening in the organization between staff and different functions, different departments provide service to each other, the type of service they provide each other. It is anticipated that similar type of service would be provided to external customers, thus if a poor internal service exists, the final service to the customer will be damaged (Kang, James, & Alexandris, 2002).
ISQ has it imprints on the success of the business that comes from service performance, while service performance comes from the quality of service (Zailani, Din, & Wahid, 2006). This quality of service is not only the external service quality but also the ISQ, since the quality of external service is dictated by the quality of internal service (Cook, 2004). Not only that ISQ results in external service quality, but also benefit the organization in a variety of other ways, for instance employee retention is based on ISQ (Cook, 2008; Dinitzen & Bohlbro, 2010; Suganthi & Samuel, 2004). Furthermore the focus on ISQ is important for business growth (Little & Marandi, 2003), it's critical in
C 2016 CURJ, CUSIT
Khawaja Fawad Latif et al.
325
determining the success of an organization in today's competitive environment (Anosike & Eid, 2011; Frost & Kumar, 2001), it is crucial in the effective implementation of the organizational objectives (Anosike & Eid, 2011). The need for effective ISQ is further enhanced by the fact that it is the first step in the service-profit chain (Williams, 2007), since service quality delivered early in the production chain sets an absolute limit on the potential quality of the final good/service to the external customer (Hays, 1996).The importance of providing excellent service to internal customers is evident despite its far reaching benefits in serving external customers and helping business attain competitive advantage, the area has received little attention (Jun & Cai, 2010). Hence, the present research endeavors to enrich the existing literature on ISQ and highlight the role it can play in attainment of improved organizational performance.
Measuring ISQ
Service Quality is not easily classifiable and quantifiable owing to the characteristics of services that differentiate it from goods, this actually poses a problem with the management of service quality in service firms. The reason for this difficulty is highlighted by Parasuraman, Zeithaml, and Berry (1985) who noted that goods have tangible cues to assess quality, they may include style, hardness, color, label, feel, package, and fit. However, in case of service fewer tangible cues exist. Similar to the measurement of quality perceived by customers in the form of sets of dimensions or criteria, the quality of internal service that employees receive from other departments can be meaningfully categorized and measured (Reynoso & Moores, 1994). One of the approaches to measure ISQ is a gap-based measure, this is achieved through the utilization of the SERVQUAL scale (Parasuraman et al. 1988).
One of the earliest attempts, on modelling service quality came from Parasuraman, Berry and Zeithmal (1985). Parasuraman, Zeithaml, and Berry (1985) identified ten determinants of service quality, as identified in table 3. Parasuraman, Berry and Zeithmal (1988) measured customers perception of service quality through development of a multi-item scale from the original ten determinants. Zeithmal, Parasuraman and Berry (1990) claimed that,
“SERVQUAL, with appropriate adaptation can be used by departments and division within a company to ascertain the quality of service they provide to employees in other departments and divisions”
Similarly Kang, James, and Alexandris (2002) also assert that it seems reasonable to modify SERVQUAL instrument to measure ISQ. A number of attempts have been made to utilize servqual instrument to measure ISQ. Young and Varble (1997) used SERVQUAL, the results indicated that SERVQUAL is a useful method for obtaining feedback from internal customers. The study found reliability to be the most important dimension, while tangibility was found to be less important by the internal customers.Reynoso and Moore (1995) studied ISQ at two hospitals in England. They found ten dimensions of ISQ. It was concluded that transferability of the SERVQUAL dimensions from the external to the internal customer appeared to be well justified. Similarly, Brooks, Lings, and Botschen (1999) compared dimensions of ISQ with the SERVQUAL dimensions of external service quality which have been proposed by
C 2016 CURJ, CUSIT
An Empirical Investigation into the Role...
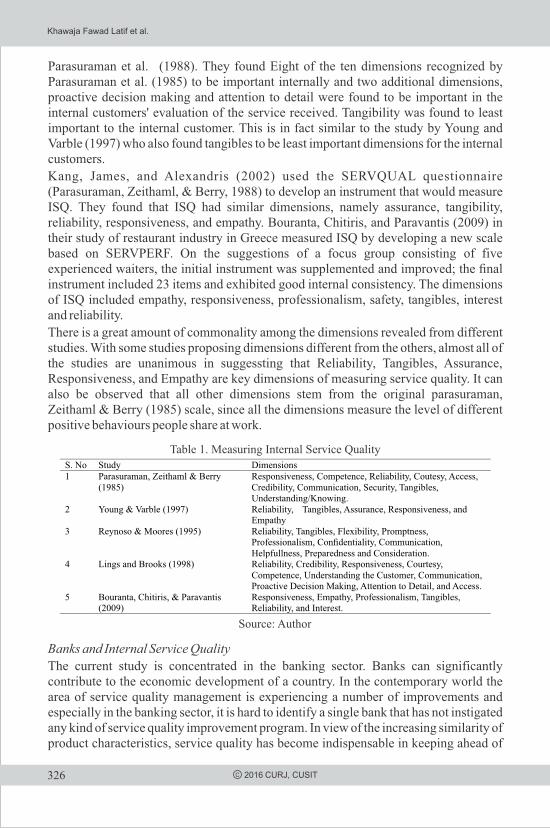
326
Parasuraman et al. (1988). They found Eight of the ten dimensions recognized by Parasuraman et al. (1985) to be important internally and two additional dimensions, proactive decision making and attention to detail were found to be important in the internal customers' evaluation of the service received. Tangibility was found to least important to the internal customer. This is in fact similar to the study by Young and Varble (1997) who also found tangibles to be least important dimensions for the internal customers.
Kang, James, and Alexandris (2002) used the SERVQUAL questionnaire (Parasuraman, Zeithaml, & Berry, 1988) to develop an instrument that would measure ISQ. They found that ISQ had similar dimensions, namely assurance, tangibility, reliability, responsiveness, and empathy. Bouranta, Chitiris, and Paravantis (2009) in their study of restaurant industry in Greece measured ISQ by developing a new scale based on SERVPERF. On the suggestions of a focus group consisting of five experienced waiters, the initial instrument was supplemented and improved; the nal instrument included 23 items and exhibited good internal consistency. The dimensions of ISQ included empathy, responsiveness, professionalism, safety, tangibles, interest and reliability.
There is a great amount of commonality among the dimensions revealed from different studies. With some studies proposing dimensions different from the others, almost all of the studies are unanimous in suggessting that Reliability, Tangibles, Assurance, Responsiveness, and Empathy are key dimensions of measuring service quality. It can also be observed that all other dimensions stem from the original parasuraman, Zeithaml & Berry (1985) scale, since all the dimensions measure the level of different positive behaviours people share at work.
Banks and Internal Service Quality
The current study is concentrated in the banking sector. Banks can significantly contribute to the economic development of a country. In the contemporary world the area of service quality management is experiencing a number of improvements and especially in the banking sector, it is hard to identify a single bank that has not instigated any kind of service quality improvement program. In view of the increasing similarity of product characteristics, service quality has become indispensable in keeping ahead of
C 2016 CURJ, CUSIT
Table 1. Measuring Internal Service Quality
Source: Author
Khawaja Fawad Latif et al.
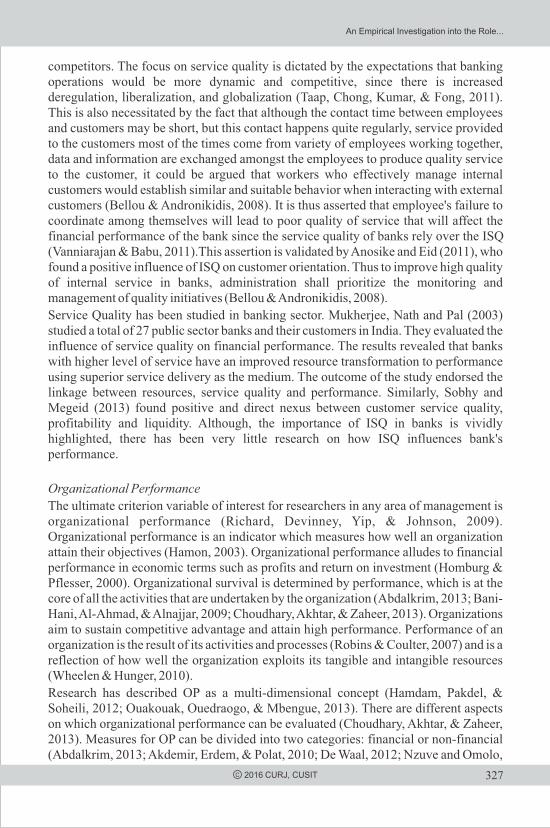
327
competitors. The focus on service quality is dictated by the expectations that banking operations would be more dynamic and competitive, since there is increased deregulation, liberalization, and globalization (Taap, Chong, Kumar, & Fong, 2011). This is also necessitated by the fact that although the contact time between employees and customers may be short, but this contact happens quite regularly, service provided to the customers most of the times come from variety of employees working together, data and information are exchanged amongst the employees to produce quality service to the customer, it could be argued that workers who effectively manage internal customers would establish similar and suitable behavior when interacting with external customers (Bellou & Andronikidis, 2008). It is thus asserted that employee's failure to coordinate among themselves will lead to poor quality of service that will affect the financial performance of the bank since the service quality of banks rely over the ISQ (Vanniarajan & Babu, 2011).This assertion is validated by Anosike and Eid (2011), who found a positive influence of ISQ on customer orientation. Thus to improve high quality of internal service in banks, administration shall prioritize the monitoring and management of quality initiatives (Bellou & Andronikidis, 2008).
Service Quality has been studied in banking sector. Mukherjee, Nath and Pal (2003) studied a total of 27 public sector banks and their customers in India. They evaluated the influence of service quality on financial performance. The results revealed that banks with higher level of service have an improved resource transformation to performance using superior service delivery as the medium. The outcome of the study endorsed the linkage between resources, service quality and performance. Similarly, Sobhy and Megeid (2013) found positive and direct nexus between customer service quality, profitability and liquidity. Although, the importance of ISQ in banks is vividly highlighted, there has been very little research on how ISQ influences bank's performance.
Organizational Performance
The ultimate criterion variable of interest for researchers in any area of management is organizational performance (Richard, Devinney, Yip, & Johnson, 2009). Organizational performance is an indicator which measures how well an organization attain their objectives (Hamon, 2003). Organizational performance alludes to financial performance in economic terms such as profits and return on investment (Homburg & Pflesser, 2000). Organizational survival is determined by performance, which is at the core of all the activities that are undertaken by the organization (Abdalkrim, 2013; Bani-Hani, Al-Ahmad, & Alnajjar, 2009; Choudhary, Akhtar, & Zaheer, 2013). Organizations aim to sustain competitive advantage and attain high performance. Performance of an organization is the result of its activities and processes (Robins & Coulter, 2007) and is a reflection of how well the organization exploits its tangible and intangible resources (Wheelen & Hunger, 2010).
Research has described OP as a multi-dimensional concept (Hamdam, Pakdel, & Soheili, 2012; Ouakouak, Ouedraogo, & Mbengue, 2013). There are different aspects on which organizational performance can be evaluated (Choudhary, Akhtar, & Zaheer, 2013). Measures for OP can be divided into two categories: financial or non-financial (Abdalkrim, 2013; Akdemir, Erdem, & Polat, 2010; De Waal, 2012; Nzuve and Omolo,
C 2016 CURJ, CUSIT
An Empirical Investigation into the Role...

328
2012).Organizational performance may be measured using objective or subjective (i.e. Perceptual) measures. Hancott (2005) revealed that, a number of objective indicators have been adopted to measure OP, such as net or total asset growth rate, prot growth rate,shareholder return, return on sales, growth in market share, return on net assets, and number of new products, etc. In 1990, return on net assets and return on capital have been applied in performance measurement as well. Tippins and Sohi (2003) propose that OP is measured on four dimensions: relative protability, return on investment, customer retention, and total sales growth. In the present study, for the present study the focus is on both objective and subjective performance.
Subjective data involve perceptual judgement, however, traditionally objective data have been believed to be less biased, but the problem is that it is not always available, when this is the case subjective data may be a reasonable alternative (McCracken, McIlwain, &Fottler, 2001). Subjective measures ask supposedly well-informed respondents (key informants) about organizational performance. According to Singh (2004) a disadvantage of a perceptual measure is that it can be highly subjective, both in the judgment of organizational performance itself and in the selection of a competing organization.
The present study also takes into account the objective data pertinent to organizational performance. The objective data that are incorporated in the present study includes the following Earning per Share (EPS), Return on Equity (ROE), and Return on Assets (ROA).
Service Quality and Organizational Performance
Deming (1982) noted that quality initiative within the organization results in enhanced productivity that ultimately leads to improved competitiveness. Organizational performance fundamentally depends on its key resource “people”. For Quality is the responsibility of everybody ranging from top management to the unskilled worker (Feigenbaum, 1983). Feigenbaum, further identified that it is the total participation of all employees and the total integration of all the company's technical and human resources that will lead to long-term business success. Juran (1988) highlighted that the involvement of the management can become visible through the establishment of the Quality Policy.In the banking industry, the importance of relationship development and maintenance with key customers has previously been investigated (Madill, Feeney, Riding, & Haines.2002). Hawke and Heffernan (2006) identified increased prot through reduced risk, improved communication links, and referrals to be some of the benets of strong relationships with key customers. Although, it is noted in the context of external customers yet repeatedly the same is recorded for the internal customers as well. The bank needs to maintain cordial relationship within the bank, which would positively influence bank performance.
Provision of quality service to external customers is only possible through significant improvement in organizations' improvement of quality service to internal customers. Better performance, combined with improved attitudes, transfers itself in quality service delivery. Improved service and empathy from employees results in willingness of external customers to purchase the service, which results in improved financial performance (Getty & Getty, 2000). Provision of service by employees to their
C 2016 CURJ, CUSIT
Khawaja Fawad Latif et al.
329
coworkers is an important dimension of ISQ. Adequate service provided would help the employees in performing their duties in an acceptable manner without any strain of delay or errors, thus, the quality of internal services affects employee satisfaction (Zhen-You, 2003). Bellou and Andronikidis (2008) conducted a study on 16 big banks in Greece found that banks' performance eventually improved through improved ISQ that influenced the behavior and satisfaction of the external customers.
RESEARCH METHODOLOGY
Population and Sample
The population frame for the study was drawn from the banks listed in Karachi Stock Exchange (KSE) having over five branches operating in Pakistan and the city of Peshawar. Out of 24 banks listed in KSE, banks with more than five branches in the city were included in the study. The list of sample frame is tabulated below.
The stratified random sampling technique is utilized. The banks were divided into two strata, Medium and Large Banks, since smaller banks had less than or equal to 5 branches in Peshawar they were excluded from the study. Banks with total assets in excess of Rs. 500 billion is categorized as “Large Banks”, banks with total assets in between Rs. 100 billion to Rs. 500 billion is categorized as “Medium Size Banks”. The research adopted the stratified random sampling technique, distributed population in homogeneous groups of medium and large banks.
Measurement
In order to investigate the role of ISQ in fostering organizational performance, both primary and secondary data has been collected. A questionnaire has been used to collect primary data from bank employees, while financial performance data has been collected
C 2016 CURJ, CUSIT
Table Sample Frame
An Empirical Investigation into the Role...

330
from annual bank reports. Three years data relating to financial performance were taken from the financial reports of the banks submitted available on the bank's website. Return on Equity (ROE), Earning per Share (EPS), and Return on Assets (ROA) were the objective measures of organizational performance used in the study. ISQ was measured by a scale developed by Kang, James and Alexandris (2002). Five dimensions were identified from ISQ scale, namely Reliability, Assurance, Tangibles, Empathy and Responsiveness. Tangibles dimension was not included in the study. A total of 18 items made up the ISQ scale.Subjective organizational performance was measured using the scale developed by Tseng (2010).
Data Collection
The research setting for this study was Public and Private Sector Banks in KPK. The research primarily focused on the primary sources of data collected through research questionnaire. A total of 564 questionnaires were distributed in 80 different branches of medium and large sized banks. In the present study 404 questionnaires were returned, constituting the response rate of 71.63. A total of 63 questionnaires were rejected. The total number of questionnaires usable for the study was 341. The following table summarizes the banks selected as sample, questionnaires distributed, questionnaires returned and questionnaires usable.
DATA ANALYSIS AND RESULTS
Profile of the Respondents
The demographic profile of respondents showed that average age of respondents was 33.58, minimum age of a respondent was 20 years while the oldest bank worker in the study was 59 years old. Majority of the respondents in the study belonged to the age group 30-39 consisting of 144 (42.2%) respondents. Gender distribution of the respondents showed that majority of the respondents were male (n = 289) representing 84.8 % of the sample, while females were (n = 52) constituting 15.2% of the total sample. Subjects were also asked to identify their job rank. Majority of the respondents were middle ranked (206) representing 60.4% of the total sample, followed by junior rank employees, which were 91 (26.4%). A total of 45 (13.2%) senior level employees were part of the study. Banking system in Pakistan is either conventional or Islamic.
C 2016 CURJ, CUSIT
Table Questionnaires Response Details
Khawaja Fawad Latif et al.

331
Data was collected from both Islamic and conventional banks. 266 (78%) of the respondents were from conventional banks while 75 (22%) of the respondents were employed at Islamic banks.
Factor Analysis
Factor analysis was performed to identify the underlying factors. Before factor analysis it is important to check if the data meets the required assumptions. To check sample adequacy, Kaiser-Meyer-Olkin (KMO) measure of sampling adequacy was used. The data are judged to be factorable if the KMO measure of sampling adequacy is greater than .60 (Huck, 2012). The results for KMO measure of sampling adequacy revealed values for all constructs close to 1, indicating that the sampling condition was satisfied for the analysis.
To evaluate multicollinearity the determinant statistics was examined. Field (2005) suggests that determinant of R-matrix should be greater than .00001. In case the value of determinant is less than the prescribed value, variables that correlate highly shall be eliminated (r > .8). Inter-variable correlation and determinant statistic for each construct was examined. Items depicting multicollinearity were deleted from further analysis. Summary of items removed due to multicollinearity is summarized in table 2. Bartlett's test of sphericity was utilized to examine if the correlation matrix fit's an identity matrix. A significant Bartlett test indicates that correlation matrix is significantly different from an identity matrix. For factor analysis in the present study principal component analysis with varimax rotation is used. The most commonly used approach for factor analysis is principal components analysis (Pallant, 2011; Huck, 2011). The most popular rotation method used is varimax rotation (Huck, 2012). The minimum factor loading criteria was set 0.50 which is considered higher (Leech, Barrett, & Morgan, 2005).
C 2016 CURJ, CUSIT
Table 1. Demographics Prole of Respondents
Table 2. Multicollinearity Analysis
An Empirical Investigation into the Role...
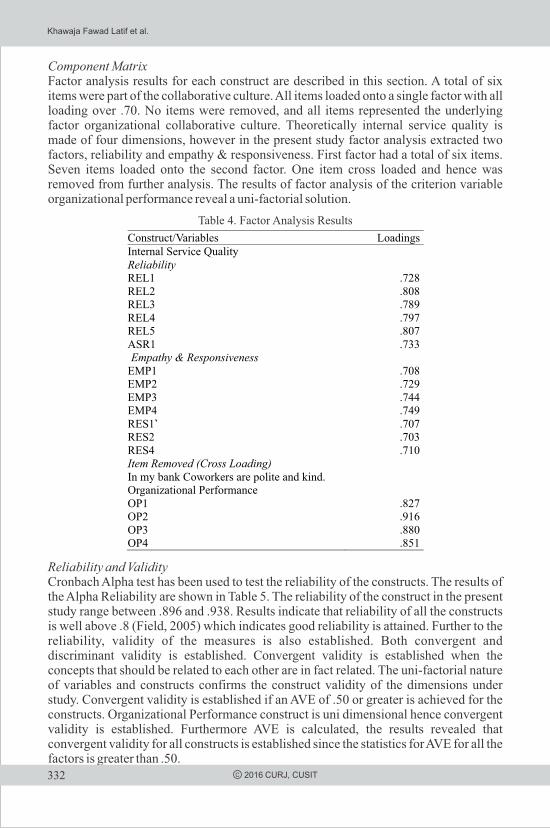
Component MatrixFactor analysis results for each construct are described in this section. A total of six items were part of the collaborative culture. All items loaded onto a single factor with all loading over .70. No items were removed, and all items represented the underlying factor organizational collaborative culture. Theoretically internal service quality is made of four dimensions, however in the present study factor analysis extracted two factors, reliability and empathy & responsiveness. First factor had a total of six items. Seven items loaded onto the second factor. One item cross loaded and hence was removed from further analysis. The results of factor analysis of the criterion variable organizational performance reveal a uni-factorial solution.
Reliability and ValidityCronbach Alpha test has been used to test the reliability of the constructs. The results of the Alpha Reliability are shown in Table 5. The reliability of the construct in the present study range between .896 and .938. Results indicate that reliability of all the constructs is well above .8 (Field, 2005) which indicates good reliability is attained. Further to the reliability, validity of the measures is also established. Both convergent and discriminant validity is established. Convergent validity is established when the concepts that should be related to each other are in fact related. The uni-factorial nature of variables and constructs confirms the construct validity of the dimensions under study. Convergent validity is established if an AVE of .50 or greater is achieved for the constructs. Organizational Performance construct is uni dimensional hence convergent validity is established. Furthermore AVE is calculated, the results revealed that convergent validity for all constructs is established since the statistics for AVE for all the factors is greater than .50.332 C 2016 CURJ, CUSIT
Table 4. Factor Analysis Results
Khawaja Fawad Latif et al.

Discriminant validity determines the extent to which sufficiently distinct constructs are not strongly correlated with each other. Discriminant validity is established if square root of AVE for each construct is greater than inter-correlations of other constructs. Table 6 compares AVE square roots and inter-construct correlations.
Evaluations of Measurement ModelsThe present study involves a total of eight different constructs. This section tests subjects each of the construct to confirmatory factor analysis (CFA) to test if the data fits the measurement and structural model.
Internal Service QualityExploratory factor analysis revealed two factors for ISQ namely reliability and Empathy and Responsiveness. Only one item was removed since it failed to load substantially. Final ISQ construct had a total of 12 items. The initial and final attained factor structure is shown in figure. The loadings and indices for initial and final attained model are shown in table
333C 2016 CURJ, CUSIT
Table 5. Reliability analysis of the constructs
Table 6. Square root of AVE and Inter-Construct Correlations
Table . Summary of initial and attained ndings: Internal Service Quality
An Empirical Investigation into the Role...

One item (EMP2) that measures if the bank has convenient working hours were removed from the analysis. On deletion of EMP2, the resultant model manifested significant enrichment to the overall fit of the model as shown in the attained fit indices. It was not a problem for the six item factor to attain content and face validity. Finally the composite reliability score for reliability is .91 and empathy & responsiveness was found to be .91 which is deemed to be reliable for the measurement of reliability and empathy & responsiveness. ASR1 for further analysis is referred to as REL6.
Organizational PerformanceOriginally organizational performance construct had a total of five items. One item was removed due to multicollinearity. The four items left were subjected to CFA. The results showed all items load substantially well onto the construct. The fit indices are indicate an adequate fit for the construct since RMSEA is a little higher. The initial and final loadings are compared in table 5.54. The model is shown in figure.
Hypotheses TestingFurther to the evaluation of the measurement model for each construct, Structural equation model was tested. Three different structural models are proposed. First seeks to investigate the influence of ISQ on Organizational Performance while the second model seeks to evaluate the influence of ISQ objective measures of organizational performance.
Structural Model A: ISQ and organizational performanceStructural model A evaluates the relationship between ISQ and organizational performance. The initial model revealed acceptable fit indices for SRMR, CFI and TLI, however RMSEA showing mediocre fit. The modification indices and standardized residual covariances were analyzed. One item, RES1 was removed and covariances were drawn between items of the similar latent construct. The final attained model showed acceptable fit indices. Table 5.62 shows the comparison between initial and final model.
334 C 2016 CURJ, CUSIT
Table . Summary of initial and attained ndings: Organizational Performance
Khawaja Fawad Latif et al.
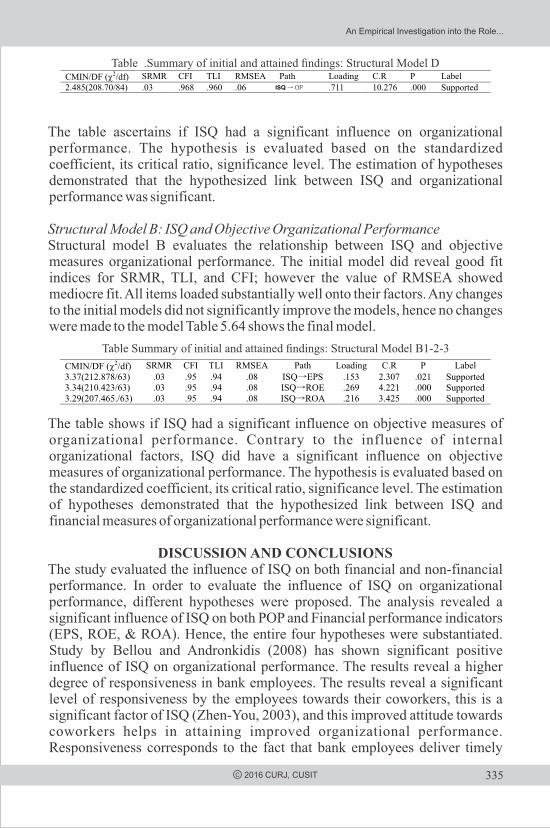
The table ascertains if ISQ had a significant influence on organizational performance. The hypothesis is evaluated based on the standardized coefficient, its critical ratio, significance level. The estimation of hypotheses demonstrated that the hypothesized link between ISQ and organizational performance was significant.
Structural Model B: ISQ and Objective Organizational PerformanceStructural model B evaluates the relationship between ISQ and objective measures organizational performance. The initial model did reveal good fit indices for SRMR, TLI, and CFI; however the value of RMSEA showed mediocre fit. All items loaded substantially well onto their factors. Any changes to the initial models did not significantly improve the models, hence no changes were made to the model Table 5.64 shows the final model.
The table shows if ISQ had a significant influence on objective measures of organizational performance. Contrary to the influence of internal organizational factors, ISQ did have a significant influence on objective measures of organizational performance. The hypothesis is evaluated based on the standardized coefficient, its critical ratio, significance level. The estimation of hypotheses demonstrated that the hypothesized link between ISQ and financial measures of organizational performance were significant.
DISCUSSION AND CONCLUSIONSThe study evaluated the influence of ISQ on both financial and non-financial performance. In order to evaluate the influence of ISQ on organizational performance, different hypotheses were proposed. The analysis revealed a significant influence of ISQ on both POP and Financial performance indicators (EPS, ROE, & ROA). Hence, the entire four hypotheses were substantiated. Study by Bellou and Andronkidis (2008) has shown significant positive influence of ISQ on organizational performance. The results reveal a higher degree of responsiveness in bank employees. The results reveal a significant level of responsiveness by the employees towards their coworkers, this is a significant factor of ISQ (Zhen-You, 2003), and this improved attitude towards coworkers helps in attaining improved organizational performance. Responsiveness corresponds to the fact that bank employees deliver timely
335C 2016 CURJ, CUSIT
Table .Summary of initial and attained ndings: Structural Model D
Table Summary of initial and attained ndings: Structural Model B1-2-3
An Empirical Investigation into the Role...
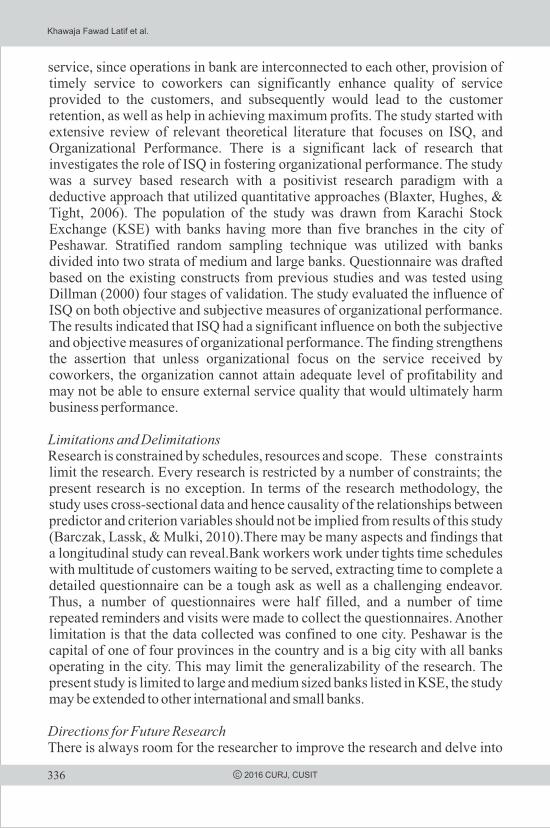
336 C 2016 CURJ, CUSIT
service, since operations in bank are interconnected to each other, provision of timely service to coworkers can significantly enhance quality of service provided to the customers, and subsequently would lead to the customer retention, as well as help in achieving maximum profits. The study started with extensive review of relevant theoretical literature that focuses on ISQ, and Organizational Performance. There is a significant lack of research that investigates the role of ISQ in fostering organizational performance. The study was a survey based research with a positivist research paradigm with a deductive approach that utilized quantitative approaches (Blaxter, Hughes, & Tight, 2006). The population of the study was drawn from Karachi Stock Exchange (KSE) with banks having more than five branches in the city of Peshawar. Stratified random sampling technique was utilized with banks divided into two strata of medium and large banks. Questionnaire was drafted based on the existing constructs from previous studies and was tested using Dillman (2000) four stages of validation. The study evaluated the influence of ISQ on both objective and subjective measures of organizational performance. The results indicated that ISQ had a significant influence on both the subjective and objective measures of organizational performance. The finding strengthens the assertion that unless organizational focus on the service received by coworkers, the organization cannot attain adequate level of profitability and may not be able to ensure external service quality that would ultimately harm business performance.
Limitations and DelimitationsResearch is constrained by schedules, resources and scope. These constraints limit the research. Every research is restricted by a number of constraints; the present research is no exception. In terms of the research methodology, the study uses cross-sectional data and hence causality of the relationships between predictor and criterion variables should not be implied from results of this study (Barczak, Lassk, & Mulki, 2010).There may be many aspects and findings that a longitudinal study can reveal.Bank workers work under tights time schedules with multitude of customers waiting to be served, extracting time to complete a detailed questionnaire can be a tough ask as well as a challenging endeavor. Thus, a number of questionnaires were half filled, and a number of time repeated reminders and visits were made to collect the questionnaires. Another limitation is that the data collected was confined to one city. Peshawar is the capital of one of four provinces in the country and is a big city with all banks operating in the city. This may limit the generalizability of the research. The present study is limited to large and medium sized banks listed in KSE, the study may be extended to other international and small banks.
Directions for Future ResearchThere is always room for the researcher to improve the research and delve into
Khawaja Fawad Latif et al.

337C 2016 CURJ, CUSIT
new directions. The future research may consider more than one city for data collection with the inclusion of small and other international banks operating in the country.The present study addresses an area that has significant implications for banking services theory and practice. Continued refinement of the scale for measuring internal service quality in retail banking, proposed in this study, is certainly possible based on further research and trends in retail banking. The current study evaluates the direct influence of internal service quality on organizational performance, future research may include other factors in the Heskett (1994) service profit chain.
REFERENCESAbdalkrim, G.M. (2013). The impact of strategic planning activities on private sector organizations performance in Sudan: an empirical research. International Journal of Business and Management, 8(10), 134-143.
Akdemir, B., Erdem, O., & Polat, S. (2010). Characteristics of high performance organizations”, Suleyman Demirel University Journal of Faculty of Economics & Administrative Sciences, 15(1), 155-174.
Al-Marri, K., Ahmed, A., & Zairi, M (2007). Excellence in service: An empirical study of the UAE banking sector. International Journal of Quality & Reliability Management,24(2), 164-176.
Anderson, E. W., Fornell, C., & Lethman, D. R. (1994). Customer satisfaction, market share, and profitability. Journal of Marketing, 58(7), 53-66.
Anosike, U. P., & Eid, R. (2011). Integrating internal customer orientation, internal service quality, and customer orientation in the banking sector: An empirical study. The Service Industries Journal, 31(14), 2487-2505.
Bani-Hani, J.S., Al-Ahmad, N.M.,& Alnajjar, F.J. (2009). The impact of management information systems on organizations performance: field study at Jordanian universities. Review of Business Research, 9, 127- 137.
Barczak, G., Lassk, F., & Mulki, J. (2010). Antecedents of team creativity: An examination of team emotional intelligence, team trust and collaborative culture. Creativity and Innovation Management, 19(4), 332-345.
Baron, R. M., & Kenny, D. A. (1986). The moderator–mediator variable distinction in social psychological research: Conceptual, strategic, and
An Empirical Investigation into the Role...

338 C 2016 CURJ, CUSIT
statistical considerations. Journal of personality and social psychology, 51(6), 1173.
Bellou, V., & Andronikidis, A. (2008). The impact of internal service quality on customer service behaviour: Evidence from the banking sector. International Journal of Quality & Reliability Management, 25(9), 943-954.
Berry, L. (1981). The Employee as Customer. Journal-of-Retail-Banking. 3(1), 33-40
Berry, L. L., Hensel, J. S., & Burke, M. C. (1976). Improving retailer capability for effective consumerism response. Journal of Retailing, 52(3), 3-14.
Blaxter, L., Hughes, C & Tight, M. (2006). How to research (3rd ed.). Poland: Open University Press.
Boshoff, C., & Mels, G. (1995). A causal model to evaluate the relationships among supervision, role stress, organizational commitment and internal service quality. European Journal of Marketing, 29(2), 23-42.
Bouranta, N., Chitiris, L., & Paravantis, J. (2009). The relationship between internal and external service quality. International Journal of Contemporary Hospitality Management, 21(3), 275-293.
Brandon-Jones, A., & Silvestro, R. (2010). Measuring internal service quality: Comparing the gap-based and perceptions-only approaches. International Journal of Operations & Production Management, 30(12), 1291-1318.
Brooks, R. F., Lings, I. N., & Botschen, M. A. (1999). Internal marketing and customer driven wavefronts. Service Industries Journal, 19(4), 49-67.
Choudhary, A.I., Akhtar, S.A. & Zaheer, A. (2013). Impact of transformational and servant leadership on organizational performance: a comparative analysis”, Journal of Business Ethics, 116(8), 433-440.
Christensen, E., Coombes-Betz, K., & Stein, M. (2007). The certified quality process analyst handbook. Wisconin, USA: American Society for Quality.
Cook, S. (2004). Measuring customer service effectiveness. Hants, England: Gower.
Khawaja Fawad Latif et al.
339C 2016 CURJ, CUSIT
Cook, S. (2008). The essential guide to employee engagement: Better business performance through staff satisfaction. London: Kogan Page.
De Waal, A.A. (2012), “Does quality matter in a high-performance organization?”, Journal for Quality and Participation, Vol. 35 No. 3, pp. 4-8.
Deming, W. (1982), Quality and Productivity and Competitive Position, MIT Center for Advanced Engineering Study, Cambridge, MA.
Deming, W. (1986),Out of the Crisis, MIT Center for Advanced Engineering Study, Cambridge, MA.
Dinitzen, H., & Bohlbro, D. (2010). Value-added logistics in supply chain management. Copehagen, Denmark: Academica.
Field, A. (2005). Discovering statistics with SPSS.
Frost, F., & Kumar, M. (2000). INTSERVQUAL - an internal adaptation of the GAP model in a large service organisation. Journal of Services Marketing, 14(5), 358-377.
Frost, F., & Kumar, M. (2001). Service quality between internal customers and internal suppliers in an international airline. International Journal of Quality & Reliability Management, 18(4), 371-386.
Getty, J. M., & Getty, R. L. (2000). Service quality starts with employees. Paper presented at the Human Factors and Ergonomics Society Annual Meeting.
Hamdam, H., Pakdel, A., & Soheili, S. (2012). The study of board's remuneration and its relationship with accounting indicators for firm's performance evaluation (evidence from Tehran Stock Exchange). Australian Journal of Basic & Applied Sciences, 6(10).
Hamon, T. T. (2003). Organizational effectiveness as explained by social structure in a faith-based business network organization”, unpublished doctoral dissertation, Regent University, Virginia Beach, VA.
Hancott, D. E. (2005). The relationship between transformational leadership and organizational performance in the largest public companies in Canada (Doctoral dissertation, Capella University).
An Empirical Investigation into the Role...

340 C 2016 CURJ, CUSIT
Hawke, A., & Heffernan, T. W. (2006). Interpersonal liking in lender-customer relationships in the Australian banking sector. International Journal of Bank Marketing, 24 (3), 140-57.
Hays, R. (1996). The strategic power of internal service excellence. Business Horizons, July-August, 15-20.
Hernon, P., & Whitman, J. (2001). Delivering satisfaction and service Quality: A customer-based approach for libraries. Chicago, USA: ALA Editions.
Heskett, J., Jones, T., Loveman, G., Sasser, W., & Schlesinger, L. (1994). Putting the service-profit chain to work. Harvard Business Review, March-April.
Homburg, C., & Pflesser, C. (2000). A multiple-layer model of market-oriented organisational culture: Measurement issues and performance outcomes. Journal of Marketing Research, 37(4), 449-462.
Jun, M., & Cai, S. (2010). Examining the relationships between internal service quality and its dimensions, and internal customer satisfaction. Total Quality Management & Business Excellence, 21(2), 205-223.
Juran, J. (1993). Made in USA: A renaissance in quality. Harvard Business Review, July-August, 42-50.
Juran, J. M (1988). Juran's Quality Control Handbook. New York, NY: McGrew-Hill.
Kang, G. D., Jame, J., & Alexandris, K. (2002). Measurement of internal service quality: application of the SERVQUAL battery to internal service quality. Managing service quality, 12(5), 278-291.
Kerlinger, F.N., & Lee, H. B. (2000). Foundations of behavioral research (4th ed.). Wadsworth.
Kuo, T. H. (2011). How to improve organizational performance through learning and knowledge?. International Journal of Manpower, 32(5/6), 581-603.
Lings, I., & Brooks, R. (1998). Implementing and measuring the effectiveness of internal marketing. Journal of Marketing Management, 14, 325- 351.
Khawaja Fawad Latif et al.

341C 2016 CURJ, CUSIT
Little, E., & Marandi, E. (2003). Relationship marketing management. London: Thomson Learning.
Longenecker, C., & Scazzero, J. (2000). Improving service quality: a tale of two operations. Managing Service Quality, 10(4), 227-232.
Madill, J. J., Feeney, L., Riding, A., & Haines, G. H. Jr. (2002). Determinants of SME owners' satisfaction with their banking relationships: A Canadian study. The International Journal of Bank Marketing, 20(2), 86-98.
Marshall, G. W., Baker, J., & Finn, D. W. (1998). Exploring internal customer service quality. Journal of Business and Industrial Marketing, 13(4/5), 391-392.
McCracken, M. J., McIlwain, T. F., & Fottler, M. D. (2001). Measuring organizational performance in the hospital industry: An exploratory comparison of objective and subjective methods. Health Services Management Research, 14(4), 211-219.
Mishkin, F. S. (2001). The economics of money, banking and financial markets (6th ed.).Reading, MA: Addison-Wesley.
Mukherjee, A., Nath, P., & Pal, M. (2003). Resource, service quality and performance triad: A framework for measuring efficiency of banking services. The Journal of the Operational Research Society, 54(7), 723- 735.
Nzuve, S.N.,& Omolo, E.A. (2012). A study of the practice of the learning organization and its relationship to performance among Kenyan commercial banks. Problems of Management in the 21st Century, 4(2), 45-56.
Ouakouak, M. L., Ouedraogo, N., & Mbengue, A. (2013). The mediating role of organizational capabilities in the relationship between middle managers' involvement and firm performance: A European study. European Management Journal, 32(2), 305-318.
Papasolomou, I., & Vrontis, D. (2006). Building corporate branding through internal marketing: The case of the UK retail banking industry. Journal of Product & Brand Management,15(1), 37-47.
Parasuraman, A. (2002). Service quality and productivity: A synergistic perspective. Managing Service Quality, 12(1), 6-9.
An Empirical Investigation into the Role...

342 C 2016 CURJ, CUSIT
Parasuraman, A., Zeithaml, V. A., & Berry, L. L. (1985). A conceptual model of service quality and its implications for future research. The Journal of Marketing, 41-50.
Parasuraman, A., Zeithaml, V. A., & Berry, L. L. (1988). Servqual. Journal of retailing, 64(1), 12-40.
Prakash, A., & Mohanty, R. (2012). Understanding service quality. Production Planning and Control, 1-16.
Reynoso, J., & Moores, B. (1995). Towards the measurement of internal service quality. International Journal of Service Industry Management, 6(3), 64-83.
Richard, P. J., Devinney, T. M., Yip, G. S., & Johnson, G. (2009). Measuring organizational performance: Towards methodological best practice. Journal of Management, 35(3), 718-804.
Roscoe, J. T. (1975). Fundamental research statistics for the behavioral sciences (pp. 199-200). New York: Holt, Rinehart and Winston.
Singh, K. (2004). Impact of HR practices on perceived firm performance in India'. Asiapacific Journal of Human Resources,42(3) 301-317.
Smith, K. G., Smith, K. A., Olian, J. D., Sims Jr, H. P., O'Bannon, D. P., & Scully, J. A. (1994). Top management team demography and process: The role of social integration and communication. Administrative science quarterly, 412-438.
Sobhy, N., & Megeid, A. (2013). The impact of service quality on financial performance and corporate social responsibility: Conventional versus Islamic banks in Egypt. International Journal of Finance and Accounting, 2(3), 150-163.
Stanley, L., & Wisner, J. (2001). Service quality along the supply chain: Implicatiosn for purchaing. Journal of Operations Management, 19, 287-306.
Stauss, B. (1995). Internal services: Classification and quality management. International Journal of Service Industry Management, 6(2), 62-78.
Suganthi, L., & Samuel, A. (2004). Total quality management. New Delhi: Prentice Hall.
Khawaja Fawad Latif et al.

343C 2016 CURJ, CUSIT
Taap, M. A., Chong, S. C., Kumar, M., Fong, T. K. (2011). Measuring service quality of conventional and Islamic banks: A comparative analysis, International Journal of Quality & Reliability Management, 28(8), 822-840.
Tippins, M. J., & Sohi, R.S. (2003). It competency and rm performance: Is organizational learning a missing link. Strategic Management Journal, 24, 745-61.
Tseng, S. M. (2010). The correlation between organizational culture and knowledge conversion on corporate performance. Journal of Knowledge Management, 14(2), 269-284.
Vanniarajan, T., & Babu, S. (2011). Internal service quality and its consquences in commercial banks: A HR perspective. Global Management Review, 6(1), 42-57.
Wang, I.-M., & Shieh, C.-J. (2006). The relationship between service quality and customer satisfaction: The example of CJCU library. Journal of Information and Optimization Sciences, 27(1), 193-209.
Wheelen, T.L. and Hunger, J.D. (2010), Strategic Management and Business Policy, Pearson, Upper Saddle River.
Young, J. A., & Varble, D. L. (1997). Purchasing's performance as seen by its internal customers: a study in a service organization. International Journal of Purchasing and Materials Management, 33(2), 36-41.
Zailani, S., Din, S. H., & Wahid, N. A. (2006). The effects of internal measures of service quality on business performance: A case of hotel industry in Malaysia. Paper presented at the 6th Annual Hawaii International Conference on Business, Hawaii.
Zeithaml, V. A., Berry L. L. & Parasuraman, A. (1990). Delivering quality service-balancing customer perceptions and expectations. New York: The Free Press.
Zeithaml, V., Bitner, M., & Gremler, D. (2006). Services marketing: Integrating customer focus across the firm. New York: McGraw-Hill Irwin.
Zhen-You, C. (2003). How leadership styles, motives of achievement and their fitness affect the quality of internal services: Taking the example of marketing & promotional staff at Taiwanese record labels. Graduate Institute of Communication Management, Ming Chuan University.
An Empirical Investigation into the Role...
344
DOES SIZE MATTER IN DETERMINING FIRMS' PERFORMANCE? A COMPARATIVE ANALYSIS OF LISTED
COMPANIESSaid Shah*, Safdar Husain Tahir**, Jamil Anwar***, and Manzoor Ahmad****
ABSTRACT
Depending upon the size, different firms possess different capabilities of utilizing their short term resources, adopt different working capital policies and follow different corporate governance practices resulting variations in their financial performances. Proper investigation into the level of production therefore justifies a lot of attention. This study examines the impact of firms' size on their financial performances using ratio and regression analyses. Results show that size has a crucial role in determining firms' performance whereas it has no significant impact on working capital management efficiency; small firms follow aggressive working capital policy whereas large firms follow conservative working capital policy and that firms' size negatively affects quality of corporate governance. It is further found that working capital and corporate governance practices of small firms are better than those of large firms and that the performance of large firms is better than small and medium firms primarily because of their (large firms) size.
Keywords: Corporate Governance, Firms' Performance, Large Firms, Size, Working Capital Policy
INTRODUCTION
On one hand, firms welcome the benefits brought about by economies of scale and on the other hand an increase in a firm's size exposes it to higher agency costs which are expected to further increase in extensively held companies because of agency conflicts and differences in interests among contracting parties (Jensen and Meckling 1976). Thus size holds considerable for firms as there is always a tradeoff between scale economies and agency problems. Furthermore, organizational size also influences a firm's performance as smaller firms are more likely to benefit from the spirit of corporate entrepreneurship for growth while larger firms use their financial and market power to enhance their productivity and profitability. There are many ways; the size of a firm affects its performance. The characteristics like diverse capabilities, the ability to make use of scale economies and formalization of procedures make a larger firm superior than smaller firms in terms of financial performance (Penrose 1959).
Pakistani corporate sector is a diversified composition of small, medium and large firms. Large firms enjoy a substantial edge over small and medium firms in terms of financial performance due to their sound resource base, economy of production costs, better quality of product due to division of labor and research and development. But at the same time, these large scale organizations are also facing some problems as
City University Research JournalVolume 06 Number 02 July 2016 PP 344-353
*Assistant Professor, University of Swabi, KPK** Assistant Professor, Government College University, Faisalabad*** Assistant Professor, COMSATS Institute of Information Technology, Abbottabad****Lecturer, University of Swabi, KPK
C 2016 CURJ, CUSIT
345
compared to small firms such as loopholes in supervision, agency problem and lesser adaptability (conversion from one type of production to another type of production). Similarly, small firms enjoy some benefits over large firms such as close supervision, low requirement of capital to commence business and close relation with their customers hence can produce goods according to the taste and fashion of each individual customer. However, at the same time, these firms face problems like high cost of production per unit, difficulty in getting loans, lack of research and use of old techniques and obsolete machines.There are many reasons why firm size is a key determinant of its financial performance. Firstly; a firm's size itself is an important indicator of its financial performance. Assuming balance sheet's size as a proxy of firms' size, an increase in it indicates growth in earnings. For instance Rajan and Zingales (1998) found that two-thirds of the growth in industries over the 1980s comes from the growth in the size of existing establishments, and only the remaining one-third from the creation of new ones. Secondly; selecting a firm's size will answer certain questions from the owner(s) such as how much funds are available to establish a business concern? What is the quality and quantity of available human capital? What is the accessibility of raw material and what is the capability of the firm to obtain that? Which working capital (WC) policy to use? What type of capital structure is going to adopt and so on; and thirdly; number of firms having the same size will provide a driving force for a country's regulatory and institutional system. For example if there are more large firms operating in a country, Securities and Exchange authorities will be more active and vice versa. Selecting and implementation of corporate policies including WC management practices, capital structure, dividend policy and corporate governance (CG) practices centered around firms' size. Diversified sizes of firms lead to diversification in these corporate policies and ultimately to variations in financial performance. The purpose of this study is to determine whether firms' size bring some changes in their financial performance or not? Once a company (small, medium or large) is able to create a harmony between its size and WC/CG practices, it will be able to reap the benefits at the operational levels with visible impact on the bottom line and share price. The results of the study, if implemented by all sizes of firms across the globe, will have far reaching effects on their respective national economies.
LITERATURE REVIEW
There is no consensus in the literature about how to measure firm size (Dalbor et al, 2004). Previous studies show many bases for determining the size of firm. Vithessonthi and Tongurai (2015) used median of total assets as proxy of firms' size and found that the magnitude of the leverage effect on operating performance is non-monotonic rather it is linked with firm size as such it is positive in small firms and negative in large firms. Nason et al (2015), provided greater identity to the literature on corporate entrepreneurship incorporating the role of organizational size and suggested that small firms are more likely to utilize corporate entrepreneurship for growth to overcome liabilities of smallness, while large firms are more likely to utilize corporate entrepreneurship for learning to overcome liabilities of inactivity. Examining size-wise corporate bankruptcy and using number of employees as firms' size, Mueller and
C 2016 CURJ, CUSIT
Does Size Matter in Determining Firms'...
346
Stegmaier (2015) concluded that approximately 83 % of all bankruptcies occur in plants with not more than 10 employees, 61 % of all bankrupt plants are not older than 5 years and substantial negative age dependence with respect to bankruptcy risk but confirm negative size dependence for mature plants only.
Al-Mwalla (2012) calculated firm size using natural log of sales and found that profitability of a firm is positively related with its size. Using natural log of assets as a measure of firm size, Hansen & Wernerfelt (1989) found positive relationship between firm's size and its performance. Dalbor et al (2004) used total assets, total sales, number of owners, and number of employees as proxies of firms' size however found number of owners and total assets as the most influential variables with maximum explanatory power. On the basis of number of owners and total assets, they examined the impact of size on use of debt by restaurant firms and found that owners often use debt as a mechanism to minimize agency costs in large firms. Using data of non-financial firms, covering a period from 1987 to 2000 for market oriented economies (such as United Kingdom and the United States) and bank oriented economies (like France, Germany and Japan) and measuring firms' size on the basis of total sales,
Using number of employees as firms' size, Du & Girma (2009) found that financing source influences growth more in small firms as compared to large firms and that internally generated funds are more effective for promoting small firms whereas external finance is effective for large firms. Fama and French (1992) calculated firms' size (portfolio size) on the basis of market equity and found that size and book-to-market equity explain the cross-sectional variation in average stock returns related to size, earning/price ratio, book-to-market equity and leverage. Mirza and Shahid, (2008) sorted six portfolios, determining their size on the basis of market capitalization (MC) as price times number of shares for five years (2003-2007), using median of the sample to split the stocks into small, medium and large and got findings in support of the Fama and French three factor-approach.
Driver (2006) used number of employees as proxy of firm's size and found similarities in all the sizes except medium size to have been unusually affected by real interest rates and that medium and large firms invest less as compared to small firms. Majumdar (1997) investigated the impact of size (measured by natural log of sales) and age of firms on their productivity and profitability using 1,020 Indian firms and found that larger firms are more profitable and less productive. Penrose, (1959), found that the performance of large firms is superior than small firms. On the basis of regression analysis, and using natural log of sales as proxy of firms' size, Padachi (2006) found that with the growth in size of a firm, its agency problem increases leading to inefficient management of WC. The studies on the firms' size referred are in agreement on a positive relationship between firms' size and profitability. The study tests the following hypotheses:
Hypothesis 1: Size of the firm is positively related with profitability
Hypothesis 2: WC policies of small firms are better than those of large firms
METHODOLOGY
The study measures firms' performance using ROA and investigates the impact of all independent variables namely MC, CCC, CR, ATR, CAR and CGI on firms'
C 2016 CURJ, CUSIT
Said Shah et al.
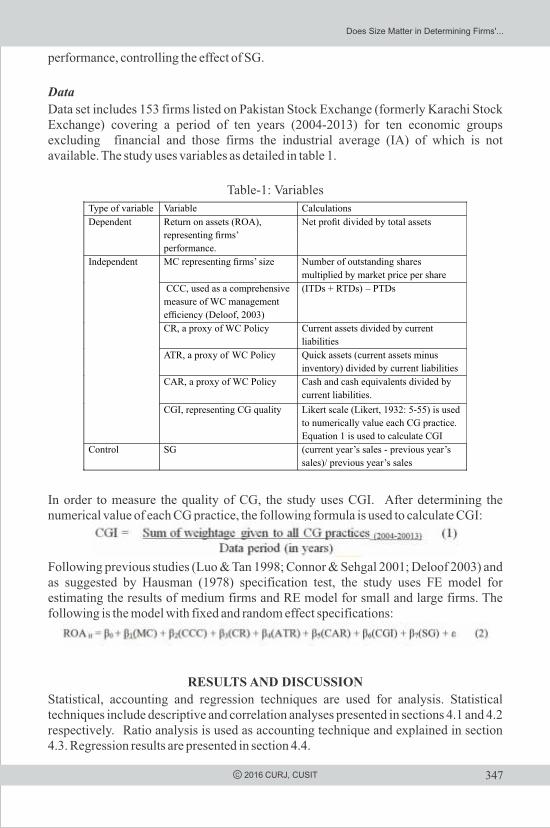
347
performance, controlling the effect of SG.
Data
Data set includes 153 firms listed on Pakistan Stock Exchange (formerly Karachi Stock Exchange) covering a period of ten years (2004-2013) for ten economic groups excluding financial and those firms the industrial average (IA) of which is not available. The study uses variables as detailed in table 1.
Table-1: Variables
In order to measure the quality of CG, the study uses CGI. After determining the numerical value of each CG practice, the following formula is used to calculate CGI:
Following previous studies (Luo & Tan 1998; Connor & Sehgal 2001; Deloof 2003) and as suggested by Hausman (1978) specification test, the study uses FE model for estimating the results of medium firms and RE model for small and large firms. The following is the model with fixed and random effect specifications:
RESULTS AND DISCUSSION
Statistical, accounting and regression techniques are used for analysis. Statistical techniques include descriptive and correlation analyses presented in sections 4.1 and 4.2 respectively. Ratio analysis is used as accounting technique and explained in section 4.3. Regression results are presented in section 4.4.
C 2016 CURJ, CUSIT
Type of variable Variable Calculations
Dependent Return on assets (ROA),
representing rms’
performance.
Net prot divided by total assets
Independent MC representing rms’ size
Number of outstanding shares
multiplied by market price per share
CCC, used as a comprehensive
measure of WC management
efciency (Deloof, 2003)
(ITDs + RTDs) –
PTDs
CR, a proxy of WC Policy
Current assets divided by current
liabilities ATR, a proxy of WC Policy
Quick assets (current assets minus
inventory) divided by current liabilities
CAR, a proxy of WC Policy
Cash and cash equivalents divided by
current liabilities.
CGI, representing CG quality
Likert scale (Likert, 1932: 5-55) is used
to numerically value each CG practice.
Equation 1 is used to calculate CGI
Control SG (current year’s sales - previous year’s
sales)/ previous year’s sales
Does Size Matter in Determining Firms'...

348 C 2016 CURJ, CUSIT
Descriptive Analysis:
Size-wise descriptive statistics are presented in table 2. Comparing means and SDs of ROA, financial performance of large firms is better, stable and consistent as compared to small and medium firms. Based on the gap between means and SDs, WC management efficiencies of all firms are volatile. However on the basis of CCC size, larger firms are more efficient in managing their WC (mean CCC of 31.65 days) as compared to small firms (51.35 days) and medium firms (50.75 days). Means of WC Policy variables ranges from 0.16 to 1.70 whereas SDs varies from 0.47 to 1.28 indicating stability and reliability among firms in terms of WC policies adopted.
Table-2: Size-Wise Descriptive Statistics
CORRELATION ANALYSIS
Size-wise correlations among dependent, independent and control variables indicate a very weak and insignificant but positive relationship between MC and ROA showing less important role of size in determining firms' performance. CCC has a weak positive and insignificant relationship with ROA in small and large firms but strong and positive relationship significant at 1% in medium firms. The significant and positive relationship of CCC with firms' performance indicates that longer the length of CCC, the lower would be the percentage of long term funds used for financing current assets. CR, ATR and CAR representing WC Policy are positively correlated with firms' performance significant at 1% in medium and large firms. CGI has a weak positive and insignificant
Variable Size Mean Standard Error Median Standard Deviation
RoASmall 2.76 0.76 1.43 16.39Medium 7.43 0.50 6.17 12.39Large 16.91 0.73 13.82 15.70
MCSmall 46.54 16.85 0.00 361.07Medium
23.87
3.75
3.55
92.62Large
31.01
5.82
11.50
124.85
CCCSmall
51.35
8.93
64.91
191.54Medium
50.75
5.93
65.97
146.56Large
31.65
4.98
17.65
106.91
CRSmall
1.13
0.05
0.95
1.00
Medium
1.48
0.05
1.08
1.28
Large
1.70
0.06
1.31
1.19
ATRSmall 0.61 0.04 0.41 0.88Medium
0.86
0.04
0.54
0.95Large
1.22
0.05
0.96
1.10
CAR Small
0.16
0.04
0.02
0.92
Medium
0.25
0.03
0.04
0.87Large
0.33
0.02
0.14
0.47CGI Small
2.27
0.02
2.17
0.39
Medium
2.27
0.02
2.17
0.46
Large 2.44 0.02 2.33 0.47
SGSmall 0.24 0.04 0.13 0.85Medium 0.20 0.03 0.14 0.77Large 0.20 0.03 0.16 0.54
Said Shah et al.
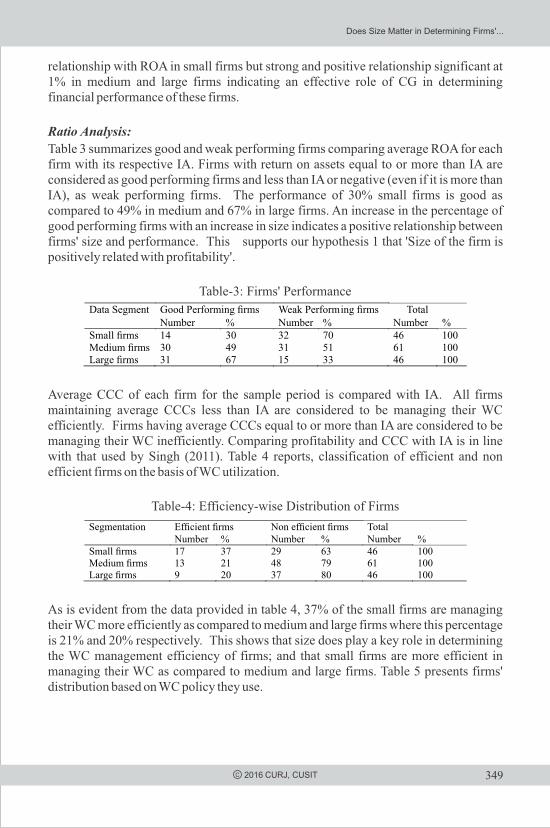
349C 2016 CURJ, CUSIT
relationship with ROA in small firms but strong and positive relationship significant at 1% in medium and large firms indicating an effective role of CG in determining financial performance of these firms.
Ratio Analysis:
Table 3 summarizes good and weak performing firms comparing average ROA for each firm with its respective IA. Firms with return on assets equal to or more than IA are considered as good performing firms and less than IA or negative (even if it is more than IA), as weak performing firms. The performance of 30% small firms is good as compared to 49% in medium and 67% in large firms. An increase in the percentage of good performing firms with an increase in size indicates a positive relationship between firms' size and performance. This supports our hypothesis 1 that 'Size of the firm is positively related with profitability'.
Table-3: Firms' Performance
Average CCC of each firm for the sample period is compared with IA. All firms maintaining average CCCs less than IA are considered to be managing their WC efficiently. Firms having average CCCs equal to or more than IA are considered to be managing their WC inefficiently. Comparing profitability and CCC with IA is in line with that used by Singh (2011). Table 4 reports, classification of efficient and non efficient firms on the basis of WC utilization.
Table-4: Efficiency-wise Distribution of Firms
As is evident from the data provided in table 4, 37% of the small firms are managing their WC more efficiently as compared to medium and large firms where this percentage is 21% and 20% respectively. This shows that size does play a key role in determining the WC management efficiency of firms; and that small firms are more efficient in managing their WC as compared to medium and large firms. Table 5 presents firms' distribution based on WC policy they use.
Data Segment Good Performing rms Weak Performing rms TotalNumber
%
Number
%
Number %
Small rms 14 30 32 70 46 100Medium rms 30 49 31 51 61 100Large rms 31 67 15 33 46 100
Segmentation Efcient rms Non efcient rms TotalNumber
%
Number
%
Number %
Small rms 17 37 29 63 46 100Medium rms 13 21 48 79 61 100Large rms 9 20 37 80 46 100
Does Size Matter in Determining Firms'...
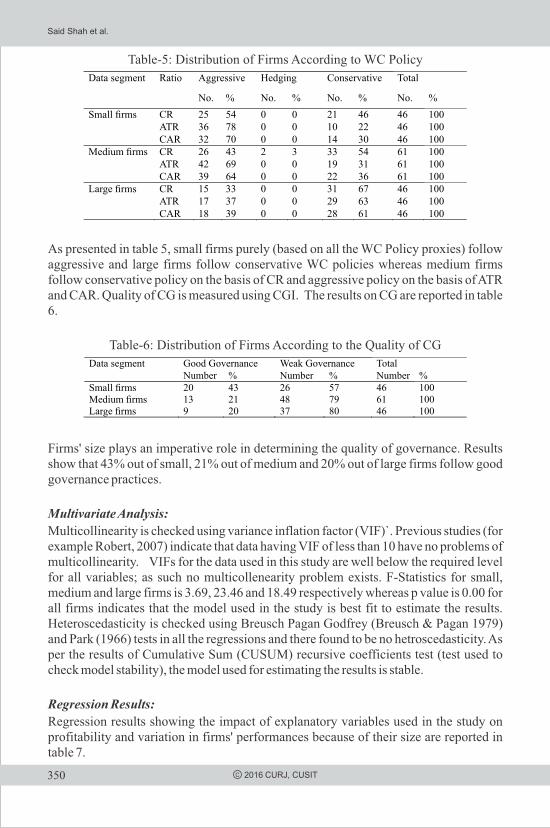
350 C 2016 CURJ, CUSIT
Table-5: Distribution of Firms According to WC Policy
As presented in table 5, small firms purely (based on all the WC Policy proxies) follow aggressive and large firms follow conservative WC policies whereas medium firms follow conservative policy on the basis of CR and aggressive policy on the basis of ATR and CAR. Quality of CG is measured using CGI. The results on CG are reported in table 6.
Table-6: Distribution of Firms According to the Quality of CG
Firms' size plays an imperative role in determining the quality of governance. Results show that 43% out of small, 21% out of medium and 20% out of large firms follow good governance practices.
Multivariate Analysis:
Multicollinearity is checked using variance inflation factor (VIF)`. Previous studies (for example Robert, 2007) indicate that data having VIF of less than 10 have no problems of multicollinearity. VIFs for the data used in this study are well below the required level for all variables; as such no multicollenearity problem exists. F-Statistics for small, medium and large firms is 3.69, 23.46 and 18.49 respectively whereas p value is 0.00 for all firms indicates that the model used in the study is best fit to estimate the results. Heteroscedasticity is checked using Breusch Pagan Godfrey (Breusch & Pagan 1979) and Park (1966) tests in all the regressions and there found to be no hetroscedasticity. As per the results of Cumulative Sum (CUSUM) recursive coefficients test (test used to check model stability), the model used for estimating the results is stable.
Regression Results:
Regression results showing the impact of explanatory variables used in the study on profitability and variation in firms' performances because of their size are reported in table 7.
Data segment Ratio Aggressive Hedging Conservative Total
No.
%
No.
%
No.
%
No. %
Small rms CR
25
54
0
0
21
46
46 100ATR
36
78
0
0
10
22
46 100
CAR
32
70
0
0
14
30
46 100Medium rms CR 26 43 2 3 33 54 61 100
ATR
42
69
0
0
19
31
61 100CAR
39
64
0
0
22
36
61 100
Large rms CR
15
33
0
0
31
67
46 100ATR 17 37 0 0 29 63 46 100CAR 18 39 0 0 28 61 46 100
Data segment Good Governance Weak Governance TotalNumber
%
Number
%
Number %
Small rms 20 43 26 57 46 100Medium rms 13
21
48
79
61 100
Large rms 9 20 37 80 46 100
Said Shah et al.
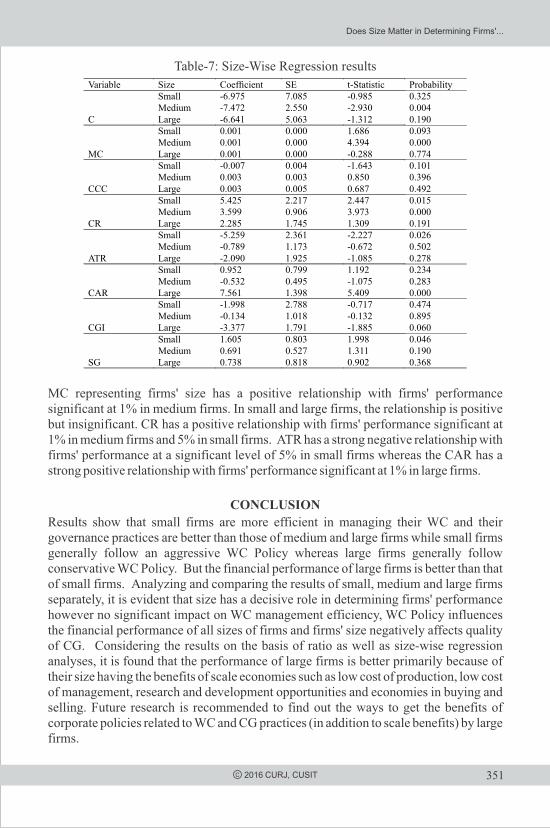
351C 2016 CURJ, CUSIT
Table-7: Size-Wise Regression results
MC representing firms' size has a positive relationship with firms' performance significant at 1% in medium firms. In small and large firms, the relationship is positive but insignificant. CR has a positive relationship with firms' performance significant at 1% in medium firms and 5% in small firms. ATR has a strong negative relationship with firms' performance at a significant level of 5% in small firms whereas the CAR has a strong positive relationship with firms' performance significant at 1% in large firms.
CONCLUSION
Results show that small firms are more efficient in managing their WC and their governance practices are better than those of medium and large firms while small firms generally follow an aggressive WC Policy whereas large firms generally follow conservative WC Policy. But the financial performance of large firms is better than that of small firms. Analyzing and comparing the results of small, medium and large firms separately, it is evident that size has a decisive role in determining firms' performance however no significant impact on WC management efficiency, WC Policy influences the financial performance of all sizes of firms and firms' size negatively affects quality of CG. Considering the results on the basis of ratio as well as size-wise regression analyses, it is found that the performance of large firms is better primarily because of their size having the benefits of scale economies such as low cost of production, low cost of management, research and development opportunities and economies in buying and selling. Future research is recommended to find out the ways to get the benefits of corporate policies related to WC and CG practices (in addition to scale benefits) by large firms.
Variable Size Coefcient SE t-Statistic Probability
C
Small -6.975 7.085 -0.985 0.325Medium -7.472 2.550 -2.930 0.004Large -6.641 5.063 -1.312 0.190
MC
Small 0.001 0.000 1.686 0.093Medium
0.001
0.000
4.394
0.000Large
0.001
0.000
-0.288
0.774
CCC
Small
-0.007
0.004
-1.643
0.101Medium
0.003
0.003
0.850
0.396Large
0.003
0.005
0.687
0.492
CR
Small
5.425
2.217
2.447
0.015
Medium
3.599
0.906
3.973
0.000Large 2.285 1.745 1.309 0.191
ATR
Small -5.259 2.361 -2.227 0.026Medium
-0.789
1.173
-0.672
0.502
Large
-2.090
1.925
-1.085
0.278
CAR
Small
0.952
0.799
1.192
0.234Medium
-0.532
0.495
-1.075
0.283Large
7.561
1.398
5.409
0.000
CGI
Small
-1.998
2.788
-0.717
0.474Medium -0.134 1.018 -0.132 0.895Large -3.377 1.791 -1.885 0.060
SG
Small 1.605 0.803 1.998 0.046Medium 0.691 0.527 1.311 0.190Large 0.738 0.818 0.902 0.368
Does Size Matter in Determining Firms'...

352 C 2016 CURJ, CUSIT
REFERENCESAbuzayed, B. (2012). Working capital management and firms' performance in emerging
markets: the case of Jordan. International Journal of Managerial Finance, 8(2), 155-179.
Al-Mwalla, M. (2012). The Impact of Working Capital Management Policies on Firm's Profitability and Value: The Case of Jordan, International Research Journal of Finance and Economics, 85:147-153
Breusch, T. S. and A.R. Pagan (1979). A Simple Test for Heteroskedasticity and Random Coefficient Variation, Econometrica, 47(5): 1288-1290
Connor G, Sehgal S, (2001): Tests of the Fama and French Model in India, Discussion paper, 379, London UK.
Dalbor, M.C., A. Kim and A. Upneja (2004). An Initial Investigation of Firm Size and Debt Use by Small Restaurant Firms, Journal of Hospitality Financial Management, 12(1): 41-48
Deloof M, (2003): Does Working Capital Management Affect Profitability of Belgian Firms? Journal of Business Finance and Accounting, 30: 573-587
Driver, C. (2006). Business Optimism for Small, Medium and Large Firms: Does it Explain Investment? Tanaka Business School Discussion Papers: TBS/DP06/43
Du J. and S. Girma (2009). Source of Finance, Growth and Firm Size Evidence from China, United Nation University Research Paper No. 2009/03: 1-34
Fama, EF, French KR, (1992): The Cross-Section of Expected Stock Returns, The Journal of Finance, 47(2): 427-465
Gill, A., Biger, N., & Mathur, N. (2010). The relationship between working capital management and profitability: Evidence from the United States. Business and Economics Journal, 10(1), 1-9.
Hansen G.S, Wernerfelt B, (1989): Determinants of Firm Performance: The Relative Importance of Economic and Organizational Factors, Strategic Management Journal, 10(5): 399-411
Hausman, J. A. (1978). Specification Tests in Econometrics, Econometrica 46 (6): 1251–1271.
Jensen, M,C. and W.H. Meckling (1976). Theory of the Firm, Managerial Behavior, Agency Costs and Ownership Structures, Journal of Financial Economics, 3(4): 305-360
Said Shah et al.

353C 2016 CURJ, CUSIT
Likert, R. (1932). A Technique for the Measurement of Attitudes, Archives of Psychology, 140: 1–55.
Luo Y., Tan J.J (1998): A Comparison of Multinational and Domestic Firms in an Emerging Market: A Strategic Choice Perspective, Journal of International Management, 4 (1): 21–40
Lyroudi, K., & Lazaridis, Y. (2000). The cash conversion cycle and liquidity analysis of the food industry in Greece.
Majumdar S.K (1997): The Impact of Size and Age on Firm-Level Performance: Some Evidence from India, Review of Industrial Organization, (12): 231–241
Mirza, N., S. Shahid (2008). Size and Value Premium in Karachi Stock Exchange, The Lahore Journal of Economics, 13(2): 1-26
Mueller, S. and J. Stegmaier (2015). Economic Failure and the Role of Plant Age and Size, Small Business Economics, 44 (3): 621-638
Nason, R.S., A. McKelvie and G.T. Lumpkin (2015). The Role of Organizational Size in the Heterogeneous Nature of Corporate Entrepreneurship, Small Business Economics, 45 (2): 279-304
Padachi, K. (2006). Trends in Working Capital Management and its Impact on Firms' Performance: An Analysis of Mauritian Small Manufacturing Firms, International Review of Business Research Papers, 2 (2): 45 -58
Park R.E (1966): Estimation with heteroscedastic error terms, Econometrica, (34): 888. Penrose E.T (1959): The Theory of the Growth of the Firm, 1st edition, Oxford
University Press, Oxford
Rajan, R. and Zingales, L. (1998), Financial Dependence and Growth, The American Economic Review 88: 559-586.
Robert, O'Brien M, (2007): A Caution Regarding Rules of Thumb for Variance Inflation Factors, Quality & Quantity, (41): 673-690
Sharma, A., & Kumar, S. (2011). Effect of working capital management on firm profitability empirical evidence from India. Global Business Review, 12(1), 159-173.
Singh D.P, (2011): Net Working Capital Level and Return on Capital Employed in Firms of Cement Industries in India, VSRD International Journal of Business & Management Research, 1(4): 269-280
Vithessonthia, C. and J. Tongurai (2015). The Effect of Firm Size on the Leverage–Performance Relationship During the Financial Crisis of 2007–2009, Journal of Multinational Financial Management, 29: 1-29
Does Size Matter in Determining Firms'...

City University of Science & Information Technology, Peshawar is one of the first private-sector universities, chartered by the Higher Education Commission (HEC).The University is an extension of Peshawar Model Educational Institutes (PMEI) founded in 1979 with an aim to provide quality education and research. All the efforts of City University's management, administration and faculty are directed to produce competent and efficient professionals who will effectively contribute in taking Pakistan to technological and economic glories.
The City University Research Journal (CURJ), a bi-annual publication, encourages both in-house and external contributors in the area of Business and Management.
Dalazak Road, Peshawar, Pakistan091-2609501-80312-9833113-7 [email protected]
AddressPhone (Land-line)
Phone (Mobile)Fax
E-mailWebsite
::::::
of Science & Information Technology (CUSIT), Peshawar, Pakistan
CITY UNIVERSITY
For further information, please contact:Chief Editor, City University Research Journal
RESEARCH JOURNAL
City UniversityHEC RECOGNIZED