Embed Size (px)
Citation preview

HeavyVehicleSystemsOptimization
HeavyVehicleSystemsOptimization
Bringing you a prosperous future where energy is clean, abundant, reliable and affordable
2003 AnnualProgress Report
freedomCAR & vehicle technologies program
Less dependence
on foreign oil, and
eventual transition
to an emissions-free,
petroleum-free vehicle

U.S. Department of EnergyFreedomCAR and Vehicle Technologies Program1000 Independence Avenue, S.W.Washington, D.C. 20585-0121
FY 2003
Annual Progress Report for Heavy VehicleSystems Optimization
Energy Efficiency and Renewable EnergyFreedomCAR and Vehicle Technologies Program
Approved by Dr. Sidney Diamond Technology Area Development Specialist
February 2004


Heavy Vehicle Systems Optimization Program FY 2003 Annual Report
iii
Contents
Forward by Dr. Sidney Diamond, Office of FreedomCAR and Vehicle Technologies,Energy Efficiency and Renewable Energy, U.S. Department of Energy ................................. 1
I. Aerodynamic Drag Reduction...................................................................................................... 3
A. DOE Project on Heavy Vehicle Aerodynamic DragLawrence Livermore National Laboratory; R.C. McCallen, et al. ........................................... 3
B. Experimental Modeling of Generic Conventional ModelNASA Ames Research Center; J. Ross, et al............................................................................ 11
C. Experimental Measurement of the Flow Field of Heavy TrucksUniversity of Southern California; F. Browand, et al............................................................... 16
D. Continued Development and Improvement of Pneumatic Heavy VehiclesGeorgia Tech Research Institute; R.J. Englar........................................................................... 22
E. Computational and Experimental Investigation of Drag-Reducing Add-onDevices and the Flow Field around a Simplified Tractor-Trailer GeometryLawrence Livermore National Laboratory; K. Salari, et al. ..................................................... 29
F. Reynolds-Averaged Navier-Stokes Simulations of a SimplifiedTractor/Trailer ConfigurationSandia National Laboratories; L.J. DeChant, et al. .................................................................. 37
G. Commercial CFD Code Validation for External AerodynamicsSimulations of Realistic Heavy-Vehicle ConfigurationsArgonne National Laboratory; W.D. Pointer ........................................................................... 43
H. Vortex MethodsCalifornia Institute of Technology; A. Leonard, et al............................................................... 50
II. Thermal Management .................................................................................................................. 55
A. Cooling Fan and System Performance and Efficiency ImprovementsCaterpillar Incorporated; R.L. Dupree, et al. ............................................................................ 55
B. Efficient Cooling in Engines with Nucleate BoilingArgonne National Laboratory; J.R. Hull .................................................................................. 61
C. Evaporative CoolingArgonne National Laboratory; S.U.S. Choi.............................................................................. 67
D. NanofluidsArgonne National Laboratory; S.U.S. Choi.............................................................................. 71

Heavy Vehicle Systems Optimization Program FY 2003 Annual Report
iv
Contents (Cont.)
E. Application of Single- and Two-Phase Flow Microscale Technologiesfor Automotive Thermal ManagementArgonne National Laboratory; N.T. Obot and J.R. Hull .......................................................... 76
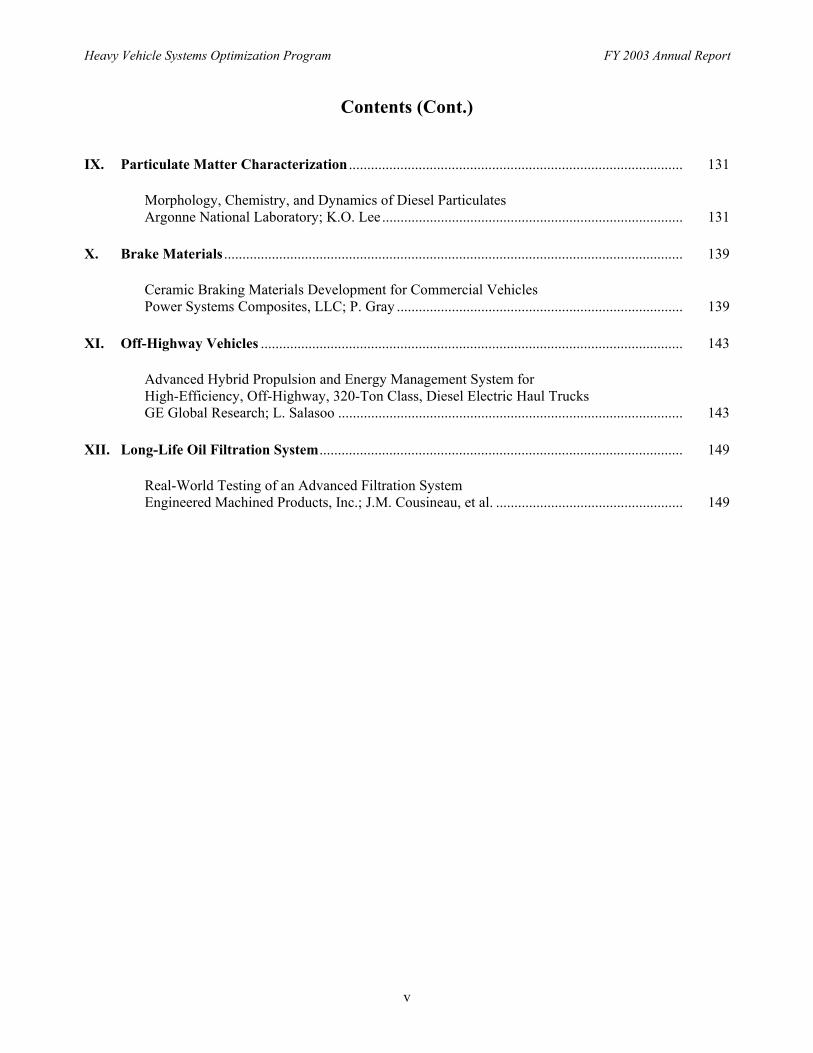
F. Underhood Thermal AnalysisArgonne National Laboratory; F.-C. Chang, et al. ................................................................... 79
III. More Electric Truck ..................................................................................................................... 87
Parasitic Energy Loss Reduction and Enabling Technologies forClass 7/8 TrucksCaterpillar, Inc.; W. Lane ......................................................................................................... 87
IV. Friction and Wear ......................................................................................................................... 95
A. Boundary Lubrication MechanismsArgonne National Laboratory; O.O. Ajayi, et al. ..................................................................... 95
B. Parasitic Engine Loss ModelsArgonne National Laboratory; G. Fenske, et al........................................................................ 101
V. Autothermal Diesel Reformer ...................................................................................................... 107
Diesel Fuel Reformer TechnologyArgonne National Laboratory; M. Krumpelt ............................................................................ 107
VI. EM Regenerative Shocks .............................................................................................................. 109
EM Shock AbsorberArgonne National Laboratory; J.R. Hull .................................................................................. 109
VII. Joining Carbon Composites ......................................................................................................... 115
Structural Characterization and Joining of MMC Components forHeavy VehiclesWest Virginia University; J. Prucz and S. Shoukry.................................................................. 115
VIII. Analysis .......................................................................................................................................... 121
A. Systems Analysis for Heavy VehiclesArgonne National Laboratory; L.L. Gaines.............................................................................. 121
B. 21st Century Locomotive Technology 2003GE Global Research; L. Salasoo .............................................................................................. 126
Heavy Vehicle Systems Optimization Program FY 2003 Annual Report
v
Contents (Cont.)
IX. Particulate Matter Characterization ........................................................................................... 131
Morphology, Chemistry, and Dynamics of Diesel ParticulatesArgonne National Laboratory; K.O. Lee.................................................................................. 131
X. Brake Materials ............................................................................................................................. 139
Ceramic Braking Materials Development for Commercial VehiclesPower Systems Composites, LLC; P. Gray .............................................................................. 139
XI. Off-Highway Vehicles ................................................................................................................... 143
Advanced Hybrid Propulsion and Energy Management System forHigh-Efficiency, Off-Highway, 320-Ton Class, Diesel Electric Haul TrucksGE Global Research; L. Salasoo .............................................................................................. 143
XII. Long-Life Oil Filtration System................................................................................................... 149
Real-World Testing of an Advanced Filtration SystemEngineered Machined Products, Inc.; J.M. Cousineau, et al. ................................................... 149

Heavy Vehicle Systems Optimization Program FY 2003 Annual Report
vi

Heavy Vehicle Systems Optimization Program FY 2003 Annual Report
1
Forward
We are pleased to provide the annual report for FY 2003 for the Heavy Vehicle Systems OptimizationProgram. As emission regulations became more stringent, it is clear that improvements in the diesel engineefficiency could be limited. Therefore, Heavy Vehicle Optimization addresses the very important area of non-engine losses that is fertile for large fuel efficiency improvements. These parasitic energy losses are dividedinto aerodynamic drag, which accounts for about 53% of the non-engine losses of a fully loaded class 8tractor-trailer traveling at 65 mph on a level highway; rolling resistance (32% of non-engine losses);drivetrain (6%); and auxiliary losses (9%). As aerodynamic drag is reduced, brakes that already operate atcapacity can be seriously overloaded. Therefore, the program also includes a safety line item that concentrateson improvement of brake systems. Funds in FY 2003 were approximately $10.3 M. Projects are selected onthe basis of proposals addressing open solicitations issued by the Office of FreedomCAR and VehicleTechnologies, or proposals from national laboratories. All contracts with our industrial partners are cost-shared at least 50%.
The primary goal of the program is to develop cost-effective technologies that will vastly improve the fuelefficiency of heavy vehicles and will eventually devolve into all vehicles. The ultimate goals are consistentwith the goals of the 21st Century Truck Initiative: a 10-mpg, fully loaded class 8 tractor/trailer at highwayspeeds.
The individual goals are to reduce the aerodynamic drag coefficient by 25%, resulting in about a 12.5%increase in fuel efficiency at 65 mph (and larger at higher velocities); a 40% decrease in rolling resistance; a30% decrease in drivetrain losses; a 50% decrease in auxiliary loads; and an 8% decrease in the size of theradiator despite the higher cooling demands of higher-power engines and exhaust gas recirculation.
The individual sections contained in this annual report indicate that excellent, steady progress is being madetoward these 2010 goals. Highlights include, but are not restricted to, a demonstration of the “more electrictruck,” in which many of the belt-driven devices were replaced by electrically driven ones, an integral starter-generator, a high-efficiency air conditioner, and installation of a system to avoid long idling that included aninvertor and an auxiliary power unit. Advanced state-of-the-art computational fluid dynamics is leading to theexploration of novel devices to reduce aerodynamic drag. Nanofluids (fluids containing either small copperparticles or carbon nanotubes) are being developed that have a 250% higher thermal conductivity thanconventional cooling fluids. A theory of scuffing, the catastrophic failure of material under rubbingconditions, has been developed that allows some predictive capabilities. A device that converts anyhydrocarbon into hydrogen has been advanced to the point where a major supplier has taken over thecommercial development, contributing a major portion of the funding for continued development of thedevice. Computer modeling of a diesel engine has shown critical areas where fuel efficiencies can be gainedif friction can be reduced by coatings, surface treatments, and/or the use of tailored lubricants. Dimplesproduced on the surface by means of a laser can reduce friction in the boundary layer lubrication region.
Finally, it is my pleasure to thank the dedicated scientists and engineers who are working with the Office ofFreedomCar and Vehicle Technologies. It is their expertise, drive, and initiative that have made great stridesin their technologies; their innovations will continue to contribute to advances in the reduction of parasiticenergy losses for heavy vehicles. A special note of recognition is due to Dr. Jules Routbort, the technicalprogram manager for Heavy Vehicle Systems Optimization. His zeal, knowledge, insight, and organizing

Heavy Vehicle Systems Optimization Program FY 2003 Annual Report
2
skills have energized all our colleagues, who are striving to accomplish the goals presented above in the besttechnical interest of our nation.
Dr. Sidney Diamond, Technology Area Development SpecialistHeavy Vehicle Systems OptimizationOffice of FreedomCar and Vehicle TechnologiesEnergy Efficiency and Renewable EnergyU.S. Department of Energy

Heavy Vehicle Systems Optimization Program FY 2003 Annual Report
3
I. Aerodynamic Drag Reduction
A. DOE Project on Heavy Vehicle Aerodynamic Drag
Project Principal Investigator: R.C. McCallenLawrence Livermore National LaboratoryP.O. Box 808, Livermore, CA 94551-0808(925) 423-0958; [email protected]
Principal Investigator: K. SalariCo-Investigator: J. OrtegaLawrence Livermore National LaboratoryP.O. Box 808, Livermore, CA 94551-0808(925) 424-4635; [email protected]
Principal Investigator: L.J. DeChantCo-Investigators: C.J. Roy, J.L. Payne, and B. HassanSandia National LaboratoriesP.O. Box 5800, MS 0825, Albuquerque, NM 87185-0825(505) 844-4250; [email protected]
Principal Investigator: W.D. PointerArgonne National Laboratory9700 S. Cass Avenue, NE-208, Argonne, IL 60439(630) 252-1052; [email protected]
Principal Investigator: F. BrowandCo-Investigators: M. Hammache and T.-Y. HsuAerospace & Mechanical Engineering, University of Southern CaliforniaRRB 203, Los Angeles CA 90089-1191(213) 740-5359; [email protected]
Principal Investigator: J. RossCo-Investigators: D. Satran, J.T. Heineck, S. Walker, and D. YasteNASA Ames Research CenterMS 260-1, Moffett Field, CA 94035(650) 604-6722; [email protected]
Principal Investigator: R. EnglarGeorgia Tech Research InstituteATASL, CCRF, Atlanta, GA 30332-0844(770) 528-3222; [email protected]
Principal Investigator: A. LeonardCo-Investigators: M. Rubel and P. ChatelainCalifornia Institute of Technology1200 East California Blvd. MC 301-46, Pasadena, CA 91125(626) 395-4465; [email protected]

Heavy Vehicle Systems Optimization Program FY 2003 Annual Report
4
Technology Development Manager: Sid Diamond(202) 586-803; [email protected] Program Manager: Jules Routbort(630) 252-5065; [email protected]
Contractors: Lawrence Livermore National Laboratory, Sandia National Laboratories, ArgonneNational Laboratory, NASA Ames Research Center, Georgia Tech Research Institute, University ofSouthern California, California Institute of CaliforniaContract Nos.: W-7405-ENG-48, DE-AC04-94AL85000, W-31-109-ENG-38, DE-AI01-99EE50559, DE-AC03-02EE5069, DE-AC03-98EE50512, DE-AC03-98EE50506
Consortium members in NASA Ames Research Center 12-foot pressure windtunnel.
Objective• Provide guidance to industry in the reduction of aerodynamic drag of heavy truck vehicles.
• Establish a database of experimental, computational, and conceptual design information, and demonstratepotential of new drag-reduction devices.
Approach• Develop and demonstrate the ability to simulate and analyze aerodynamic flow around heavy truck vehicles
using existing and advanced computational fluid dynamics (CFD) tools.
• Through an extensive experimental effort, generate an experimental data base for code validation.
• Using experimental data base, validate computations.
• Provide industry with design guidance and insight into flow phenomena from experiments and computations.

Heavy Vehicle Systems Optimization Program FY 2003 Annual Report
5
• Investigate aero devices (e.g., boattail plates, side extenders, blowing and acoustic devices) and provideindustry with conceptual designs of drag reducing devices. Demonstrate the full-scale fuel economy potential ofthese devices.
Accomplishments• Drag reduction devices met project goals:
- Angled plates provide 50% more drag reduction than boattail plates- Use of angled plates (~15%) with skirts or lowboy trailers (~10%) provides over 20% reduction in drag
which corresponds to more than 10% reduction in fuel use at highway speeds.- Track tests of the pneumatic blowing device demonstrated a maximum reduction of 5-6% in fuel use (not
accounting for fuel use for blowing). Recent wind-tunnel tests have identified configuration/blowingimprovements indicating potential fuel economy of 7% from blowing (without consideration of the energyrequired for the air) and a drag reduction of 10-12% due to configuration changes.
- Full-scale test results on an SUV indicate the potential for blowing to reduce drag (increase fuel economy),increase drag for braking, reduce drag due to side winds, and provide directional stability, without movingparts.
- Computationally showed that use of a “splitter plate” in the tractor-trailer gap may be one way to maintaina symmetrical, low drag condition.
• Insight from experiments and experimental data base provided clear guidance to industry on reliable,predictable experimental techniques:
- Reynolds number (Re) effects on the vehicle drag coefficient (CD) are in general minimal for experimentswith Re above 1 million. This finding supports the common use of scaled down vehicles and Re belowtypical highway Re for experimentation.
- Experiments indicate that inaccuracies should be considered when evaluating gap and wake drag reductiondevices at lower than highway Re. Low Re experiments should provide ball park estimates, but accurateoptimization of devices may require road testing.
- Edge radius effects and/or the cleanliness of the vehicle upstream flow are critical to achieving accuratepredictions.
- Drag measurements alone are not sufficient to provide an understanding of the impact of geometrymodifications and direction for design improvements and advanced measurement techniques (e.g., particle-image velocimetry, unsteady pressure taps, oil film interferometry) should be included to provide importantinformation on the global and local structure of the flow and clear design direction.
• Computational results provided the following clear guidance and caution warnings on the use of steadyReynolds-averaged Navier Stokes (RANS) models for CFD simulations:
- Conclusions on predictive capability of a turbulence model can only be determined with grid convergedsolutions.
- When using wall functions, the first wall point should be held fixed while refining the grid.- The computed overall vehicle drag is highly dependent on the choice of turbulent steady RANS model.
Solutions may disagree with measurements by 0.5 to 50% for 0 degree yaw and by even higher percentagesat yaw angles.
- Steady RANS models generally do a good job predicting the flow on the front and sides of the vehicle,where the flow stays attached and does not exhibit separation and recirculation zones.
- The flow structure in the trailer wake presented by the time-averaged experimental data does not comparewith that computed with the steady RANS models. Thus, use of steady RANS to evaluate drag reductiondevices in the trailer wake and tractor-trailer gap may provide inaccurate design guidance.
Future Direction• Continue to develop and evaluate drag reducing conceptual designs and encourage and work with industry to
road test the most promising drag reducing devices. Road tests with angled plates and SAE track tests with thepneumatic device are planned for FY04.
• Continue experimental data reduction and analysis for the generic conventional model (GCM).

Heavy Vehicle Systems Optimization Program FY 2003 Annual Report
6
• Continue computations of flow around GCM, compare to experimental data, perform analyses, and provideguidance to industry on use of unsteady RANS and hybrid RANS/Large-Eddy Simulation methods.
• Develop and use an apparatus for studying wheel and tire splash and spray, pursuing ways to minimize this roadsafety hazard.
• Investigate air flow around rotating tires for improved brake cooling, as well as drag reduction.
• Investigate aerodynamics of filled and empty coal cars to determine effective concepts for drag reduction.
• Collaborate with DOE Industrial Consortium, which will be conducting fleet tests of advanced aerodynamicdrag reduction devices. Schedule industry site visits and meetings to share findings and encourage considerationof effective design concepts for road testing.
IntroductionA modern Class 8 tractor-trailer can weigh up to80,000 pounds and has a wind-averaged dragcoefficient around CD = 0.6. The drag coefficient isdefined as the drag/(dynamic pressure × projectedarea). The higher the speed the more energyconsumed in overcoming aerodynamic drag. At70 miles per hour, a common highway speed today,overcoming aerodynamic drag represents about 65%of the total energy expenditure for a typical heavytruck vehicle. Reduced fuel consumption for heavyvehicles can be achieved by altering truck shapes todecrease the aerodynamic resistance (drag). It isconceivable that present day truck drag coefficientsmight be reduced by as much as 50%. This reductionin drag would represent approximately a 25%reduction in fuel use at highway speeds. Anestimated total savings of $1.5 billion per year canbe recognized in the United States alone for just a6% reduction in fuel use. This reduction represents1% of all fuel use in the United States.
The project goal is to develop and demonstrate theability to simulate and analyze aerodynamic flowaround heavy truck vehicles using existing andadvanced computational fluid dynamics (CFD)tools. Activities also include an extensiveexperimental effort to generate data for codevalidation and a design effort for developing dragreducing devices. The final products are specificdevice concepts that can significantly reduceaerodynamic drag, and thus improve fuel efficiency,in addition to an experimental data base andvalidated CFD tools. The objective is to provideindustry with clear guidance on methods ofcomputational simulation and experimentalmodeling techniques that work for predicting theflow phenomena around a heavy vehicle and add-on
drag reducing devices. Development of effectivedrag reducing devices is also a major goal.
The following reports on the findings andaccomplishments for fiscal year 2003 in the project’sthree focus areas
• Drag reduction devices• Experimental testing• Computational modeling
A summary is given in the introduction portion ofthis report and detailed reports from eachparticipating organization are provided in theappendices. Included are experimental results andplans by NASA, USC, GTRI, and LLNL inAppendices A through D. The computational resultsfrom LLNL and SNL for the integrated tractor-trailer benchmark geometry called the GroundTransportation System (GTS) model are inAppendices D and E, from ANL for the GenericConventional Model (GCM, a.k.a. SLRT) inAppendix F, by LLNL for the tractor-trailer gap andtrailer wake flow investigations in Appendix D, andturbulence model development and benchmarksimulations being investigated by Caltech inAppendix G. USC is also investigating an acousticdrag reduction device that has been named ‘Mozart’(Appendix B), GTRI continues their investigation ofa blowing device (Appendix C), and LLNL presentstheir idea for a gap drag reduction device(Appendix D).
Drag Reduction DevicesThere are three areas identified for aero dragreduction and several drag reduction devices havebeen investigated

Heavy Vehicle Systems Optimization Program FY 2003 Annual Report
7
• Tractor-Trailer GapStabilizing devices, cab extenders
• Wheels/UnderbodySkirts/lowboy trailer (∆CD ~ 0.05), splitterplate
• Trailer BaseBoattail plates (∆CD ~ 0.05), base flaps (∆CD ~0.08), rounded edges, and pneumatics
The drag reduction for various device add-ons isshown in Figure 1, as a function of yaw angle. Theseresults were obtained in the NASA Ames 12-ftPressure Wind Tunnel (PWT) using the realisticGCM geometry, tested at realistic highway Reynoldsnumbers. Side and roof extenders are shown tosignificantly reduce the drag and high yaw. Baseflaps, as shown in a close-up in Figure 2, areexpected to provide 50% more drag reduction thanboattails. For a tractor-trailer with a CD = 0.55 thepercent drag reduction (∆CD/CD) utilizing base flaps
(~15%) and side skirts and/or a low boy (~10%) isestimated at 22 to 25%. Thus, the use of base flapsand skirts would provide an 11 to 12% fuel savingswhich should result in a $3 billion per year fuel costsavings in the US. (Note that the cost of the deviceand possible maintenance over the year should alsobe considered for determining the overall costsavings to the fleet owner.)
The base flaps are simple flat plates mounted on theedges of the back end of a trailer. The lengths of theplates match the dimensions of the trailer base (two11.5-ft-long plates on the sides and two 8.5-ft-longplates on the top and bottom). The width of theplates or how much they protrude from the trailer isabout 1/4 the width of the trailer or about 2 feet.Tilting the flaps about 20° inward away from beingflush with the trailer sides appears to provide theoptimum drag reduction. The optimum flap angle foran on road vehicle is yet to be determined, but weexpect it to be near 20°.
Figure 1. GCM in tunnel, variation in body drag coefficient with yaw angle for variousconfigurations and device add-ons, and PIV and pressure sensitive paint results for baseline andwith side extenders

Heavy Vehicle Systems Optimization Program FY 2003 Annual Report
8
Figure 2. Base flaps (gold colored) mountedon back end of trailer (blue) in NASA’s 12-ftpressure wind tunnel
Development has continued on tangential blowingaircraft-based technology to reduce HV drag byeliminating aft separation on the trailer andrecovering base pressure on the back doors. Smaller-scale tunnel results have shown measured dragreductions as high as 15-18% due to blowing(without consideration of the energy required toblow) and 10-12% due to the device’s cornerrounding, for a total of 25 to 30%. Blowing also hasthe potential to increase drag for use in braking, toreduce drag due to side winds, and to overcomedirectional instabilities due to side gusts. Amaximum of 5-6% fuel economy increase (notaccounting for energy use for blowing) resultedduring on-track HV fuel economy tests, and full-scale testing of a Pneumatic Sports Utility Vehicle isongoing.
Road testing the drag reduction devices is needed todetermine
• On road fuel savings,• Optimal flap deflection angle for various tractor-
trailer geometries,• Optimal flap shape,• Optimum skirt height,• Durability, practicality, safety, ease of operation
of proposed devices, and• Impact on truck braking capability.
It is recommended that road testing include
• Instantaneous broadcast fuel rate (1/2 secondupdates),
• Repeated forward and back trip runs overknown, instrumented highways (e.g., South-to-North and North-to-South runs over a portion ofCalifornia I-15), and
• Base flap device evaluated in close-followingcombinations of 1 to 3 trucks.
To recognize these levels of fuel savings by the mosteffective use of drag reduction devices, theinvolvement and acceptance by tractormanufacturers, trucking associations, fleet owners,and drivers is critical. It is thus important to
• Solicit input and feedback from theseorganizations for design of base flaps and lowboy and/or skirt construction,
• Demonstrate “actual” fuel savings from roadtests and interest OEMs in doing testing, and
• Make site visits or attend DOE’s IndustryConsortium’s Working Group meetings toencourage input and feedback.
Suggestions included encouraging the DOE IndustryConsortium to road test base flaps and skirts or lowboys as part of their DOE funded effort. Anothersuggestion is to contract with California Partners forAdvanced Transit and Highways (PATH) to performthe proposed road tests as part of their 3-truckdemonstration platoon.
Experimental Findings and SuggestedGuidanceExperiments have been conducted on a GenericConventional Model (GCM) in the NASA Ames7-ft × 10-ft wind tunnel for Reynolds numbers (Re)of 1 million based on the width of the trailer, whichcorresponds to a full-scale vehicle traveling atroughly 15-mph. Experiments have also beenperformed on the GCM geometry in the NASAAmes 12-ft pressure wind tunnel (PWT) for Re of 1and 6 million, where the later corresponds to a full-scale vehicle traveling at 80-mph. Geometryconfigurations included the addition of tractor sideextenders, a low boy trailer, and boattails and angledflaps on the trailer’s trailing edge. The results in thePWT are obtained for a constant Mach number (Ma= 0.15) by pressurizing the tunnel. This allows forthe determination of Re and geometry effects. Yawangles were varied from +14 to -14° measured fromthe vehicle length axis and wind direction so that

Heavy Vehicle Systems Optimization Program FY 2003 Annual Report
9
accurate wind-averaged drag could be determined, inaddition to determining the effect of yaw angle. Thefollowing is a list of experimental techniques andmeasurements:
• Internal balance measured the vehicle forces andmoments
• Load cells measured the drag for the body axisand yawing moment of the tractor
• Static pressure taps on the model (476) and tapson the walls and floor (368) measured staticpressure conditions
• Unsteady pressure transducers (14) provide apressure time history on the surface of thevehicle
• Three-dimensional particle image velocimetry(PIV) provided a time history of the velocityfield on planes in the wake of the vehicle and inthe tractor-trailer gap.
Drag measurements alone are not sufficient toprovide an understanding of the impact of geometrymodifications and direction for designimprovements. It is recommended that advancedmeasurement techniques like PIV and pressuresensitive paint (PSP) be included. These advancedtechniques provide important information on theglobal and local structure of the flow and canprovide clear design direction.
The following are the determined Re effects (note:Re is based on the width of the trailer and freestreamvelocity):
• Re effects on CD are in general minimal forexperiments with Re above 1 million. Thisfinding supports the common use of scaled downvehicles and Re below typical highway Re forexperimentation.
• It should be noted that some Re influence wasapparent on the flow structure in the tractor-trailer gap and the back end of the trailer. It wasmost apparent in the upper portion of the flowregion in the gap and in the wake. Thus, someinaccuracies should be considered whenevaluating gap and wake drag reduction devicesat lower than highway Re. Low Re experimentsshould provide ball park estimates, but accurateoptimization of devices may require road testing.
• Edge radius effects and/or the cleanliness of thevehicle upstream flow are critical to achieving
accurate predictions. Corner radii on the leadingedge of the vehicle should provide Re > 50,000,based on corner radius and tunnel freestreamvelocity. Tripping the flow at the vehicle leadingedge may also be required to avoid flowseparation.
Computational Findings and SuggestedGuidelinesTeam members from LLNL, SNL, ANL, andCaltech are investigating a wide range of turbulencemodels including steady and unsteady Reynolds-averaged Navier-Stokes (RANS and URANS,respectively), large-eddy simulation (LES), andhybrid methods that use a combination RANS andLES models in the simulation. In addition, variousnumerical approaches are being consideredincluding finite volume, finite element, and vortexmethods. The focus of the focus of this years effortwas steady RANS with and without the use of wallfunctions. Wall functions provide an approximationto the flow field in the wall region and the flow fieldis not resolved.
The following are the general observations andguidelines for steady RANS modeling:
• Conclusions on predictive capability of aturbulence model can only be determined withgrid converged solutions. Predicted flowstructures in separated regions, like the trailerwake, vary significantly with grid refinement.Variation in overall drag is not substantial butstill apparent with grid refinement.
• When using wall functions, the first wall pointshould be held fixed while refining the grid(i.e., the distance from this grid point to the wallshould not change), but it is appropriate todecrease the width of the wall elements whilerefining the grid (i.e., refinement in directiontangent to walls).
• The computed overall vehicle drag is highlydependent on the choice of turbulent steadyRANS model. Solutions may disagree withmeasurements by 0.5 to 50% for 0 degree yawand by even higher percentages at yaw angles.Thus, the performance of steady RANS modelsfor a given geometry is not predictable andexperimental results to determine ball park

Heavy Vehicle Systems Optimization Program FY 2003 Annual Report
10
accuracy is critical when relying on steadyRANS for design guidance.
• Steady RANS models generally do a good jobpredicting the flow on the front and sides of thevehicle, where the flow stays attached and doesnot exhibit separation and recirculation zones.
• The flow structure in the trailer wake presentedby the time-averaged experimental data does notcompare with that computed with the steadyRANS models. The trailer wake is a region oftransient full flow separation and largerecirculation zones. Thus, use of steady RANSto evaluate drag reduction devices in the trailerwake and tractor-trailer gap may provideinaccurate design guidance.
Near term plans are to organize similar types ofguidelines related to the performance of unsteadyRANS, LES, and hybrid models.
ConclusionsThe DOE Heavy Vehicle Aero Drag Team hassuccessfully modeled the flow field around a generic
conventional model both experimentally andcomputationally. This effort has provided detailedinsight into the flow phenomena, which has lead tothe successful development of drag reductiondevices. Evaluation of an angled plate base dragdevice (15%) with the use of a low boy trailer and/orside skirts (10%) indicates an expected dragreduction of 22 to 25%. Use of these devices shouldprovide an 11 to 12% fuel savings which isestimated to result in a $3 billion per year fuel costsavings in the US. Efforts continue on investigationof acoustic and pneumatic devices to reduce baseand separation drag, and some new ideas forreducing tractor-trailer gap drag. Future new areasbeing investigated are wheel and wheel wellaerodynamics related to brake cooling, tire splashand spray, and an entire new related area ofinvestigation involving the evaluation of coal caraerodynamics with the objective of identifying dragreduction devices for filled and empty cars.

Heavy Vehicle Systems Optimization Program FY 2003 Annual Report
11
B. Experimental Modeling of Generic Conventional Model
Principal Investigator: J. RossCo-Investigators: D. Satran, J.T. Heineck, S. Walker, and D. YasteNASA Ames Research CenterMS 260-1, Moffett Field, CA 94035(650) 604-6722; [email protected]
Technology Development Manager: Sid Diamond(202) 586-8032; [email protected] Program Manager: Jules Routbort(630) 252-5065; [email protected]
Contractor: NASA Ames Research CenterContract No.: DE-AI01-99EE50559
Objective• Acquire data for calibrating CFD codes used to predict the performance of generic vehicles representing Class 8
tractor-trailers.
• Evaluate drag reduction devices.
Approach• Perform experiments utilizing standard and advanced measurement techniques in the NASA Ames 7-ft × 10-ft
wind tunnel and 12-ft pressure wind tunnel on the Generic Conventional Model (GCM).
• Include evaluation of side and roof extenders, boattail plates, base flaps, trailer skirts, and lowboy trailerconfigurations.
Accomplishments• Two test entries were completed in the 12-foot pressure wind tunnel to obtain the aerodynamic data on the
GCM.
• Limited Reynolds number effects were found for the GCM.
• Base flaps were the most effective drag reduction device for trailers.
• Trailer skirts produced some drag reduction but the lowboy trailer configuration was more effective.
• Side and roof extenders were effective for the tractor.
Future Direction• Document the test results and publish the database for computational code validation support.
• Begin experimental efforts for the evaluation of wheel and wheel well aerodynamics for brake cooling andreduction of splash and spray.
• Begin experimental efforts for the evaluation of coal car aerodynamics.

Heavy Vehicle Systems Optimization Program FY 2003 Annual Report
12
IntroductionIn cooperation with the U.S. Department of Energy,a series of wind tunnel tests have been conducted bythe Experimental Aerophysics Group at NASAAmes Research Center on generic vehiclesrepresenting Class 8 tractor-trailers. The primarygoal for these wind tunnel tests was to produce highquality data for validating Computational FluidDynamics (CFD) codes. The final test wasconducted in the NASA Ames Research Center’s12-foot pressure wind tunnel generating data at avariety of Reynolds Numbers, from 1/8 to full-scaleroad values, on the same 1/8th-scale model.
Current CFD codes have a difficult time accuratelypredicting the drag levels for tractor-trailerconfigurations. Enhanced CFD codes that canreliably produce accurate results will enable industryto better understand all aspects of the flow aroundtrucks, leading to better integrated tractor/trailerdesigns. To properly validate the CFD codes, theaerodynamic databases include vehicle forces andmoments, surface pressures, fluctuating pressures on
the rear of the tractor and front and rear of the trailer,skin friction measurements, and 3D Particle ImageVelocimetry (PIV) off-body flow fieldmeasurements in the gap between the tractor andtrailer and in the wake behind the trailer.
Besides generating a database for validating CFDcodes, the Experimental Aerophysics Group hasinvestigated numerous drag reduction devices. Someexamples of the devices include the side and roofextenders which reduce the gap between the tractorand trailer, the lowboy trailer configuration wherethe ground clearance is reduced to a minimum andthe wheels are covered by fairings, and base flapswhich help turn the flow inward as it leaves the backof the trailer reducing the size of the wake andproviding increased base pressure. Additional dragreduction concepts included boattail plates, gapfairings, and trailer skirts.
ResultsAs can be seen in Figures 1 through 5, significantdrag reduction is produced with the different
Figure 1. GCM in tunnel, variation in body drag coefficient with yaw angle for various configurationsand device add-ons, and PIV and pressure sensitive paint results for baseline and with side extenders

Heavy Vehicle Systems Optimization Program FY 2003 Annual Report
13
0.3
0.4
0.5
0.6
0.7
0.8
0.9
-20 -15 -10 -5 0 5 10 15 20
Yaw
CD
bod
y
RN = 6.1, -YawRN = 6.1, +YawRN = 6.4. Extenders on
Figure 2. Drag coefficient versus yaw angle with and without side extenders for Re = 6 million
0.3
0.4
0.4
0.5
0.5
0.6
0.6
0.7
0.7
0.8
0.8
-20 -15 -10 -5 0 5 10 15 20
Yaw
CD
bod
y
RN = 1.1, -YawRN = 1.1, +YawRN = 1.1, Extenders on
Figure 3. Drag coefficient versus yaw angle with and without side extenders for Re = 1.1 million

Heavy Vehicle Systems Optimization Program FY 2003 Annual Report
14
0.30
0.35
0.40
0.45
0.50
0.55
0.60
-20 -15 -10 -5 0 5 10 15 20
Yaw
CD
bod
y RN = 6.4, Boattail off
RN = 1.1, Boattail off
RN = 6.3, Boattail on
RN = 1.1, Boattail on
Figure 4. Drag coefficient versus yaw angle with and without boattail plates for Re = 1.1 and 6 million
0.30
0.35
0.40
0.45
0.50
0.55
0.60
-20 -15 -10 -5 0 5 10 15 20
Yaw
CD
bod
y RN = 6.4, Base flaps off
RN = 1.1, Base flaps off
RN = 6.3, Base flaps 16°RN = 1.1, Base flaps 16°
Figure 5. Drag coefficient versus yaw angle with and without base flaps for Re = 1.1 and 6 million

Heavy Vehicle Systems Optimization Program FY 2003 Annual Report
15
devices. The basic truck geometry produced highlevels of drag at yaw angles greater than 4°. Theincrease in drag was eliminated with the addition ofthe side and roof extenders. The lowboy trailerproduced drag reduction on the order of 10% andwas comparable to the boattail plates. The base flapswere the most successful trailer modification andproduced drag reduction on the order of 15%. If thelowboy trailer is combined with the boat tails or baseflaps, the results are additive with a drag reductionof over 20%. Although there were some Reynoldsnumber effects, for the most part the effects weresmall and results were adequately predicted usingdata generated at lower Reynolds numbers.
A significant portion of the effort was expended ingathering the PIV data. This was the first time a PIVsystem was used in a pressurized facility, whichmade a complex system even more complicated [1].Although the 12-foot wind tunnel has better opticalaccess than most wind tunnels, the access that wasavailable created additional challenges for the PIVsystem. Significant changes in the flow fieldbetween the tractor and trailer are documented bythe PIV system in Figure 1 with and without the rearside extenders. The addition of the roof extenderprovided a slight improvement in the drag reductionto that provided by the side extenders.
Conclusions and Future ActivitiesTwo test entries were completed in the 12-footpressure wind tunnel to obtain the aerodynamic dataon the GCM. The results indicated limited Reynoldsnumber effects. The base flaps were the mosteffective drag reduction device for trailers tested.Trailer skirts produced some drag reduction but thelowboy trailer configuration was more effective.Side and roof extenders were effective drag reducersfor the tractor.
Future activities planned for FY04 includedocumentation of the test results and publish thedatabase for computational code validation support,begin experimental efforts for the evaluation ofwheel and wheel well aerodynamics for brakecooling and reduction of splash and spray, and beginexperimental efforts for the evaluation of coal caraerodynamics.
Reference1. J.T. Heineck, S.M. Walker, D.M. Yaste, “The
Development of a 3C-PIV System for the12-Foot Pressure Tunnel at NASA AmesResearch Center,” 20th International Congressfor Instrumentation Aerospace SimulationFacilities (ICASF), DLR Gottingen, August 25-29, 2003.

Heavy Vehicle Systems Optimization Program FY 2003 Annual Report
16
C. Experimental Measurement of the Flow Field of Heavy Trucks
Principal Investigator: F. BrowandCo-Investigators: M. Hammache and T.-Y. HsuAerospace & Mechanical Engineering, University of Southern CaliforniaRRB 203, Los Angeles CA 90089-1191(213) 740-5359; fax: (213)740-7774; [email protected]
Technology Development Manager: Sid Diamond(202) 586-8032; [email protected] Program Manager: Jules Routbort(630) 252-5065; [email protected]
Contractor: DOE Oakland Operations Office, Berkeley Site OfficeContract No.: DE-AC03-98EE50512
Objective• Improve the performance of heavy trucks by reducing aerodynamic drag.
Approach• Produce a smaller truck wake and a lower truck drag by providing for active flow control at the base of the
trailer utilizing an arrangement of base flaps.
• Evaluate the importance of the gap between tractor and trailer in producing drag.
Accomplishments• Wind tunnel tests of flow control device at trailer base document improvements in drag of ∆CD = .06-.08, or
about 13–14% for a modern truck.
• Wind tunnel flow field studies document the appearance of violent cross-gap flows under certain conditions.The cross-gap flow separates the flow along the side of the trailer and increases drag. Suggestions have beenmade to minimize this unwanted cross-gap flow.
Future Direction• Test for additional drag saving in wind tunnel models by increasing the strength of the active flow control.
• Perform over-the-road testing to verify drag savings for the base flap device.
• Initiate a program and a new testing apparatus to study wheel/tire splash and spray.
IntroductionThis report describes the progress we have made ontwo separate aerodynamic problems (a) reducing thebase drag of a tractor-trailer with a combination ofpassive and active control devices, and(b) describing the sensitivity of the drag to thegeometry of the gap between tractor and trailer.Included in this report is a description of work we
have completed, and work we will continue intoFY04.
Reducing Base DragThere are two general approaches for the reductionof base drag. One approach, we would term passivecontrol, is to alter the geometry of the base region insome way. Cooper shows that the drag coefficient

Heavy Vehicle Systems Optimization Program FY 2003 Annual Report
17
for a typical straight-sided truck at 0.78 can bereduced to a value on the order of 0.72 by the use ofthin plates attached along the edges of the trailerbase [1]. Further, Cooper demonstrates that theeffectiveness of the drag reduction increases withnon-dimensional flap length, l, defined as l =Lf/sqrt(A), where Lf is the flap length and A is thecross-sectional area of a truck. He points out thatmost of the drag reduction is accomplished for flaplength less than a value of approximately, l = 0.18.Flaps such as those studied by Cooper can be seen inFigure 1 installed on a model truck test in a windtunnel at NASA Ames.
The second approach is to seek additional dragreduction by means of an active forcing (such as anoscillating flap, or a blowing slot), meant to alter theboundary layer properties — usually to avoid anunwanted separation. Nishri and Wygnanski (1998)show that the effectiveness in delaying flowseparation is determined by the location of the jet,the frequency of the induced oscillation, the netmomentum flux coefficient, and the shape size of theslot. The frequency of the induced oscillation, f, isnon-dimensionalized by the flap length and free-
stream velocity, U∞. It is defined as∞
+ =U
Lf*F f . The
net oscillatory momentum flux coefficient, Cµ, is
defined as 2j
f
)UU
(*Lg*2C
∞µ = , where g is the slot
height, i.e., the gap between the flap and the sidewall, and Uj is the amplitude of the oscillatory jetfluctuation. Favorable delays in separation are
Figure 1. Base flaps (gold colored) mountedon back end of trailer (blue) in NASA’s 12-ftpressure wind tunnel
obtained for slot heights on the order of 1/3-1/2 ofthe incoming boundary layer displacement thickness,and for Cµ values less than 0.1%. The most effectivenon-dimensional frequencies appear to lie in therange F+ = 0.3–1.5.
Our approach encompasses both a modification ofthe base geometry by means of the addition of flat-panel flaps, and an additional active control bymeans of an oscillatory mass flow perturbationwithin the boundary layer meant to delay flowseparation over the surface of the flaps. The (flat)flaps are attached to the trailer base along the trailerbase edges, and are inclined to the free stream toclose the wake more efficiently.
The experiments utilizing oscillatory perturbationsare conducted in the Dryden wind tunnel at the USCGround Vehicle Aerodynamics Laboratory. Aroughly 1/15 scale model resembling a trailer isutilized for the study (see Figure 2). The model isfitted with a shaped nose-piece to ensure attachedflow over the forward portion of the model. Themodel is equipped with a force balance to measuredrag. The Reynolds numbers (based on the square-root of the model cross-sectional area), range from0.1 × 106 to 0.4 × 10⁶. A sine wave is chosen as theforcing function. The forcing frequency is zero orwithin the range 40–600 Hz. The corresponding non-dimensional frequencies are, F+ = 0, 0.17–3.93. Theoscillatory momentum flux coefficient, Cµ, rangesfrom 0 (no forcing) to 2%.
The present study has found that a simple, passivebase-flap deflection — no forcing — producessignificant drag saving. The effect of flap angle upondrag reduction is shown in Figure 3. The horizontalaxis represents the flap angle in degrees, and thevertical axis represents the change in dragcoefficient, ∆CD = CDnoflaps - CDflaps. A positive valueof ∆CD corresponds to a reduction in drag. Data isshown here from three widely different experiments— one performed in our wind tunnel, one testrecently performed in the 12-foot wind tunnel atNASA Ames, and Cooper’s original results. All ofthe ∆CD curves have a roughly similar shape. Dragsavings first increase and then decrease withincreasing flap angle. Thus there is an optimumangle for maximum drag saving. The maximumsaving is in the range ∆CD ≈ .06 - .08 for all three

Heavy Vehicle Systems Optimization Program FY 2003 Annual Report
18
(a)
(b)
Figure 2. USC model equipped with rounded nose and base flaps
Figure 3. Base drag improvements, expressedas a change in drag coefficient for three separateexperiments
experiments. The three separate tests areaccomplished in three different wind tunnels usingmodels of different geometry. The data thus suggesta robust drag saving that is neither particularlydependent upon the details of truck shape nor uponthe Reynolds number of operation. However, theangle for maximum saving does seem to dependupon Reynolds number. The optimum angle seems
to increase steadily from 9° to 12° at 0.3 × 10⁶ toperhaps 20° at 6 × 10⁶.
Now consider the addition of oscillatoryblowing/suction along the edges of the model base,coincident with the origin of the flap. The purpose ofthe oscillatory blowing/suction is to attempt tomaintain attached flow over the flap for larger flapdeflection angles, and thereby to further reduce drag.Figure 4 summarizes the best of our results. Thedrag coefficient difference, ∆CD, is shown for theshort flap length — with and without oscillatoryblowing. The experimental reliability is indicated bythe scatter of data points representing multiple trials.Blue curves are the no-force cases. The results inred, for a momentum coefficients of Cµ = 0.15% and2%, demonstrate the effectiveness of oscillatoryblowing/suction. There is a modest additional dragsaving at the higher flap angles, but the applicationof forcing has very little effect in the vicinity of peaksaving. Thus the peak saving is almost unchanged.The cause of this unexpected result is still underinvestigation. Examination of the forced andunforced results in the vicinity of 12° suggests thatthe momentum addition does delay the onset of

Heavy Vehicle Systems Optimization Program FY 2003 Annual Report
19
Figure 4. Effect of oscillatory forcing on dragdecrease
separation in some manner. However, we hadanticipated that in the presence of forcing anddelayed separation, the drag saving would continueto increase beyond the unforced peak at 9–12°.Rather, the demonstrated effect of forcing is tobroaden the peak region by extension to largerangles but not to increase the maximum value ofdrag saving.
The optimum forcing frequency definitely lies in therange F+ ≈ 0.27 that will effect flow modification,but that forcing amplitude is critical. We begin to seenoticeable change only at momentum coefficients onthe order of 10-3 or greater (Cµ ≥ 0.1%). Nishri &Wygnanski show observable increases in lift overdeflected flaps at momentum coefficients as small as0.01% [2]. Evidently drag reduction for a three-dimensional body such as ours is a much moresubtle proposition. The present results also show thatoscillatory momentum addition has little effect ondrag reduction unless the net oscillatory momentumflux coefficient is equal or greater than 0.1%.Increasing the oscillatory momentum perturbation toa coefficient value of 2% produces drag savings atangles greater than 9–12°, but has very little effectupon the maximum saving at 9–12°.
We are presently performing DPIV studies (DigitalParticle Image Velocimetry) of the flow adjacent tothe flap with and without the oscillatoryacoustic/blowing. The intent is to answer thequestion regarding the state of the boundary layerand the degree of attached/unattached flow present.The cases studied to date are the 0° and 12° flapangles. For the 0° flaps angle, the wake profiles
obtained from the ensemble average of 350 imagepairs suggest that there is no difference betweenforcing and non-forcing.
The preliminary data also suggests that the flow isattached up to flap angle equal to 12°. However,there is a small drag reduction at a 12° flap angle(see Figure 4), and this drag reduction is reflected inthe flow over the flap as seen by the detailed flowfield (DPIV) map shown in Figure 5. Velocitycontours are shown in the wake region justdownstream from the flap — blue for the unforcedcase, and red for the forced. The suggestion is thatthe wake is slight more narrow when oscillatoryforcing is present.
Follow-on experiments are planned to investigate alarger range of forcing amplitudes, and a varietyforcing-function duty cycles. In addition, DPIV willbe used to capture the detailed flow-field in thevicinity of the flap for all cases.
-0.06
-0.04
0
-0.02
0
0
0
0.04
0.02
0.02
0.02
0.06
0.06
0.06
0.1
0.08
0.12
0.1
0.26
0.14
0.18
0.34
0.24
0.28
0.38
0.38
0.4
0.54
0.52
0.6
0.7
0.76
0.76
0.9
0
0
0
00
0
0
0
0
0.1
0.1
0.1
0.1
0.2
0.2
0.2
0.3
0.3
0.3
0.4
0.4
0.4
0.5
0.5
0.5
0.5
0.6
0.6
0.7
0.7
0.7
0.8
0.8
0.9
Non-dimensional Steamwise Direction
Non
-dim
ensi
onal
Span
wis
eD
irect
ion
0 0.2 0.4
-0.3
-0.2
-0.1
0
0.1
0.2
0.3
U/Uinf
Figure 5. Contour plot of free-stream velocity in thewake region
Drag Rise Due to the Geometry of the GapBetween Tractor and TrailerThe second part of this report summarizes the windtunnel experiments on the aerodynamics of tractor-trailer models to show that the drag on the model issensitive to the width of the tractor-trailer gap (G),and to the angle of yaw with respect to winddirection. The measurements are performed at awind tunnel speed of approximately 26 m/s. Themodel Reynolds number for the tests, based upon thesquare root of the truck cross-sectional area, √A, isabout 310,000. Figure 6 shows both tractor and

Heavy Vehicle Systems Optimization Program FY 2003 Annual Report
20
trailer resting on an interior turntable in the groundplane. The turntable allows the models to be yawedwith respect to the flow direction.
Figure 6. Detail of turntable and traverse mechanisminside ground plane
The drag on the tractor and trailer, at zero-yaw, as afunction of gap width are plotted in Figure 7. In therange of G/√A of 0.1 to 0.5, the trailer experiencesless drag than the tractor, due to the shielding effect.As the gap opens up beyond approximately 0.5, thetotal drag rises rapidly to large values — most of theincreased drag is attributable to the trailer.
The DPIV measurement technique is adopted in thisexperiment to visualize and quantify the flow in thegap area. Whole-field velocity measurements areobtained for various combinations of gap width andangles of yaw, though the present discussion islimited to zero-yaw cases. A total of 350 instan-taneous realizations are acquired for eachcombination of gap and yaw, and for threehorizontal planes within the gap — a total of36 combinations. Changes of the flow structure
Figure 7. Drag coefficient versus gap length
within the gap region are investigated by performingvarious forms of conditional-averaging.
At low gap width, typically below G/√A ~ 0.5, theflow in the gap is turbulent, but steady in a broadsense — consisting of a re-circulating in the form ofa torus. As the gap increases, the flow in the gapbecomes highly unsteady with large cross-gap flowsthat alternate from side to side. An example of thisvariability is demonstrated in Figure 8. A certainfraction of the time, the flow behavior is describedby the left-hand portion of the picture labeledsymmetric. At other times, the flow exhibits a highlyasymmetric pattern and exits from one side of thegap. The mirror image of this state is also seen,although it is not illustrated here. These highlyasymmetric flow states produce large wake regionsalong the sides of the trailer, and signal the drag riseonset seen in Figure 8.
Figure 8. Ensemble-averaged streamline patterns of the flow in the gap at zero yaw,G/√A = 0.55; (a) symmetric flow, (b) asymmetric flow

Heavy Vehicle Systems Optimization Program FY 2003 Annual Report
21
The final figure describes the drag savings that canbe realized by arranging two truck-like models in atandem configuration. The truck-like models areeither “blunt” or “rounded.” Separately, the truckshapes have drag coefficients of approximately 0.94,and 0.51, respectively. Four tandem combinationsare possible from the two shapes, as depicted inFigure 9. The quantity plotted in Figure 9 is the totaldrag of the two trucks divided by their drag inisolation as a function of the separation between thetrucks. All of the curves should asymptote to unity atlarge values of separation. At small separations all ofthe four combinations experience a drag saving asone might anticipate. It is interesting — andunanticipated — that the degree of drag saving forthe pairs of trucks depends upon which truck leads!
Figure 9. The average drag of the two-truck platoon for all four configurations
References1. K.R. Cooper: The effect of front-edge rounding
and rear-edge shaping on the aerodynamic dragof bluff vehicles in ground proximity. SAEpaper No. 850288 (1985).
2. B. Nishri & I. Wygnanski, “Effects of PeriodicExcitation on Turbulent Flow Separation from aFlap,” AIAA Journal, Vol. 36, No. 4 (April1998).

Heavy Vehicle Systems Optimization Program FY 2003 Annual Report
22
D. Continued Development and Improvement of Pneumatic Heavy Vehicles
Principal Investigator: Robert J. EnglarGeorgia Tech Research Institute (GTRI)Atlanta, GA 30332-0844(770) 528-3222; fax: (770) 528-7077;[email protected]
Technology Development Manager: Sid Diamond(202) 586-8032; [email protected] Program Manager: Jules Routbort(630) 252-5065; [email protected]
Contractor: DOE – NNSA, NNSA Service Center,Oakland, CAContract No.: DE-AC03-02EE50691
Objective• Previous smaller-scale experimental evaluations at GTRI have demonstrated up to 15-18% reduction in
aerodynamic drag coefficient due to blowing (without consideration of the energy required to blow) and10-12% due to the device’s corner rounding for a combined drag reduction of 25-30%. We are continuing thedevelopment of this pneumatic aerodynamic technology for parasitic energy loss reduction, fuel economyimprovement, reduced emissions, and increased safety of operations for Heavy Vehicles (HV).
• Confirm these same benefits for Pneumatic Sports Utility Vehicles (PSUVs).
Approach• Enhance the pneumatic aerodynamic capabilities of existing wind-tunnel and full-scale HV test
models/vehicles, and then modify them to improve the drag-reduction properties exhibited during our Phase I ofSAE Type-II fuel economy on-track testing.
• Identify pneumatic aerodynamic and geometry improvements to increase fuel economy by an additional factorof 2 to 4 over that exhibited in full-scale HV track tests.
• Conduct full-scale wind-tunnel development of Pneumatic SUVs with blowing applied to reduce drag; increasebraking; increase traction; and improve stability and control.
Accomplishments• New wind-tunnel tests have shown blowing produces drag reductions due to both aft flow separation
elimination and base pressure recovery. New tests also demonstrated that active blowing control can increasedrag and also reduce side-wind effects showing that the device has the potential to help braking and safety ofoperation for both pneumatic HVs and SUVs.
• Improvements needed for the Phase II full-scale PHV track test have been identified; new tunnel model isdesigned and being constructed to test in GTRI tunnel and confirm these before test vehicle modifications.
• Design of full-scale PHV Phase II test vehicle based on these results is underway. These tests will be used toconfirm the reduction in drag measured in wind tunnel tests. The energy required to blow the air will bemeasured.

Heavy Vehicle Systems Optimization Program FY 2003 Annual Report
23
Future Direction• Conduct Phase II of on-road full-scale HV testing and demonstrations of pneumatic aerodynamic drag-
reduction, fuel-economy and safety of operation techniques to provide a confirming database allowingapplication of this technology to operational heavy vehicles and SUVs.
IntroductionSince aerodynamic drag is the major component ofHeavy Vehicle (HV) resistance at highway speedand thus their related fuel economy, GTRI has beenapplying advanced aircraft aerodynamic technologyusing blowing to reduce that drag generation ongenerally-bluff high-drag vehicles. Using thepneumatic aerodynamic technology known asCirculation Control [1] and certain trailer and gapgeometry changes, we have been able to reduce dragcoefficient (CD) on HV models by up to 15-18%reduction in aerodynamic drag coefficient due toblowing and 10-12% due to the device’s cornerrounding, for a total of 25-30% during a 4-yeartunnel test program for DOE [2]. Of furtheradvantage, we could also increase drag as needed forbraking during downhill operation by rapidlyblowing select trailing edge surfaces on the trailerwithout any moving parts, or could potentially alsoreduce the huge drag increase and loss of stabilitywhich occur when an HV experiences side winds orgusts. This multi-function potential of the blownconfigurations is seen in the wind tunnel data shownof Figure 1.
Full-scale fuel economy tests were conducted [3] atthe beginning of the current 2-year DOE program.Whereas preliminary tuning tests showed unofficialFuel Economy Increase (%FEI) of over 15%, theSAE Type-II official test-track results on asomewhat different Pneumatic HV (PHV)configuration showed maximum %FEI of only 5% -6%, not accounting for energy use for blowing. Thecurrent program has thus concentrated on:determining the difference between wind-tunnelresults and the less-than-expected full-scaleperformance; correcting the blown configuration;and preparing for a second fuel economy evaluationwith the improved PHV vehicle. It is noted here thatthe present DOE program does not corresponddirectly to FY03. Funding for year-long Phase Vdiscussed below started 7/14/2002, and Phase VI(FY 03 funding) was not initiated until May 29,2003. The recent results of both Phases are presented
0.40
0.45
0.50
0.55
0.60
0.65
0.70
0.75
0.80
0.85
CD
0.00 0.02 0.04 0.06 0.08 0.10 0.12 0.14 0.16 0.18 0.20Momentum Coefficient, Cµ
Blown Heavy Vehicle Drag Modifications,Wheels on,q=11.86 psf, V=70 mph, ψ=0°, α=0°
CD=0.627
CD=0.824
Top & Bottom Slots Only=Drag Increase for Braking
All 4 Slots Blown=Drag Reduction
Faired UnblownBaseline,No Gap, Square LE+TE
Unblown Baseline,Unfaired, Full Gap
2 Side Slots Only=Anti-Yaw for Stability
Blown Truck,Low Cab,No Gap, Round LE,0.375"R, Plates
0.5 psig1.0 psig
∆CD due to Gap
∆CD due to RoundedLE & TE
Figure 1. Drag reduction or drag increase demonstratedby GTRI model PHV, depending on blowing location
as FY03 results for PHVs and for Pneumatic SportsUtility Vehicles in the following sections becausethey occurred in FY03.
Experimental Details and ResultsExperimental wind-tunnel developments of thistechnology conducted on smaller-scale PHV modelunder previous DOE funding [2,3,4] led to two full-scale Tuning Tests conducted at Volvo Truck’sfacilities, plus an SAE Type-II Fuel Economy Testconducted at the 7.5-mile test track at TransportationResearch Center in Ohio, with the results reportedabove. Since this drag reduction and the fueleconomy increase were less on the test PHV vehiclethan the tunnel data predicted, we returned to thetunnel to determine the reasons. The generic tunnelmodel was modified so that it more closelyresembled the “more-draggy” full-scale test article,and then re-tested. Then, implicated componentsfrom the track-test vehicle were corrected and themodel re-tested each time. Figure 2 shows howcorrection of each component on the track-test PHVreduced the CD below that of the unblown Baseline

Heavy Vehicle Systems Optimization Program FY 2003 Annual Report
24
reference truck (Run 36). Run 239’s configuration ismost like our TRC blown test truck. Figure 3 showsthe drag reductions that would occur for this testtruck if these less-than-optimum geometries werecorrected, and then Figure 4 shows the increases infuel economy projected for highway speeds (wheredrag is half or more of total resistance) relative to theBaseline truck if these items were revised. Results
0.40
0.45
0.50
0.55
0.60
0.65
0.70
0.75
0.80
0.85
CD
0.00 0.02 0.04 0.06 0.08 0.10 0.12 0.14 0.16
Momentum Coefficient, Cµ
Blown Vehicles: 4 Slots, Wheels On; V=70mph, ψ=0°, α=0°, Phase III
Run 36, Ph. I, Unblown Baseline , Low Cab, FullOpen Gap, Sq. LE & TE, No Fairings, C D=0.824
Run 239, Hi Cab, Full Gap, Cab Extenders, 1/2 " Plate Removed from Blown TE
Run 209=207, Aft Step Cutout on Lower Fairing
Run 210=209 Full Gap, Cab Extenders, Same Fairings as R209
Run 207=205, Add Full Lower Fairingwith Aft Wedges
Run 205, Low Cab, No Gap, All4 slots Blown, Round LE, BestBlown Ph. II Config.
Target C µ atTRC tests
Gap-inducedProblems
Problemsfor Lower Aft Blowing
BEST
Figure 2. Tunnel results: drag changes with modelcorrection and also with blowing variation
-50
-45
-40
-35
-30
-25
-20
-15
-10
-5
0
5
10
15
%CD
36 239 210 209 207 205Test Run No.
Run 239, Hi Cab, FullGap, Cab Extenders,Lower Wheel Fairingsw/Aft Step= Most LikePHV Test Vehicle
Run 209= R210with No Gap & NoCab Extenders
Run 207=R209 withWedge Fairings onLower Aft Fairing
Run 205=R207 with NoLower Fairings, No Cab Gap=Best Blown Configuration
Cµ= 0.0
Cµ=0.065
Cµ= 0.0
Cµ=0.065
Notes:%CD=(CDref -CD)/ CDref , where CDref = C D for Unblown R36 All Configs except R205 & R36 have Lower Surface Fairing
Run 36, Lo Cab,Full Gap, NoFairings, Sq LE&TE = Most LikeUnblown Baseline
Run 210= R239with Low Cab &Cab Extenders
Figure 3. Incremental drag changes relative to theunblown baseline configuration of Figure 2
0
5
10
15
20
25
30
%FEI
36 239 210 209 207 205
Test Run No.
%FEI, Cµ=0.065
%FEI, Cµ = 0.0
Run 239, Hi Cab,Full Gap, CabExtenders, LowerWheel Fairingsw/Aft Step= MostLike PH V testVehicle
Run 210=R239with Low Cab &Cab Extenders
Run 209= R210with No Cab Gap &No Cab Extenders
Run 207=R209 withWedge Fairings onLower Aft Fairing
Run 205=R207 with No LowerFairings, No Cab Gap= BestBlown Configuration
Cµ= 0.0
Cµ=0.065
Cµ= 0.0
Notes:%FEI=0.5*100*( CDref -CD)/ CDref , C Dref =CD for R36, UnblownAll Configs except R205 &R36 have Lower Surface Fairing
Cµ=0.065Run 36, Lo Cab,
Full Gap, Sq.LE&TE, NoFairings =MostLik e UnblownBaseline
Figure 4. Resulting fuel efficiency increase withconfiguration and blowing variations
show fuel economy increases (%FEI) of up to 16%for the unblown PHV geometry, and up to 23% forthe blown vehicle at test Cµ. This indicates a 7%FEI for blowing without considering geometrymodifications which provides a slightly better resultthan the recent on-track results of 5-6% FEI, andthus these data provide a guide towards redesign ofthe test vehicle for an improved low-drag PHVtruck.
An important finding in this data is the effect of thegap between the tractor and trailer. Figure 5 showsour PHV test vehicle, which even with its cabextenders, still has an obvious gap. Note inFigures 2, 3, and 4 the adverse effect of a gapdiscontinuity on the small scale model. Anappropriate gap side plate was developed. Tunneltest results, Figure 6, show this simple but feasibledevice to be nearly as effective in eliminating thegap disruption as a non-feasible solid gap (“NOGap”). Note the continued drag reduction occurringwith additional leading-edge (LE) blowingincorporated with these gap plates.
Figure 5. PHV test vehicle with gap between tractor andthe trailer

Heavy Vehicle Systems Optimization Program FY 2003 Annual Report
25
0.3
0.35
0.4
0.45
0.5
0.55
0.6
0.65
CD
0 0.05 0.1 0.15 0.2 0.25 0.3 0.35 0.4 0.45
Momentun Coefficient, Cµ
Blown HV Drag Reductions, Gap Plates and LE Blowing,Circular Arc TE, 90°/30° 1/2" plate TE, 4-Slot TE BlowingWheels On, q=11.9 psf, V=70 mph, ψ=0°, α=0°
Low Cab, Gap Plates, RoundLE with Top Slot Blowing
Low Cab, NO Gap (filled),Round LE, No Blowing onRound Top LE
Figure 6. A practical solution for gap separation: GapSide Plate
In addition to drag reduction due to elimination ofaft flow separation, two other improvements wereshown during these recent tunnel tests. Blowing onthe aft trailer corners converted the suction on the aftdoors (a drag component) into overpressure there (adrag reduction = a “push”). Figure 7 confirms this(+Cp is pressure), as does integration of the reardoor pressure force to yield negative incrementaldrag components produced by blowing. Up until thehigher values of blowing coefficient Cµ, theincremental CD values due to the blowingoverpressures are greater than the total Cµexpended. Additional ∆CD still missing from theseblowing gains are drag reductions due to flow-separation prevention (not shown here).
Blowing on only one vertical slot of the trailer hasbeen shown experimentally to dramatically reducedrag experienced during a side wind (yaw), it alsocould produce aft side force to counteractdestabilizing yawing moment, and thus possiblyyield directional control. Figure 8 shows how theunstable yawing moment, CN, at Cµ=0 during nose-left yaw of the small-scale model can be reduced tozero by blowing the aft left side slot, and then astabilizing opposite moment can be generated byslightly increasing left-slot blowing.
Figure 7. Static pressure recovery on back doors due toblowing
Cµ ∆CD from Base Pressure0.00 0.0000.023 - 0.0340.042 - 0.0520.059 - 0.0600.083 - 0.0750.121 - 0.114
-2.5
-2.0
-1.5
-1.0
-0.5
0.0
0.5
1.0
1.5
2.0
2.5
3.0
3.5
4.0
4.5
CN
50,
Hal
f Cho
rd Y
awin
g M
omen
t
0.00 0.02 0.04 0.06 0.08 0.10 0.12 0.14 0.16 0.18 0.20
Momentum Coefficient, C µ
Blown Heavy Vehicle Yaw Characteristics 90°/30° 1/2" TE , 0.375"Rα=0°, Wheels ON, Left Slot Blowing Only
Nose Right
Nose Left
ψ=-8°, Nose Yawed Left
ψ=0°, Nose Straight Ahead
Yawing Moment Trimmedby Blowing
Blowing Produces ExcessYaw in Opposite Direction
Figure 8. Directional control capability from blowing onleft side slot only

Heavy Vehicle Systems Optimization Program FY 2003 Annual Report
26
0.0
10.0
20.0
30.0
40.0
50.0
60.0
70.0
80.0
90.0
100.0
110.0
120.0
130.0
140.0
150.0
160.0
BGY
1970 1975 1980 1985 1990 1995 2000 2005 2010 2015 2020Year
(Source: Refs. 12 and 13)
Total Fuel Consumed
Domestic Oil Production
Autos
Light Trucks, SUVs(Class 1&2a)
Heavy Trucks (Class 2b-8) & Buses (No Military Vehicles)Report Date
"Gap"
BGY=Billions of Gallons per Year
Figure 9. Highway energy usage comparisons byvehicle type (from DOE [5])
Realizing that drag reduction may be even moreimportant for Sports Utility Vehicles (SUVs) thanHVs (see Figure 9 DOE fuel usage data, from [5]),we conducted full-scale wind tunnel development ofthis pneumatic technology applied to a GMSuburban SUV, Figure 10. With a variety of blowingconfigurations tested, we showed in Figure 11 thatblowing could either reduce drag for fuel efficiencyor could increase drag for braking. We alsoconfirmed again that blowing only one side slotcould effect drag and yaw during high side-windangles, as Figure 12 shows. The restoration ofdirectional stability using no moving surfaces is thusverified.
DiscussionThe above wind-tunnel tests to identify reasons forthe less-than-expected drag reduction on the full-scale PHV road test vehicle have determined anumber of configuration improvements needed inthe blowing geometries, the trailer under-sidefairings and the tractor-trailer gap. These, whencorrected, should yield the earlier-recorded small-scale model drag reductions of up to 18% reductionin aerodynamic drag coefficient due to blowing(without consideration of the energy to blow) and10–12% due to the device’s corner rounding, for atotal of 25–30%. We have incorporated these intothe design of a next-generation smaller-scale PHVtunnel model that now incorporates a genericcurrent-day tractor geometry, Figure 13. This new
Figure 10. Tufts showing blowing and jet turning onPSUV in Lockheed wind tunnel
0.44
0.46
0.48
0.50
0.52
0.54
0.56
CD
0 0.01 0.02 0.03 0.04 0.05 0.06 0.07 0.08
Momentum Coefficient, Cµ
Pneumatic SUV Drag Variation with Blowing, V=50mph
45° Top, Bottom & Lower Sides; 90° Upper Sides
45° Top & Bottom; 90° Sides
180° All 4 Sides
45° All Sides
Figure 11. PSUV drag coefficient changes due toblowing on various configurations
model (CAD details of which are available butdrawings are too large to include herein) includesnew blown trailing-edge geometries to yield higherbase pressure recovery, no lower surface fairings,and other more realistic under-trailer and wheelgeometries. A new mounting strut is now from thetop of the model so that interaction between thewheels, lower surface geometries and the road canbe properly simulated. We will test this new PHVconfiguration in the GTRI Model Test Facilitytunnel for comparison to the previous model

Heavy Vehicle Systems Optimization Program FY 2003 Annual Report
27
-0.01
0
0.01
0.02
0.03
0.04
0.05
0.06
0.07
0.08
0.09
Cyaw
0 0.01 0.02 0.03 0.04 0.05 0.06
Left Slot Momentum Coefficient, Cmu
PSUV Aero Data, LSWT Test 1853, Run 17, Left Side Slot ONLY, Cmu Sweep, V=50 mph, All Turning Corners are 45°
NoseRight Cyaw required to offset ψ=-15° unblown
Cyaw required to offset ψ=-10° unblown
Cyaw required to offset ψ=-5° unblown
Figure 12. PSUV drag coefficient changes due toblowing on various configurations
Figure 13. Generic Conventional Model (GCM) tractorto be included with new GTRI PHV test model
performance and to estimate new full-scale PHVperformance. This data will include many of the realvehicle protrusions (such as struts, differentials,floor spars, etc.) that could easily be detrimental tofull-scale performance and fuel economy. Testresults are to be incorporated into modification ofthe real test vehicle (see Figure 5) into the best-performing blown configuration in preparation for aPhase II SAE fuel economy test program for thePHV and baseline trailer in FY04.
The full-scale wind tunnel results for the PneumaticSUV confirmed both drag reduction, yaw control,stability restoration and braking increase. These full-scale aerodynamic stability and control results arevirtually impossible to determine during road tests,
so these PSUV tests provide invaluable data forstability & control, and safety for SUVs. We realizethat we have not yet optimized the blowinggeometries on the contoured back surfaces of theSUV (far more complex than the square-edged HVtrailer aft end) and that future work is needed here.However, as Figure 9 verifies, the sheer number ofSUVs and pickup trucks on the American roadsmake this drag-reduction effort quite important, asdoes the promise of improved stability and brakingfor vehicles frequently in need of both.
ConclusionsTo advance the state of development of pneumaticaerodynamics for improvement of HV and SUVdrag reduction, fuel economy, braking, stability andsafety of operation, GTRI and its team membershave continued in FY03 our previous program forDOE. We have conducted investigations for bothmodel-scale wind tunnel and full-scale test trackHVs and full-scale tunnel investigations on an SUVof these advanced capabilities, as well as to identifyand correct aerodynamic problems areas on our firstfuel-economy test on a full-scale Pneumatic HeavyVehicle. Results of this recent effort include:
• We have identified the aero problem areas of ourfirst PHV road test and how to correct these;current indications are that drag reductions of14% and fuel economy increases of 7% areprojected to result for these new configurationsat highway speeds due to blowing alone.Geometric modifications will also increase dragreduction.
• A new model test configuration based on currentgeneric tractor geometry and the above resultshas been designed, the upcoming tunnel testingat GTRI of which will provide the guidance formodification of the full-scale PHV test vehicle.
• Full-scale tunnel testing of pneumaticaerodynamics on an SUV has verified pneumaticdrag reduction, directional stability, and theversatility of these blown no-moving-part,performance-enhancing, economy-increasing,and stability devices to improve the operation ofSUVs. These results now lead to re-design andmodification of the PHV road-test vehicle in

Heavy Vehicle Systems Optimization Program FY 2003 Annual Report
28
preparation for the Phase II SAE Type-II fueleconomy test scheduled for FY04.
References1. Englar, Robert J., "Circulation Control
Pneumatic Aerodynamics: Blown Force andMoment Augmentation and Modification; Past,Present and Future," AIAA Paper 2000-2541,Denver, CO, June 19–22, 2000.
2. Englar, Robert J., “Advanced AerodynamicDevices to Improve the Performance,Economics, Handling and Safety of HeavyVehicles,” SAE Paper 2001-01-2072,Washington, D.C., May 14–16, 2001.
3. Englar, R.J. “Pneumatic Heavy VehicleAerodynamic Drag Reduction, SafetyEnhancement, and Performance Improvement,”in the Proceedings of the UEF Conference on“The Aerodynamics of HeavyVehicles: Trucks,Buses, and Trains”, Monterey-Pacific-Grove,CA, Dec. 2–6, 2002.
4. Englar, Robert J. “Drag Reduction, SafetyEnhancement and Performance Improvement forHeavy Vehicles and SUVs Using AdvancedPneumatic Aerodynamic Technology,” SAEPaper 2003-01-3378, accepted and to bepresented November 10–12, 2003.
5. “EIA Annual Energy Outlook 2000,” DOE/EIA-0383 (2000), December 1999 and “AEO 2001.”

Heavy Vehicle Systems Optimization Program FY 2003 Annual Report
29
E. Computational and Experimental Investigation of Drag-Reducing Add-onDevices and the Flow Field around a Simplified Tractor-Trailer Geometry
Principal Investigator: K. SalariCo-Investigators: J. Ortega, R. McCallenLawrence Livermore National LaboratoryP.O. Box 808, Livermore, CA 94551-0808(925) 423-0958; [email protected]
Technology Development Manager: Sid Diamond(202) 586-8032; [email protected] Program Manager: Jules Routbort(630) 252-5065; [email protected]
Contractor: Lawrence Livermore National LaboratoryContract No.: W-7405-ENG-48
Objective• Increase the fuel economy of class 8 tractor-trailers by reducing the aerodynamic drag.
• Identify and to understand the key flow structures around the vehicle that significantly impact the aerodynamicdrag.
• Investigate the capability of modern computational tools to predict the flow field around a tractor-trailer typegeometry, in the wake of the trailer, in the underbody, and in the gap between the tractor and the trailer.
• Design new add-on devices that significantly reduce aerodynamic drag for class 8 tractor-trailers achieved bysmall-scale wind tunnel tests supported by computational modeling and simulation.
• Present a list of effective drag-reducing add-on devices to the OEM’s for further full-scale testing.
Approach• LLNL is developing and utilizing state-of-the-art numerical algorithms and advanced turbulence models to
create computational tools that can accurately predict the complex flow field around modern tractor-trailer typegeometries. Significant emphasis is placed on validation calculation to ensure proper evaluation of thecomputational results compared to experimental data.
• Investigate key flow structures, such as trailer wake, the gap flow between the tractor and the trailer, andunderbody, which significantly impact the aerodynamic drag of heavy vehicles. This is accomplished throughuse of careful discovery and validation experiments and computational modeling and simulation of the complexflow field around these vehicles.
• Three truck-like geometries, GTS, USC modified GTS, and GCM, are used to investigate the predictivebehavior of various numerical approaches and turbulence models. These models represent simple to moderntractor-trailer geometries, with the GCM representing a realistic/modern model.
• Discovery experiments at NASA Ames’s small-scale 3' × 4' wind tunnel provide a mechanism to study theeffectiveness of LLNL proposed drag reducing add-on devices.
• Given the knowledge obtained from the discovery experiment and computational simulations for the flowstructures in the wake of the trailer, underbody, and the gap, new add-on devices can be designed to reduceaerodynamic drag of the class 8 tractor-trailer.

Heavy Vehicle Systems Optimization Program FY 2003 Annual Report
30
Accomplishments• The steady and unsteady turbulent flow fields around a tractor-trailer geometry have been successfully
simulated with emphasis on the wake of the trailer, underbody, and the gap flow structure
- LLNL completed simulations at 0° and 10° yaw for GTS geometry with three different turbulence modelsfor a total of nine runs. The predicted result for each turbulence model is compared to the experimental dataof NASA Ames’s 7' × 10' wind tunnel. A detailed study was conducted to investigate the sensitivity of thesolution to grid resolution around sharp corners and in the vicinity of the separated region.
- Completed unsteady gap flow simulation for USC modified GTS model using a coarse mesh (6.2 millionelements). Unsteady results are compared to USC experimental data.
- The LLNL add-on device for the gap was successfully simulated with the USC modified GTS geometry.The new add-on device stabilizes the unsteady flow in the gap and, in turn, potentially reduces theaerodynamic drag.
• New LLNL drag reducing add-on devices have been designed based on the ascertained knowledge of the flowfield from the experimental investigation and computational simulations. Five records of invention for newLLNL add-on devices have been filed.
• Experimental discovery is underway at NASA Ames to determine the effectiveness of the proposed new add-ondevices and to investigate the complex flow field around the vehicle.
Future Direction• Continue with development of the predictive modeling capability through use of the state-of-the-art turbulence
modeling and numerical algorithms to simulate the complex flow field around the class 8 tractor-trailer.
• A new hybrid RANS/LES turbulence model is under development that could improve the accuracy of the flowfield prediction around the heavy vehicle.
• Continue with testing the proposed LLNL add-on devices to reduce the aerodynamic drag of heavy vehiclesthrough the discovery experiments.
• Present a list of effective add-on devices to OEM’s for further full-scale testing.
• Investigate the aerodynamics of wheels and wheel wells for brake cooling.
• Investigate the aerodynamics of coal rail cars.
• Investigate the aerodynamics of underbody/wheel splash and spray.
SummaryThe LLNL activities for FY03 includecomputational modeling and simulation, design ofdrag reducing add-on devices, and performingdiscovery experiments at the NASA Ames facility.The LLNL goal for the computational effort is toprovide guidance on drag reduction strategies thatcould be implemented with add-on devices. This isaccomplished by utilizing the computational resultsto provide insight into the flow structures that havebeen identified as key to reducing the aerodynamicdrag of heavy vehicles. The focus of the design ofadd-on devices is to improve or stabilize theturbulent unsteady flow field in the gap, the wake,and the underbody of the vehicle to reduce theaerodynamic drag. The focus of the experimental
effort is to provide detailed information on variousLLNL proposed drag reduction concepts. There arethree geometries under investigation, GTS, USCmodified GTS, and GCM (Figure 1). Thesegeometries represent simple to modern tractor-trailermodels with GCM representing a realistic/moderntractor-trailer geometry.
Significant emphasis is placed on validationcalculation to ensure proper evaluation of thecomputational results compared to experimentaldata. The validation calculation requires modeling asection of the NASA Ames’s 7' × 10' wind tunneland properly matching the flow condition in the testsection of the tunnel to the experimental data. Theboundary layer profile and static pressure at the

Heavy Vehicle Systems Optimization Program FY 2003 Annual Report
31
Figure 1. Generic Conventional Model (GCM)
wind tunnel test section are typically used toproperly set the inflow and outflow to thecomputational domain. The advantage of thisapproach is to use the raw or unmodifiedexperimental data to validate the computationalresults. This is a requirement for performing thevalidation calculation.
Steady and unsteady RANS simulations areperformed to model the complex flow field aroundthe vehicle, in the gap between the tractor and thetrailer, and the trailer wake. The experimental dataof USC and NASA are used to benchmark andvalidate the computational results. The small-scale3' × 4' wind tunnel at NASA Ames is providing aninexpensive and flexible way to fully investigate theselected drag reduction devices using the USCmodified GTS model. The goal for the experimentalinvestigation is to identify one or two add-ondevices that clearly standout from other known andeffective drag reducing devices.
Computational SimulationsFlow simulation of the GTS model at 0° and 10°yaw in the NASA Ames’s 7' × 10' wind tunnel andthe modified GTS with the non-dimensional gapdistance of 0.72 at 0° yaw in the USC tunnel arecompleted. Steady and unsteady RANS flowsimulations are performed with NASA’s Overflowcode that uses overset grids.
For all GTS simulations in the NASA wind tunnel,the flow condition is obtained from the availableexperimental data, run 7 point 9. The following flowconditions were provided for this run: Mach number0.28, Reynolds number 2.08 × 10⁶ (based on trailerwidth), total pressure 102649.2 N/m2, totaltemperature 284.5 °K, static pressure 97339.1 N/m2,
static temperature 280.2 °K, and air density1.206 kg/m3.
The following simulations have been completed forGTS geometry:
• 0° and 10° yaw.• Three turbulence models, 1-equation model of
Spalart-Allmaras (SA), two-equation models ofWilcox k-ω and Menter SST.
• Two-grid sizes of 3.7 and 12.2 million elements.
Figure 2 shows a complex flow field with multiplevortical structures and a separation bubble at theleeward side of the vehicle highlighted by particletraces around the GTS geometry at 10° yaw in theNASA Ames’s 7' × 10' wind tunnel.
Figure 2. Particle traces are colored by velocitymagnitude, 10° yaw, and GTS model
Table 1 shows the computed drag coefficient and theexperimentally measured drag values. The subscriptW refers to the static pressure measured on the test-section tunnel wall and the subscript R refers to thestatic pressure measured upstream of the test section[1]. The drag coefficients obtained from thesimulations are based on the dynamic pressurecalculated using the test section dynamic pressure.All turbulence models have similar prediction forviscous drag; however, the SA and SST modelssignificantly over-predict the pressure drag.Similarly, the Wilcox k-ω model over predicts thepressure drag, but provides a drag coefficient closestto the experimental value. All tested RANSturbulence models have difficulty with predictingthe correct pressure drag. Since the trailer wake hasa significant influence on the pressure drag, thissuggests that RANS turbulence models could havedifficulty predicting the correct flow structure in thewake of the trailer. Previous simulations on the GTS

Heavy Vehicle Systems Optimization Program FY 2003 Annual Report
32
geometry using the SA model are presented in [2].This work includes careful investigation of theinfluence of grid resolution and inflow and outflowboundary conditions on the predictive capability ofthe SA model. Similar results are reported on theaerodynamic forces.
Table 1. Computed aerodynamic forces, GTSmodel, 0° yaw, coarse grid (cg), and medium grid(mg)
Drag Viscous Pressure Totalk-ω, cg 0.103 0.188 0.290k-ω, mg 0.101 0.176 0.277SST, cg 0.091 0.273 0.364SST,mg 0.092 0.258 0.350SA, mg 0.096 0.294 0.390NASA Experiment, CD,W 0.249NASA Experiment, CD,R 0.263
Figure 3 shows a velocity vector field in the wake ofthe GTS trailer at the symmetry plane with SSTturbulence model. Figure 4 shows the time-averagedPIV data from NASA Ames at the same cut plane asthat in Figure 3. In the experimental data, there is adominant recirculation zone at the lower base of thetrailer. On the other hand, there are two similarlysized recirculation zones on the lower and the upperpart of the base of the trailer in the computationalresult. Noticeably, the flow structures in thecomputational result do not match that of theexperimental PIV data and, hence, this differencemay explain the disagreement in the predicted drag.The Wilcox k-ω model has a similar wake predictionas that of the SST model; however, the SA modelpredicts a much smaller wake size with twosymmetric recirculation zones at the lower and theupper part of the base of the trailer.
The RANS models used in this study did areasonable job in predicting the pressure and skinfriction distributions on the surface of the GTS.However, if absolute drag and predicting the wakeflow structure is of interest, other turbulence moresophisticated turbulence models should beinvestigated.
Figure 3. Wake flow structure, SST model, 0° yaw,symmetry plane, GTS model
x/W
y/W
7.6 7.8 8 8.2 8.4 8.6 8.8 9 9.2
0
0.2
0.4
0.6
0.8
1
1.2
1.4
Experiment: NASA AmesVertical Streamwise Cut: z/W = 0
Figure 4. Wake flow structure, NASA time averagedPIV data, 0° yaw, symmetry plane, GTS model
Table 2 shows the computed lift, drag, and side forcecoefficients for the 10° yaw case and theexperimentally measured values. The Wilcox k-ωand the Menter SST model have problems inpredicting the lift coefficient. Similarly, thepredicated drag coefficient is off significantly.However, both turbulence models have a betterprediction for the side force. Note that there exists asignificant flow separation (Figure 5) at the leewardside of the GTS model. This type of flow separationposes a challenge for the RANS turbulence model.

Heavy Vehicle Systems Optimization Program FY 2003 Annual Report
33
Table 2. Computed aerodynamic forces, GTS model, 10°yaw, coarse grid (cg), and medium grid (mg)
Lift Drag Sidek-ω, mg -0.004 0.581 1.127SST, cg 0.006 0.651 1.129SST, mg -0.010 0.664 1.137Exp, CD,W 0.021 0.292 1.253Exp, CD,R 0.022 0.312 1.338
Figure 5. 10° yaw, velocity magnitudecontours, half height cut plane, SST model,GTS geometry
Figure 6 shows the vortex cores that are present inthis complex flow field. The presence of multiplevortex cores on the top surface of the GTSgeometry, suggest multiple separation andreattachment lines. Similarly, a dominant vortex ispresent on the leeward side of the GTS that extendsthe length of the trailer. The position of theseseparation and reattachment lines can be comparedto that of the NASA experimental data.
Figure 6. Vortex core positions, 10° yaw, SST model,GTS geometry
Unsteady RANS simulations are conducted on theUSC modified GTS geometry with a normalized gapdistance of 0.72, which is above the critical gapdistance of 0.5. At this gap distance, the flowexperiences unsteadiness and could have multiplestable modes that are either symmetric orasymmetric. Also, the drag contribution from the
gap flow significantly increases due to this unsteadybehavior. Low drag for the gap relates to stablesymmetric flow and high drag relates to the unsteadyasymmetric flow. Figure 7 presents a snapshot of theunsteady flow field around the modified GTS modelhighlighted by particle traces colored by velocitymagnitude. This figure shows the external flowreaching into the gap and exiting on the side. This isthe typical unsteady asymmetric flow representing ahigh drag situation.
The gap flow also significantly interacts with theexternal flow and the wake of the trailer as shown inFigures 8 and 9. This suggests that previousinvestigations [3], which isolated the base of thetrailer for reasons of reducing the size of thecomputational domain, may not properly capture theunsteady turbulent flow in the wake.
The unsteady RANS simulation conducted withOverflow is capturing the symmetric andasymmetric flow field in the gap as shown inFigure 10. This figure compares the computedresults with the USC experimental data. A simplesplitter plate was introduced in the gap and shown inFigures 11 and 12 to stabilize the gap flow. Thisdevice will be further investigated by USC as apossible drag reducing add-on device for the gap.
Figure 7. Particle traces colored by velocitymagnitude, 0° yaw, k-ω model, modified GTSgeometry with 0.72 gap size
Discovery ExperimentThe goal of our discovery experiment in the small-scale NASA Ames 3' × 4' wind tunnel is to providean inexpensive and flexible means of testing andexploring various LLNL drag reduction concepts forheavy vehicles. The construction of the 1/16 scaledwind tunnel model which is similar to the USCmodified GTS and the proposed LLNL add-on

Heavy Vehicle Systems Optimization Program FY 2003 Annual Report
34
Figure 8. Velocity magnitude contours, 0°yaw, k-ω model, modified GTS geometrywith 0.72 gap size
Figure 9. Velocity magnitude contours, 0°yaw, k-ω model, modified GTS geometry with0.72 gap size
a) Computation (left image), USC experiment (right image), symmetric condition
b) Computation (left image), USC experiment (right image), asymmetric condition
Figure 10. Comparison of computed and USC experimental data at the gap mid-height, 0° yaw, k-ω model, modifiedGTS geometry with 0.72 gap size

Heavy Vehicle Systems Optimization Program FY 2003 Annual Report
35
Figure 11 Add-on device (splitter plate) to stabilize thegap flow
Figure 12. Velocity vector field in the gap in thepresence of the splitter plate, mid-height, 0° yaw,k-ω model, modified GTS geometry with 0.72 gapsize
devices have been completed. The initial flowvisualization about the modified GTS indicates flowseparation on the side and the top of the tractor(Figure 13). It is crucial to minimize the flowseparation since it could adversely impact theevaluation of add-on devices. The flow separationsare minimized by tripping the flow. The overall flowstructure around the modified GTS model iscomplex with 3-D flow patterns on the downstreamside of the tractor under yaw conditions. The trailertop and downstream side have recirculation zonesthat cover a significant portion of the trailer.Currently, force and moment measurements arebeing obtained for the baseline configuration withand without add-on drag reducing devices.
Figure 13. 1/16-scaled wind tunnel modelsimilar to USC modified GTS geometry
ConclusionsThe steady and unsteady turbulent flow around theGTS and USC modified GTS was successfullycompleted. The RANS turbulence models at 0° yaw,excluding the wake, performed reasonably well inpredicting the surface properties and the overall flowbehavior around the vehicle. The steady RANSturbulence models had difficulty capturing the rightflow structure in the wake of the trailer. Moresophisticated turbulence models, such as the hybridRANS/LES model, should be investigated toimprove the accuracy of the wake flow structure.Such a model is currently under development byLLNL.
The unsteady turbulent gap flow was successfullymodeled compared to the USC experimental data.The symmetric and asymmetric flow states in thegap were properly represented. A new add-on devicewas suggested and tested computationally tostabilize the gap flow and reduce the aerodynamicdrag.
The discovery experiment is under way at NASAAmes facility to provide better understanding of theflow structure associated with drag reducing add-ondevices. Also, several add-on devices will berecommend as the outcome of this experiment to theDOE heavy vehicle project for full-scale road tests.

Heavy Vehicle Systems Optimization Program FY 2003 Annual Report
36
References1. Storms, B., et. al., “An Experimental Study of
the Ground Transportation System (GTS) Modelin the NASA Ames 7- by 10-Ft Wind Tunnel,”NASA/TM-2001-209621, Feb. 2001.
2. Salari, K., McWherter-Payne, M.,“Computational Flow Modeling of a SimplifiedIntegrated Tractor-Trailer Geometry,”SAND2003-3383.
3. Ortega, J.M., Dunn. T., McCallen, R., Salari, K.,“Computational Simulation of a Heavy VehicleTrailer Wake,” United Engineering Foundation,Aerodynamics of Heavy Vehicles: Trucks,Buses, and Trains Conference, Monterey, CA,December 2–6, 2002.

Heavy Vehicle Systems Optimization Program FY 2003 Annual Report
37
F. Reynolds-Averaged Navier-Stokes Simulations of a SimplifiedTractor/Trailer Configuration
Principal Investigators: L.J. DeChantCo-Investigators: C.J. Roy, J.L. Payne, and B. HassanSandia National LaboratoriesP.O. Box 5800, MS 0825, Albuquerque, NM 87185-0825(505) 844-4250; [email protected]
Technology Development Manager: Sidney Diamond(202) 586-8032; [email protected] Program Manager: Jules Routbort(630) 252-5065; [email protected]
Contractor: Sandia National LaboratoriesContract No.: DE-AC04-94AL85000
Objective• Evaluate the use of Reynolds Averaged Navier-Stokes (RANS) to predict the aerodynamic drag on
tractor/trailers. This goal will be accomplished by computing accurate numerical solutions to representativetractor/trailer geometries, then validating those computations by comparisons to experimental data. Thesevalidated models will then be used to assess drag reduction techniques which have the potential to reduce thenet oil consumption and operating costs for the trucking industry.
Approach• Compute solutions with varying mesh resolution for the Ground Transportation System (GTS) geometry.
• Assess the numerical accuracy of the computed solutions.
• Validate the models by comparison to experimental data for surface pressure, flowfield velocity, and dragcoefficient obtained in the NASA-Ames 7 × 10 ft wind tunnel.
Accomplishments• Completed a new GTS fine mesh with appropriate y+ values to allow the removal of every other point in each
direction to provide a consistently coarsened mesh.
• Successfully completed both coarse grid (2.5 million cells) and fine grid (20 million cells) solutions on the GTSgeometry using both the Spalart-Allmaras and Menter k-omega turbulence models.
• Completed assessment of the numerical errors in the fine grid GTS simulations.
• Compared simulation results to experimental data for surface pressure, wake velocities, and drag coefficient.
• Generated new flowfield mesh on a truncated GTS geometry to allow more detailed resolution of the truckwake region and the assessment of unsteady turbulence modeling approaches.
• Developed a reduced-order model for bluff-body drag on simplified geometries.
Future Directions• Compare steady RANS simulations on the truncated geometry to results for full geometry.
• Compute additional steady RANS simulations on the truncated mesh with additional mesh resolution in thewake.

Heavy Vehicle Systems Optimization Program FY 2003 Annual Report
38
• Compute unsteady turbulent simulations of the GTS geometry using the truncated geometry.
• Continue to develop a reduced order model for bluff-body drag.
IntroductionIn a typical class 8 tractor/trailer, energy losses dueto rolling resistance and accessories increase linearlywith vehicle speed, while energy losses due toaerodynamic drag increase with the cube of thespeed. At a typical highway speed of 70 mph,aerodynamic drag accounts for approximately 65%of the energy output of the engine [1]. Due to thelarge number of tractor/trailers on the US highways,even modest reductions in aerodynamic drag cansignificantly reduce domestic fuel consumption.Lower fuel consumption will result in a reduction inpollution emissions, and, more importantly, areduced dependence on foreign oil.
The most common turbulence modeling approachfor engineering applications involves solving theReynolds-Averaged Navier-Stokes (RANS)equations. With this approach, the effects of theinherently three-dimensional and time-varyingturbulent eddies on the mean flow are modeled andnot simulated. The goal of this study is to assess theability of steady-state RANS turbulence models toaccurately predict the flowfield and aerodynamicdrag for tractor/trailer configurations.
Problem FormulationThe configuration to be examined is the GroundTransportation System (GTS) studiedexperimentally at the NASA Ames research centerby Storms et al. [2]. The GTS geometry is asimplified tractor/trailer configuration which ismounted on four posts in the wind tunnel. Aphotograph of the GTS in the NASA Ames 7 × 10 ftwind tunnel is shown in Figure 1. The GTS model isan approximately 1/8 scale class 8 tractor/trailerconfiguration. The Reynolds number based on thetrailer width (W=0.3238 m) is 2 million,approximately one-half of full scale.
The GTS geometry, including the wind tunnel walls,is discretized using two mesh levels: a coarse meshusing 2.5 million grid points and a fine mesh using20 million grid points. The grids are generated such
Figure 1. GTS model inNASA Ames 7 × 10 ft windtunnel
that the wall y+ values on the truck surface, supports,and lower wind tunnel wall are everywhere less thanunity on the fine mesh. The side and top wind tunnelwalls employ slip flow conditions. Structuredmeshes are employed using point-to-point match upat the block boundaries. The coarse mesh is domain-decomposed into 125 zones and is shown inFigure 2. The fine mesh is decomposed into1149 zones. Both the coarse and fine meshes are runon the massively parallel ASCI Red machine usingone processor for each zone. The axes employed inthe current effort are shown Figure 2, with the x axisstarting at the front of the tractor and runningdownstream, the y axis in the vertical direction, andthe z axis starting at the GTS symmetry plane andrunning spanwise towards the side wall.
In order to ensure that the simulated flow matchesclosely with the flow in the wind tunnel, a number offreestream conditions are matched. First, the inflowplane is set with the appropriate stagnationconditions of the tunnel shown in Table 1. The backpressure at the simulated outflow plane is thenadjusted until the reference pressure located at(x/W=4.47, y/W=2.59, and z/W=-4.7) on the tunnelside wall reaches the wall reference pressure givenin the table. The boundary layer on the bottom wallwas measured in a tunnel-empty configuration.Sample boundary layer profiles upstream of the GTSmodel from the simulation using the Menter k-ωmodel gave good agreement with the tunnel empty-profile from the experiment.

Heavy Vehicle Systems Optimization Program FY 2003 Annual Report
39
Figure 2. Computational mesh on GTSgeometry
Table 1. Freestream conditions used in thesimulations
Tunnel Condition ValueStagnation Pressure 102,653.2 N/m2
Stagnation Temperature 282.06 KWall Reference Pressure 97,582. N/m2
Reference Mach number 0.27Back Pressure 100,136.0 N/m2
Tunnel Floor BLThickness
0.053 m
Wall Temperature BC adiabatic
Numerical FormulationThe CFD code is SACCARA, the Sandia AdvancedCode for Compressible AerothermodynamicsResearch and Analysis, and was developed from aparallel distributed memory of the INCA code [3],originally written by Amtec Engineering. TheSACCARA code employs a massively paralleldistributed memory architecture based on multi-block structured grids. A number of codeverification studies have been performed which giveconfidence that the code is free from codingmistakes including comparison to establishednumerical benchmark solutions and code-to-codecomparisons [4]. The fine grid and coarse gridsimulations presented herein were run in parallel onthe ASCI Red parallel processing machine using1149 and 125 processors, respectively.
Two turbulence models are examined in the currentwork: the one-equation eddy viscosity transportmodel of Spalart-Allmaras [5] and the Menter k-ωmodel [6]. The strengths and limitations of thesemodels are described in the indicated references.The Menter k-ω model is a hybrid model which usesa blending function to combine the best aspects ofboth the k-ω and the k-ε turbulence models. In bothcases, the turbulence models were integrated to thewall in order to avoid model validation issuesassociated with wall functions.
Numerical AccuracyThe solutions are marched (iterated) in pseudo-timeuntil a steady-state answer is obtained. Iterativeconvergence is assessed by examining the steady-state residuals of the momentum equations. Thesteady-state residual is defined by plugging thesolution at the current iteration into the discretizedform of the steady-state governing equations(omitting the time derivative). The iterative error inthe solution tends to drop in a similar fashion as theresidual. The solutions were converged byapproximately seven orders of magnitude.
The discretization error is estimated by generatingsolutions on two mesh levels. Since the coarse meshis determined by eliminating every other gridlinefrom the fine mesh, the grid is consistently refinedthroughout the entire domain, and Richardsonextrapolation can be used to estimate the exactsolution. This extrapolated solution is then used tojudge the error in the fine grid solutions. While thecoarse and fine grid results for surface pressure onthe front of the tractor do show some sensitivity togrid refinement, the estimated error in the fine gridsolution is approximately ±0.05 ∆Cp. Coarse andfine grid results for the base of the trailer are shownin Figure 3, with the maximum estimated error to beless than ±0.01 ∆Cp (note the expanded scale for∆Cp). The Spalart-Allmaras model was only run onthe fine mesh; however, the spatial discretizationerror is expected to be similar to that of the Mentermodel.

Heavy Vehicle Systems Optimization Program FY 2003 Annual Report
40
Cp
y/W
-0.4 -0.3 -0.2 -0.1 0
0
0.25
0.5
0.75
1
1.25
1.5
Fine GridCoarse Grid
Trailer Basez/W = 0Menter k-ω Model
Figure 3. Pressure on base of trailer(coarse and fine meshes)
Surface ComparisonsThe surface pressure for the two turbulence modelsusing the fine mesh is compared to experimentaldata [2] on the front of the tractor in Figure 4. Bothsimulations show good agreement with theexperimental data. Simulation results are presentedfor the base of the trailer in Figure 5. In this case, theMenter k-ω model does a reasonable job ofmatching the pressure levels, while the Spalart-Allmaras model [5] significantly underpredicts thepressure on the base.
Aerodynamic DragAerodynamic drag predictions using the twoturbulence models as well as the experimentallymeasured drag are presented in Table 2. These dragresults (both predicted and experimental) are for theGTS model only and do not include the supportposts. The Menter k-ω results are approximately7.5% higher than the experimental value, while the
Cp
y/W
-2 -1 0 1
0
0.25
0.5
0.75
1
1.25
1.5
ExperimentMenter k-ωSpalart-Allmaras
Front of Tractorz/W = 0
Figure 4. Surface pressures on frontof tractor
Cp
y/W
-0.4 -0.3 -0.2 -0.1 0
0
0.25
0.5
0.75
1
1.25
1.5
ExperimentMenter k-ωSpalart-Allmaras
Trailer Basez/W = 0
Figure 5. Surface pressure on trailerbase
Table 2. Drag coefficients
DragCoeff.,CD
EstimatedUncertainty/Error
Storms et al.Experiment [2]
0.25 ±0.01
Menter k-ω [6] 0.298 ±0.06Spalart-Allmaras[5]
0.413 --
Spalart-Allmaras results [5] are nearly 50% high.The overprediction of the drag with the Spalart-Allmaras model is due to the poor prediction of thebase pressure. Also shown in the table is theestimated uncertainty in the experimental dragcoefficient [2], and the estimated numerical error forthe fine grid Menter k-ω simulation [6]. Thisnumerical error estimate is determined byperforming Richardson extrapolation using thecoarse and fine grid drag coefficients, 0.474 and0.298, respectively. The resulting extrapolated valuefor the drag coefficient using the Menter k-ω modelis 0.239, which is essentially within the experimentaluncertainty bounds.
Field ComparisonsVelocity data are available from PIV measurementsperformed at the NASA Ames 7 × 10 ft wind tunnel[2]. These PIV data represent a time-averagedpicture of the flow in the wake regions immediatelybehind the trailer base. Figure 6 gives streamlinesbased on the PIV data in a vertical streamwise cutthrough the wake (z/W = 0). The flow is from left toright, with the base of the trailer shown on the left;the PIV window is also shown in the figure. A large,

Heavy Vehicle Systems Optimization Program FY 2003 Annual Report
41
counter-clockwise-rotating vortex is centered atapproximately x/W = 8, y/W = 0.4. Also, thepresence of a clockwise-rotating vortex is suggestedby the vertical nature of the streamlines in the upperright-hand corner of the PIV window. A similarview of the streamlines from the fine gridcomputations using the Menter k-ω model is shownin Figure 7. These Menter k-ω computations predicta more symmetric pair of vortices than is indicatedfrom the experimental data. The location of theexperimental PIV window is shown in the figure forreference. Streamlines for the Spalart-Allmarasmodel are presented in Figure 8, showing a muchshorter recirculation zone than the Menter model.This shorter recirculation zone produces largervelocities in the outer flow as the flow acceleratesaround the wake. The higher velocities result inlower pressures and hence higher drag (see Table 2).Although not depicted, comparison to experimentalPIV results for a horizontal streamwise cut throughthe wake (y/W = 0.696) showed that the location ofthe vortices was accurately predicted by the RANSmodel.
Truncated GeometryA truncated GTS mesh was generated which omitsthe upstream wind tunnel and the front “tractor”section of the GTS. Steady-state RANS simulationson this geometry are underway and will becompleted early in Fiscal Year 2004. Our goal hereis to develop the minimum computational problemthat adequately represents the large-scale separationeffects in the flow and, thereby, recovers thedominant drag component. Simulations are to be
x/W
y/W
7.6 7.8 8 8.2 8.4 8.6 8.8 9 9.2
0
0.2
0.4
0.6
0.8
1
1.2
1.4
Experiment: NASA AmesVertical Streamwise Cut: z/W = 0
Figure 6. Experimental streamlines:vertical streamwise cut (z/W = 0)
x/W
y/W
7.6 7.8 8 8.2 8.4 8.6 8.8 9 9.2
0
0.2
0.4
0.6
0.8
1
1.2
1.4
Computation: Menter k-ωVertical Streamwise Cut: z/W = 0
Figure 7. Computationalstreamlines: vertical streamwise cut(z/W = 0)
x/W
y/W
7.6 7.8 8 8.2 8.4 8.6 8.8 9 9.2
0
0.2
0.4
0.6
0.8
1
1.2
1.4
Computation: Spalart-AllmarasVertical Streamwise Cut: z/W = 0
Figure 8. Computational streamlines:vertical streamwise cut (z/W = 0)
performed on both supercomputer and multipleworkstation class platforms. The ability to modelthese flows on widely avaliable work station clusters(10–20 processors) is of particular interest, since itcan be expected that many end users will have thislevel of computing resources currently available.
Reduced Order ModelingHere, the self-similar, far-field, turbulent wakemodels are extended to estimate the 2-d, axi-symmetric and (simple) 3-d drag coefficient for arange of bluff body problems. The self-similar wakevelocity defect that is normally independent of theinitial condition, e.g. bluff body geometry, ismodified using a Gram-Charlier series approach toretain the initial condition information. Preliminaryresults indicate that drag estimates computed usingthis method are within approximately 20% ascompared to published values for flows with large

Heavy Vehicle Systems Optimization Program FY 2003 Annual Report
42
separation. The potential value of this method is as away to utilize poorly resolved simulation results toprovide an inexpensive estimate of body drag or asthe basis of a physically consistent correlationscheme. This methodology may be of use as asupplement to CFD and experimental solutions inreducing the heavy computational and experimentalburden of estimating drag coefficients for blunt bodyflows for preliminary design type studies.
ConclusionsSteady-state RANS simulations were conducted forthe flow over the GTS geometry. The numericalaccuracy of the computed flowfields was assessedby performing the computations on multiple grids.Simulation results using the Menter k-ω turbulencemodel gave good agreement with the experimentaldata for surface pressure, field velocities in thewake, and drag coefficient; however, this modelpredicted a more symmetric pair of counter-rotatingvortices in the vertical streamwise plane than wasindicated in the experiment. These results suggestthat the Menter k-ω model can accurately predict thedrag for tractor/trailer configurations whenperformed on highly refined meshes usingintegration to the wall, although some time-averagedflow structures are not captured. Simulation resultswith the Spalart-Allmaras turbulence model showedgood agreement with experimental data for thesurface pressure in the attached flow regions, butsignificantly underpredicted the pressure in the baseregion. As a result, the Spalart-Allmaras modeloverpredicted the drag coefficient by nearly 50%.Initial development of reduced-order drag prediction
models were also introduced, with the preliminaryresults yielding drag estimates within 20% ofestablished values.
References1. McCallen R., Couch R., Hsu J., Browand F.,
Hammache M., Leonard A., Brady M., SalariK., Rutledge W., Ross J., Storms B.,Heineck J.T., Driver D., Bell J., Zilliac G.(1999) Progress in reducing aerodynamic dragfor higher efficiency of heavy duty trucks(class 7-8). SAE Paper 1999-01-2238.
2. Storms B.L., Ross J.C., Heineck J.T.,Walker S.M., Driver D.M., Zilliac G.G. (2001)An experimental study of the groundtransportation system (GTS) model in the NASAAmes 7- by 10-ft wind tunnel. NASA TM-2001-209621.
3. Wong C.C., Soetrisno M., Blottner F.G.,Imlay S.T., Payne J.L. (1995) PINCA: a scalableparallel program for compressible gas dynamicswith nonequilibrium chemistry. Sandia NationalLaboratories Report SAND 94-2436,Albuquerque, NM.
4. Roy C.J., McWherter-Payne M.A.,Oberkampf W.L. (2000) Verification andvalidation for laminar hypersonic flowfields.AIAA Paper 2000-2550.
5. Spalart P.R., Allmaras S.R. (1994) A one-equation turbulence model for aerodynamicflows. La Recherche Aerospatiale 1: 5-21.
6. Menter F.R. (1994) Two-equation eddy-viscosity turbulence models for engineeringapplications. AIAA Journal 32: 1598–1605.

Heavy Vehicle Systems Optimization Program FY 2003 Annual Report
43
G. Commercial CFD Code Validation for External Aerodynamics Simulationsof Realistic Heavy-Vehicle Configurations
Principal Investigator: W.D. PointerArgonne National Laboratory9700 S. Cass Avenue, NE-208, Argonne, IL 60439(630) 252-1052; fax: (630) 252-4500; [email protected]
Technology Development Manager: Sid Diamond(202) 586-8032; [email protected] Program Manager: Jules Routbort(630) 252-5065; [email protected]
Contractor: Argonne National LaboratoryContract No.: W-31-109-ENG-38
Objective• Evaluate capabilities in standard commercial computational fluid dynamics (CFD) software for the prediction of
aerodynamic characteristics of a conventional U.S. Class 8 tractor-trailer truck.
• Develop “best practice” guidelines for the application of commercial CFD software in the design process ofClass 8 vehicles.
Approach• Develop computational models of the experiments completed in the NASA Ames Laboratory’s 7 ft. by 10 ft.
wind tunnel using the Generic Conventional Model (GCM).
• Compare the predictions of the computational models with experimental measurements of vehicle aerodynamicdrag force and pressure field distributions.
Accomplishments• Experimental measurements and computational predictions of the vehicle drag coefficient agree within less than
1% in the best case simulations.
• Experimental measurements and computational predictions of the pressure distribution along the surface of thevehicle agree within the experimental error.
Future Direction• Continue development of “best practice” guidelines through comparison of computational predictions with
experimental measurement for the GCM as well as grid, model geometry, and turbulence model studies.
• Evaluate capabilities for prediction of aerodynamic drag in cases in which there is a cross-wind component(i.e., consider wind tunnel experiments where the vehicle is placed at some yaw angle).
• Consider alternate GCM configurations using various add-on devices to examine capabilities for the predictionof changes in drag coefficient.

Heavy Vehicle Systems Optimization Program FY 2003 Annual Report
44
IntroductionThe issue of energy economy in transportation hasgrown beyond traditional concerns overenvironment, safety and health to include newconcerns over domestic energy security. Incollaboration with the U. S. Department of EnergyOffice of FreedomCAR and Vehicle Technologies’Working Group on Aerodynamic Drag of HeavyVehicles, Argonne National Laboratory isdeveloping guidelines for the accurate prediction ofheavy vehicle aerodynamic drag coefficients usingcommercial Computational Fluid Dynamic (CFD)software. In these studies, computational predictionsfrom the commercial CFD code Star-CD [1] will becompared with detailed velocity, pressure and forcebalance data from experiments completed in the 7 ft.by 10-ft. wind tunnel at NASA Ames [2,3] using aGeneric Conventional Model (GCM) that isrepresentative of typical current-generation class 8tractor-trailer geometries. Initial evaluations havefocused on the effects of selection of computationalmesh size parameters and turbulence modelingstrategies on the accuracy of the drag coefficientprediction.
Generic Conventional ModelThe Generic Conventional Model (GCM) is asimplified representation of a conventional U.S.tractor-trailer truck. The model is 1/8th scale and canbe configured in four different geometries asillustrated in Figure 1. The nominal, or StandardTruck, configuration is a representative model of acurrent-generation U. S. conventional class 8 tractor-trailer truck. Alternate GCM configurations includethe addition of a lo-boy device under the length ofthe trailer, a full fairing between the cab and thetrailer, and the combination of the fairing and lo-boydevice.
Computational ModelThe computational model employed in these studieswas developed using the ES-Aero tool foraerodynamic drag simulation that is available as partof the Star-CD software package. The mesh isdeveloped using a semi-automated process thatprogresses in eight stages:
(a)
(b)
(c)
(d)
(a)
(b)
(c)
(d)
Figure 1. Four configurations of thegeneric conventional model: (a) standardtruck, (b) standard truck with lo-boy trailer,(c) faired truck, (d) faired truck with lo-boytrailer
1. A three-dimensional hexahedral mesh is createdthat completely fills the volume of the windtunnel.
2. The mesh is refined in successively smallerzones surrounding the vehicle until the meshadjacent to the vehicle surface reaches theprescribed near-vehicle cell size. The resultingunstructured mesh of hexahedral cells exhibits2-to-1 matching at all unstructured interfaces.
3. The near-vehicle mesh is locally refined basedupon features of the vehicle surface definition.Local refinement limits are determined throughthe near-wall cell size parameter and direct useridentification.
4. The surfaces that define the vehicle are“wrapped” by projecting the refined hexahedralmesh onto the surface. The components of thevehicle are merged into a single surface, and aquadrilateral surface definition is created.
5. The quadrilateral surface definition isvolumetrically expanded to create a sub-surface.

Heavy Vehicle Systems Optimization Program FY 2003 Annual Report
45
Figure 2. Two-dimensional projection of the near-vehicle region of the computational mesh employed inthese studies
6. The sub-surface is used to cut away the parts ofthe hexahedral mesh that fall within a shortdistance of the vehicle surface.
7. A brick and prism extrusion layer is created tofill the gap between the sub-surface and thequadrilateral surface definition. Thus, thepolyhedral trimmed cells that are generatedwhen the vehicle shape is cut from the mesh arenot in the critical boundary layer region of theproblem.
8. Upon completion of the basic mesh, the wakeand ground layer regions are automaticallyfurther refined to better capture important flowfeatures.
In this study, the generated mesh has a near-wall cellsize of 8.0 mm. The minimum cell size used in localrefinements is 0.5 mm, and a minimum of 16 pointsare required to define any full circle. In addition toautomatic refinements, cells adjacent to the surfaceare refined to a size of 2.0 mm in order to preservethe quality of the surface in the wrapping stage andimprove the quality of the trimmed cells. Theextrusion layer consists of two layers of brick andprism cells where the outer layer has a thickness of1.0 mm and the inner layer has a thickness of0.5 mm. A sample computational mesh is shown inFigure 2.
In all simulations discussed herein, the GCM iscentered at zero yaw on the floor of a wind tunneltest section that is 2.133 m (7 ft) tall by 3.048 m
(10 ft) wide. Since the GCM is approximately 2.5 mlong, a total test section length of 10.0 m is assumed,where one model length is included upstream of themodel and two model lengths are includeddownstream of the model. Based upon a Reynoldsnumber of 1.1 million, a uniform velocity of51.45 m/s is enforced at the inlet boundary. Auniform pressure condition is applied at the outletboundary. In these studies, the surface of thestandard configuration GCM is defined usingapproximately 500,000 triangular surface elementsthat are based upon CAD representations taken fromoptical scans of the actual model.
Mesh Sensitivity StudiesThe Star-CD external aerodynamics analysis toolES-Aero uses a local feature-size-based automaticmeshing system to build a partially-unstructured,primarily-hexahedral computational mesh. In thegeneration process, a bulk near-vehicle cell size anda minimum cell size for local feature-basedrefinement regions, or near-wall cell size, arespecified. In these studies, the effects of changes ofthese two parameters on predicted drag coefficientare evaluated.
For each steady-state simulation, 3,000 iterationswere calculated using Star-CD’s standard conjugategradient solver and the PISO predictor-correctoralgorithm. In these simulations, the standard highReynolds number two-equation turbulence modeland a logarithmic wall function are employed forprediction of turbulent kinetic energy and

Heavy Vehicle Systems Optimization Program FY 2003 Annual Report
46
dissipation. Convergence criteria were set to insurethat all cases would reach 3,000 iterations beforestopping. However, all residuals reach the normalstopping criteria of 10-3 well before the 3000thiteration and are no larger than 2.0 × 10⁻⁴ at the3000th iteration. In addition to standard velocity andmass parameter residual monitoring, the dragcoefficient of the vehicle is monitored as thesolution develops to insure that the drag coefficientreaches a converged solution. In order to reducecomputational cost for these studies, only half of theGCM is included in the model and a symmetricboundary condition is employed at the centerline.
The effects of the near-vehicle cell size parameter onthe accuracy of drag coefficient prediction were firstconsidered. The near-vehicle cell size was varied insize from 6 mm to 16 mm in five cases. The results,shown in Table 1, indicate that the drag coefficientcan be predicted within 1.7% using a cell size of6 mm and 10.5% using a cell size of 16 mm. Furtherreductions in near-vehicle cell size are not possiblewithout violating the memory limits of the 32-bitsystem used in the development of thesecomputational meshes. Further increases in the near-vehicle cell size will result in cells that are two largeto capture significant vehicle features such as therear wheel axels.
The effect of the near-wall cell size parameter on theaccuracy of drag coefficient prediction was alsoconsidered. In this case, the near-vehicle cell size isset to 8mm and the minimum cell size for localrefinement was reduced from 1mm to 0.5 mm. Thisincreases the number of computational elementsfrom 3,282,426 to 4,264,232 and the total CPU timeused from 610,958 seconds to 703,027 seconds. Thechange in the near-wall refinement parameter results
Table 1. Effects of near-vehicle cell size parameteron accuracy of drag coefficient prediction
Near-VehicleCell Size (mm)
Predicted DragCoefficient
Error in DragCoefficient
experiment 0.39816 0.449 12.012 0.441 10.310 0.418 4.98 0.415 4.26 0.405 1.7
in a reduction in the error of the drag coefficientprediction from 4.2 to 1.0%.
Turbulence Model SensitivityIn order to evaluate the sensitivity of the solution tothe turbulence model employed, a study wascompleted using three different turbulence modelsthat are included as standard options in the Star-CDsoftware package: the standard high-Reynoldsnumber k-epsilon model with logarithmic wallfunction, the Menter k-omega SST model [4], andthe renormalization group (RNG) formulation of thek-epsilon model [5]. The standard k-epsilon modeland the SST model are identical in the far field, butthe SST model incorporates additional detail in thenear-wall region. The SST model should be moresensitive to separation, but the two should showreasonable agreement. The RNG model is similar tothe standard k-epsilon model, but includes anadditional term to account for the mean flowdistortion of the dissipation. With all three models,logarithmic wall functions are employed forboundary layer modeling. All simulations use ahighly refined mesh with a near-vehicle cell size of8.0 mm and a minimum cell size of 0.5 mm. As inprevious studies, only one symmetric half of thevehicle is considered to reduce the computationalrequirements. Again, 3,000 iterations are completedfor each case and the convergence of the dragcoefficient is monitored. Results of the study, assummarized in Table 2, indicate that the Menterk-omega SST model provides a slight performanceimprovement over the other models.
Table 2. Results of the evaluation of two-equationturbulence models for prediction of tractor-trailer truckdrag coefficients
TurbulenceModel
Predicted DragCoefficient
Percent Error inPrediction
Experiment 0.398 --High-ReynoldsNumber k-epsilonModel
0.402 1.0
Menter k-ω SSTmodel 0.401 0.8
RNG model 0.389 2.3

Heavy Vehicle Systems Optimization Program FY 2003 Annual Report
47
Half Vehicle Versus Full VehicleIn order to evaluate the effects of considering onlyhalf of the vehicle rather than the full vehicle, twomodels were created using the full vehicle geometry.These models use the same mesh parameter settingsas the two coarsest models considered in the meshsensitivity study, with near-wall cell sizes of 12 mmand 16 mm. As in all previous studies,3,000 iterations were completed for each steady-state simulation and the convergence of the dragcoefficient was monitored. As shown in Table 3,drag coefficient predictions show a slightimprovement in agreement with experimentalmeasurements when the full vehicle model is used.
Pressure Field ComparisonsSince the drag coefficient is an integrated quantity,comparison of the simulation predictions of surfacepressure distribution with the experimentallymeasured surface pressure distribution providesanother measure of the accuracy of the simulation.The pressure distribution along the vehicle surfacefrom the case using a half-vehicle model with anear-vehicle cell size of 8 mm, a near-wall cell sizelimit of 0.5 mm and the Menter k-ω SST model isshown in Figure 3. The comparison of the predictedpressure distribution along the vehicle centerlinewith experimental measurements, as shown inFigure 4, indicates that the surface pressuredistribution is predicted with reasonable accuracy. Amore detailed comparison of the pressuredistribution along the rear face of the trailer, whichis typically, the most difficult region to predictaccurately, is shown in Figure 5.
ConclusionsIn these studies, the predictions of heavy vehicleaerodynamic characteristics generated using
standard mesh generation and turbulence modelingoptions within the commercial computational fluiddynamics (CFD) code Star-CD have been comparedwith wind tunnel experiments using the GenericConventional Model (GCM). The computationalpredictions show good agreement with theexperimental measurements of the drag coefficient.The predicted surface pressure distribution alsoshow good agreement with measured values with themaximum error occurring along the rear faces of thecab and the trailer. While the results of these studiesare promising, they should not be viewed asconclusive, since the capabilities of the software forthe prediction of changes in drag coefficient withchanges in vehicle geometry are not yet known. Inforeseeable applications within the truckmanufacturing industry, the ability to predictchanges in aerodynamic characteristics resultingfrom small changes in vehicle design is likely to bemore valuable than the ability to predict the absolutevalue of the drag coefficient.
Future WorkThe next phase of this project will duplicate theanalyses discussed herein for each of the alternativeconfigurations of the GCM. Additionally, thecapability of the commercial CFD software topredict the aerodynamic characteristics of theStandard Truck configuration when a cross-windcomponent is present will be evaluated bycomparison with measurements from experimentsusing the GCM placed at a set yaw angle within the7 ft by 10 ft wind tunnel. These future studies willprovide information on the capability of the code topredict changes in the aerodynamic characteristics ofa heavy vehicle resulting from changes in design orenvironment.
Table 3. Comparison of drag coefficient predictions from half-vehicle and full-vehicle models
Half-Vehicle Full-VehicleNear-Vehicle
Cell Size (mm)Predicted Drag
CoefficientPercent Error in
PredictionPredicted Drag
CoefficientPercent Error in
Prediction16 0.449 12.0 0.441 10.312 0.441 10.3 0.426 6.7

Heavy Vehicle Systems Optimization Program FY 2003 Annual Report
48
Figure 3. Surface contour plot showing the predicted surface pressure distributionalong the surface of the GCM. Areas shown in red are areas of peak positive pressureand areas shown in blue are areas of peak negative pressure. Selected flowstreamlines are also shown to illustrate the movement of air over the vehicle.
Radiator
Hood Vent
Windshield
Top of Trailer
Rear FaceOf Trailer
Gap
Bottom of Trailer
Bottom ofTractor Radiator
Hood Vent
Windshield
Top of Trailer
Rear FaceOf Trailer
Gap
Bottom of Trailer
Bottom ofTractor
Figure 4. Comparison of predicted (line) andmeasured (dot) pressure distributions along thecenterline of the Generic Conventional Model. Asshown in the outline of the GCM, shading indicatesaxial position with blue indicating the grill andbumper area and red indicating the rear face of thetrailer.
0
0.2
0.4
0.6
0.8
1
1.2
1.4
1.6
-0.3 -0.25 -0.2 -0.15 -0.1 -0.05 0Cp
y/w
Figure 5. Comparison of predicted (diamond)and measured (square) pressure distributionsalong the centerline of the rear face of thetrailer

Heavy Vehicle Systems Optimization Program FY 2003 Annual Report
49
References1. Star-CD, version 3.150A, CD-Adapco Group,
Melville, NY.2. Dale Satran, “An Experimental Study of the
Generic Conventional Model (GCM) in theNASA Ames 7-by-10-Foot Wind Tunnel,”United Engineering Foundation Conference onThe Aerodynamics of Heavy Vehicles: Trucks,Buses, and Trains, Monterey, CA, Dec. 2–6,2002.
3. J.T. Heineck, Stephen Walker, Dale Satran,“The Measurement of Wake and Gap Flows of a1/8th Scale Generic Truck Using Three-Component Particle Image Velocimetry,”United Engineering Foundation Conference onThe Aerodynamics of Heavy Vehicles: Trucks,Buses, and Trains, Monterey, CA, Dec. 2–6,2002.
4. Menter, F.R., “Zonal Two Equation k-ωTurbulence Models for Aerodynamic Flows” in24th Fluid Dynamics Conference (Orlando),AIAA paper 93-2906, July 1993.
5. Yakhot, V., Orszag, S.A., Thangam, S., Gatski,T.B., and Speziale, C.G. ‘Development ofturbulence models for shear flows by a doubleexpansion technique,’ Phys. Fluids, A4, No. 7,pp. 1510–1520, 1992.

Heavy Vehicle Systems Optimization Program FY 2003 Annual Report
50
H. Vortex Methods
Principal Investigator: A. LeonardCo-Investigators: M. Rubel and P. ChatelainCalifornia Institute of Technology1200 East California Blvd. MC 301-46, Pasadena, CA 91125(626) 395-4465; [email protected]
Technology Development Manager: Sid Diamond(202) 586-8032; [email protected] Program Manager: Jules Routbort(630) 252-5065; [email protected]
Contractor: California Institute of TechnologyContract No.: DE-AC03-98EE50506
Objective• Develop and demonstrate gridless flow field method for computationally modeling heavy vehicle
aerodynamics.
Approach• Improve and extend vortex method approach and demonstrate capabilities on generic shapes and Ground
Transportation System geometry.
Accomplishments• Developed treatment of spinning boundaries.
• Study of boundary elements has led to a method for representing near-wall vorticity.
• Developed new method for redistribution of vortex particles.
• Development of a “Closest Point Transform” algorithm for improved runtime efficiency.
• Continued improvements in adaptive time integration to facilitate complex geometry applications.
• Modeled flow around GTS.
Future Direction• Continued development of vortex method approach and application to generic shapes and the GTS geometry.
IntroductionDuring FY03, Caltech continued to improve andextend its vortex method approach to flow pastcomplex bodies. These activities included treatmentof spinning boundaries, research on boundaryelements, high order isotropic redistribution,development of a fast algorithm for the Closest PointTransform and adaptive time integration. With our
colleagues at UCL in Belgium, we also completedan application of our method to the GTS geometry.
Spinning BoundariesIn our framework, because the fields are computedusing the unbounded Biot-Savart law, it is necessaryto include the contribution of the vorticity presentinside any spinning body. The subsequent volumeintegral is transformed into a surface one, better

Heavy Vehicle Systems Optimization Program FY 2003 Annual Report
51
suited for our boundary element method. Figure 1shows the sheet diffused by an impulsively startedspinning body; because we included the contributionof the forementioned spin vorticity, the sheet —found by a panel solver — has the correct totalcirculation.
Near-Wall ElementsNear-wall vorticity can now be represented byattached elements (Figure 2). These panels interactviscously with the regular-free-elements and inducea velocity field (Biot-Savart law). Derivation of anappropriate Biot-Savart law is in progress.
Figure 1. Vorticity flux magnitudefor an impulsively started spinningellipsoid (rotation about y-axis)
Figure 2. Near-wall vorticitymagnitude at t = 0+, slices taken near thetip of the ellipsoid
High-Order Isotropic RedistributionWe pursued the work on the redistribution schemesin Face Centered Cubic (FCC) lattices. A higherorder scheme was designed which shows remarkableisotropy when compared to equivalent schemes forcubic lattices (Figures 3 and 4). Let us emphasizethat the redistribution of the vortex particles everyfew time steps is critical for the convergence of themethod, hence the importance of its isotropy andaccuracy.
Figure 3. Isosurfaces of the third orderFCC scheme (FCC’3)
Figure 4. Isosurfaces of the third ordercubic scheme (M’4)

Heavy Vehicle Systems Optimization Program FY 2003 Annual Report
52
Fast Closest Point TransformA paper on the new Characteristic/Oct Tree (C/OT)algorithm for the closest point transform, whichallows the code to work on arbitrarily complicatedboundary geometries, was submitted. The algorithmworks by separating space into families ofcharacteristic lines of an Eikonal equation, andsorting them according to how they intersect cells ofan oct tree (Figures 5 and 6).
This algorithm is now implemented and used inmany areas of the code: generation/redistribution ofparticles around arbitrary geometries, samplingfields as in Figure 2, etc.
Figure 5. Boundary and cell of interest
Figure 6. Characteristic regions andintersection with cell
Adaptive Time IntegrationOne of the group’s ongoing research projects hasbeen the development of an efficient asynchronousdead reckoning numerical time integrator for thelarge systems of differential equations that arisewhen vortex methods are applied to complicatedgeometries at high Re. In the past year, work in thisarea focused on tweaking the strategy to make itscale better to the dense operators typically seen invortex problems, primarily by eliminating the wake-on-change strategy employed in earlier incarnationsof the algorithm.
GTS ModelThe flow around the GTS model was computed incollaboration with G. Winckelmans’ group at theUniversit´e Catholique de Louvain (UCL)(Figure 7). To make this run affordable, attachedvortex elements were used on the front part of thetruck and free elements were introduced upstream ofthe region of separation.

Heavy Vehicle Systems Optimization Program FY 2003 Annual Report
53
Figure 7. GTS model, positions and strengths of vortex elements

Heavy Vehicle Systems Optimization Program FY 2003 Annual Report
54

Heavy Vehicle Systems Optimization Program FY 2003 Annual Report
55
II. Thermal Management
A. Cooling Fan and System Performance and Efficiency Improvements
Principal Investigator: R.L. DupreeCaterpillar IncorporatedTechnical Center Building EP.O. Box 1875, Peoria, Illinois 61656(309) 578-0145; fax: (309) 578-4277; [email protected]
Investigator: J.L. BenderCaterpillar IncorporatedTechnical Center Building EP.O. Box 1875, Peoria, Illinois 61656(309) 578-6452; fax: (309) 578-4277; [email protected]
Technology Development Manager: Sid Diamond(202) 586-8032; [email protected] Program Manager: Jules Routbort(630) 252-5065; [email protected]
Contractor: Caterpillar IncContract No.: DE-FC04-2002AL68081
Objective• Develop cooling system fans and fan systems that will allow off-highway machines to meet Tier 3 emissions
regulations and reduce spectator sound levels with improved fuel efficiency, and within the functionalconstraints of machine size.
Approach• Task 1 is to develop a large, high-performance axial fan
• Task 2 is to develop an active fan shroud for use with large axial fans
• Task 3 is to develop fan modeling techniques to improve the ability to predict fan performance and componentairflows in cooling systems with side by side heat exchangers
• Task 4 is to demonstrate the performance of a lab developed swept blade, mixed flow fan in an off-roadmachine.
• Task 5 is to develop a high efficiency continuously variable speed fan drive for use in high horsepower fansystems
• Task 6 is to develop cooling system air filtration concepts that can allow more dense (higher performance) heatexchangers to be used in off-road machines
Accomplishments• Task 1- completed the design and performance measurement of a high performance axial fan using Genetic
Algorithms. Fan blading has been redesigned to improve performance with knife edge shrouds and prototype isin process of being built.
• Task 2- not planned to have significant accomplishments in this FY

Heavy Vehicle Systems Optimization Program FY 2003 Annual Report
56
• Task 3- Michigan State University has acquired velocity map data near the fan. Caterpillar has completed initialCFD models of fan and fan system.
• Task 4- Prototype fan has been built and tested in an off-road machine. Fan performance in lab conditionsequals baseline axial fan, but in the machine its flow is only 78% of the axial fan. Lab testing of theconfiguration shows that the performance loss of the prototype fan is due to the conical hub and ring shrouddesign which do not allow the air to leave the fan radially, like what occurs with the baseline axial fan. This lossof flow is unacceptable, and as a result the fan concept has failed its gate review. Task is completed.
• Task 5- The design of a dual modulating clutch variable speed fan drive was completed, along withperformance analyses to determine the potential fuel savings for different control methods and differentlocations throughout the world. The dual clutch fan drive showed the potential of 1.4% fuel savings over asingle ratio design, but the dual ratio design cannot meet commercial requirements for production, so furtherdevelopment was halted at the gate review. Task is completed.
• Task 6- Sensitivity testing of radiator designs to determine debris sizes needed to be filtered has begun.
Future Direction• Task 1- Second generation concept fan is on order for evaluation ahead of a planned task gate review.
• Task 2- Michigan State University is completing the design of an active shroud design for lab evaluation. Whenthe shroud design is done, MSU will optimize fan/shroud combination, concentrating on reducing the amount ofauxiliary air required. Caterpillar will test the same fan in a conventional venturi shroud design for performancecomparisons.
• Task 3- Michigan State University will provide localized flow data to Caterpillar. Caterpillar will use the localflow data to modify fan analysis methods to improve the ability to predict both fan performance and heatexchanger flow in side by side heat exchanger designs.
• Tasks 4 and 5- Tasks completed. Final documentation due.
• Task 6- Quantify the particle size range needed to be filtered to allow higher performance heat exchangers to beused in off-road machines. Design filtration system to provide the needed filtration performance.
IntroductionThis project involves predicting the fuel savingspotential of variable-speed fan drives in off-roadequipment.
The value of demand fan drives, either in the form ofvariable-speed or declutching fan drives, forreducing the fuel consumption of trucks and otheron-road machines is well recognized. The coolingsystem of the truck is designed to maintainacceptable operating temperatures at very high loadfactors, at relatively low travel speeds, and highambient temperatures. The net result is that theaverage truck has significantly more cooling systemperformance than needed during most operations.Trucks hauling freight between cities have at least55 mile per hour ram air available to them, providingsignificant cooling system performance even whenthe cooling fan is disengaged. The use of demand
fan drives is not well accepted in off-road machinesbecause:
• Off-road machines are expected to operate at ahigher load factor than on-highway trucks.
• Off-road machine cooling systems must coolpowertrain and hydraulic systems in addition tothe engine coolant. These non-engine systemscan represent a significant percentage of the totalcooling system heat load.
• The travel speed of many off-road machinesnever exceeds 7 miles/hour, so cooling providedby ram air is not available.
The value of demand fan drives in reducing off-roadmachine sound has been recognized by the EEC intheir directive 2000/14/EC (“Directive of theEuropean Parliament and of the Council on theApproximation of the Laws of the Member StatesRelating to the Noise Emission in the

Heavy Vehicle Systems Optimization Program FY 2003 Annual Report
57
Environment by Equipment for Use Outdoors” datedMay 8, 2000), where special sound test proceduresare permitted for machines using continuouslyvariable fans. The use of demand fan drives formachines that must meet EEC off-road machinespectator sound regulations has brought a renewedinterest in the use of continuously variable-speed fandrives for large off-road machines. Before variable-speed fan drives would be provided as either aproduct option or standard feature, the tractor designgroups needed to know the fuel savings potential ofthe device, often for a specific application in aspecific location. By combining machineperformance, fan drive performance, and ambienttemperature data, we can provide an accurateestimate of the potential fuel savings that acontinuously variable speed fan drive can providefor a specific machine application.
Fan Speed vs. Ambient TemperatureThe required cooling system fan speed is a functionof the machine operation (load factor), the coolingsystem characteristics, and the ambient airtemperature. The required fan speed can bedetermined using a dynamic machine performancesimulation model. The machine operating cycle to beevaluated must be modeled in a simulation tool that
can accurately account for engine and drive trainperformance and heat load, then the cooling systemperformance is incorporated in the dynamicsimulation model, so that as the machine operates ata given ambient temperature, the average fan rpmcan be determined. This is repeated over a variety ofdifferent ambient temperatures until the relationshipof fan speed vs. ambient temperature can bedetermined as shown in Figure 1.
Figure 1 also shows the significant effect that thepresence of air to air aftercooling (ATAAC), asrequired on many emissions regulated engines, canhave on fan speed at higher ambient temperatures.The presence of ATAAC, as well as the performanceof the aftercooler can have a significant effect on fanspeed (and fuel consumption of the cooling system)in the critical 30°C to 40°C ambient temperaturerange that many machines will experience during thesummer months.
Fan System Input PowerThe next step is to determine the fan system(combination of fan and fan drive) input power as afunction of fan speed. Figure 2 compares the inputpower of a conventional belt driven fan with thepower LOSSES of a continuously variable-speed fan
Fan Speed vs. Ambient Temp for Operating Cycle(~80% Load Factor)
0%
20%
40%
60%
80%
100%
120%
10 15 20 25 30 35 40 45
Ambient Temp (C)
Nor
mal
ized
Fan
Spe
ed
Standard ATAAC High Perf ATAAC No ATAAC
Figure 1. Fan speed vs. ambient temperature

Heavy Vehicle Systems Optimization Program FY 2003 Annual Report
58
Fan Drive Power Direct vs. Dual Ratio Drive(35kW @ 1150 Fan RPM)
0
5
10
15
20
25
30
35
200 300 400 500 600 700 800 900 1000 1100
Fan Speed- RPM
Pow
er-K
W
Fan Pow er (35kW fan @ 1150 RPM)
Slip Pow er (Single Ratio Slipping Clutch)
Slip Pow er (Dual Ratio Slipping Clutch)
Figure 2. Fan power and drive losses
drive utilizing a single ratio slipping clutch, versus asimilar fan drive design with dual ratio clutches tominimize power losses. The fan input power for theclutch equipped fans would be the sum of the faninput power and the slip power (the power loss inthe clutch). The chart compares the slip power of thetwo fan clutch concepts to contrast the lossesbetween the two designs. The losses are very similarat high drive ratios (corresponding to high ambienttemperatures), but the dual ratio conceptsignificantly reduces drive losses at lower driveratios (corresponding to lower ambienttemperatures).
Ambient Temperature DataAmbient air temperature data, is available from fromthe EnergyPlus database on the U.S. Department ofEnergy’s web site (http://www.eere.energy.gov/buildings/energy_tools/ energyplus/cfm/weatherdata_us.cfm). This location provides weatherdata from an ASHRAE/DOE data base used tocalculate building energy savings. Temperature datais average per hour for each month of the year. Thislets us look at first shift only, all three shifts, or onlysummer operation if we choose. ASHRAE hasselected the data to provide typical temperatures forthat hour, month, and location, so quotedtemperatures are slightly different from WeatherBureau data, and may be 2–3°C different from what
the Weather Bureau will quote for average or hightemperature for the month. The example data shownin Figure 3 is available for is available forworldwide locations.
Estimated Cooling System Fuel UseThis fuel consumption for the belt driven fan is
bsfchourstimefanpowerfuel *)(*= regardlessof load factor or ambient temperature. The fuelconsumed by the continuously variable-speed driveis determined by calculating the fuel used in eachhour/month combination (288 cells of data for24 hour/day operation) for the year. For eachhour/month combination we know the averagetemperature from the Energy+ data in Figure 3. Theambient temperature determines the fan speed fromcurves like Figure 1. The fan input power is the sumof the required fan power plus the slip power (ordrive losses) from Figure 2. The total fuel consumedin a day is the sum of the fuel consumed in theindividual 24 hourly segments (assuming themachine is used 24 hours/day). The individualhourly data was converted into monthly data byassuming the number of working days in a month(up to 30 days/month for high production machines)and assuming the machine was in use 80% of thetime it was available.

Heavy Vehicle Systems Optimization Program FY 2003 Annual Report
59
Figure 3. Energy+ temperature data example
Cooling System Fuel ConsumptionThe machine to be evaluated is an off-road machineused in mining. The fan requires 35kW at 1150 rpm,and will be evaluated using the fan speed vs.ambient temperature relationships shown inFigure 1, for a work cycle that represents an 80%load factor (the machine burns 80% of the fuel thatwould be consumed if the machine were operating atrated speed and power). The fan drives to beconsidered are: direct drive, single ratio slippingclutch and dual ratio slipping clutch with the losscharacteristics as shown in Figure 2, and themachine is assumed to be operating in the Midwestin ambient temperature conditions as shown inFigure 3. The machine is available for use 24 hoursper day, 30 days per month, and is actually in use
80% of the time it is available. The fuel consumed tooperate the cooling system under these operatingconditions is:
Aftercooling
Ideal(no losses)(liters/yr)
Dual ratioclutch
(liters/yr)
Single ratioclutch
(liters/yr)Jacket Water 5427 9434 14214Large ATAAC 7198 11243 16663Small ATAAC 9813 14555 19770
To put these numbers in perspective, a 35kW fanwould consume 61,824 liters/yr of fuel, out of a totalmachine fuel consumption of approximately 650,000liters/yr. The “ideal” fuel consumption is the powerrequired by the fan itself, and assumes a drive that is

Heavy Vehicle Systems Optimization Program FY 2003 Annual Report
60
100% efficient. If the machine consumes 650,000liters/yr of fuel, and the fixed ratio fan consumesroughly 62,000 liters of fuel/yr then the fuelconsumption of the machine without the fan wouldbe 588,000 liters/yr. Total machine fuelconsumption would then become:
Aftercooling
Ideal(no losses)(liters/yr)
Dual ratioclutch
(liters/yr)
Single ratioclutch
(liters/yr)Jacket Water 593,427 597,434 602,214Large ATAAC 595,198 599,243 604,663Small ATAAC 597,813 602,555 607,770
Installing the single ratio fan clutch on a machinewith a small ATAAC could reduce total fuelconsumption from 650,000 liters/yr to 607,770liters/yr, a savings of 6.5% in fuel consumption. Thedual ratio clutch design considered would save7.3%, and an ideal variable-speed fan drive wouldsave 8% of the total fuel consumed by the machine.The example machine represents a high percentageof engine output power being used by the coolingfan, but is not out of line with potential tier 3 losseson machines that are significantly constrainedrelative to frontal area, and must provide morecooling performance by increasing fan speeds. Highload factor machines may not see as much fuelsavings, because some of the greater available netpower may be used to perform more work in thesame amount of time. In that case, the fuelconsumption savings would have to be viewed in thecontext of work performed/liter of fuel. In addition,the milder summers of the Midwest will show higherfuel savings potential than areas of the country withhigher ambient temperatures, and machinesoperating three shifts will save more fuel thanmachines operating only during a single daytimeshift. If our same example machine is used for eight
hours/day, 20 days/month from the months of Marchthrough October, the fuel consumed by a fixed ratiofan would be 9,114 liters, vs. 4631 liters for a singleratio clutch. This is a 3.3% fuel savings, based onfuel consumption of the machine (not including thefuel consumption of the fan) of 130,667 liters duringthis same time frame.
ConclusionsPowertrain and cooling system dynamicperformance models can be used to predict therelationship of required fan speed vs. ambienttemperature for a variety of off-road machineconfigurations, and operating cycles. The resultingfan speed vs. ambient temperature relationship canbe combined with ambient temperature data in theDepartment of Energy’s Energy+ database toprovide estimates of fuel savings potential for avariety of fan drive designs.
As cooling system demand grows, with littleincrease in frontal area, the fan input power willcontinue to grow as a percentage of grosshorsepower. The fuel savings potential of acontinuously variable speed fan drive is significant,while the exact value of the fuel savings is a functionof machine design, ambient temperature, andmachine load factor. Considering that the majority oflarge off-road machines do not use any form ofvariable speed fan drive, the adoption of aconventional single ratio drive can provide asignificant reduction in fuel consumption. Theadoption of a more complex dual ratio drive couldprovide further fuel savings, and begin to approachthe fuel efficiency of an ideal fan drive that has nolosses as it varies the fan drive ratio.

Heavy Vehicle Systems Optimization Program FY 2003 Annual Report
61
B. Efficient Cooling in Engines with Nucleate Boiling
Principal Investigator: J.R. HullArgonne National Laboratory9700 South Cass Avenue, Building 335, Argonne, IL 60439(630) 252-8580; fax: (630) 252-5568; [email protected]
Technology Development Manager: Sid Diamond(202) 586-8032; [email protected] Program Manager: Jules Routbort(630) 252-5065; [email protected]
Contractor: Argonne National LaboratoryContract No.: W-31-109-ENG-38
Objective• Investigate potential of two-phase flow in engine cooling applications.
• Determine limits on two-phase heat transfer (occurrence of critical heat flux or flow instability).
Approach• Experimentally determine heat transfer rates and critical heat fluxes in small channels with water and 50%
ethylene glycol in water mixture.
• Perform experiments over a concentration range of ethylene glycol in water.
• Perform experiments with alternative fluids.
Accomplishments• Completed two-phase heat transfer experiments and analysis with 50/50 ethylene glycol/water mixture.
• Developed a new general correlation for flow boiling in small channels including water, 50/50 ethyleneglycol/water mixture, and refrigerants.
• Performed preliminary experiments on boiling flow stability.
Future Direction• Perform two-phase heat transfer experiments with ethylene glycol/water mixtures at other concentrations for off
design automotive conditions.
• Study the impact of vertical vs horizontal flow on two-phase heat transfer.
• Perform systematic experiments with alternative fluids.
IntroductionAnalyses of trends in the motor vehicle developmentsector indicate that future engine cooling systemswill have to cope with greater heat loads because ofmore powerful engines, more air conditioning, morestringent emissions requirements, and additional
auxiliary equipment. Moreover, there is considerableinterest in reducing the size of the cooling systems toobtain a better aerodynamic profile. To meet theseconditions, it is necessary to design cooling systemsthat occupy less space, are lightweight, have reducedfluid inventory, and exhibit improved performance.Among various new cooling systems proposed by

Heavy Vehicle Systems Optimization Program FY 2003 Annual Report
62
researchers, the nucleate-boiling cooling system hashigh potential to meet these challenges. Order-of-magnitude higher heat transfer rates can be achievedin nucleate-boiling cooling systems when comparedwith conventional, single-phase, forced-convectivecooling systems. However, successful design andapplication of nucleate-boiling cooling systems forengine applications requires that the critical heat fluxand flow instability not be reached. Therefore, afundamental understanding of flow boilingmechanisms under engine application conditions isrequired to develop reliable and effective nucleate-boiling cooling systems.
Cooling engine areas such as the head region oftencontain small metal masses that lead to small coolantchannels. This geometry, in turn, leads to low massflow rates in order to minimize pressure drop.Although significant research has been performed onboiling heat transfer and the critical heat fluxphenomenon, results on the conditions necessary forengine cooling systems are limited. It is the purposeof the present study to experimentally investigate thecharacteristics of coolant boiling, critical heat flux,and flow instability under conditions of smallchannel and low mass flux.
The test apparatus used in this investigation wasdesigned and fabricated to study boiling heattransfer, critical heat flux, and flow instability offlowing water, ethylene glycol, and aqueousmixtures of ethylene glycol at high temperatures (upto 250°C) and low pressure (<345 kPa). Figure 1shows a schematic of the apparatus. It is a closed-loop system that includes two serially arrangedpumps with variable speed drives, a set offlowmeters, an accumulator, a preheater, a testsection, and a condenser. The flowmeter set,including various types and sizes, was chosen tocover a large range of flow rates and was calibratedwith a weighing-with-stop-watch technique. Theestimated uncertainty in the measurements of flowrates was ±3%. The bladder-type accumulator allowsfor stable control of the system pressure. Thepreheater provides a means to set the inlettemperature of the test section at various desiredlevels. Both the preheater and test section wereresistance-heated with controllable DC powersupplies. Provisions were made to measuretemperatures along the test section for calculatingheat transfer coefficients. The pressures andtemperatures at the inlet and outlet of the test sectionwere also measured. Pressure transducers andthermocouples were calibrated against known
ToutE
3" 3" 3" 3" 3"1" 1"6"6" 1"
I
6"
Ta Tb Tc Td Te Tf Tg Th TiTj
3'
∆p
Tin
440 micronfilter
Pyrex window
Condenser Water out
Water in
Relief valveFill port
ISO SG
TP RP
RGA1 RGA2
Refractometer
Drain port
2" 2" 2"
T1 T2 T3 T4
ISO
Sorensen DCR 16-625T
EMHP 40-450-D-11111-0933
Vent port
Drain port
Expansion tank
Pressure gauge
Nitrogen/Air in
TFM
Pump 2Rotameter
Turbometer
T5
pout
Ta'
17"12.5"3"
Tb' Tc'
Tin '
Max
Pump 1
∆p
Figure 1. Schematic diagram of nucleate-boiling cooling test apparatus

Heavy Vehicle Systems Optimization Program FY 2003 Annual Report
63
standards. The estimated uncertainty in themeasurements of pressures and temperatures were±3% and ±0.2oC, respectively. As a safetyprecaution, both the preheater and test section wereprovided with high-temperature limit interlocks toprevent them from overheating. After leaving thetest section, the two-phase flow was condensed intoa single-phase flow, which returned to the pumps toclose the system.
A data acquisition system consisting of a computerand a Hewlett-Packard multiplexor was assembled torecord outputs from all sensors. A data acquisitionprogram, which includes all calibration equationsand conversions to desired engineering units, waswritten. The data acquisition system provides notonly an on-screen display of analog signals from allsensors and graphs of representative in-stream andwall-temperature measurements but also a means ofrecording temperature measurements and pertinentinformation such as input power, mass flux, outletpressure, pressure drop across the test section, andoutlet quality for further data reduction.
Results and DiscussionDuring FY 2003, both experiments and analysis onboiling heat transfer with 50/50 ethyleneglycol/water mixture have been completed. Themain results are reported below.
Boiling CurveFigure 2 shows the heat flux as a function of wallsuperheat for boiling of water and 50/50 ethyleneglycol/water mixture in small channels. As it can beseen from Figure 2 that, generally, the saturationboiling in small channels can be divided into threeregions, namely convection-dominant-boilingregion, nucleation-dominant-boiling region, andtransition-boiling region. Both convective heattransfer and boiling heat transfer exist in all threeregions, but their proportions are different in thesethree regions. In the convection-dominant-boilingregion, the wall superheat is low, usually less than afew degree centigrade. Although there is boiling heattransfer, the dominant mechanism is convective heattransfer. As a result, the mass quality and heattransfer rate are quite low comparing with those inthe other two regions. In the nucleation-dominant-boiling region, the wall superheat is higher than thatin the convection-dominant-boiling region but lowerthan certain upper limits that depend on mass flux.Opposite to the convection-dominant-boiling, theboiling heat transfer in the nucleation-dominantboiling is so developed that it becomes dominantand the heat transfer rate is much higher than that inconvection-dominant boiling. As can be seen fromFigure 2, the heat flux in this region is independentof mass flux and can be predicted with a power-lawfunction of wall superheat. This characteristic was
1
10
100
1000
0.01 0.1 1 10 100
G = 50 kg/m2sG = 76 kg/m2sG = 103 kg/m2sG = 129 kg/m2sG = 151 kg/m2s
Hea
t flu
x (k
W/m
2 )
Wall superheat (oC)
convection dominant
nucleationdominant
3
transition boiling
p = 200 kPa, d = 2.98 mm
(a) water
1
10
100
1000
0.01 0.1 1 10 100
G = 45-60 kg/m2sG = 65-85 kg/m2sG = 85-105 kg/m2sG = 115-130 kg/m2sG = 135-170 kg/m2s
Hea
t flu
x (k
W/m
2 )
Wall superheat (oC)
convection dominant
nucleationdominant
transition boiling
4.50
p = 160 kPa, d = 2.98 mm
(a) 50/50 ethylene glycol/water mixture
Figure 2. Heat flux as a function of wall superheat

Heavy Vehicle Systems Optimization Program FY 2003 Annual Report
64
used in correlating the heat transfer data. In thetransition-boiling region, the wall superheat isrelatively high. The heat flux in this region is alsohigh and close to the critical heat flux. The boiling inthis region is unstable and a small change in the heatflux will result in a big change in wall superheat. Ifthe heat flux increases further, it is possible for thesystem to reach the critical point producing anundesirably large jump in the wall superheat.
The above discussion shows that the nucleation-dominant boiling is desired in engineeringapplications for both high heat transfer rate andstable flow boiling without reaching the criticalpoint.
Two-Phase Pressure DropThe concept of two-phase multipliers proposed byLockhart and Martinelli and the correlation of thosemultipliers by Chisholm was used to compare withthe present experimental data. As can be seen fromFigure 3, the two-phase frictional pressure gradientdata of 50/50 ethylene glycol/water follow similartrends as those of water. The experimental data areconsidered to be in reasonable agreement with theChisholm predictions both in values and trendsalthough the Chisholm correlation slightlyoverpredicts the experimental data.
Boiling Flow StabilityPreliminary experiments on boiling flow stabilitywith 50/50 ethylene glycol/water mixture have been
1
101
102
103
104
105
106
1 101 102 103 104 105 106
water50/50 ethylene glycol/water
Chi
shol
m p
redi
cted
(φ F
L)2
Experimental (φFL
)2
Figure 3. Two-phase frictional pressuregradient
carried out for low mass qualities. Figure 4 shows anexample of a long term boiling test. It can be seenfrom Figure 4 that after the initial transient, both theflow rate and mass quality gradually tend to stablevalues, which has essential importance in enginecooling applications. The results suggest that as longas the mass quality is kept below a certain level,stable nucleate-boiling cooling is possible. Furtherexperiments are necessary to identify this massquality level.
0
20
40
60
80
100
120
0.0
0.1
0.2
0.3
0.4
0.5
0.6
0 50 100 150 200 250 300
Mass flux (kg/m2s)
Exit mass quality
Mas
s flu
x (k
g/m
2 s) Exit mass quality
Time (minute)
Figure 4. Boiling flow stability
Heat Transfer CoefficientIn the present study, the nucleation-dominant boilingdata have the following characteristics.
(a) Although both convective heat transfer andnucleate boiling heat transfer exist, the dominantheat transfer mechanism is nucleate boiling. Sincenucleate boiling heat transfer rate is much higherthan convective heat transfer, the latter can beneglected.
(b) As shown in Figure 2, the boiling heat transfer isdependent on heat flux but almost independent ofmass flux, which means that, for a certain fluid, theboiling heat transfer coefficient can be expressed asa function of heat flux.
(c) The heat transfer coefficients have differentdependence on heat flux for different fluids.Therefore, to get a general correlation for boilingheat transfer coefficients, it is necessary to includefluid properties in the correlation.

Heavy Vehicle Systems Optimization Program FY 2003 Annual Report
65
(d) Argonne researchers employed the dimensionlessparameter combination form of Boiling number,Weber number, and liquid-to-vapor density ratio indeveloping different predicted correlations forboiling heat transfer coefficients to different fluids,and the predicted results are quite good.
Based on the above facts, we extended the propertyterm to including liquid-to-vapor viscosity ratio andwere able to correlate boiling heat transfer data forwater, 50/50 ethylene glycol/water mixture,refrigerant 12, and refrigerant 134a as
h =135000(BoWel0.5)0.5 (ρl ρv )−0.5(µl µv )0.7[ ]−1.5
In the above equation the Boiling number Bo andthe Weber number Wel are defined respectively byBo = ′ ′ q (Gifg ) and Wel = G2D (ρlσ ) , where ρ isthe density, µ is the viscosity, G is the mass flux,D is the diameter, and σ is the surface tension.
Figure 5 shows the experimental data and thepredicted values obtained with the equation for fourfluids. The predictions of the equation are in goodagreement with the experimental data, and most ofthe predictions are within ±30% of the experimentaldata. It should be noted that the comparisons areonly for the data within the nucleation-dominant-boiling region. The success of the equation inpredicting the heat transfer coefficients of four fluidsboiling in small channels is directly related to thetrend, as presented in Figure 2, that the heat transferdata are heat flux but not mass flux dependent. Thefact that the equation is also heat flux but not massflux dependent is in accordant with the experimentaldata.
ConclusionsExcellent progress has been made on both theexperiments and analysis during FY 2003.
(a) Two-phase frictional pressure gradients of 50/50ethylene glycol/water mixture follow similar trendsas those of water. The results are in reasonableagreement with the predictions of the Chisholmcorrelation.
(b) The experiments show a very high heat transferrate with 50/50 ethylene glycol/water mixture, whichis positive to engine cooling applications. A generalcorrelation has been developed based on data ofwater, 50/50 ethylene glycol/water mixture, andrefrigerants. This correlation predicts theexperimental data quite well, and most of thepredicted values are within ±30% of theexperimental data.
(c) It was found that the boiling heat transfer of50/50 ethylene glycol/water mixture is mainlylimited by flow instability rather than critical heatfluxes that are usually the limits for water boilingheat transfer. Preliminary tests show that stable long-term two-phase boiling flow is possible for 50/50ethylene glycol/water mixture as long as the massquality is less than a certain critical value(approximately <0.2). The heat transfer rate at thismass quality is significantly higher than that ofconventional, single-phase, forced-convective heattransfer. However, the limiting quality or wallsuperheat for stable nucleate-dominant boiling is thefinal part of the 50/50 mixture correlating equationrequired for automotive applications. Determiningand predicting the limits is in progress.
(d) It is difficult for vehicles to maintain the coolantconcentration at exact 50/50. Therefore, it isnecessary to investigate boiling heat transfer ofethylene glycol/water mixtures at concentrationsother than 50/50. Experiments are in progress usingmixtures 10% off the idea concentration, or 40/60and 60/40 ethylene glycol/water mixtures. The testswill provide essential information for nucleate-boiling cooling system design.

Heavy Vehicle Systems Optimization Program FY 2003 Annual Report
66
103
104
105
103 104 105
Pre
dict
ed h
eat t
rans
fer c
oeffi
cien
t (W
/m2 K
)
Experimental heat transfer coefficient (W/m2K)
G = 45-790 kg/m2s+30%
-30%
(c) refrigerant 12
103
104
105
103 104 105
Pre
dict
ed h
eat t
rans
fer c
oeffi
cent
(W/m
2 K)
Experimental heat transfer coefficient (W/m2K)
G = 35-475 kg/m2s+30%
-30%
(c) refrigerant 134a
103
104
105
103 104 105
Pre
dict
ed h
eat t
rans
fer c
oeffi
cien
t (W
/m2 K
)
Experimental heat transfer coefficient (W/m2K)
G = 50-151 kg/m2s+30%
-30%
(c) water
103
104
105
103 104 105
Pre
dict
ed h
eat t
rans
fer c
oeffi
cien
t (W
/m2 K
)
Experimental heat transfer coefficient (W/m2K)
+30%
-30%
G = 45-170 kg/m2s
(d) 50/50 ethylene glycol/water mixture
Figure 5. Heat transfer coefficient comparisons (nucleation-dominant-boiling region)

Heavy Vehicle Systems Optimization Program FY 2003 Annual Report
67
C. Evaporative Cooling
Principal Investigator: S.U.S. ChoiArgonne National Laboratory9700 South Cass Avenue, Argonne. IL 60439(630) 252-6439; fax: (630) 252-5568; [email protected]
Technology Development Manager: Sid Diamond(202) 586-8032; [email protected] Program Manager: Jules Routbort(630) 252-5065; [email protected]
Contractor: Argonne National LaboratoryContract No.: W-31-109-ENG-38
Objective• Improve air-side heat transfer of the radiator.
• Reduce radiator size.
• Reduce radiator weight.
Approach• Conduct evaporative cooling tests on flat and cylindrical heaters.
• Characterize evaporative cooling with microporous surfaces.
Accomplishments• Evaporative cooling tests have shown that evaporative cooling with microporous coating on a flat heater
increases the heat transfer coefficient by about ~400% relative to dry air cooling on uncoated surface.
• The increase was less for the cylindrical than the flat heater due to the nonwetting of the surface opposite to thespray.
Future Direction• Develop a thermally conductive microporous coating (TCMC) technique.
• Initiate prototype radiator tests.
• Conduct preliminary radiator tests.
IntroductionOne of the general strategies for improving thethermal management performance in heavy vehiclesis to make better use of phase-change heat transfer.In particular, the performance on the air side of theradiator could be improved if evaporative heattransfer could be used. A number of methods toincorporate evaporative cooling are underevaluation, and in FY02 an experimental facility wascompleted and operated to demonstrate the
performance enhancements by one of the techniques.A collaboration has been established with theUniversity of Texas at Arlington to carry out thiswork. We have successfully demonstrated thatevaporative cooling with microporous coating on aflat heater increases the heat transfer coefficient byabout ~400% relative to dry air cooling on uncoatedsurface.

Heavy Vehicle Systems Optimization Program FY 2003 Annual Report
68
In FY2003, we have completed cross flowevaporative cooling tests on flat and cylindricalheaters. We have performed dry and evaporativecooling experiments with two cylindrical heaters tocompare heat transfer data for the microporous-coated heater with the smooth heater data. We havecharacterized evaporative cooling with microporoussurfaces including the structure of microporoussurfaces using a SEM, the effects of coatingthickness and coating particle size. Thesecharacterization studies are focused on discoveringoptimum microporous structure, particle size andthickness of coating. In addition, the effect of theflow rate of spray water has been investigated to findoptimum water flow rate.
Results and DiscussionThe focus of the present study is to determine theeffect of evaporative spray cooling on flat andcylindrical heaters and to extend the evaporativecooling process by application of a microporouscoating. Furthermore, we investigated the effects ofwater flow rate, particle sizes of the coating, andcoating thickness on evaporative heat transferperformance. The heat transfer coefficient valueswere compared at the same heat flux to define heattransfer enhancement before “dryout.” Dryout isdefined as the state where the sprayed water dropletsvaporize before reaching the heated surface due tothe excessive heat load and similar phenomenonwith critical heat flux in boiling heat transfer. If thewall temperature increases more rapidly (over 30°Cincrease for the nominal heat flux increment of1 kW/m2) than the previous average walltemperature, it is assumed that dryout has occurred,and power is cut off automatically.
Dry Air-Jet Cooling — Reference CaseThe dry air-jet cooling tests were performed forplain and microporous surfaces at the same nozzleinlet pressure of 7 psig. For checking of the data,each experiment was performed twice. Themicroporous structure enhanced the two-phase heattransfer performance significantly; however,negligible differences between the plain and coatedsurfaces occurred when an air jet was used to coolthe surfaces. This finding indicates that the increaseof area due to the microporous surface structures isnegligible for heat transfer by single-phase airconvection. The cooling performance of the
cylindrical heater was inferior to that of the flatheater due to the inefficient cooling at the back halfof the heater surface. The results from dry air-jetcooling were regarded as a reference case to assessthe heat transfer enhancement by evaporativecooling on plain and microporous surfaces.
Spray Cooling Results on Plain and MicroporousSurfacesFigure 1 shows the heat transfer coefficient vs. heatflux for the different surfaces, as well as spraycooling and dry air. When heat flux is less than10 kW/m2, the coated and plain surface showsignificant increase compared to the dry air case(reference). At this heat flux range, the microporouscoating does not provide much additionalenhancement over the plain surface. However, athigher heat flux, the coating does provide additionalheat transfer. The heat transfer coefficient of theevaporative cooling with the microporous surfacewas approximately 500 W/m2K up to a heat flux ofalmost 20 kW/m2, which is about a 400% increasecompared to the reference case. This excellentperformance is probably due to the delay of partialdryout.
0 10 20 30
q" (kW/m2)
0
200
400
600
h (W
/m2
K)
Plain (1.75 ml/min) - 1stPlain (1.75 ml/min) - 2ndABM (1.75 ml/min) - 1stABM (1.75 ml/min) - 2ndReference (Dry)
Figure 1. Heat transfer coefficient versusheat flux for plain and microporous surfaceswith flat heater
The cylindrical heater (diameter of 1.6 cm andlength of 7.7 cm) was used to investigate the effectsof heater surface geometry. The microporous coatinghad the same size of particles and thickness as theflat heater. The water flow rate of cross-flow spray

Heavy Vehicle Systems Optimization Program FY 2003 Annual Report
69
for the cylindrical heater was approximately3.0 ml/min, as determined by the ratio of the surfaceareas of the heaters. The heat transfer coefficientversus heat flux for the cylindrical heater is plottedin Figure 2.
0 5 10 15
q" (kW/m2)
0
100
200
300
400
h (W
/m2
K)
Plain (3.0 ml/min) - 1stPlain (3.0 ml/min) - 2ndABM (3.0 ml/min) - 1stABM (3.0ml/min) - 2ndReference (Dry)
Figure 2. Heat transfer coefficient versusheat flux for plain and microporous surfaceswith cylindrical heater
The plain surface showed about 300% increasedperformance for sprayed water compared to dry air,and additional improvement was found with themicroporous surface over the plain surface.
Effects of Sprayed Water Flow RateWater flow rates of 1.25, 1.75, and 2.4 ml/min weretested to investigate the trends of evaporative sprayheat transfer on plain and microporous surfaces ofthe flat heater. The results are plotted in Figure 3.
Air flow through the nozzle was controlledconsistently by maintaining air pressure at the nozzleinlet (7 psig). When heat flux was less than≈10 kW/m2, the flow rates had no effect on the spraycooling curves. However, for higher heat fluxes withspray cooling, the heat transfer increased as thewater flow rate increased for both plain andmicroporous surfaces. This improvement resultedbecause the available amount of water, fed from thesprayed droplets to be vaporized, increases as thewater flow rate increases. For all three flow rates at agiven ∆T, the microporous structure consistentlygenerated ≈50% enhancement in heat transfercompared to that of the plain surface. For both plain
0 20 40 60 80
∆T(oC)
0
10
20
30
40
q" (k
W/m
2)
plain (1.25 ml/min)
plain (1.75 ml/min)
plain (2.4 ml/min)
ABM (1.25 ml/min)
ABM (1.75 ml/min)
ABM (2.4 ml/min)
Reference
Dryo ut
Figure 3. Effect of water flow rate on heattransfer performance for flat heater
and microporous coated surfaces, the dryout heatflux also increased by about the same amount as thewater flow rate was increased.
Microporous Coating OptimizationWe attempted to optimize the microporous structuresfor evaporative spray heat transfer. The particle sizesand coating thicknesses were investigated asexperimental variables. The water flow rate was1.75 ml/min.
Three ranges of particle size, 8-12 µm, 30-60 µm,and 100-300 µm, were employed to formmicroporous structures on the flat heater. Thecoating thicknesses were measured to be ≈50 µm for8-12 µm particles, ≈150 µm for 30-60 µm particles,and ≈500 µm for 100-300 µm particles. The resultsreveal that the tested particle sizes produced similarheat transfer curves. The capillary pumpingphenomenon should be stronger as the coatingparticle size decreases. On the other hand, fluid flowresistance for the soaked water within themicroporous passageways increases as the particlesize decreases. Also, the wall temperature increasesdue to the additional thermal resistance ofconduction as the layer thickness increases for agiven heat flux. Therefore, the possible enhancementfrom less fluid flow resistance due to larger cavitysize is believed to be counterbalanced bydegradation due to additional thermal resistancefrom conduction and less capillary pumping power.

Heavy Vehicle Systems Optimization Program FY 2003 Annual Report
70
The smallest particle size (8-12 µm) was selected toinvestigate the optimum coating thickness. The8-12 µm particles are the most convenient for thecoating method. Microporous coatings with 150 and200 µm thicknesses showed smaller enhancement inspray heat transfer than coatings with 50 and 100 µmthicknesses. The 100 µm coating thickness attainedthe highest heat transfer coefficient among the testedthicknesses. This thickness produced up to ≈50%increase in evaporative heat transfer coefficient overthe 200 µm thickness. The thicker microporouscoating retains more water droplets as the coatingthickness increases due to the larger number ofmicroporous cavities. However, the evaporative heattransfer coefficient degrades extensively due to theadditional thermal resistance to conduction as thethickness exceeds 100 µm.
ConclusionsEvaporative spray cooling from plain andmicroporous coated surfaces was investigated tounderstand the heat transfer performance comparedto that of dry air cooling. The current studyinvestigated the effect of heater geometry (flat andcylindrical heaters) and water flow rates on sprayevaporative cooling. The effects of particle sizes andcoating thicknesses were also investigated.
Important findings from this study are:
(1) Evaporative cooling with spraying waterdramatically enhances the heat transfercoefficient over dry air cooling due to the addedheat transfer by evaporation (heat ofvaporization).
(2) The microporous coating further increases theheat transfer coefficient of evaporative spraycooling over the plain surface due to capillarypumping action. However, the heat transfercoefficient for dry air-jet cooling is unaffectedby the surface microstructure.
(3) The combination of evaporative cooling andcoated microporous surface enhances the heattransfer coefficient by up to 400% relative to thereference case (dry air cooling with uncoated,plain surface).
(4) The microporous coating extended the dryoutheat flux significantly (≈21 kW/m2) over theplain surface (15 kW/m2).
(5) Similar heat transfer improvements wereobserved for both flat and cylindrical heaters.The increase was less for the cylindrical than theflat heater due to the nonwetting of the surfaceopposite to the spray.
(6) When heat flux is less than ≈10 kW/m2, waterspray amounts (1.25-2.4 ml/min) have no effecton evaporative cooling for microporous coating.However, for higher heat fluxes, the heattransfer increased with the water flow rate forboth plain and microporous surfaces.
(7) The size of coating particles has a negligibleeffect on heat transfer performance. Ananoporous surface is recommended for furtherstudy of particle size effect.
(8) The 100-µm coating thickness gave themaximum heat transfer performance.
Future DirectionIn FY2004 we will develop a thermally conductivemicroporous coating (TCMC) technique, initiateprototype radiator tests, and conduct preliminaryexperimental study of evaporative cooling withmicroporous coating using a prototype radiator.
The microporous coating enhances heat transfercoefficient of evaporative cooling and it is attributedmainly to the capillary pumping action within themicroporous structures. The microporous coatingcontains Aluminum particles, Devcon BrusableCeramics epoxy, and methyl-ethyl-ketone (MEK).The epoxy component has a poor thermalconductivity within the microporous structure andthus potentially increases the conduction thermalresistance through the layer especially when thecoating becomes thick. Also, use of epoxy appears toprohibit the porosity variation within themicroporous structures even if the aluminum particlesize was changed. In order to overcome theseinferior thermal characteristics in evaporation heattransfer, a new innovative conductive microporouscoating method needs to be developed. Therefore,we will develop a thermally conductive microporouscoating (TCMC) technique based upon experiencesinvolved with the invention of microporous coatingtechnique.

Heavy Vehicle Systems Optimization Program FY 2003 Annual Report
71
D. Nanofluids
Principal Investigator: S.U.S. ChoiArgonne National Laboratory9700 South Cass Avenue, Argonne, IL 60439(630) 252-6439; fax: (630) 252-5568; [email protected]
Technology Development Manager: Sid Diamond(202) 586-8032; [email protected] Program Manager: Jules Routbort(630) 252-5065; [email protected]
Contractor: Argonne National LaboratoryContract No.: W-31-109-ENG-38
Objective• Exploit the unique properties of nanoparticles to develop ultra-high thermal conductivity heat transfer fluids.
• Characterize the thermal properties and heat transfer performance of nanofluids.
• Develop nanofluid technology for vehicle thermal management.
Approach• Develop simplified models of a nanofluid.
• Measure thermal conductivity of nanofluids at temperatures up to 80°C.
• Measure the heat transfer coefficient of nanofluids.
Accomplishments• Proposed that the solid/liquid interface or nanolayer acts as a thermal bridge between a nanoparticle and a liquid
and modified the Maxwell equation.
• Developed a simplified one-dimensional drift velocity model of a nanofluid.
• Modified the transient hot-wire cell to measure temperature-dependent conductivities.
• Measured the heat transfer coefficient of nanofluids.
Future Direction• Characterize the flow behavior of nanofluids in tubes.
• Measure the heat transfer coefficient of nanofluids in tubes.
• Design and fabricate a temperature oscillating system for temperature-dependent thermal conductivitymeasurements of a tiny quantity of nanofluids.
• Characterize metallic and oxide nanofluids in pool boiling for two-phase engine cooling applications.
• Refine models of nanostructure-enhanced and nanoparticle mobility-enhanced thermal conductivity ofnanofluids.

Heavy Vehicle Systems Optimization Program FY 2003 Annual Report
72
IntroductionMany industrial technologies face the challenge ofthermal management. With an ever-increasingthermal load due to trends toward greater poweroutput for engines, smaller micro-electronicdevices and brighter beams for optical devices,cooling of such devices and related systems is acrucial issue in high-tech industries such astransportation and microelectronics. Theconventional approach for increasing cooling ratesis use of extended surfaces such as fins andmicrochannels. However, current designs havealready stretched this approach to its limits.Therefore, an urgent need exists for new andinnovative concepts to achieve ultra-high-performance cooling.
Modern fabrication technology provides greatopportunities to process and produce materials atthe nanoscale. The thermal, mechanical, optical,magnetic, and electronic properties of nanophasematerials are superior to those of conventionalmaterials with coarse grain structures.Consequently, nanophase materials have drawnconsiderable attention from material scientists andengineers alike. Thus, taking a different tack fromextended surface approaches and exploiting theunique properties of nanoparticles, ArgonneNational Laboratory has pioneered a new kind ofultra-high-thermal-conductivity fluids, callednanofluids, by uniformly and stably suspending avery small quantity (preferably <1% by volume)of nanoparticles in conventional coolants [1].
In fact, numerous theoretical and experimentalstudies of the effective thermal conductivity ofdispersions that contain solid particles have beenconducted since Maxwell’s theoretical work waspublished about 100 years ago [2]. However, thestudies on thermal conductivity of suspensionshave been confined to millimeter- or micrometer-sized particles. The major problem withsuspensions containing millimeter- or micrometer-sized particles is the rapid settling of theseparticles. In contrast, nanoparticles remain insuspension almost indefinitely. Furthermore, wehave demonstrated that the dispersion of a tinyamount of nanoparticles in traditional fluidsdramatically changes their thermal conductivities.For example, small amounts (<1 vol.%) of copper
nanoparticles or carbon nanotubes dispersed inethylene glycol or oil can increase their inherentlypoor thermal conductivity by 40 and 150%,respectively [3-4].
Since the pioneering work of Choi [1], outstandingdiscoveries and seminal achievements have beenreported in the emerging field of nanofluids.Among them, the four key features of nanofluidsare thermal conductivities far above those oftraditional solid/liquid suspensions [3-4],nonlinear relationship between thermalconductivity and concentration [4], stronglytemperature-dependent thermal conductivity [5],and significant increase in critical heat flux (CHF)[6] (see Figure 1). These key features ofnanofluids make nanofluids strong candidates forthe next generation of coolants for improving thedesign and performance of thermal managementsystems.
Key Featuresof Nanofluids
StronglyTemperature-DependentConductivi ty
Nonlinear Increasein Conductivity
with Concentration
Ult ra-High ThermalConductivi ty at Low
Concentrations
SignificantIncreasein CHF
Figure 1. Four key features of nanofluids which havebeen discovered by a number of recent studies
Results and DiscussionIt has long been known that liquid molecules closeto a solid surface form layered solid-likestructures, but little is known about the connectionbetween this nanolayer and the thermal propertiesof the suspensions. We proposed for the first timethat that this nanolayer acts as a thermal bridgebetween a solid nanoparticle and a bulk liquid [7].We then modified the Maxwell equation for theeffective thermal conductivity of solid/liquidsuspensions to include the effect of this orderednanolayer. Subsequent calculations have shown

Heavy Vehicle Systems Optimization Program FY 2003 Annual Report
73
the importance of nanolayers in nanofluid thermalconductivities [7]. Figure 2 shows that this orderednanolayer has a major impact on nanofluid thermalconductivity when the particle radius is <5 nm.This finding suggests that adding smaller (<10 nmdiameter) particles could be potentially better thanadding more particles to concoct next-generationcoolants for faster cooling of high-heat-loaddevices and systems.
We have developed a simplified one-dimensionaldrift velocity model of a nanofluid [8]. We foundthat, if the thermophoretically drifting particlesdrag a modest amount of the surrounding fluidwith them, the contribution to the thermalconductivity is approximately one-third of theexperimental measurements. Yet, it is an order ofmagnitude improvement compared toconventional models.
The thermal conductivity of nanofluids have beenmeasured at room temperature by the transienthot-wire (THW) method. To measure nanofluidthermal conductivities as a function of temperaturewe have modified the transient hot-wire apparatusand demonstrated that the thermal conductivitiesof nanofluids can be measured at temperaturesfrom ambient to about 85°C.
0
2
4
6
8
10
12
0 5 10 15 20 25
φ = 0.01, h = 1 nmφ = 0.01, h = 2 nmφ = 0.05, h = 1 nmφ = 0.05, h = 2 nm
(ke-k
l)/(k M
axw
ell-k
l)
Radius r (nm)
Figure 2. Thermal conductivity enhancement ratio as afunction of particle radius for copper-in-ethylene-glycolsuspensions (klayer = kp). Here, r and φ are the particleradius and particle volume concentration, respectively.h is the thickness of the nanolayer. A three- to eight-fold increase in the thermal conductivity of nanofluidscompared to the enhancement without considering thenanolayer occurs when nanoparticles are smaller thanr = 5 nm. However, for large particles (r >> h), thenanolayer impact is small.
A small volume (~100 ml) flow loop has beenconstructed to measured the heat transfercoefficient of nanofluids (see Figure 3). A variabledisplacement pump is used to control the fluidflow rate and direction, and its displacementsettings are calibrated to determine the volumetricflows (62 to 507 cm3/min). The fluid first passesthrough the thermostatic heating jacket in whichwater is used as heating fluid, with its temperatureset at either 50°C or 70°C. Four thermocouples areplaced as shown in the diagram, two of which, 1and 4, measure the fluid temperature at the inletand outlet of the test area, and the other two, 2 and3, are placed at the inlet and outlet of the heatingjacket to measure water temperature. Static mixersare put at the ends of the test section to mix thefluids and improve accuracy of the fluidtemperature measurement. A thermostatic coolingjacket system, which is adjusted to 5°C, is used torun the loop in a steady state. The bubble collectorcollects and separates air bubbles from the fluid.
Figure 3. Schematic diagram of heat transfer testapparatus
Two series of nanofluids are investigated in thisstudy: graphite nanoparticles-in-commercialautomatic transmission fluid (ATF) and graphitenanoparticles-in-synthetic oil with commercialadditive packages [9]. Although the graphitenanoparticles are obtained from two commercialsources, they are of very similar size and shape,with the average diameter of the “disk” about1 µm and thickness around 30 nm. However, themeasured heat transfer coefficients (normalized tothat of the base fluid) of nanofluids at 2 wt.% and2.5 wt.% nanoparticles differ by a factor of more

Heavy Vehicle Systems Optimization Program FY 2003 Annual Report
74
than five. It seems some special factors, which arestill unknown to us, in the nanofluids, are affectingthe heat transfer performance of the mixture. Webelieve that it is critical to characterize the flowbehavior of nanofluids in tubes in order to explainstrongly concentration-dependent heat transfercoefficient of nanofluids in tubes.
Inspired by our discoveries of these features ofnanofluids, other groups across the world havebegun nanofluid research and provided furtherbreakthroughs. Among them, Das et al. exploredthe temperature dependence of the thermalconductivity of nanofluids containing Al2O3 orCuO nanoparticles [5]. Their discovery of a 2- to4-fold increase in thermal conductivityenhancement for nanofluids over a smalltemperature range (21-51°C) implies thatnanofluids could be smart fluids “sensing” theirthermal environment. This new feature makesnanofluids even more attractive as coolants fordevices with high energy density. Das et al.suggested that the strong temperature dependenceof thermal conductivity is due to the motion of thenanoparticles. You et al. [6] measured the criticalheat flux (CHF) in a boiling pool of nanofluidscontaining an extremely small amount of aluminananoparticles. They discovered a dramaticincrease (up to about 200%) in CHF when thenanofluid is used as a cooling liquid instead ofpure water.
The nanofluid team at Argonne in collaborationwith researchers in several universities haspublished pioneering journal articles on nanofluidsincluding the first review article on nanofluids[10].
Future DirectionA major focus in nanofluids has been on thethermal conductivity of nanofluids. Nanofluidswill be produced and characterized to generate adata base on their thermal conductivity. However,a new focus will be on the flow and heat transferof nanofluids. The strongly concentration-dependent heat transfer coefficient of nanofluidsin tubes suggests that it is critical to characterizethe flow behavior of nanofluids in tubes. Forexample, theories of flow in tubes or porousmaterials have been developed at the macroscopic
level. However, we believe that it is vital toconnect the structure and mobility of nanoparticlesat the nano- or micro-scale to the properties ofnanofluids measured at macroscopic level.Therefore, we will explore the flow characteristicof nanofluids in tubes and measure the heattransfer coefficient of nanofluids in tubes. We willthen relate enhanced thermal conductivity andflow characteristic to enhanced heat transfercoefficient of nanofluids. The flow and heattransfer data for nanofluids will be used todetermine whether the flow and heat transfercorrelations developed for homogenous fluidscould be applied to nanoparticle dispersions withaspect ratios different from one.
A transient hot-wire cell, which has been used tomeasure nanofluid thermal conductivities, requiresa large quantity of nanofluid samples. We willdesign and fabricate a temperature oscillatingsystem for temperature-dependent thermalconductivity measurements of a tiny quantity(2-10 ml) of nanofluids.
Most studies carried out to date are limited to thethermal characterization of nanofluids withoutevaporation or condensation. However,nanoparticles in nanofluids can play a vital role intwo-phase heat transfer systems. Therefore, thereis a great need to characterize nanofluids inboiling and condensation heat transfer. The highcritical heat flux of nanofluids is importantparticularly for two-phase engine cooling. Thenanofluid tested by You et al [6] contains alumina(Al2O3) nano-particles dispersed in distilled anddeionized water. We will design and fabricate apool boiling test facility and characterize metallicand oxide nanofluids in pool boiling.
We have developed simple models ofnanostructure-enhanced [7] and nanoparticlemobility-enhanced thermal conductivity ofnanofluids [8]. However, much is still unknownabout the mechanisms of the anomalous thermalbehavior of nanofluids. Therefore, we need tounderstand the fundamentals of energy transport innanofluids. As we discover new energy transportmechanisms that are missing in existing theorieswe will refine simple models of nanostructure-enhanced and nanoparticle mobility-enhancedthermal conductivity of nanofluids or develop a

Heavy Vehicle Systems Optimization Program FY 2003 Annual Report
75
new model of energy transport in nanofluidsintegrating new mechanisms. A betterunderstanding of the mechanisms behind thethermal-conductivity enhancement will likely leadto recommendations for nanofluid design andengineering for industrial applications.
ConclusionsNanofluids have some potential impacts. Forexample, improved thermal conductivity ofnanofluids translates into cost and energy savingsfrom smaller, lighter cooling systems and acleaner environment. Nanofluids could be smartfluids “sensing” their thermal environment.
The key features such as thermal conductivities farabove those of traditional solid/liquid suspensions,nonlinear relationship between thermalconductivity and concentration, stronglytemperature-dependent thermal conductivity, andsignificant increase in critical heat flux (CHF).These key features of nanofluids make nanofluidsstrong candidates for the next generation ofcoolants for improving the design andperformance of thermal management systems.
References1. S.U.S. Choi, “Enhancing Thermal
Conductivity of Fluids with Nanoparticles,”Developments and Applications of Non-Newtonian Flows, eds. D.A. Siginer and H.P.Wang, The American Society of MechanicalEngineers, New York, FED–Vol. 231/MD-Vol. 66, pp. 99–105 (1995).
2. J.C. Maxwell, Electricity and Magnetism,1st Ed., Clarendon Press, Oxford (1873).
3. J.A. Eastman, S.U.S. Choi, S. Li, W. Yu, andL.J. Thompson, “Anomalously IncreasedEffective Thermal Conductivities of EthyleneGlycol-Based Nano-Fluids Containing CopperNano-Particles,” Applied Physics Letters, 78,718–720 (2001).
4. S.U.S. Choi, Z.G. Zhang, W. Yu,F.E. Lockwood, and E.A. Grulke,“Anomalous Thermal ConductivityEnhancement in Nano-tube Suspensions,”Applied Physics Letters, 79, 2252–2254(2001).
5. S.K. Das, N. Putra, P. Thiesen, andW. Roetzel, “Temperature Dependence ofThermal Conductivity Enhancement forNanofluids,” ASME J. Heat Transfer,Vol. 125, pp. 567–574.
6. S.M. You, Kim, J.H., and Kim, K.H., 2003,“Effect of Nano-Particles on Critical HeatFlux of Water in Pool Boiling Heat Transfer,to be published in Applied Physics Letters.
7. W. Yu and S.U.S. Choi, “The Role ofInterfacial Layers in the Enhanced ThermalConductivity of Nanofluids: A RenovatedMaxwell Model,” J. Nanoparticle Research,in press (2003).
8. W. Yu, J.R. Hull, and S.U.S. Choi, “Stableand Highly Conductive Nanofluids –Experimental and Theoretical Studies,”Presented at the 6th ASME-JSME ThermalEngineering Joint Conference, HawaiianIslands, March 16–23 (2003).
9. Y. Yang, Z.G. Zhang, E.A. Grulke,W.B. Anderson, G. Wu, Heat transferproperties of nanoparticle-in-fluid dispersions(nanofluids), in preparation.
10. S.U.S. Choi, Z.G. Zhang, and P. Keblinski,“Nanofluids,” To be published in theEncyclopedia of Nanoscience andNanotechnology, H.S. Nalwa, ed., AmericanScientific Publishers, Stevenson Ranch, CA(2003).

Heavy Vehicle Systems Optimization Program FY 2003 Annual Report
76
E. Application of Single- and Two-Phase Flow Microscale Technologies forAutomotive Thermal Management
Principal Investigators: N.T. Obot and J.R. HullArgonne National Laboratory9700 South Cass Avenue, Argonne, Illinois 60439(630) 252-7638; fax: (630) 252-5568; [email protected]
Technology Development Manager: Sid Diamond(202) 586-8032; [email protected] Program Manager: Jules Routbort(630) 252-5065; [email protected]
Contractor: Argonne National LaboratoryContract No.: W-31-109-ENG-38
Objective• The goal is to determine the suitability of single phase and two-phase flow microscale technologies such as
arrays of microchanel and micro heat pipes for automotive thermal management.
Approach• Review the literature to understand and evaluate previous and current research and thermal management issues.
• Develop a model to study heat rejection from automotive components fitted with microscale devices.
• Design, fabricate and test heat transfer devices to determine the performance of devices in automotiveenvironment.
Accomplishments• Completed comprehensive review of the literature on friction and heat/mass transfer in microchannels.
• Completed review of the literature on conventional heat pipes and micro heat pipes.
Future Direction• Complete the development of model and thermal analysis.
• Design, fabricate and qualify the micro devices for operation.
• Perform full-scale testing in automotive environment.
IntroductionSingle-phase and two-phase flow microscale thermalcontrol technologies such as micro heat exchangersand micro heat pipes appear attractive forautomotive applications where substantial coolingcapacity and high degree of temperature uniformityand control are desired. Potential benefits of thesetechnologies include significant reductions in weightand size and overall simplification in design of
thermal management systems. These benefits aredue to the fact that microscale devices usuallyoperate in laminar flow, requiring minimum fluidvolume and weight.
Microscale thermal control devices have been usedto address thermal management problems in thesemiconductor industry, satellite and spacecraftelectronics and high-performance aircraft engines.

Heavy Vehicle Systems Optimization Program FY 2003 Annual Report
77
But little has been done to determine their suitabilityfor thermal management of automotive powersystems.
Literature ReviewBecause micro thermal devices are best fabricated inthe form of microchannels, it was necessary to beginthe feasibility study by reviewing the literature onfriction and heat/mass transfer in microchannels.The results of the review were published in thejournal of Microscale Thermophysical Engineering,Vol. 6, #3, pp. 155-173, 2002. Figure 1 shows thevariation of the average heat transfer coefficients,expressed in dimensionless form as the Nusseltnumber (Nu), with the mass flow rate, alsoexpressed in dimensionless form as the Reynoldsnumber (Re). The Prandtl number (Pr), used to scaleNu in Figure 1, is the fluid properties expressed indimensionless form. In the figure, the results of Obotet al. obtained with a much larger diameter smoothtube, 13.39 mm, are included for the purpose ofcomparison.
The main conclusions from the review were (a) thereis hardly any evidence to support the occurrence oftransition to turbulence in smooth microchannels for
Re ≤ 1,000; (b) Nu ∝ Re1/2 in laminar flow; and(c) estimates of transfer coefficients for smoothmicrochannels, accurate within experimental errors,can be obtained by using either conventionalcorrelations or experimental results for channels oflarge hydraulic diameter.
With the completion of the microchannel frictionand heat/mass transfer literature review, a review ofthe relevant literature on micro heat pipes wasundertaken to evaluate their suitability forautomotive thermal management. This phase of theresearch was completed. It was determined thatarrays of micro heat pipes would lend themselvesreadily to integration into automotive powersystems.
Future Research PlansThe main focus of future research is modeling ofheat removal and subsequent dissipation fromautomotive power systems with microchannels ofvarious designs. To accomplish this goal, thedevelopment of a comprehensive 1-D system modelis in progress. Upon completion, the code will beused to simulate heat removal with single phase andtwo-phase flow. The arrays of flow passages or
0.1
1
10
100
1000
10 100 1000 104 105
Adam et al. [20], Dh = 760 µm
Adam et al. [20], Dh = 1090 µm
Choi et al. [12], Dh = 81.2 µm
Yu et al. [13], Pr = 2.53Obot et al. [2], Fig. 1, Pr = 6.8Obot et al. [2], Fig. 1, Pr = 0.7Wu and Little [18], Channel 3Wu and Little [18], Channel 2Wu and Little [18], Channel 1
Nu/
Pr0.
4
Reynolds Number, Re
Figure 1. Comparison of various results for average heat transfercoefficients

Heavy Vehicle Systems Optimization Program FY 2003 Annual Report
78
micro heat pipes will consist of parallel rectangularmicrochannels or branching patterns to provideprecise temperature uniformity.
The results of the study will enable comparison ofthe performance of conventional thermalmanagement scheme with that using micro thermaldevices. Also, practical issues and technicalchallenges of using microscale devices in thermalmanagement of automotive power systems will beidentified. Further, the results will form the basis forsubsequent experimental design and testing.
ConclusionsThis research project is in its infancy. The progressto date is good. If the concept of microscale thermalmanagement for automotive power systems can besuccessfully demonstrated, the prospects for industryparticipation are excellent.

Heavy Vehicle Systems Optimization Program FY 2003 Annual Report
79
F. Underhood Thermal Analysis
Principal Investigator: F.-C. Chang, T. Sofu, and J.R. Hull (contact)Argonne National Laboratory9700 South Cass Avenue, Argonne, Illinois 60439(630) 252-8580; fax: (630) 252-5568; [email protected]
Technology Development Manager: Sid Diamond(202) 586-8032; [email protected] Program Manager: Jules Routbort(630) 252-5065; [email protected]
Contractor: Argonne National LaboratoryContract No.: W-31-109-ENG-38
Objective• Gain insight into the ventilation needs for an enclosed engine compartment of an off-road machine, and help
understand the effects of ventilation air flow on heat rejection and component temperature.
• Perform an assessment of 1-D and 3-D simulation methodology for optimized ventilation air flow rate,component temperatures and engine heat rejection.
Approach• Perform an assessment of 1-D and 3-D simulation methods to predict underhood ventilation air flow and
component temperatures using the experimental data.
• The 1-D thermal-fluid network model was developed to account for overall energy balance and simulatecooling system response. The 3-D CFD model was built to determine the flow paths and the surface heattransfer coefficient for ventilation air system.
Accomplishments• A combined 1-D and 3-D simulation methodology was developed for optimization of engine compartment
ventilation air flow. The results indicate that temperature and the distributed heat rejection rates can beestimated within reasonable accuracy when 1-D and 3-D models are used in combination.
Future Direction• Use the combined 1-D and 3-D simulation methodology to study the effect of air flow inlet location on
ventilation air and component temperatures, and engine heat rejection.
• Perform the sensitivity analysis for all airflow inlet locations to evaluate the system performance for off-roadvehicle’s thermal management.
IntroductionConstruction equipment and other types of heavyvehicles have common underhood thermalmanagement challenges: restrictive enclosures andever-increasing variety of heat sources. But off-roadmachines have rather unique additional underhoodthermal management issues such as
• High auxiliary loads,• Severe operating conditions involving dust and
debris,• Wide range of altitudes and temperatures,• Lack of ram air, and• Increasingly restrictive sound regulations.

Heavy Vehicle Systems Optimization Program FY 2003 Annual Report
80
In addition to the cooling system design, the thermalmanagement challenge for a system with separateengine enclosure (as shown in Figure 1) is tomaintain acceptable underhood componenttemperatures in a relatively well sealed enclosurewith limited ventilation. The specific issues forunderhood temperature control are the ventilation airflow requirements and the effect of ventilation onthermal balance (e.g., cooling system design).
To address these issues, a Cooperative Research andDevelopment Agreement (CRADA) has beenexecuted between Argonne National Laboratory andCaterpillar, Inc. for measurement and analysis ofunderhood ventilation air flow and temperatures.The experimental effort by the Caterpillar team hasfocused on building a prototypical test-rig for an off-road machine engine, and conducting tests withcontrolled ventilation air flow rates from variousinlet locations to estimate the ventilation needs in anenclosed engine compartment [1]. The purpose ofthe analytical studies by the Argonne team (withmodeling support from Flowmaster USA) has beenthe assessment of various simulation methods thatcould be used in predicting underhood ventilation airflow and temperatures. The work involveddevelopment and validation of combined 1-D and3-D simulation models of the Caterpillar test-rig foroptimized ventilation air flow rate. Although theseparated cooling system compartments are uniqueto off-road machines, the Caterpillar tests and thecomplementary analyses provide an opportunity to
Service Wall
Figure 1. Schematic of an off-road machine withseparated engine and cooling system compartmentsdivided with service wall
understand the isolated effect of air cooling on theengine performance for a wide range of heavy-vehicles.
Analytical StudiesComputer simulations can improve theunderstanding of interactions between the enginesubsystems [2]. The main purpose of this study hasbeen an assessment of simulation methods that couldbe used in predicting underhood ventilation air flowfield and temperatures for an off-road machine. Thework involved development and validation ofcombined 1-D and 3-D simulation models of theCaterpillar test-rig. A 1-D thermal-fluid networkmodel was developed to account for overall energybalance and simulate cooling system response usingthe commercial software Flowmaster [3]. A 3-Dunderhood model of the complex test rig was builtusing the commercial CFD software Star-CD [4] todetermine the flow paths for the ventilation airsystem and the surface heat transfer coefficient.
3-D CFD AnalysisStarting with a CAD model of the test rig, anunstructured hexahedral mesh was generated usingStar-CD’s underhood expert system module ES-Uhood. First the IGES surface definitions wereextracted from the CAD model, and then the ProSurfutility was used to generate a triangulated surfacemesh. Starting from this mesh, surface fixingfunctions were used to merge the overlappingsurfaces, fill the open holes, generate feature lines,and create a new “wrapped” surface which capturesthe details of computational domain boundaries in 8mm resolution (Figure 2a). This wrapped surfaceformed the basis of an extrusion layer through whichthe suitability of turbulence wall function is assured.Although the flow is expected to separate over thecomplex engine geometry, the inherent assumptionof attached flow is made through the use oflogarithmic wall function since the integration to thewall is computationally prohibitive. After filling thecomputational domain with regular brick cells withgradual mesh refinement near the engine andenclosure surfaces, the volume mesh was completedby cutting those hexahedral cells that intersect theextrusion layer (Figure 2b).

Heavy Vehicle Systems Optimization Program FY 2003 Annual Report
81
Front Inlet
OutletOutlet
Figure 2. CFD mesh of the test rig (a) cutaway view of the surface mesh (b) a cross section ofthe volume mesh
In order to capture the ventilation air flowdistribution at the enclosure inlet accurately, a largeinlet plenum (not shown in Figure 2) was alsoincluded in the model to represent ambientconditions (pressure and temperature). The desiredflow rate through the enclosure was assured byimposing a proportional uniform flow field at theplenum inlet as the boundary condition. Theenclosure outlet pipe was considered much longerthan what is shown in Figure 2 and its top end wastreated as a standard outlet boundary. The final CFDmodel consists of 1.34 million fluid cells, with a3 mm thick extrusion layer surrounding the engineand enclosure surfaces to give a maximum y+ valueof 200 for airflow ratio of 1.5.
1-D Network Thermal-Flow AnalysisThe complete thermal system analyzed with thenetwork flow model is a collection of differentthermal subsystems of an off-road machine engineincluding the air, coolant, and oil loops. The modelconsists of 1-D descriptions of these three loopscombined with a lumped parameter approach tocharacterize the thermal interactions between themthrough the engine structure as the major conductionpaths (Figure 3). This approach simplifies thecomplex engine system by discretizing it based onknown heat transfer paths under steady-stateconditions; i.e., the heat generated from combustionis considered to be transferred to various discrete
surface points on the engine using specifiedconduction paths. This 1-D network flow modelserved as a tool to analyze the interactions of theengine with the ventilation air, coolant, and oil loopsfor predicting the complete thermal systemperformance.
Air flow paths in the 1-D model are based on 3-Dsimulation results. In the air loop, the enteringventilation air is considered to gain heat as it passesthrough individual surface points on the engine asshown in Figure 3. In the oil loop, after losing heatthrough the oil pan, the flow splits into threeseparate branches (the turbo, the cylinder head, andthe engine block) before returning to the sump. Inthe coolant loop, the water cools the lubrication oilin the oil loop and circulates inside the engine blockand the cylinder head. The radiator is simplymodeled as a source with constant flow rate and withknown inlet temperature.
Steady-state simulation was done for a given enginerated condition with conduction, convection, andradiation models. The air enters at the enclosure inletwith given temperature, pressure, and flow rate andexits at the enclosure outlet with anothertemperature, pressure, and flow rate. The heat loadswere calculated at the engine surfaces. Once themodel is validated, similar models can be quicklycreated to analyze engines of similar geometry.

Heavy Vehicle Systems Optimization Program FY 2003 Annual Report
82
Figure 3. 1-D network flow model of the test rig for front-inlet configuration
Interface between 3-D CFD and 1-D NetworkFlow ModelsFigure 4 shows the schematic of the sequentialanalyses with the 1-D network flow and 3-D CFDmodels. The 1-D model requires flow rates and inlettemperatures as the boundary conditions in the airand coolant loops and oil pump speed in the oil loopto account for overall energy balance and predict theengine component temperatures. In the 3-D thermalanalysis, these predictions are prescribed as surfacetemperature boundary conditions for various enginecomponents and enclosure walls, and they are usedto calculate ventilation air flow field andtemperatures. The results of the 3-D CFD analysisare, in return, provided back to the 1-D model toimprove component temperature predictions bymodifying the air flow paths and heat transfercoefficients between the engine components andventilation air. The typical values of estimated heattransfer coefficients between the engine componentsand ventilation air are found to vary in the rangefrom 10 to 50 W/m2-K.
3-D CFD Results and RestrictionAs examples of the results obtained with the CFDmodel, the ventilation air flow field and temperaturedistributions are shown in Figure 5 on a verticalplane through the enclosure front inlet. The resultsindicate that the most significant pressure drop takesplace near the inlet and outlet restrictions. Consistentwith the experimental observations, the resultsindicate a well mixed flow inside the enclosure withno significant difference in component temperaturesfor different ventilation inlet locations.
The comparison of the experimental and 3-D modelpredictions for pressure drop through the test rig isshown in Figure 6 as a function of airflow ratio. They axis is the normalized pressure drop for flowthrough the enclosure. A good agreement for such“system restriction curves” is the first indication thatCFD model captures the flow field accurately. Theother comparisons (air temperatures throughout theenclosure) are consistent with the experimentalvalues when accurate surface temperatures arespecified as the boundary conditions.

Heavy Vehicle Systems Optimization Program FY 2003 Annual Report
83
Boundary Cond itions:Coo lan t flow ra te and in le t tem pera tu reO il pum p speed
1-D N etw ork F low M ode lus ing FLO W M ASTER
(A ll fou r loops)
3 -D C FD M ode lus ing STAR -CD
(on ly fo r ven tila tion a irflow in s ide enc losu re)
O u tpu t:Su rface tem pera tu resA ir tem pera tu resO il and coo lan t tem ps.
M ode l Im provem ents
Boundary Cond itions:A ir flow ra te and in le t tem pera tu re
O u tpu t:Ven tila tion a ir flow pa ths and hea t transfe r ra tesbe tw een eng ine and a ir
Figure 4. Flowchart of coupled computations between FLOWMASTER and STAR-CD
Figure 5. Calculated ventilation air flow field and temperature distributions on avertical plane that intersects the front inlet
0.0
0.2
0.4
0.6
0.8
1.0
0.0 1.0 2.0 3.0Airflow Ratio
Nor
malized
Pre
ssur
e Dro
p CalculatedExperimental
Figure 6. System restriction curve comparisons for frontinlet
1-D Temperature ComparisonsThe various temperatures in the 1-D model arecalculated based on the engine componentdimensions and the heat transfer coefficients at thesolid-fluid interfaces as input. Some physicaldimensions for the internal loops of the engine were
supplied by Caterpillar and others were interpretedbased on CAD data. A comparison of measured andcalculated ventilation air, coolant water, and oiltemperatures is shown in Figure 7 and surfacetemperatures is shown in Figure 8. Most of thepredictions with the 1-D network model are within10% of the experimental values. For a complexnetwork of engine and its thermal subsystems ofcoolant, oil, and ventilation air, these smalldiscrepancies are considered a respectable degree ofaccuracy.
Although the discrepancies are generally small, theattempts to resolve them are part of the overallmodeling effort to provide a better description of theunderhood system. For example, based on the CFDresults, the discrepancy for the exhaust-side rearventilation air temperature is attributed to a localrecirculation zone in that region. However, since theestimated temperature is small and its impact onoverall temperature distributions is negligible, a
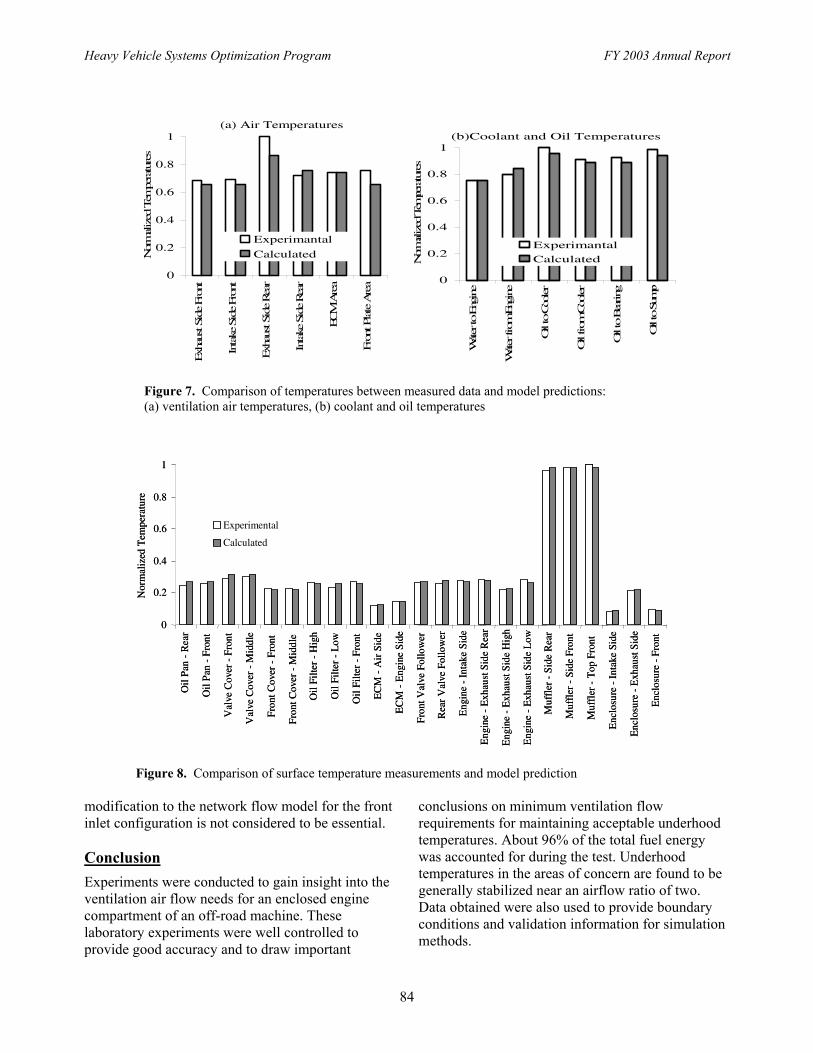
Heavy Vehicle Systems Optimization Program FY 2003 Annual Report
84
(a) Air Temperatures
0
0.2
0.4
0.6
0.8
1
Exh
aust S
ide Fr
ont
Inta
ke S
ide Fr
ont
Exh
aust S
ide Rea
r
Inta
ke S
ide Rea
r
ECM
Are
a
Fron
t Pla
te A
rea
Nor
mal
ized
Tem
pera
ture
s
Experimantal
Calculated
(b)Coolant and Oil Temperatures
0
0.2
0.4
0.6
0.8
1
Water to
Eng
ine
Water fro
m E
ngine
Oil
to C
ooler
Oil
from
Coo
ler
Oil
to B
earing
Oil to S
ump
Nor
malized
Tem
peratures
Experimantal
Calculated
Figure 7. Comparison of temperatures between measured data and model predictions:(a) ventilation air temperatures, (b) coolant and oil temperatures
0
0.2
0.4
0.6
0.8
1
Oil
Pan
-R
ear
Oil
Pan
-Fr
ont
Val
ve C
over
-Fr
ont
Val
ve C
over
-M
iddl
e
Fron
t Cov
er -
Fron
t
Fron
t Cov
er -
Mid
dle
Oil
Filte
r -
Hig
h
Oil
Filte
r -
Low
Oil
Filte
r -F
ront
EC
M -
Air
Sid
e
EC
M -
Eng
ine
Side
Fron
t Val
ve F
ollo
wer
Rea
r V
alve
Fol
low
er
Eng
ine
-Int
ake
Side
Eng
ine
-E
xhau
st S
ide
Rea
r
Eng
ine
-E
xhau
st S
ide
Hig
h
Eng
ine
-E
xhau
st S
ide
Low
Muf
fler
-Si
de R
ear
Muf
fler
-Si
de F
ront
Muf
fler
-T
op F
ront
Enc
losu
re -
Inta
ke S
ide
Enc
losu
re -
Exh
aust
Sid
e
Enc
losu
re -
Fron
t
Nor
mal
ized
Tem
pera
ture
Experimental
Calculated
Figure 8. Comparison of surface temperature measurements and model prediction
modification to the network flow model for the frontinlet configuration is not considered to be essential.
ConclusionExperiments were conducted to gain insight into theventilation air flow needs for an enclosed enginecompartment of an off-road machine. Theselaboratory experiments were well controlled toprovide good accuracy and to draw important
conclusions on minimum ventilation flowrequirements for maintaining acceptable underhoodtemperatures. About 96% of the total fuel energywas accounted for during the test. Underhoodtemperatures in the areas of concern are found to begenerally stabilized near an airflow ratio of two.Data obtained were also used to provide boundaryconditions and validation information for simulationmethods.

Heavy Vehicle Systems Optimization Program FY 2003 Annual Report
85
A combined 1-D and 3-D simulation methodologywas developed for optimization of enginecompartment ventilation air flow. The air flow fieldand the rate of heat transfer between engine andventilation air inside the enclosure were determinedwith the 3-D CFD simulations. A 1-D networkmodel was built by discretizing the various fluidpaths and the solid metal structure in the system.Once the ventilation air flow paths and heat transfercoefficients were determined with CFD, the 1-Dnetwork model with reduced complexity was used tosimulate thermal interaction of the engine structurewith the air, coolant, and oil flow. The resultsindicate that the temperatures and distributed heatrejection rates can be estimated within reasonableaccuracy when 3-D and 1-D models are used incombination.
References1. Srinivas R. Malipeddi, “Underhood Thermal
Management Guidelines,” Jan 2003, CaterpillarInternal Document.
2. C. Hughes, et al., “Heavy-Duty Truck CoolingSystem Design Using Co-Simulation,” SAETechnical Paper Series 2001-01-1707,Proceedings of Vehicle Thermal ManagementSystems Conference & Exhibition, Nashville,TN, May 14–17, 2001.
3. D.S. Miller, Internal Flow Systems, 2nd edition,Flowmaster International Ltd., published byBHR Group Limited, 1996.
4. Star-CD, Version 3.150A, CD-Adapco Group,Melville, NY.

Heavy Vehicle Systems Optimization Program FY 2003 Annual Report
86

Heavy Vehicle Systems Optimization Program FY 2003 Annual Report
87
III. More Electric Truck
Parasitic Energy Loss Reduction and Enabling Technologies for Class 7/8Trucks
Principal Investigator: W. LaneCaterpillar Inc., Technical Services DivisionP.O. Box 1875, Peoria, IL 61615(309) 578-8643; fax: (309) 578-4722; [email protected]
Technology Development Manager: Sid Diamond(202) 586-8032; [email protected] Program Manager: Jules Routbort(630) 252-5065; [email protected]
Contractor: DOE, Albuquerque, New MexicoContract No.: DE-FC04-2000AL67017
Objectives• Reduce parasitic losses for fuel savings
• Provide idle-reduction solutions
• Reduce radiator heat load
Approach• Electrify truck accessory functions and hotel loads
• Decouple accessories from main truck engine
• Match accessory power demand to real time need
• Enable use of alternative power sources
Accomplishments• Designed, fabricate, and tested electric accessories for on-highway truck applications
• Built Kenworth T-2000 demonstration truck with comprehensive electric accessory deployment
• Successfully completed functional over-the-road testing of technology demonstration truck
Future Direction• Conduct over-the-road fuel economy testing on technology demonstration truck
• Test implemented idle-reduction solution and measure fuel savings realization
• Evaluate additional fuel savings opportunities enabled by truck electrification

Heavy Vehicle Systems Optimization Program FY 2003 Annual Report
88
IntroductionOver the years, as the price of fuel has continued torise, the popularity of electric and hybrid electricvehicles has increased. The majority ofdevelopments have been focused on propulsionsystems. Parasitic losses from truck auxiliaryfunctions, such as pumps, compressors, etc., areanother source of inefficiencies that have remainedunchallenged. This research program coversdevelopments associated with the electrification ofClass 8 on-highway trucks to reduce parasitic lossesIncremental gains in fuel economy could be attainedeven using the present 12-volt electrical system, ifthe efficiency of the alternator is improved.However, to elevate efficiency from its near 50%level into the 80’s would require the application of adifferent type of alternator/generator technology.Such an improvement is likely to carry a costpremium that the trucking industry is unlikely toaccept. This creates a significant cost challenge ifthe fuel efficiency of a truck is to be improved byboosting the efficiency of individual components.
An alternative to component-by-componentreplacement is to take an overall system perspectiveto truck electrification. In some cases, electrifying acomponent may only provide marginalimprovements in fuel savings when used in the samemanner as its conventional counterpart. However, anelectric component could also be the enabler to adifferent mode of operation that could realizesignificant fuel savings. For example, idling a truckengine when the vehicle is parked is the commonmeans of providing cabin heat or cooling while adriver sleeps or does paperwork. This practice usesfuel inefficiently, may increase engine maintenance,creates additional exhaust emissions, and generallyincreases operating expenses. The electrification ofthe truck heating, ventilation and air conditioning(HVAC) system provides the capability ofconditioning the air to the cabin without having torun the truck engine. This is important because largequantities of fuel are burned just for that purpose.
With that precedent, this research program has beenfocused on converting conventional belt or geardriven accessories to electrically driven ones. Thisallows them to operate independently of the mainengine, at only the actual speed, pressure, or flowrequired. By continuously adjusting to the desired
operating points, there are multiple opportunities forparasitic loss reduction and control features. Toshow the benefits of electrification, a demonstrationvehicle is being built as part of this program. Thistruck is illustrated in Figure 1.
Figure 1. Demonstration vehicle
The “More Electric” Truck (MET) deploys acomprehensive electrification of truck accessoryfunctions as a means to improve fuel economy, heatrejection, reliability, power management, andpackaging flexibility. In it, several high poweraccessories are demonstrated in order to quantify thebenefits of truck electrification, both during normal“over-the-road” operations and under “idling”conditions. Among the electrical accessory systemsdemonstrated in this program are: starter–generator,heating ventilation and air-conditioner, electronicbattery charger, water pump, oil pump, brake aircompressor, and auxiliary power unit. Thesecomponents are described next.
Hardware DescriptionA dual voltage system (12 and 340 Vdc) wasselected for this demonstration, because the level ofelectrification on the MET is massive in comparisonto a conventional truck. The traditional/legacyelectrical loads are powered from the lower voltage(12-volt). The new accessories require large amountsof electricity, and they are powered at a highervoltage. This is because, at this level ofelectrification, the capabilities of a 12-, or 24-, andeven 42-volt system would be quickly overwhelmed.Thus, a 340-volt bus was selected for this appli-

Heavy Vehicle Systems Optimization Program FY 2003 Annual Report
89
cation. This system voltage is consistent with thosefound in hybrid-electric passenger cars. A discussionon the system components and their benefitsfollows.
Integrated Starter GeneratorThe heart of the MET electrical system is theintegrated starter-generator (ISG) located inside theflywheel housing (see Figure 2). It provides theprimary source of electrical power while the truckengine is running. It is a switched reluctancemachine with a 30 kW rating at normal engineoperating speeds, and 15 kW at low engine idle. Thegenerator efficiency is approximately 90% over theentire nominal speed range of operation. The ISG isliquid cooled using engine coolant that may reachtemperatures up to 120°C. The starter/generatorframe fits inside the standard truck engine flywheelhousing.
The ISG electronics are shown in Figure 3. Theelectronics are air-cooled to a heat sink temperatureof 85°C. The unit is rated for 30 kW at the nominalvoltage of 340 VDC. Rotor position and speed aredetermined using a sensorless algorithm based onwinding current and flux linkage. Existing voltageand current transducers provide the informationneeded by the algorithm.
Figure 2. Integrated starter generator (Stator)
Figure 3. ISG electronics
Engine Coolant PumpThe electrically driven engine coolant pump (waterpump) is shown in Figure 4. It operates from the340 volt bus. It delivers a 50/50 ethlyene-glycol/water mixture to the engine block and coolingsystem. The rated flow is designed to satisfy thecomplete needs of the engine under all operatingconditions. The coolant flow rate demand is set by asignal from the MET controller to the driveelectronics. The pump speed is controlled tomaintain the radiator top-tank temperature below apreset value and a minimum flow demanded by theengine. At the rated operating point, the powersavings delivered by the electrically driven pump arealmost 40% over the conventional pump. Furthersavings could be attained by matching the pumpspeed to the heat load present, i.e. enginetemperature, instead of the engine speed, consumingonly the power required to fulfill the cooling systemneeds. This approach reduces parasitic losses andimproves fuel economy. Aside from fuelconsumption, a variable speed water pump providesadditional benefits. In cold weather, slowing downthe pump leads to faster warm up, extended oil life,improved engine durability, and reduced cold startemissions.
Engine Oil Pump SystemThe primary specification driver for the electricmotor is the torque requirement for cold startingconditions when the engine oil is at its highestviscosity (cold weather operation.) This makes it

Heavy Vehicle Systems Optimization Program FY 2003 Annual Report
90
Figure 4. Water pump hardware
impractical to provide all the oil flow with a singleelectrically driven pump. For this reason, the METengine oil system uses a dual pump approach. Thereduced flow mechanical pump, directly driven bythe engine, provides most of the oil at higher enginespeeds. An electrically driven gear pumpsupplements oil supply at lower engine speeds. Inaddition to requiring a much smaller electric motor,this approach provides further drive efficiency gainsat higher engine speeds. The prototype hardware isshown in Figure 5. The mechanical pump is locatedinside the engine oil pan. For this demonstration, theelectrically driven pump is external to the oil pan.
The control strategy for the engine oil pump is tomaintain oil pressure according to a prescribedschedule reflecting given engine operatingconditions, but without being exclusively coupled to
Figure 5. Dual oil pump engine installation
engine speed. This approach provides fulllubrication to the engine, and eliminates bypassoperation once the oil is at its nominal operatingtemperature. This, of course, reduces parasitic lossesand improves fuel economy. In addition, the variablespeed capability contributes to improving warm-uptime and reducing cold start emissions.
Compressed Air ModuleThe air module supplies compressed air for brakingand ride control. It is shown in Figure 6. It uses thebasic components found in a standard truck aircompressor system, standard dryer and controls, anddual air tanks. Compressor operation is functionallyidentical to the conventional belt driven unit, but inthis case, the compressor is driven by an electricmotor. When increased air pressure is required, theair module controller instructs the motor to run untilthe pressure is restored. By decoupling the aircompressor from the engine it will be possible toimplement more efficient power managementstrategies for charging the system. The design takesadvantage of a more modular, plug-and-playapproach which makes integration and assemblyeasier.
Figure 6. Compressed air module
Auxiliary Power Unit (APU)The APU provides power to the MET truck whenthe main engine is not running. The functionalrequirements for the unit are: (1) provide adequatepower for all non-running engine needs, (2) noobjectionable operating characteristics that wouldaffect sleeping, and (3) no adverse effects on vehicle

Heavy Vehicle Systems Optimization Program FY 2003 Annual Report
91
reliability, maintenance, service and repair. The lubeand coolant systems have been integrated with thosefrom the main engine. This allows the use of APUresidual heat for warming the cabin and/or the mainengine block (before start-up). It also eliminates theneed for separate coolant and oil changes. The APUis shown in Figure 7.
Figure 7. Auxiliary power unit
Heating Ventilation & Air Conditioning (HVAC)The electric HVAC is a key component in theimplementation of anti-idling solutions. It providesconditioned air to the cabin either when the mainengine is running, or under APU or Shore Powermodes of operation. The system is shown inFigure 8. The refrigerant compressor is highlyreliable, efficient, and its speed is variable. Afterinitial cool-down from a hot-soak condition, thecabin temperature can be maintained at comfortablelevels with the compressor running at reduced speed,saving fuel and lowering power demands on theengine or APU. Also, the variable speed featureeliminates losses and it is very powerful forimplementing automatic temperature control.
Cabin heat is provided by a conventional glycol heatexchanger when the engine is running, and by anelectric heater when under APU or Shore Powermodes. Since the APU engine shares coolant withthe truck engine, glycol heat is also available whenthe APU is running. The electric heating module ismade of an electro-ceramic material exhibitingpositive thermal coefficient (PTC) characteristics. Incold weather conditions, the electric heat can also be
Figure 8. Electric HVAC unit
used as supplemental heat until the main enginewarms up. This provides instant heat to the operator,and it mitigates engine overcooling. In fact, it putsadditional load on the engine, which improves warmup times. In frigid conditions, both glycol andelectric heat are used simultaneously.
Electronic Modules and Cooled EnclosureThe Down Converter replaces the traditional belt-driven alternator by stepping down the generatorvoltage from 340 volts to 12 volts to supply thestandard electrical bus. This converter is a fullbridge, current mode, switched mode power supplyrunning at 40 kHZ using IGBT technology and HallEffect current sensors for current control.
The Shore Power unit accepts either 120VAC or240VAC and signals to the MEI controller as towhich one is in use. The MEI controller then limitsthe 340VDC bus loads to be consistent with either a15A (120VAC) or 30A (240VAC) source. This ACvoltage is rectified to DC and then boosted to supplythe 340VDC bus. An LC filter is placed between therectifier and the boost converter to improve the formfactor of the AC current waveform taken from theutility.
The Inverter supplies 120 volts, 60 hertz, forappliance/hotel loads, and the Shore-Power allowsconnection to the electric utility line (120/240 voltsingle phase power.) The inverter is a 12VDC to120VAC single-phase converter system. It is astand-alone unit which is not directly controlled bythe MET controller.

Heavy Vehicle Systems Optimization Program FY 2003 Annual Report
92
These power electronic modules, the ISG converter,and the oil and water pump motor drives areconfined to a single enclosure that is built around anair-cooled heat sink (see Figure 9). The box is sealedto 5 psi to protect the electronic modules from theelements. Power switches are cooled by conductioninto an aluminum baseplate which then conductsheat into the main air-cooled heatsink. A variablespeed blower provides the required air-movement tokeep the baseplate temperature below 85°C.
Figure 9. Electronics enclosure
Fuel Savings OpportunityEstimating fuel savings for an average over-the-roadcycle is challenging. The savings largely depend onhow the truck is used, weather conditions, roadcharacteristics, etc. It is difficult to conceive a singletest cycle that would be representative of the averagetruck. Truck fleets use their own load cycles basedon their more common routes. Engine manufacturersuse proprietary engine load profiles to baseline thefuel economy of their engines. For the purpose ofthis analysis, a simplified load factor is used. It willbe assumed that the over-the-road average engineload is 50% at a speed of 1,500 rpm. Under thiscondition, the fuel savings contribution of eachaccessory was computed. For the currentimplementation, analyses show that the electricaccessories would collectively lower the fuelconsumption of the truck by approximately300 gallons per year.
A second fuel savings opportunity is by curtailingovernight idling. It has been estimated that long-haultrucks idle an average of 1,830 hours per year.Engine idling speeds range from 600 to 1,000 rpmdepending on the driver’s preferences and weatherconditions. Thus, truck idling fuel consumption canbe calculated, for defined climatic conditions, usingmeasured engine fuel consumption at fractionalloads. A chart plotting the engine fuel rate requiredto power truck accessories during idling conditionsis shown in Figure 10. To determine the yearly fuelsavings, the following seasonal load factor was used:
• 6 months of spring and fall-like weather• 2 months of mild winter• 2 months of mild wummer• 1 month of cold winter• 1 month of hot summer
(w.r.
t. en
gine
idlin
g at
600
rpm
with
no
load
)
APU estimated (varying RPM)
0.0
0.5
1.0
1.5
2.0
2.5
3.0
0.0 2.0 4.0 6.0 8.0 10.0 12.0Power (kW)
Nor
mal
ized
Fue
l Rat
e
C15 Idle 600 RPMC15 Idle 1000 RPMAPU estimated, (varying RPM)
Figure 10. Truck and APU engine fuel rates vs. power
Table 1 lists the relative fuel consumption forvarious weather conditions. The entries are listed innormalized form. The nominal engine idling fuelrate (100%) is defined as the fuel rate on a bareengine running at 600 rpm with no load. Thecorresponding truck accessory load is listed in kW.
Given this breakdown, for a truck that idles1,830 hours per year burning approximately1,500 gallons of diesel fuel, the APU provides asavings of 900 gallons per year per truck. Furthersavings could be attained through Shore Power.Having the capability to power the electrified truck,without running an APU, would yield an annualsavings of 1,500 gallons (amount currently wastedby idling.) Of course, electricity wouldn’t be free,

Heavy Vehicle Systems Optimization Program FY 2003 Annual Report
93
Table 1. Relative fuel consumption by seasonFuel Usage
600 rpm 1000 rpmSpring/
FallMild
WinterMild
SummerCold
WinterHot
SummerTruckIdling
150%(3.7 kW)
150%(3.7 kW)
160%(4.7 kW)
230%(3.7 kW)
255%(6 kW)
APU Output1.7/2.5 kWelect/mech
45% --- --- --- ---
APU Output2.5/3.6 kWelect/mech
--- 60% 60% --- ---
APU Output5.2/7.4 kWelect/mech
--- --- --- 130% 130%
and the economics of such savings woulddepend on the price of electricity at the site.
Test Plans and Future WorkA Kenworth T-2000 Class-8 truck with aCaterpillar C-15 engine has been built with theelectric accessories shown in Figure 1. This truck isshown in Figure 11. A comprehensive series of fueleconomy tests will be conducted during the forthquarter of calendar year 2003 to validate the analysisresults presented in the preceding section. Thesetests are designed to obtain real-world truckperformance data over a range of terrain andconditions. They conform to the SAE Type-II(J1321) procedure, using a test vehicle and anunchanging control vehicle.
Figure 11. “More Electric” DOE truck
Summary and ConclusionsThe More Electric Truck capitalizes on the widespread use of electricity as a means to improveefficiency, power management, reliability,packaging flexibility, and customer value. Amongthe electrically driven accessory systemsdemonstrated in this program are the: starter–generator, heating ventilation and air-conditioner,electronic battery charger, water pump, oil pump,brake air compressor, and auxiliary power unit. Thisinstallation provides a significant opportunity forreducing fuel consumption on long-haul Class 8trucks. The dominant fuel savings opportunity is inreducing the amount of time the main engine idles.Although shore power offers the largest potentialbenefits, the likelihood of developing such largeinfrastructure in the foreseeable future would be low.An APU based solution would provide an importantinitial step toward reducing the fuel consumption ofClass 8 trucks. Although test results are not yetavailable, the fuel savings (from combined idle-avoidance and from over-the-road driving) areexpected to be in the order of 1,200 gallons of dieselfuel per year, per truck. On a truck that consumes20,000 gallons per year, this savings represents anapproximate 6% reduction in fuel consumption.With a population of 458,000 Class 8, long-haultrucks that idle overnight, the total potential savingsin the U.S. alone would be 550 million gallons ofdiesel fuel per year. The impact on the U.S.economy could be as much as $825 millionannually.

Heavy Vehicle Systems Optimization Program FY 2003 Annual Report
94

Heavy Vehicle Systems Optimization Program FY 2003 Annual Report
95
IV. Friction and Wear
A. Boundary Lubrication Mechanisms
Principal Investigators: O.O. Ajayi, J.G. Hershberger, and G.R. FenskeArgonne National Laboratory9700 South Cass Avenue, Argonne, IL 60439(630) 252-9021; fax: (630) 252-4798; [email protected]
Technology Development Manager: Sid Diamond(202) 586-8032; [email protected] Program Manager: Jules Routbort(630) 252-5065; [email protected]
Contractor: Argonne National Laboratory, Argonne, IllinoisPrime Contract No.: W-31-109-Eng-38.
ObjectiveDevelop a better understanding of the mechanisms and reactions that occur on component surfaces under boundarylubrication regimes. Specific objectives are
• Determine the basic mechanisms of catastrophic failure in lubricated surfaces in terms of materials behavior.
• Determine the basic mechanisms of chemical boundary lubrication.
• Establish and validate performance and failure prediction methodologies for lubricated components.
• Integrate coating and lubrication technologies for maximum enhancement of lubricated-surface performance.
Approach• Characterize the dynamic changes in the near-surface material during scuffing. Formulate a material-behavior-
based scuffing mechanism.
• Determine the chemical kinetics of boundary film formation and loss rate by in-situ X-ray characterization oftribological interfaces at the Advanced Photon Source (APS) at Argonne National Laboratory (ANL).
• Characterize the physical, mechanical, and tribological properties of tribo-chemical films, including the failuremechanisms.
• Integrate the performance and failure mechanisms of all the structural elements of a lubricated interface toformulate performance and/or failure prediction methodology; this will include incorporation of surfacecoatings.
Accomplishments• Conducted extensive characterization of microstructural changes during scuffing of 4340 steel, using scanning
electron microscopy (SEM) and X-ray analysis.
• Developed a model of scuffing initiation by an adiabatic shear instability mechanism.
• Using x-ray fluorescence, reflectivity and diffraction at the APS, demonstrated the ability to characterize tribo-chemical films generated from model oil additives.

Heavy Vehicle Systems Optimization Program FY 2003 Annual Report
96
Future Direction• Develop and validate a model for scuffing propagation and integrate it with an initiation model for a
comprehensive scuffing prediction method. Experimentally validate the scuffing theory for various engineeringmaterials.
• Design and construct a tribo-tester for in-situ characterization of tribo-chemical surface film at the APS.
• Using various techniques, continue to characterize tribo-chemical films formed by model lubricant additives.
• Characterize the physical, mechanical, and failure mechanisms of tribo-chemical films with nano-contact probedevices.
• Evaluate the impact of various surface technologies, such as coating and laser texturing, on boundarylubrication mechanisms.
IntroductionMost critical components in diesel engines andtransportation vehicle subsystems are oillubricated. Satisfactory performance of thesecomponents and systems is achieved through acombination of materials, surface finish, andlubricant oil formulation technologies often by anEdisonian trial-and-error approach. Indeed,experience is often the sole basis for new designand solutions to failure problems in lubricatedcomponents. With more severe operatingconditions expected for component surfaces inengines and vehicles, the trial-and-error approachto effective lubrication is inadequate and certainlyinefficient. Departure from this approach willrequire a fundamental understanding of bothboundary lubrication and surface failuremechanisms.
A major area of focus for Department of Energydevelopment of diesel engine technology isemission reduction. Some essential oil lubricantand diesel-fuel additives, such as sulfur,phosphorous, and chlorine, are known to poisonthe catalysts in after-treatment devices. Although,reduction or elimination of these additives willmake emission after-treatment devices moreeffective and durable, it will also render surfacesof many lubricated components vulnerable tocatastrophic failure. Indeed, most of the effectivemethods to reduce diesel engine emissions willalso render many critical-component surfacesvulnerable to catastrophic failure, therebycompromising their reliability.
Increases in vehicle efficiency will require anincrease in power density and increased severity ofcontact between many components in the engineand powertrain systems. This, again, willcompromise the reliability of various criticalcomponents, unless they are effectively lubricated.The efficacy of oil additives in protectingcomponent surfaces depends on the nature andextent of chemical interaction between the surfaceand the oil additives.
In addition to reliability issues, durability oflubricated components also depends oneffectiveness of oil lubrication mechanisms.Components will eventually fail or wear out overtime. Failure mechanisms that limit the durabilityof lubricated surfaces are wear in its variousforms, and contact fatigue. Wear is the gradualremoval of material from contacting surfaces, andit can occur by various mechanisms, such asabrasion, adhesion, corrosion, etc. Also, therepeated contact stress cycles to which componentcontact surfaces are subjected can initiate andpropagate fatigue cracks, and, ultimately lead tothe loss of a chunk of material from the surface.This damage mode is often referred to as pitting.Wear and contact fatigue are both closely relatedto boundary lubrication mechanisms. Antiwearadditives in lubricants are designed to form awear-protective layer on the surface. The role oflubricant additives on the contact fatigue failuremode is not fully understood, although it is clearthat the lubricant chemistry significantly affectscontact fatigue. Again, lack of an adequate,comprehensive understanding of basicmechanisms of boundary lubrication is a major

Heavy Vehicle Systems Optimization Program FY 2003 Annual Report
97
obstacle to a reasonable prediction of componentsurface durability.
The desire to extend the diesel engine oil draininterval, with an ultimate goal of a fill-for-lifesystem, is increasing. Successful implementationof the fill-for-life concept will requireoptimization of surface lubrication through theintegration of materials, lubricant, and, perhaps,coating technologies. Such an effort will requirean adequate fundamental understanding of surfacematerial behavior, chemical interaction betweenthe material surface and the lubricant and thebehavior of material and lubricant over time.
Some common threads run through all of thechallenges and problems in the area of surfacelubrication of engine components and systemsbriefly described above. The two key ones are lackof an adequate basic and quantitativeunderstanding of failure mechanisms ofcomponent surfaces, and lack of an adequateunderstanding of basic mechanisms of boundarylubrication, i.e., how lubricant chemistry andadditives interact with rubbing surfaces and howthis affects performance. To progress from theempirical trial-and-error approach to predictinglubricated-component performance, we believe abetter understanding of the basic mechanisms ofthe events that occur on lubricated surfaces isrequired. Consequently, the primary objective ofthe present project is to address some offundamental mechanisms of boundary lubricationand failure processes of lubricated surfaces. Thetechnical approach taken in this study differ fromthe usual one of posttest characterization oflubricated surfaces, and, rather, will develop in-situ characterization techniques for lubricatedinterfaces that will use the X-ray beam at the APSlocated at ANL. Using a combination of X-rayfluorescence, reflectivity, and diffractiontechniques, we will study, in real time, theinteraction between oil lubricants and theiradditives and the surfaces they lubricate. Suchstudy will provide the basic mechanisms ofboundary lubrication. In addition to surfacechemical changes, materials aspects of varioustribological failure mechanisms will be studied.
Results and DiscussionEffort during the past year focused on two paralleltasks, namely, study of the scuffing mechanismand development of methods for X-raycharacterization of boundary films.
Scuffing StudyScuffing, defined as a sudden catastrophic failureof a lubricated surface, is poorly understood and amajor source of reliability problems in enginecomponents. It is usually accompanied by asudden rapid rise in friction coefficient, noise andvibration, contact temperature and loss of surfaceintegrity. Microstrutural changes that occur duringscuffing of hardened 4340 steel were studied.Samples from scuffing tests were analyzed before,during, and after scuffing, as shown in Figure 1.
In a time span of an order of a microsecond,significant microstructual changes were observedto accompany scuffing. The originalmicrostructure of tempered martensite wastransformed into a layer of very fine-grained,severely deformed material. Figure 2 shows theSEM photomicrograph of the near surface layerbefore, during, and after scuffing.
X-ray analysis also showed that the surface layerafter scuffing contained ≈60% retained austenite,indicating that the contact temperature afterscuffing exceeded the austenitizing temperature of4340 steel.
0
5
10
15
20
25
30
35
40
0
0.1
0
5
10
15
20
25
30
35
40
0
0.1
0.2
0.3
0.4
0.5
0.6
0.7
0.8
0 5 10 15 20
Load
(lbf
)
Coe
ffici
ent o
f Fric
tion
Time (min)
3
12
1
2
3
Before scuffing
During scuffing
After scuffing
Figure 1. Friction variation during steploading scuffing test of hardened 4340 steel

Heavy Vehicle Systems Optimization Program FY 2003 Annual Report
98
Figure 2. Microstructure before, during andafter scuffing of hardened 4340 steel
Based on these microstructural changes and otherphenomenological observations of the scuffingprocess, an initiation mechanism based onadiabatic shear instability is proposed. Whensurfaces are brought in contact, high contactstresses at asperities will lead to localized plasticdeformation, which will lead to work hardening ofthe deformed area as dislocation density increases.With increasing contact severity, more workhardening will occur. As more plastic deformationof the surface layer occurs, some of the plasticwork is converted into heat, leading to thermalsoftening. Scuffing is then initiated when the rateof thermal softening exceeds the rate of work
hardening. At such a point, rapid deformation willoccur in a very short time; hence, the adiabaticnature of the process. The large amount of heatgenerated will lead to a rapid rise in temperature,which will further accelerate plastic deformationand eventually lead to catastrophic failure calledscuffing.
Based on this mechanism of scuffing, it is thepossible to connect propensity of a material toscuffing with some material properties. Numerouscriteria have been set for the initiation of adiabaticshear instability. Perhaps the simplest one is thecritical strain (γc) at which the rate of workhardening is equal to the rate of thermal softening.Thus, scuffing will be initiated at a local point on asliding surface when the shear strain at that pointexceeds critical strain, give as
T9.0
Cnc
∂τ∂
ρ=γ ,
where n is the work hardening index, ρ is thedensity, C is the heat capacity, τ is the shearstrength, and T is the temperature.
Preliminary validation of this model of scuffinginitiation was conducted with hardened 4340 steeltempered at various temperatures as a means ofvarying the critical strain for shear instability. Amore compressive validation with variousmaterials and alloys is underway. With this model,it is possible to estimate susceptibility of variousmaterials to scuffing. It also provides a means fora material-based solution or strategy to preventingscuffing in lubricated engine components.
X-ray Characterization of Tribo-Chemical FilmsIn this task, the composition and structure of tribo-chemical films generated from a model anti-wearlubricant additive Zinc diathiophosphate (ZDDP)was characterized by glancing-angle X-rayfluorescence, diffraction, and reflectivity at theAPS. A typical fluorescence spectrum of a tribo-chemical film that identifyied the key elementspresent in the film is shown in Figure 3.

Heavy Vehicle Systems Optimization Program FY 2003 Annual Report
99
0500
1000150020002500300035004000
0 5 10 15 20
Fluo
resc
ent I
nten
sity
Energy, keV
I0Mo
Fe
Zn
Cr
Figure 3. X-ray fluorescence spectrum of tribo-chemical film formed by ZDDP anti-wear oiladditive
Depth profiling of the compositional variation oftribo-chemical films generated by two methods areshown in Figures 4a and 4b. For laboratorystudies, tribo-chemical films are usually generatedeither by rubbing surfaces together in the presenceof the additive-containing lubricant being studied,or thermally, by heating a piece of metalsubmerged in oil that contains the additive.Although, no universal agreement has not beenreached among researchers, it is always assumedthat the films generated by the two methods areessentially the same.
Results of our analysis of depth compositionalvariation of the films generated by the twomethods clearly showed that the structure andcomposition of the films generated thermally andby tribo-contact are not the same.
Although it may be easier to produce boundaryfilms for laboratory study by thermal treatment,the results from such a study may not beapplicable to tribological interfaces because thefilms are not necessarily the same. Films producedby these two methods with other model additiveswill be characterized in our future effort to assessthe generality of the current observation withZDDP. It is conceivable that the thermallygenerated and the tribo contact generated films forsome other additives may to be similar.
01000020000
30000400005000060000
7000080000
0
5000
10000
15000
20000
25000
30000
0.0 0.1 0.2 0.3
Zn/
Io
Fe/Io
Incident angle θ, degrees, λ = 0.062012 nm
Worn in 1/16 ZDDP
Figure 4a. Depth variation of Zn and Fe contentof surface boundary film generated by tribo-contactin 1/16 ZDDP
0
10000
20000
30000
40000
50000
60000
0
10000
20000
30000
40000
50000
60000
70000
0.0 0.1 0.2 0.3
Zn/
Io
Fe/Io
Incident angle θ, degrees, λ = 0.062012 nm
Baked in 1/16 ZDDP
Figure 4b. Depth variation of Zn and Fecontent of surface boundary film generatedthermally in 1/16 ZDDP
ConclusionsSignificant progress was made in the boundarylubrication project during the past year. Relyingon microstructural changes and otherphenomenological observations associated withscuffing, we developed a model of scuffinginitiation based on adiabatic shear instability.Scuffing is initiated when the rate of thermalsoftening exceeds the rate of work hardening. Thismaterial-properties- based model is a significantdevelopment in our understanding of poorlyunderstood scuffing failure. Material propertiesand behavior strategies for scuffing prevention arenow possible. Surface characterization methodsbased on x-ray techniques are being developed.These techniques were able to show differences inthe structure and composition of ZDDP boundaryfilms generated thermally and by tribo contact.

Heavy Vehicle Systems Optimization Program FY 2003 Annual Report
100
Publications1. J. Hershberger and O.O. Ajayi,
“Nondestructive Characterization ofTribochemical Surface Films from Additives”Presented at STLE Annual Meeting, NewYork, April 28–May1, 2003.
2. J. Hershberger, O.O. Ajayi andG.R. Fenske,“Nondestructive Characterizationof Surface Chemical Wear Films via X-ray”Journal Thin Solid Film, in press.
3. J. Hershberger, O.O. Ajayi, J. Zhang,H. Yoon, and G.R. Fenske, “Formation ofAustenite During Scuffing Failure of SAE4340 Steel” Wear Journal, in press.
4. O.O. Ajayi, J. Hershberger, and G.R. Fenske,“Shear Instability Mechanism of Scuffing inLubricated Contacts” Presented at theInternational Conference on BoundaryLubrication, Copper Mountain, CO, August3–7, 2003. To be published in TribologyInternational.

Heavy Vehicle Systems Optimization Program FY 2003 Annual Report
101
B. Parasitic Engine Loss Models
Principal Investigators: G. Fenske, A. Erdemir, L. Ajayi, and A. KovalchenkoArgonne National Laboratory9700 South Cass Avenue, Argonne, IL 60439(630) 252-5190; Fax: (630) 252-4798; [email protected]
Investigators: B. Brogdon, T. Torbeck, I. Fox, and J. KezerlRicardo, Inc., 7850 Grant Street, Burr Ridge, IL 60527-5852(630) 789-0003; fax: (630) 789-0127
Technology Development Manager: Sid Diamond(202) 586-8032; [email protected] Program Manager: Jules Routbort(630) 252-5065; [email protected]
Contractor: Argonne National LaboratoryContract No.: W-31-109-ENG-38
Objective• Develop and integrate a set of software packages that can predict the impact of advanced coating technologies
on reducing parasitic energy losses from a number of diesel engine components.
• Develop a suite of computer codes that can predict the wear and durability of these components when exposedto low-viscosity lubricants.
Approach• Predict fuel economy improvements over a wide range of oil viscosity.
• Predict change in wear loads due to reduced oil viscosity.
• Develop superhard and low-friction coatings that can reduce friction and wear in low-viscosity oils.
Accomplishments• Simulations have shown that hydrodynamic friction decreased with reduced lubricant viscosity, while wear
loads and asperity friction increased.
• With a 90% reduction in asperity friction, optimum lubricant viscosity was found to be lower than that ofSAE 5, and the reduction in hydrodynamic friction was very significant. With a piston skirt alone, such areduction in asperity friction nearly doubled the improvement in fuel consumption. Overall, more than 4%improvement in fuel economy was predicted with the combined uses of low-viscosity oils and superhard andlow-friction coatings.
Future Direction• Apply superhard and low-friction coatings on actual engine components and demonstrate their usefulness in
low-viscosity oils.
• Optimize coating composition, surface finish, thickness, and adhesion to achieve maximum fuel savings.

Heavy Vehicle Systems Optimization Program FY 2003 Annual Report
102
IntroductionFriction, wear, and lubrication impact energyefficiency, durability, and environmental soundnessof all kinds of transportation systems, includingdiesel engines. Total frictional losses in a typicaldiesel engine may alone account for more than 10%of the total fuel energy (depending on the enginesize, driving condition, etc.). The amount ofemissions produced by these engines is related to thefuel economy of that engine. In general, the higherthe fuel economy, the lower the emissions. Higherfuel economy and lower emission in future dieselengines may be achieved by the development andwidespread use of novel materials, lubricants, andcoatings. For example, with increased use of lowerviscosity oils (that also contain the least amounts ofsulfur and phosphorus-bearing additives) the fueleconomy and environmental soundness of futureengine systems can be dramatically improved.Furthermore, with the development and increaseduse of smart surface engineering and coatingtechnologies, even higher fuel economy and betterenvironmental soundness will be feasible.
The main goal of this project is to develop a suite ofsoftware packages that can predict the impact ofsmart surface engineering and coating technologies(e.g., laser dimpling, NFC, and superhard nitridecoatings) on reducing parasitic energy losses fromdiesel engine components. The project also aims tovalidate the predictions using experimental frictionand wear studies at Argonne National Laboratory.Such information will help identify critical enginecomponents that can benefit the most from the use ofnovel surface technologies, especially when low-viscosity engine oils are used to maximize the fueleconomy of these engines by reducing churningand/or hydrodynamic losses. A longer-termobjective is to develop a suite of computer codescapable of predicting the lifetime/durability ofcritical components exposed to low-viscositylubricants.
In FY2003, Argonne and Ricardo, Inc., workedtogether to identify engine components that canbenefit from low-friction coatings and/or surfacetreatments. The specific components consideredincluded: rings, piston skirt, piston pin bearings,crankshaft main and connecting rod bearings, andcam bearings. Using computer codes, Ricardo also
quantified the impact of low-viscosity engine oils onfuel economy. Ricardo also identified conditions thatcan result in direct metal-to-metal contacts, which inturn can accelerate engine wear and asperity friction.
Argonne has worked on the development and testingof a series of low friction coatings under a widerange of sliding conditions using low- and high-viscosity engine oils. These coatings (such as NFCand MoN) as well as laser textured surfaces weresubjected to extensive tests using bench-top frictionand wear test machines. The test conditions (i.e.,speeds, loads, and temperatures) were selected tocreate conditions where direct metal-to-metalcontacts will prevail as well as situations wheremixed or hydrodynamic regimes will dominate.Using the ranges of frictional data generated byArgonne, Ricardo estimated the extent of potentialenergy savings in diesel engines and identified thosecomponents that can benefit the most from such low-friction coatings and or surface treatments. Weardata generated by Argonne can be used to developmodels and computer codes that predict thelifetime/durability of diesel engine components.
ResultsIn a series of computer simulations, Ricardo hasanalyzed the effects of lubricant viscosity on enginewear loads, engine friction, and fuel consumption.With drastic reductions in oil viscosity, it was foundthat in addition to other engine components, crank-shaft bearings would also become highly vulnerableto high friction and wear losses. The situation withcrank shaft bearings was analyzed using ORBITsoftware, which takes into account non-circularbearing/journal geometry, distortions, cavitation, andboundary-lubricated sliding conditions, whereasperity contact and elastohydrodynamic lubricationmay dominate. In addition to the ORBIT software,PISDYN, RINGPACK, and VALDYN simulationswere carried out under both baseline and reducedviscosity conditions. The objective was todetermine the impact of oil viscosity on overallengine friction and wear.
Piston Friction StudiesPISDYN simulations were carried out for varyinglevels of lubricant viscosity reduction at eight loadand speed conditions. Hydrodynamic and asperityfriction predictions were tabulated for each case. The

Heavy Vehicle Systems Optimization Program FY 2003 Annual Report
103
predicted optimum lubricant grade for the baselinepiston was SAE 40. With a 30% reduction inasperity friction, the allowed reduction in lubricantviscosity did not result in a large reduction infrictional mean effective pressure (FMEP). A 60%reduction in asperity friction allowed a largerreduction in lubricant viscosity. With a 90%reduction in asperity friction, the predicted optimumviscosity was lower than SAE 5, and the reduction inhydrodynamic friction was very significant. Thesefindings are summarized in Figure 1.
According to these predictions, for the piston skirtalone, with a 90% reduction in asperity friction,reducing lubricant viscosity nearly doubled the fueleconomy. Also, with such a reduction in friction, theuse of oil grades even lower than SAE 5 would havebeen feasible.
For the piston skirt considered in this study,significant asperity friction is predicted for highloads. However, the level of asperity friction andpotential benefits of coating can vary significantlyfrom one design to another.
Change in Fuel Consum ption versus Viscosity Grade and Asperity Friction
Reduction
-5%
-4%
-3%
-2%
-1%
0%
1%
2%
3%
0 5 10 15 20 25 30 35 40 45 50 55
SAE Viscosity Grade
Pred
icte
d Ch
ange
in F
uel C
onsu
mpt
ion
0% Reduction
30% Reduction
60% Reduction
90% Reduction
Figure 1. PISDYN predictions of FMEP vs. SAElubricant viscosity grades and asperity friction reduction
Piston Wear StudiesAs lubricant viscosity was reduced, wear loads onthe piston skirt and cylinder liner were increased inboth magnitude and extent, thus increasing thevulnerability of these components to rapid wear. Asshown in Figure 2, the total average wear load percycle is more than four times higher for SAE 5 thanSAE 40 oil. These findings suggest that , to allowthe use of SAE 5 oil, a surface treatment would haveto provide approximately four times the wearresistance of the baseline engine material.
Normalized Total Wear Load on Piston and Liner
0.0
0.5
1.0
1.5
2.0
2.5
3.0
3.5
4.0
4.5
0 5 10 15 20 25 30 35 40 45 50 55
SAE Viscosity Grade
Rel
ativ
e W
ear L
oad
Figure 2. The effect of SAE lubricant viscosity grade onrelative wear load index of piston and liner in an engine
Coating StudiesAt Argonne, systematic studies were carried out todevelop low-friction and high-wear resistantcoatings for use in critical engine parts andcomponents. One of the coatings studied extensivelywas near frictionless carbon (NFC), which canprovide friction coefficients of 0.001-0.01 under drysliding conditions, especially in inert gasenvironments. Under lubricated sliding conditions,depending on the additive package in an oil and theoil viscosity, this coating was able to reduce frictionby more than 40%. Figure 3 shows its performancein TCP and moly-containing base synthetic oils.Figure 4 shows its friction performance in a fully

Heavy Vehicle Systems Optimization Program FY 2003 Annual Report
104
Figure 3. Frictional performance of NFC coating in 1%TCP and moly-containing polyalphadefin base oil
Figure 4. Friction coefficients of steel/steel andsteel/NFC-coated steel test pairs in a fully formulatedengine oil under boundary-lubricated sliding conditions
formulated synthetic oil. This coating was highlyoptimized to respond well to the lubricated testenvironments. The reduction in friction in this caseis more than 80%.
In addition to NFC coatings, we have explored theproperties and potential usefulness of a series ofsuperhard nano-composite nitride base coatings. Themeasured hardness of these coatings is more than50 Gpa, and their friction and wear performance(especially under lubricated sliding conditions) isexceptional. As shown in Figure 5, they can providevery low friction under even severe boundary-lubricated sliding conditions, as compared to thebase steel samples used in these studies. The tablebelow the graph summarizes the reductions in
friction achieved under a wide range of slidingconditions. Because of their superhard nature, wecould not measure any wear on these coatings, andthe pins that slid against the coated surfaces had alsosuffered minimal wear losses.
Studies on Laser Textured SurfacesRecent advances in laser beam technology havepaved the way for large-scale utilization of lasers fora wide range of tribological applications. Laserdimpling or texturing is a unique process by whichone can produce shallow (5 to 10 µm deep) pits ordimples on a tribological surface. At Argonne, wehave been exploring the friction and wearperformance of such dimpled surfaces under a widerange of lubricated sliding conditions. Laserdimpling of test samples was done at Technion-Israel by Prof. I. Etsion. When such dimpledsurfaces were used under lubricated slidingconditions, significant increases in hydrodynamicefficiency or reduction in friction is expected. In asense, these dimples can act as a reservoir and candeliver lubricants when and if they are needed on thesliding contact surfaces. They can also trap the weardebris particles so that the extent of third-body weardamage on sliding surfaces is reduced. Figure 6shows the shape and morphology of such dimplesproduced on a steel surface and the results oflubricated sliding tests on highly polished, groundand dimpled surfaces. As is clear, the dimpledsurface provides the lowest friction under a widerange of lubrication regimes.
DiscussionPreliminary results from computer simulationsshowed that hydrodynamic friction decreased withreductions in lubricant viscosity, while wear loadsand asperity friction increased. This is mainly due tothe reduction of churning losses associated with theshear rheology of high viscosity oils. However, thedecline in hydrodynamic friction is eventually offsetby the increase in asperity friction. For each level ofasperity friction reduction, there is a lubricantviscosity that provides the minimum overall fuelconsumption (Figure 1). For an SAE 5 grade oil,simulations predict an overall fuel savings of greaterthan 4%, if a surface treatment is used to reduceboundary friction by 90%. Contact severity and wearloads are substantially increased in such lowviscosity environments, and they would need to be

Heavy Vehicle Systems Optimization Program FY 2003 Annual Report
105
0
0.02
0.04
0.06
0.08
0.1
0.12
0.14
0 240 480 720 960 1200 1440 1680Time [s]
% Reduction of FrictionNitride Coating 2 vs. Uncoated Sample 3330
% Reduction of FrictionNitride Coating 1 vs. Uncoated Sample 3330Linear Velocity [m m/s]
6%-1%2.327%2%4.645%3%6.961%7%11.571%21%23.088%39%46.176%56%115.2
Nitride Coating 2
Nitride Coating 1
Uncoated Steel
Test Condit ions:Load: 20 N
Temperature: 22 oCLubricant: Mobil 1 (10W30)
Figure 5. Frictional performance of nano-omposite nitride coatings under boundary-lubricated sliding conditions. Table below the graph shows reductions in friction with newcoatings at different sliding velocities.
Longitudinal direction - small magnification
-6
-5
-4
-3
-2
-1
0
1
0 200 400 600 800 1000
0W-30 Low Viscosity Oil
0
0.02
0.04
0.06
0.08
0.1
0.12
0.14
0 1 2 3 4 5 6 7 8 9Lubrication Parameter, Velocity/Load
Fric
tion
Coe
ffici
ent
Disk 2 - Ground, Ra = 0.27 µm
Disk 1 - Polished, Ra = 0.01 µm
Disk 3 - Dimpled
Figure 6. (a) Shape and morphology of dimples and (b) frictional performance of a laser-dimpled steel sample underlubricated sliding conditions. Performance of a ground and highly polished sample is also included for comparison.Dimples are typically 4 to 5 µm deep and 100 µm in diameter.

Heavy Vehicle Systems Optimization Program FY 2003 Annual Report
106
mitigated to avoid increased wear by usingsuperhard coatings.
Work at Argonne has resulted in development ofNFC films as well as superhard nitride coatings,providing not only very low friction but also muchneeded wear resistance in low-viscosity oils. Withfurther development and optimization, these coatingsmay indeed prevent wear during sliding underconditions where low-viscosity oils are used. Theycan also provide low friction to help further increasefuel efficiency. Laser dimpling of selected enginecomponents may also offer additional benefits interms of reducing friction and thus increasing thefuel economy of engines. Some of these surfacetreatments and/or coatings will soon be applied onportions or segments of real piston rings andcylinder liners to further substantiate their
effectiveness under conditions that closely simulatethe actual engines. We also plan on producing thesecoatings on actual rings, liners, and other enginecomponents and have them tested at Ricardo as wellas at various OEMs.
ConclusionsComputer simulation studies to date have confirmedthat using low-viscosity engine oils will increasefuel efficiency of future diesel engines. However,wear load and asperity friction will increasesubstantially. The use of low-friction and superhardcoatings in engine parts and components mayeliminate wear problem and enable the use of lowviscosity oils so that the fuel efficiency of theseengines is increased.

Heavy Vehicle Systems Optimization Program FY 2003 Annual Report
107
V. Autothermal Diesel Reformer
Diesel Fuel Reformer Technology
Principal Investigator: M. KrumpeltArgonne National Laboratory9700 South Cass Avenue, Argonne, IL 60439(630) 252-8520; fax: (630) 252-4176; [email protected]
Technology Development Manager: Sid Diamond(202) 586-8032; [email protected] Program Manager: Jules Routbort(630) 252-5065; [email protected]
Contractor: Argonne National LaboratoryContract No.: W-31-109-ENG-38
Objective• Develop a device to convert diesel fuel into hydrogen-rich gas on-board a heavy duty vehicle in a small fuel
processor.
Approach• Evaluate engineering issues that need to be better understood with regard to diesel fuel reforming. The main
issues are how to avoid pre-ignition and coke formation and how to achieve catalyst stability.
• Develop a fuel/exhaust-gas mixing device that will optimize diesel-fuel reforming process.
Accomplishments• Completed design of a laboratory fuel/air/steam mixing test facility.
• Established collaboration with International Truck and Engine Corporation (ITEC).
Future Direction• Complete construction of the test facility.
• Establish required sensors and instrumentation.
• Design and test fuel-air-steam mixing system.
• Conduct CFD simulation to confirm flow mixing.
• Conduct fuel injector tests
• Modify the facility for autothermal reforming tests
• Conduct autothermal reforming tests

Heavy Vehicle Systems Optimization Program FY 2003 Annual Report
108
IntroductionConverting diesel fuel into a hydrogen-rich gashas potential applications in auxiliary power unitsfor heavy-duty vehicles and emissions control ofdiesel engines. ANL has developed a catalyticautothermal reforming process that may be used asa compact and potentially cost effectivetechnology for diesel-fuel reforming. Becausediesel fuel is more difficult to process due to highsulfur content, the reforming process mayencounter pre-ignition and coke formationproblems. Completely homogeneous mixing andpreheating the air will mitigate these problems.This program will explore the feasibility ofachieving the diesel-fuel reforming by optimizingfuel/exhaust-gas mixing dynamics. Severalengineering issues, such as how to avoid pre-ignition and coke formation and how to maintaincatalyst stability, will also be examined.
Results and DiscussionsIn FY 2003, we completed the test facility designand started construction. Figure 1 shows the
schematic diagram of the facility, which consistsof a fuel-injection assembly, simulated exhaust gasgenerating system, and fuel-exhaust-gas mixingapparatus. The proposed sensors andinstrumentation for process measurement andcontrol are also identified. We have alsoestablished the collaboration with InternationalTruck and Engine Corporation (ITEC). ITEC willprovide ANL their diesel-fuel injectors and fuel-injection controlling system.
ConclusionsThis is a new startup program. In FY 2003 wehave established the industrial collaboration andthe overall program plan. The first year objectiveis to establish a laboratory test facility. The facilityis partially constructed. In FY 2004, we will startfuel/exhaust-gas mixing tests to optimize thedesign of the mixing device. Numerical simulationwill also be performed.
QuartzWindow
DieselFuel
Pressure Regulator
Fuel Pump
Fuel Filter
Gas Outlet(to outdoor)
Water
Water Drain
Vaporize
Fuel Injector
FuelDisposal
Tank
HT
Heat Exchanger
Pulse
PC
P T H O2
Valve ControlPulse TriggerP T H Control
Data
Steam Pump
Hot Air Enclosure
Water
Air PumpFresh Air
Oxygen SensorHumidity SensorTemperature SensorPressure Sensor
Heaters
Hot Air
N2Tank
Heat Exchanger
Figure 1. Schematic diagram of the diesel-fuel/air/steam mixing test facility

Heavy Vehicle Systems Optimization Program FY 2003 Annual Report
109
VI. EM Regenerative Shocks
EM Shock Absorber
Principal Investigator: J.R. HullArgonne National Laboratory9700 South Cass Avenue, Argonne, Illinois 60439(630) 252-8580; fax: (630) 252-5568; [email protected]
Technology Development Manager: Sid Diamond(202) 586-8032; [email protected] Program Manager: Jules Routbort(630) 252-5065; [email protected]
Contractor: Argonne National LaboratoryContract No.: W-31-109-ENG-38
Objective• Conduct experiment on a small-scale vehicle to verify the energy recovery from road induced vehicle motion.
• Develop simple models from available literature.
• Compare the experimental results with theoretical prediction.
• Develop stationary stand for testing and measurement of hardware to be installed in large vehicles.
Approach• Increase magnetic field by experimenting with innovative electromagnetic shocks.
• Reduce bearing friction and increase efficiency.
Accomplishments• Three different types of electromagnetic shocks with progressively better power generating capacities have
been fabricated.
• These shocks have been mounted in an all-terrain vehicle in conjunction with existing shock. Power generatedwhen the vehicle is driven over a sod field as well as over a 4x4 beam has been measured and analyzed.
Future Direction• Use the electromagnetic shock as the only source of damping (i.e. leave the original shock with spring but no
damping) and measure the power generated.
• Longer-term approach may switch to energy storage by hydraulic systems.
• Explore potential of developing technologies for dynamic control of vehicle.

Heavy Vehicle Systems Optimization Program FY 2003 Annual Report
110
IntroductionSo far three different electromagnetic shockabsorbers have been made: Mark 1, 2, and 3. Inorder to estimate the power generated by the EMshocks, these were mounted in an ATV as shownin Figure 1.
Figure 2 shows the front of the ATV with all theinstrumentation for recording the voltage output ofthe ATV. Figure 3 shows one of the EM shocks(Mark 2) mounted in the ATV. The dynamics ofthe vehicle with respect to the EM shock absorberoperation are shown in Figure 4. The vehicle isshown running over a 4 × 4 timber (Actualdimensions are 3.5 × 3.5 in.) about 8 ft. long,which was anchored to the ground in a field of cutgrass. The arrowed lines with numbers 1 and 2relate to the vehicle motion when the front or reartires run over the 4 × 4, respectively.
ResultsMark 1 is the first design. It is quite big and heavyand when tested with a shaker (Figure 5), bearingfriction was noticed to be so high that the dampingforce was masked by the inertia and friction force.
Peak power generated by this shock when theATV went over a 4 × 4 beam was 7.4 watts. Againthe insufficient magnitude of the power can beattributed to the bearing friction.
The next design of the EM shock was the rotaryshock absorber (Mark 2). This shock absorber wastested in an electromagnetic shaker as shown in
Figure 1. ATV used for EM shock testing
Figure 2. Instrumentation deck on the ATV
Figure 3. EM shock (Mark 2)mounted in ATV
Figure 6 at 0.5 g. The results of the Mark 2 test areshown in Figure 7.
The damping constant of this Mark 2 EM shockwas measured to be 0.22 lb/in./sec or 38.5 N/m/s.
When mounted in the ATV (Figure 3.) and thevehicle is driven over a 4 × 4 beam, typical outputresponse of the Mark 2 shock absorber is shown inFigure 8. The amplitude scales are modified toaccount for the 5:1 gain reduction of the taperecorder that was mounted on the vehicle. We canobserve two large negative responses in Figure 8,which correspond to the front and rear wheelstraversing the 4 × 4. The negative polarity is dueto the mounting configuration of the rotary shock

Heavy Vehicle Systems Optimization Program FY 2003 Annual Report
111
Mass of rider
Vehiclesuspension
Vehicle pivot point
Ground surface
4 x 4 Wood Beam
EM shock absorber
Vehicle travel 1
1
2
2
Figure 4. Vehicle dynamics
Figure 5. Shaker testing of Mark 1EM shock
Figure 6. Shaker testing of Mark2 shock
absorber on the vehicle. A downward motion on theshock absorber results in a negative output while anupward motion results in a positive output. The firstoutput pulse, #1, is the result of the front wheelsstriking the 4 × 4, corresponding to the #1 arrowedlines of Figure 4. There is considerable rebound, asshown by the positive response immediatelyfollowing the negative response. This is attributed tothe response frequency of the vehicle-ridercombination. Next we see an even larger negative
response, #2, when the rear wheels strike the 4×4beam, corresponding to the #2 arrowed lines ofFigure 4.
Since the electric output of the shock absorber isterminated in a 1 ohm resistor, maximum powergenerated was calculated to be 88.8 watts. Nowbased on the stiffness measurement of the tires,suspension, unsprung weight, and sprung weight,

Heavy Vehicle Systems Optimization Program FY 2003 Annual Report
112
Mark2 EM shock test across 1 ohm
0.000.200.400.600.80
0.00 5.00 10.00 15.00
Velocity in in/s
Volta
ge a
cros
s 1
ohm
in V
Series1
Figure 7. Shaker testing results of Mark 2 shock
Figure 8. Response of Mark 2 (rotary) shock absorber transversing 4 × 4beam
and damping constant of the suspension, theoreticalsimulation predicts maximum power of about 416watts. The difference in theory and measurement canbe explained by losses in bearings which called forfurther improvement of design. Subsequently Mark3 has been designed and fabricated and currently isbeing tested. It may be noted that if the oil in theconventional shock is drained so that only the EMshock is providing the damping, then more power isexpected to be generated. The ATV shock has beenchanged accordingly and currently experiment isbeing performed to measure the energy generationunder such a condition. After the vehicle testing of
the Mark 3 shock, shaker testing is planned to obtainthe damping constant.
DiscussionContinuous improvement in the design and testing ofthe EM shocks is being made. Peak power generatedduring the traversing of the ATV over 4x4 beamincreased from a meager 7.4 watts to 88.8 wattswhen the Mark 2 shock design replaced the Mark 1design. Additionally, the suspension in the ATV hasbeen modified to make the EM shock (the newdesign Mark 3) the primary source of damping and

Heavy Vehicle Systems Optimization Program FY 2003 Annual Report
113
not just supplementary damper. Using thatconfiguration, based on the theoretical simulation, itis anticipated that the maximum peak powergenerated during the upcoming test of the ATVtraversing over the 4 × 4 beam will be 625 watts(using the damping constant of Mark 2 andneglecting other losses). It may be noted that if anEM shock can be made with damping constant of theoriginal suspension, then a maximum peak power of3.33 kW is expected during the traversing of the4 × 4 beam. The average power, however, isexpected to be considerably less than the peakpower.

Heavy Vehicle Systems Optimization Program FY 2003 Annual Report
114

Heavy Vehicle Systems Optimization Program FY 2003 Annual Report
115
VII. Joining Carbon Composites
Structural Characterization and Joining of MMC Components for HeavyVehicles
Principal Investigators: J. Prucz and S. ShoukryDepartment of Mechanical and Aerospace EngineeringWest Virginia UniversityMorgantown, WV 26506-6106(304) 293-4111ext.2314; fax: (304) 293-6689; [email protected]
Technology Development Manager: Sid Diamond(202) 586-8032; [email protected] Program Manager: Jules Routbort(630) 252-5065; [email protected]
Contractor: West Virginia UniversityContract No.: EE50692
Objectives• Quantify cost-performance tradeoffs associated with the development of Metal Matrix Composite (MMC)
components for heavy trailers.
• Analyze multiple design and joining concepts for enhancing the potential benefits of employing MMCcomponents in heavy vehicles.
Approach• Assess the current state-of-the-art of technology development and commercial applications for advanced MMC
materials.
• Design and analyze a critical structural component of a heavy trailer, such as a chassis I-beam, made of MMCor alternative materials.
• Model and analyze alternate approaches to joining structural components made of particulate MMC materials.
• Measure material properties of standard MMC specimens and structural characteristics of bolted joints made ofthe same MMC materials.
Accomplishments• Integrated material –structural models predict marginal benefits and significant barriers to MMC applications in
heavy trailers.
• Potential applications of MMC materials in heavy vehicles are limited to components identified as critical foreither loadings or weight savings.
Future Direction• Expand lightweight material-structural design concepts for heavy vehicles from the component to the system
level.
• Validate innovative approaches for weight reductions in trailers, based on tailored materials, optimizedgeometries and fastener-free joining.

Heavy Vehicle Systems Optimization Program FY 2003 Annual Report
116
IntroductionAlthough recent advances in the area of MetalMatrix Composites (MMCs) have been spurred,mainly, by applications that require high structuralperformance at elevated temperatures, the heavyvehicle industry could also benefit from thisemerging technology. Growing requirements ofweight savings and extended durability are the maindrivers for potential insertion of MMC technologyinto the heavy vehicle market. Critical elements of atypical tractor-trailer combination, such as highly -loaded sections of the structure, engine components,brakes, suspensions, joints and bearings could beimproved through judicious use of MMC materials.Such outcome would promote the DOE’sprogrammatic objectives of increasing the fuelefficiency of heavy vehicles, reducing their life cyclecosts and pollution levels. However, significanttechnical and economical barriers are likely tohinder or even prevent, broad applications of MMCmaterials in heavy vehicles. The tradeoffs betweensuch expected benefits (lower weights, longerdurability) and penalties (higher costs, brittlebehavior, difficult to machine) must be thoroughlyinvestigated, both from the performance and costviewpoints, before the transfer of MMC technologyto heavy vehicle systems can be properly assessedand implemented.
Technology Assessment for MMCApplications in Heavy VehiclesMetal matrix composite materials are formed,usually, of a low-density metal alloy, such asaluminum or magnesium, reinforced with particles,whiskers, or fibers of a ceramic material, such assilicone carbide or graphite [1]. Their performance issuperior to that of the un-reinforced metal, especiallywith respect to higher specific strength and stiffness,higher operating temperatures, and greater wearresistance. The disadvantages of MMC materials arerelated, mainly, to their high cost and complexmanufacturing processes, though two of theirdrawbacks relate also directly to their mechanicalproperties, namely lower ductility and lowertoughness than corresponding, unreinforced metals[2].
High costs due to low production volumes,insufficient characterization data, lack of reliablemodels and standardized design, manufacturing and
testing methods, remain to this date the majorbarriers to widespread commercialization of MMCmaterials. It is highly unlikely that drastic weightreductions can be achieved in heavy vehiclestructures by using such materials. Continuouslyreinforced MMCs are unlikely to be economicallyfeasible for the trucking industry, whereasdiscontinuously reinforced MMC’s are attractiveonly for limited, low-volume applications, inselected components of a tractor-trailer system. Life-cycle-cost (LCC) studies and integrated material-structural designs, where material properties andgeometric configurations are tailored to each other,are essential for developing cost-effectiveapplications of MMC materials in heavy vehicles.
Weight Comparisons for Cross Beam inChassis of Heavy TrailerChassis components contribute 73% of the overallmass of an empty van trailer (6,850 kg for a 48 ft-long trailer). About 47% of the total structuralweight is contributed by the oak floor panels, as wellas by the cross beams that support the floor. One setof such cross beams comprises simply supported I-beams evenly distributed along the central section ofthe van, whereas the other set consists of I-beamswith overhanging cantilevers over the suspensionrail.
The static loading scenario assumed for this analysisincludes structural dead weight and a live load of11 kN per wheel of a loaded fork lift that movesinside the trailer. The stresses and deflectionsassociated with such loading were calculated foreach of the above two groups of cross beams, alongwith the corresponding factors of safety.
The design criteria used for comparing differentmaterial candidates are:
• The factor of safety in flexure should not be lessthan 2.0.
• The deflections should not exceed the maximumlevels that are currently achieved for steel cross-beams.
The candidate materials considered in this study forweight comparisons with reference to steel werealuminum, magnesium, carbon-carbon composites

Heavy Vehicle Systems Optimization Program FY 2003 Annual Report
117
and MMC LANXIDE, which is aluminum matrixreinforced with 55% silicon carbide particles.
Table 1 illustrates the minimum cross-section of astandard I-beam that is required for differentmaterials to meet the above criteria, as well as thecorresponding values of factor of safety and edgedeflection.
Table 1. Alternate material solutions
Material
YieldStrength(MPa) Section
Zx(cm3)
Factorof
Safety
EdgeDeflection
(mm)Steel 550 120 × 64 42.8 4.4 3.55Aluminum 240 152 × 89 116.0 5.2 2.43Magnesium 150 178 × 171.0 4.8 2.28Aluminum Reinforced with55% Silicon Carbide
145 127 × 76 74.9 2.0 1.56
Carbon-Carbon Composite(Carbo/Epoxy AS4/3501-6)
900 127 × 76 74.9 12.5 2.77
Table 2 illustrates a weight-based comparison of thesame candidate materials for an I-cross beam in avan trailer, along with the cost of each material.
Table 2. Weight and cost-based comparison of candidatematerials
MaterialDensity(kg/m3)
TotalMass(kg)
WeightSaving
(%)Cost($)
Steel 7850 1058.00 0.0 831Aluminum 2700 644.96 39.0 1,292Magnesium 2950 885.69 16.3 4,986Aluminum Reinforced with55% Silicon Carbide
1738 323.75 69.4 5,604
Carbon-Carbon Composite(Carbo/Epoxy AS4/3501-6)
1580 294.32 72.2 13,347
The results presented in Table 2 reveal that bothMMC and carbon-carbon materials allow similarweight savings as compared to steel (about 70%) oraluminum (53%), but MMC materials are 85% moreexpensive than steel and 77% more expensive thanaluminum. However, the cost of a MMC cross-beamis half that of a similar beam made of carbon-carboncomposite. Furthermore, the cost penalty associatedwith the use of MMC materials can be reducedsubstantially through integrated material andstructural design.
Design and Analysis of Bolted JointsThree dimensional finite element models have beendeveloped for three different types of joining
techniques in order to compare the behavior of theMMC materials with other structural materials.
These models cover both single and double lap jointconfigurations, including load spreaders, or washers,inserted between the plates and the bolt head or nut.The contact interfaces between the jointed plates,between the load spreaders and the jointed plates, aswell as between the bolt surface and the surroundinghole have been modeled explicitly, as illustrated inFigure 1 by the finite element mesh of a double lapjoint.
An axial tension load was applied on the model, andthe resulting stress field around the bolt wasdetermined and analyzed. As one could expect, theresults of the finite element simulation confirm thepresence of bending of the jointed plates in singlelap joints, caused by the load eccentricity betweenthe two plates. This bending effect significantlyreduces the contact stresses between the bolt and thecylindrical hole surface. However, high contactstresses develop around the hole in the case ofdouble lap joints, as illustrated in Figure 2.
Parametric analysis of single and double lap jointconfigurations have been conducted over a widevariety of design parameters, such as the materialproperties of the jointed plates, the washer (loadspreader) diameter, the clearance between the holeand the bolt, the diameter of the bolt, and its
Figure 1. Finite element model of a double lap boltedjoint
Figure 2. Von-Mises stress distribution around a hole ina double lap joint
20 mm
16 mm

Heavy Vehicle Systems Optimization Program FY 2003 Annual Report
118
tightening pressure. The main findings of thisparametric study can be summarized as follows:
a) The average effective stress around the holeincreases by about 75% when the bolt tighteningforce increases from 0 to 30kN.
b) The Young’s Modulus of the connected plateshas an insignificant effect on the stressdistributions around the hole. The strain levelsaround the hole increase, however, as theYoung’s Modulus decreases.
c) In single lap joints, the effective stress aroundthe hole increases when the bolt diameter or thewasher diameter increases. This effect is, mostlikely, due to the bending associated with theasymmetric loading of such a joint.
d) The effective stress around the hole of a doublelap joint with a 6 mm-diameter bolt decreases byabout 70% when the diameter of the loadspreader increases from 8 to 12 mm.
e) When the clearance between the hole and thebolt is increased from 0.02 to 0.15 mm, the levelof stresses around the hole decreases by about65%.
f) An increase of about 30% in the maximumstress around the hole is predicted when the boltdiameter is increased from 5 to 6.5 mm.
Failure analysis has been conducted for double lapbolted joints made of different materials, such assteel, aluminum alloy, and Al/SiC MMC with 30%and 55% volume fraction of Silicon Carbidereinforcement particles.
Figure 3 depicts the effective stress distributionaround the hole before the onset of failure. Theresults confirm the expected drawbacks associatedwith the brittle failure of MMC materials. The MMCjoint is predicted to fail in the “bearing” mode,where the rear wall of the hole that is in directcontact with the bolt is crushed without yielding.Moreover, the use of such MMC materials for thejointed plates may cost 12-14 times more thanequivalent aluminum joints, with no performancebenefits.
Figure 3. Stress distribution around holebefore failure
Bonded single and double lap joints have also beenmodeled for extensive parametric studies over awide range of adhesive and adherent materialproperties, as well as various geometricconfigurations. The main conclusions of this studycan be summarized as follows:
a) The shear stress distribution along the overlaplength becomes more uniform as the thickness ofthe adhesive increases, so that the maximumshear stress is reduced.
b) The shear stress at the free edge in the adhesivecan be reduced significantly by tapering theouter adherent. For example, a 45° taper reducesthe maximum shear stress by about 60%.
c) The addition of spew fillets at the edge of theadhesive can reduce by about 65% the averageshear over the bond length of the joint.
Experimental Characterization of MMCMaterials and Bolted JointsDifferent versions of a particulate aluminum/siliconcarbide MMC material marketed under the“LANXIDE” trademark have been tested forpossible applications in heavy vehicle structures.The material characterization tests were carried outaccording to the relevant ASTM standards andranged from micro-structural evaluation to hardness,thermal, elastic and strength properties.
The test results indicate that the brittleness of thisMMC material degrades seriously its strengthproperties. However, the stiffness of this material ismore than twice that of aluminum, while its Vickershardness is also higher than that of aluminum (by
Steel
Al with30% SiC
Aluminum
Al with55% SiC

Heavy Vehicle Systems Optimization Program FY 2003 Annual Report
119
52% for 30% SiC reinforcement and by 37% for45% SiC reinforcement). The coefficient of thermalexpansion of this MMC material is lower than thatof aluminum, most likely due to the lowconductivity of SiC particles.
The quality of the LANXIDE material turns out tobe highly inconsistent, while its machining isextremely difficult, expensive and time consuming.Such problems are likely to become major barriers toany structural application of this material in heavyvehicles.
A test matrix of 36 Aluminum and MMC specimenhas been planned and carried out for experimentalcharacterization of double lap bolted joints ofdifferent geometric configurations. Figure 4illustrates a schematic drawing of the experimentalsetup used for testing double-lap bolted joints.
Figure 4. Test setup for bolted joints
The test results indicate that both the failure load andthe mode of failure depend on two main aspectratios:
1. The ratio between the width of the specimen andhole diameter (w/d).
2. The ratio between the distance from the edge ofthe joint to the center of the hole and the holediameter (e/d).
The test matrix included specimens with “e/d” ratiosvarying from 1.2 to 5, for three different “w/d”ratios: 3, 4, and 8. Table 3 captures a summary of thevarious failure modes observed in these tests, asfunction of the “w/d” and “e/d” ratios of the testspecimens.
Figure 5 shows photos of MMC joint specimens thatfailed either in the “net-section” or “bearing” modesof failure.
Table 3. Variation of failure modes with thegeometry of joint specimens
w/d ratioe/d
3 4 81.2 Shear out Shear out Shear out2 Net-Section Bearing Bearing3 Net-Section Bearing Bearing4 Net-Section Bearing Bearing5 Net-Section Bearing Bearing
Net-Section failure (w/d=3)
Bearing failure (w/d=4)
Figure 5. Failure modes of joint specimens
As the joint begins to fail, a substantial increase isobserved in the tensile force applied on the bolt. Thiseffect is probably associated with the piling up ofcrumbled material at the contact surface on one sideof the bolt, as a result of the bearing mode of failure.The rise in the tensile force experienced by the boltis more pronounced for higher values of the “w/d”ratio. For example, the bolt tension increases at the

Heavy Vehicle Systems Optimization Program FY 2003 Annual Report
120
onset of failure by 1,500 lb when w/d=3.0, but thisrise is amplified to 4,500 lb when w/d=4.
ConclusionsThe main technical challenge of joining particulateMMC components is their low ductility and poorworkability. Since fiber breakage is not a concernwith such materials, joining methods used for metalalloys are applicable also to particulate MMCs.However, the “over-design” necessary to preventbearing failure in bolted joints is likely to diminishweight savings that might be enabled by the superiorspecific stiffness or strength properties of MMCmaterials.
References1. Department of Defense Handbook: Composite
Materials Handbook, Volume 4: Metal MatrixComposite, September 1999.
2. ASM International. Engineered MaterialsReference Book, Second Edition, Material Park,Ohio, USA, 1999.

Heavy Vehicle Systems Optimization Program FY 2003 Annual Report
121
VIII. Analysis
A. Systems Analysis for Heavy Vehicles
Principal Investigator: L.L. GainesArgonne National Laboratory9700 South Cass Avenue, Argonne, IL 60439(630) 252-4919; fax: (630) 252-3443; [email protected]
Technology Development Manager: Sid Diamond(202) 586-8032; [email protected] Program Manager: Jules Routbort(630) 252-5065; [email protected]
Contractor: Argonne National LaboratoryContract Number: W-31-109-ENG-38
Objective• Identify areas with significant potential for energy conservation in transportation, especially heavy vehicles,
that could be facilitated by DOE-sponsored R&D
Approach• Perform broad scope analysis, with cooperation from industry, to find set of promising areas;
• Conduct in-depth analysis to identify
- promising new technologies,- fruitful areas for technology research and development, and- areas where objective analysis could support market penetration of new technologies- policy options that could encourage implementation of new technologies.
• Critically review ongoing DOE R&D efforts to assure they maintain their promise.
Accomplishments• Achieved sufficient visibility and credibility to start receiving actual data on idling and equipment performance
from other researchers, equipment manufacturers, and truck fleets and railroads.
• Completed and published survey of promising R&D areas for railroads and locomotives
• Analyzed and presented energy savings from dynamic brake energy recovery
• Presented truck idle reduction information at Truck Show and SAE Truck and Bus meeting
• Wrote 21CT idling reduction white paper
• Coordinated with DOE groups, EPA, DOT, states, and manufacturers, on idle reduction
• Provided input to decision making by EPA and CARB on idle reduction
• Visited TTCI and U of I
- Attended and presented at U of I Railroad Environmental Conference- Attended RSI and other trade conferences
• Observed Green Goat, DDHS demonstrations

Heavy Vehicle Systems Optimization Program FY 2003 Annual Report
122
• Attended EPA Smartway rollout
Future Direction• Continue work in idling reduction
- All-stakeholder meeting- Comprehensive report on idling reduction
• Complete analysis of technology needs for locomotive dynamic brake energy recovery
• Investigate options for domestic and low-carbon production of liquid transport fuels
• Continue critical analysis of selected DOE projects
IntroductionTransportation energy research today is concentratedon long-term solutions for passenger cars. However,the potential for increased efficiency, decreasedemissions, and reduced dependence on imported oilremains high for all time frames in the heavy vehiclesector. The technologies developed for light-dutyvehicles may not be applicable to heavy vehicles; itis therefore important to continue our R&D efforts toreduce the impacts from use of trucks and trains.Analysis at ANL is aimed at identification of themost fruitful areas for further investigation.
Discussion and ResultsANL has focused effort in several areas. These areidling reduction, locomotive and railroad energyconservation, alternative domestic fuels, and criticalproject review.
Idling ReductionIt is important for ANL to revise its study of idlingreduction. This study is the definitive reference, withmany other groups using our results. However, sincepublication, the available options have changed(storage devices are defunct, inverter-chargers areavailable, and electrical options have evolved). Inaddition, actions by the EPA distort the picture (theysupport only electrical options, neglect impacts ofelectricity generation, and promulgate misleadinginformation). It is also important to extend theanalysis to other transport modes, which also idle,and may share many similarities in equipment needs(locomotives, buses, inland marine).
ANL will continue analysis of heavy vehicle idlingto identify R&D needs. Desired tasks include study
of equipment requirements, energy use andemissions for alternatives, regulations, emissionstrading, and costs (including wear from idling), aswell as information dissemination. The analysis willbe extended to inland marine and off-road vehicles.ANL will continue to attend meetings and provideinput on work related to idling reduction, in order toprovide information and help OFCVT monitorresearch needs and progress in this area.
It is appropriate for DOE to facilitate coordinationamong the many groups involved in idling reductionactivities. The are several groups involved at DOE,including OFC&VT Systems studies and the MET(Diamond), the Advanced Vehicle Testing ActivityIR Demonstration (Slezak), Fuel Cell APUdevelopment (Garbak), and the Marylandlocomotive APU demonstration. Other stakeholdersinclude the 21st Century Truck Partnership, the EPA(which funded a plug-in project [EPRI] andelectrification demonstrations [Idle-Aire], andlaunched its SmartWay program), DOD (currentlydeveloping a quiet APU), several states (NYSERDAis funding electrification demonstrations [Idle-Aireand plug-in], CARB has proposed regulations, andIowa is performing a study), and trade andmanufacturer organizations (DIRP, TMC, and thenewly proposed manufacturer organization). Abroadly based national conference is being plannedto facilitate communication among these numerousand diverse groups, who are currently duplicatingeffort and working at cross purposes.
Locomotive and Railroad Energy ConservationAs a result of the locomotive emissions workshopand subsequent working group studies, ANLpublished a compilation of railroad R&D needs and

Heavy Vehicle Systems Optimization Program FY 2003 Annual Report
123
selected several areas for further investigation.These included dynamic brake energy recovery,freight car drag reduction, and reduction of idling.
Dynamic brake (DB) energy recovery: Duringdynamic braking , freight locomotives reduce thetrain’s large kinetic energy by reversing their electricmotors and generating electricity, most of which issent through resistors to dissipate the energy in theform of heat. This practice is common to electriclocomotives, such as those used in Europe, anddiesel-electric locomotives, used in the U.S. It iswell-known that this wastes a significant quantity ofenergy, and recovery would be desirable. As withautomobiles, brakes that recover energy are calledregenerative. Line-haul trains spend about 10% oftheir time in DB. BN estimates that 20% of theenergy consumed in a cross-country run is dissipatedduring dynamic braking. However, the rate at whichthe energy would need to be recovered, and thenecessity of a suitable storage medium have beentechnical barriers.
ANL scoped out the problem and considered thetechnical feasibility of several options for recoveryof dynamic brake energy. Any of the devices couldbe either on the train (in the locomotive or in atender behind it) or by the wayside. An on-boardunit could be housed on an un-manned unit (slug).Energy storage is the key difficulty for dynamicbrake energy recovery. There are several types ofmechanisms that could be considered for storage ofenergy recovered from dynamic braking. Theseinclude flywheels, ultracapacitors, batteries, andchemical reactions. Important considerations forevaluating these mechanisms include rate of energytransfer, energy storage capacity, mass, volume,safety, and cost. In addition, any device placed onthe train must be able to endure significant vibrationover long time periods. Flywheels are already beingused or proposed for both on-board and waysideapplications (the London Underground is installing1 MW flywheels at stations and the ALPS programis planning a 3 MW on-board unit).
The storage medium requires both high storage rateand high total energy storage capacity. The rate turnsout to be a very important and difficult constraint.Combinations of devices could enable suitableenergy storage. As an alternative to local storage, it
is possible to consider dumping the power onto thelocal electrical grid.
A wayside unit could achieve a larger capacity factorthan an on-board system and avoid concerns aboutlarge storage system mass and volume on the train.1This is the result of a key advantage for trains: truckscan go anywhere, so they need to slow down or stopat a large number of locations. Trains, however, arerestricted to move on a very small number of routes–i.e. their tracks. Furthermore, the hills (and stations)are always in the same place (trivial but crucial).Therefore, a wayside unit could be put where needed(because it would always be needed in the sameplace) and service all trains coming by, recoveringenergy from the downhill trains and providing it tothe ones going up. The result is a much highercapacity factor, greatly improving the economics forthe installation.
Regenerative braking of freight trains with waysiderecovery stations warrants in-depth investigation.We examined the case of one hill that many coaltrains go over (Crawford Hill, NE) to get to easternmarkets. Each train uses 20 MWh used round trip,and up to 17 MWh could be recovered theoretically.Currently, helper locomotives are needed. Their useis labor-intensive and time-consuming because youneed to stop the train to add/remove locomotives. Awayside unit would have high utilization and couldrecover energy from loaded and empty trains, about40 per day each way. We estimate that roadlocomotives in the U.S. could generate up to7,500 MW, the equivalent of about 8 large electricalpower plants. It would take about 0.6 Q or100 million barrels of oil to generate this muchpower annually. We propose to further examinetransfer and storage mechanisms and to exploreeconomics for both wayside and on-board systems.
Freight car drag reduction represents another area ofinvestigation. Empty coal cars are reported to have2.5 times as much drag as loaded ones, and theymove at high speed, so losses are greater. Drag couldbe reduced by covers, but development ofmaintenance-free covers has thus far proven to beproblematic. BN estimates that about 300 million 1 Another way to achieve a higher capacity factor would
be to install regenerative braking on short-haul unitsthat made frequent stops.

Heavy Vehicle Systems Optimization Program FY 2003 Annual Report
124
gallons of fuel are used annually to move coal trains,and 15% of the energy is dissipated due to drag. Ofthe 34 million gal/yr attributed to drag from emptycoal cars, 21 million gal/yr could be saved withcovers. Similarly, the new double-stack containertrains have large gaps between cars, causing highdrag coefficients. Modification of design couldreduce drag. Research in this area could provide ahigh return.
Alternative Domestic FuelsANL has identified for study several possible novelschemes that could supply liquid fuels for heavyvehicles in the future, utilizing of domestic (orCanadian) feedstocks, including coal, tar sands(already imported in large quantities as bitumen),biomass, and possibly CO2. The study objective is toidentify technical pathways for production of cleanliquid fuels without imports, in a way that minimizescarbon emissions, energy use, and economic costs.The elements of the work include a novel liquid fuelsupply assessment literature survey, identification ofpromising options, evaluation of technical andeconomic feasibility, and evaluation of productionand delivery schemes.
H2 may not be the ideal future fuel for heavyvehicles. Our objectives are to reduce U.S.dependence on imported fuels, to reduce emissionsof CO2, and to retain convenient, liquid fuels andaffordable vehicles. Domestic liquid fuel alternativesinclude biofuels, and liquids derived from coal, tarsands, oil shale. North America has lots of coal, oilshale, and tar sands. Conventional conversion toliquids has low yields and produces large quantitiesof CO2, because much of feedstock goes to H2production. These hydrogen-poor feedstocks couldinstead be upgraded with H2 produced using nuclearpower (by electrolysis or thermochemically) toreduce net carbon emissions from liquefaction.Nuclear power is suitable for producing H2 on largescale, but H2 transport and storage are expensive;therefore local use is preferable. Our schemeproposes co-located liquefaction and hydrogenplants, to enable the local utilization of H2 producedefficiently on a large scale, without the technical andeconomic pitfalls of transportation, distribution, andstorage. ANL will evaluate this option.
Liquids could also be produced from waste carbondioxide using nuclear power. The CO2 could berecovered from power plants and large factories;there would be no net carbon emissions fromcombustion of liquid fuels produced from CO2, andno imports would be required for their production.The conceptualized process begins with the reactionof CO2 with lithium to form carbide (exothermic),followed by reacting the carbide with water toproduce acetylene (exothermic). The acetylenewould then be used as a feedstock for production ofS-free liquid fuel. The reactions are as yetunspecified, but would be simpler than thoseinvolved in current petroleum refining processes.The lithium would be regenerated by electrolysisusing nuclear power. Nuclear power would alsogenerate the small amount of H2 needed to producethe acetylene. Complete analysis of this concept isneeded, followed by laboratory demonstration, iffeasibility is promised.
Critical Project ReviewIn FY 2003, L. Gaines attended program reviews atANL and ORNL. The functions she performedincluded critical review and facilitation ofcoordination among laboratory programs. ANL willcontinue its critical monitoring of selected OFCVTexperimental projects at the discretion of theprogram manager. This activity is still necessary, forboth new and continuing projects. It is alsoimportant to evaluate the potential of these projectsfor energy and petroleum savings as well asemissions reduction as data are developed.Therefore, project managers will be requested tosubmit data for analysis. For well-establishedprojects, it would also be desirable to develop costdata to ensure economic viability as well as technicalfeasibility. Analysis of ORNL-developed compositemanufacturing techniques and comparison toprocesses for production and fabrication ofcompeting materials would be of particular interest.Results could be applied to truck and/or trailer
Basis: GP38 -2 with EPA switcher cycle for all technologies, 330 d/y, 50% idl e replacement by AESS(will be less in cold climate), 90% by APU, DDHS, or plug - in unit, .05 gal oil used/gal fuel, $0.10/kWh
20200122291Green Goat
3-114-121950Plug -in
12 -1725-352560APU or DDHS
6-127.5-151536Start/stop
Payback(months)
Cost ($1000s)
Annual savings ($1000s)
Energy saving (gal/d)
System

Heavy Vehicle Systems Optimization Program FY 2003 Annual Report
125
components and rail cars. In conjunction with this,ANL would estimate the cost of mass reduction,evaluate the best current information on fueleconomy as a function of mass reduction, andestimate the fuel price at which mass reductionpays.
ConclusionsLocomotive idling reduction devices are beingaccepted and installed in large numbers by industry.These devices meet the needs of the railroads quitewell, and all have short payback times (see table onprevious page).
No development by DOE is recommended in thisarea. However, idling reduction devices for trucksare not doing as well. Installation rates remain fairlylow, and equipment manufacturers seem to bestruggling. The available devices all have at leastone of the following drawbacks: too expensive, toobig/heavy, too noisy, don’t supply all requiredfunctions, or not available where and when they areneeded. There is significant potential to improve thissituation via research on smaller, lighter, cheaperauxiliary power units, as well as truck electrificationoptions. Financial incentives such as weight waivers,fuel and excise tax waivers, tax credits, low-interestloans, leasing programs, etc. could boostintroduction of these technologies. In addition,education is still required.
Another factor slowing the introduction of idle-reduction technology on trucks is the uncertain andvolatile regulatory environment. Various states aredeveloping different idle-reduction restrictions,
equipment requirements, and inconsistent policies.There is no nationwide guidance to help craft aconsistent set of state rules and policies. In addition,national legislation has been proposed that couldrestrict the types of devices allowed, and could favorsome over others. These factors create a significantrisk to the truck-owner that the system he choosesmight not even be permitted in some states after it isinstalled. These considerations deter purchases.Therefore, in addition to specific technologydevelopment, it is important for DOE to bring all ofthe stakeholders together, and to continue itsanalysis to pull together all of the relevant reports,draft rules, proposals, demonstrations, and otherprogram elements so that — if not a coordinatednational effort — at least a harmonious mix ofprograms can be fostered.
Buses are another fruitful area for idle-reduction. Inparticular, school and tour buses idle at local schoolsand at national monuments and museums, withobviously harmful emissions. Although the totalpotential for energy conservation is less than fortrucks, because the sector is smaller, similartechnologies are applicable, and so the research canbe easily extended to include this very visible sector.Off-road vehicles, whose primary function is oftennot transportation, should also be examined to seewhat the potential is for savings; these vehicles mayhave unique challenges and opportunities because oftheir varying functional equipment and duty cycles.

Heavy Vehicle Systems Optimization Program FY 2003 Annual Report
126
B. 21st Century Locomotive Technology 2003
Field Project Manager: L. SalasooGE Global Research1 Research Circle, Niskayuna, NY 12309(518) 387-5000; fax: (518) 387-6675; [email protected]
Technology Development Manager: Sidney Diamond(202) 586-8032; [email protected] Technical Manager: Jules Routbort(630) 252-5065; [email protected]
Contractor: GE Global ResearchContract No: DE-FC04-2002AL68284
IntroductionThe goals of the 21st Century Locomotive programare to research freight locomotives that are 25%more efficient by 2010, while meeting Tier 2emissions standards. The technology state-of-the-artwill be dramatically advanced at both the dieselengine and locomotive system levels. This 2003annual report addresses work on locomotive systemdevelopments for 15-20% efficiency improvement,in the areas of energy management and optimization(tasks 3, 4 and 5 of the program) including capturingand storing regenerative braking energy, combinedwith fuel optimization control that takes advantageof route, terrain, and train characteristic data.
The objective of the locomotive systemdevelopments is to develop and demonstrate amodular commercial energy storage unit andassociated energy management system, includingfuel optimizer software, for an advanced hybridlocomotive. The goal is a 760 million gal/yrreduction in fuel usage. This unburned fuel directlytranslates into ~9 tons of emissions avoidance.Task 3 is to develop and test advanced modularenergy storage and energy management subsystemsto recover braking energy in a diesel-electric freightlocomotive. Utilization of the braking energy willdisplace a significant portion of the overall energyrequirement from the diesel engine and producesignificant fuel savings without compromisingperformance. The first milestone will be thedemonstration of the advanced energy managementsystem (EMS), which consists of a power electronicinterface to regulate the interchange of energy
between the energy storage system (ESS) and thelocomotive main electrical bus, and amicroprocessor-based controller which commandsthe power flow to and from the ESS, the dieselengine, and the braking grid resistors. The advancedhybrid locomotive EMS will be demonstrated on thelocomotive test track at GE Transportation Systemsusing GE-provided, off-the-shelf energy storageunits. In addition advanced energy storage systemmodules will be developed and tested.
For Task 4, advanced locomotive system controls,including a novel fuel-optimal trajectory generationsystem, will coordinate throttle setting, energystorage and recovery, and braking, providingadditional synergistic fuel savings over a hybridsystem alone. The optimization software will exploitknowledge of the route ahead, track speed limits,required arrival time, on-board energy storage state,and other constraints to minimize total fuelconsumed. The goal is to demonstrate on a test tracka locomotive with fuel optimizer control algorithms.
The objectives of Task 5 will be to demonstrate ahybrid locomotive with full-scale energy storagemodules and a fuel optimizer. The goal is to performadvanced hybrid locomotive system tests anddemonstrations on a test track, incorporating theintelligent fuel optimization controls developed inTask 4. Energy storage will provide extra degrees offreedom to the optimizer; the combination of thesetechnologies has the potential to produce synergisticbenefits beyond their separate contributions.

Heavy Vehicle Systems Optimization Program FY 2003 Annual Report
127
Hybrid Locomotive Modular Energy Storageand Energy ManagementWhile the fundamental proof-of-principledemonstrations of hybrid locomotive operation havebeen carried out prior to this program, developmentis required in the areas of energy storage systemtechnology to develop locomotive-worthy systemswith high performance in terms of energy storagecapacity and power transfer capability. Hand-in-hand with the development of the energy storagesystem technology, development of appropriateenergy management techniques is required to realizethe potential high performance of the the advancedenergy storage technology, and to ensure operationallife of the energy storage.
Energy StorageRecent tests by GE of today’s energy storagetechnologies for hybrid locomotive proof-of-concepthave shown that more development is required to getenergy storage systems suitable for locomotiveapplications. Development is required in the energystorage system capabilities through a combination ofimproved energy storage technology and also systemtechnology that interfaces the energy storage to thelocomotive. The 21st Century Locomotive HybridSystems task proceeds to address this systematicallyby determining the energy storage systemspecification, identifying parameters and capabilitiesto be advanced in this program, and thenimplementing these.
Determination of the hybrid locomotive advancedenergy storage requirements is based on railroads’hybrid locomotive application requirements, GE’sexperience with existing systems developed beforethis project, and dialog with battery vendors.Discussion with two Class 1 railroads BurlingtonNorthen and Santa Fe (BNSF) and Union Pacific(UP) revealed a longtime desire to utilize the“wasted energy” that is produced when diesel-electric locomotives carry out dynamic braking, andconsiderable enthusiasm that the hybrid locomotiveconcept can provide such utilization. As a result,specific types of candidate hybrid locomotivemissions were identified. Hybrid capability canprovide lower life-cycle cost through improved fueleconomy for heavy-haul road locomotivesperforming coal haul, grain haul, intermodaltransportation and pusher applications. A specific
coal haul mission in the Powder River Basin districtof Wyoming and Nebraska was identified as atypical example: a 100-coal car train with 12,000 hplocomotive power (19,000 tons total) hauling coal215 miles from Caballo Junction WY to SouthMorrill NE (Figure 1).
The initial section has many steep uphill grades of1% or higher, followed by generally downhillsection descending approximately 1,400 ft altitude.The descent requires much dynamic braking by thelocomotives to avoid exceeding the speed limit: thisis the energy that would be captured by a hybridlocomotive. As the empty coal train returns fromSouth Morrill it has to climb the same 1,400 ftaltitude and the stored hybrid locomotive energy isused to displace significant amounts of fuel thatwould otherwise be used. On the final sectionreturning the empty coal cars to the mines in theCaballo Junction area, the hybrid energy storagesystem would be partially recharged during thedownhill grades. This stored energy would beapplied to displace fuel used when the loaded trainbegine the climb from Caballo Junction on the nextcoal haul.
In addition to the analysis of the candidate missionsprovided by the railroads, experience from GE’srecent proof-of- hybrid-locomotive-concept testsprovided input to the development of hybridlocomotive energy storage system requirements. Theenergy storage system thermal performance is veryimportant and baseline thermal system performancewas determined by testing the existing hybrid systemthat will be used for the advanced energymanagement system track test in the next year. Keyrequirements are energy storage system power andenergy performance, operating environmentcapability and operational life. The detailedrequirements were discussed with advanced batterymanufacturers, and studies were initiated to addressbattery system technology developments that wouldmeet the hybrid locomotive requirements. Thesestudies will be completed in the 1st FY2004 quarterand lead to a 1-year development of evaluationbattery system modules. Preliminary discussionswith the vendors suggest that significantimprovements in battery cycle life, charging powercapability and thermal management are feasible.

Heavy Vehicle Systems Optimization Program FY 2003 Annual Report
128
loaded train traveling east
empty train traveling west
Charge ESS during downhill braking
Discharge ESS during uphill motoring: SAVE FUEL
Discharge ESS during uphill motoring: SAVE FUEL
Charge ESS during downhill braking
loaded train traveling east
empty train traveling west
Charge ESS during downhill braking
Discharge ESS during uphill motoring: SAVE FUEL
Discharge ESS during uphill motoring: SAVE FUEL
Charge ESS during downhill braking
Figure 1. Example hybrid coal haul mission
The advanced battery system modules developedunder this program will be evaluated on a bench-testlevel and subsequently on a full-scale locomotiveplatform. Evaluation of other currently availablelithium-ion battery technology systems has beeninitiated. One vendor’s 42-V lithium-ion batterymodules were tested for electrical characteristicssuch as Amp-hour capacity, open circuit voltage andterminal voltage variation with load, to yield datasuch a shown in Figure 2. It was found that themeasured capacity was significantly below the ratedcapacity. The axis of Figure 2 is labeled with arevised state of charge (SOC). A key issue is that thecharging power capability is significantly less thanthe discharge capability, while the hybridlocomotive application requirements are for highercharging than discharging power capability.
Design of Hybrid Locomotive Energy ManagementSystem (EMS) ControlsEMS controls are under development to haveadequate capabilities to obtain high performancefrom the advanced energy storage modulesdeveloped in the earlier tasks. The approach is toidentify additional features and capabilities that arerequired in addition to existing capabilitiesdeveloped by GE prior to this project. AdditionalEMS capabilities to be developed were identified astemperature compensation and computed energystorage state recovery.
The cycle life capability of hybrid energy storagebatteries is very important to the commercial successof a hybrid locomotive system. The cycle life iscompromised when the energy storage batteries areoperated outside their ratings and at hightemperatures. Many battery systems will give goodperformance (in the short term) at temperatures closeto the operating temperature specification; howeverinternal degradation mechanisms proceed faster athigher temperatures, leading to premature batteryfailure. Therefore it is important to keep the batterypack temperature below long-term operating limits.High level charging and especially dischargingoperation will heat the batteries, and the approachdeveloped here reduces the risk of overheating.
The control of hybrid energy storage batteries by theEMS must identify when the energy storage isreceptive to charging and when it is capable todischarge stored energy. If energy storage batteriesare overcharged past their maximum limit,undesirable chemical reaction may be caused,depending on the battery chemistry. Drying out ofthe electrolyte may be caused, internal gasgeneration may occur, or the battery temperaturemay be elevated. These effects may immediatelydegrade hybrid energy storage battery capability tostore and deliver energy, as well as cause long-termreduction in battery life. If energy storage batteries

Heavy Vehicle Systems Optimization Program FY 2003 Annual Report
129
Voc
3.33.43.53.63.73.83.944.14.2
020406080100
SOC (%)
OCV
(V)
Figure 2. Lithium-ion cell open-circuit voltage characteristic
are discharged past their minimum SOC limit, rapiddegradation in the battery immediate performanceand battery life is seen. The advanced batterytechnologies that give higher energy and powerperformance are more sensitive to overcharge andoverdischarge operation. Therefore the EMS musttrack the energy storage battery state so as tominimize overcharging and overdischarging. GE hasdeveloped one technique for tracking energy storagebattery state irrespective of interfering factors in thelocomotive environment. Initial tests of severalcandidate battery state algorithms were carried outwith existing data and promising approaches wereidentified for subsequent development.
Fuel Use OptimizationThe overall goal of this task is to develop anddemonstrate advanced algorithms for driving andenergy management of freight locomotive systems,both conventional and hybrid, to reduce fuelconsumption. The algorithms are prototyped in asimulation environment, to demonstrate potentialenergy savings, with and without hybrid storage.Subsequently the algorithms will be implemented ona hybrid test locomotive platform on the GETransportation test track at Erie, PA or other suitabletest environment to demonstrate projected energysavings.
An existing flexible and configurable, system-levelmodeling environment for freight trains has been
adapted for use in this program. The model includesdynamic and steady state model for a multiplelocomotive consist, including power units, trailingcars and their loads, which takes throttle settings(and environmental variables like temperature andaltitude) as input and produces numerous outputs,e.g. positions, velocities, power generated, fuelconsumed per unit time. The track is modeled,including grade and drag effects from wheel-railinteractions, as is energy storage, including dynamicpower limits and capacity, and how it is coupled tolocomotive propulsion system. The model alsoincludes means to identify required parameters fromactive tests and/or passive monitoring fromlocomotive data, on-line, with minimal or no traindriver interaction.
It is necessary to have means to automaticallydetermine particular train parameter values to makethe ultimate system practical in the locomotiveworld. Techniques have been developed forperforming such parameter identification toautomatically determine the number of locomotivesin consist, estimate train mass (with and withoutlocomotives), determine combined effect of gradeand drag, and estimate the fuel efficiencycharacteristics from internal power and periodic fueltank refills.
The need to have such methods may seem counter-intuitive, in that one would think this data to be
Heavy Vehicle Systems Optimization Program FY 2003 Annual Report
130
available in the process of making up the train.However, in the real world, it is highly undesirableto rely on crews to enter data (like number and typeof locomotives) and load factors are known onlyapproximately. Even when the track data-base isknown, the effective grade load depends on how thetrain is distributed behind the power consist. Finally,a lot of variation results from changes in weather,track condition over time, etc. Knowing all theseparameters and how they vary over a route is vital todetermining optimal driving strategies. A variety oftechniques is utilized to determine the train mass, theprevailing drag and correctly identify the number oflocomotives in trail within a few minutes of driving.The identification methods have been validated andintegrated as part of the modeling environment foruse in this study. A successful field test carried out acorrect blind identification of the number oflocomotives in a consist and also estimation of thetrain mass (Figure 3).
The figure shows the test with a 8,175-ton train. At500sec the estimator made a first estimate of14 million lb, which was improved by the nextiteration at 1,000 sec that halved the remaining error.Ultimately the error is reduced to approximately 1%.Thus within several minutes, a high-qualityparameter set is available for fuel optimization.
Figure 3. Field identification of train mass
ConclusionThis report covers progress in the first three projectquarters. Hybrid system tasks are in progress todevelop locomotive-specific high-performancehybrid energy storage systems and energymanagement systems. The development of fueloptimizer components has made good progress.

Heavy Vehicle Systems Optimization Program FY 2003 Annual Report
131
IX. Particulate Matter Characterization
Morphology, Chemistry, and Dynamics of Diesel Particulates
Principal Investigator: K.O. LeeArgonne National Laboratory9700 South Cass Avenue, Argonne, IL 60439(630) 252-9403; fax: (630) 252-3443; [email protected]
Technology Development Manager: Sid Diamond(202) 586-8032; [email protected] Program Manager: Jules Routbort(630) 252-5065; [email protected]
Contractor: Argonne National LaboratoryContract No.: W-31-109-ENG-38
Objective• Characterize the morphology, microstructure, dimensions, and chemistry of light-duty diesel engine particulates
Approach• Provide soot samples collected from the exhaust system of a light-duty diesel engine using a thermophoretic
sampling device, examine the morphology of the samples, and provide images using a transmission electronmicroscope (TEM).
• Measure particle sizes using the data acquistion/image processing systems and analyze the graphitic structuresof the particles using a Raman spectroscope.
Accomplishments• A novel thermophoretic sampling system was developed to sample soot particles from a light-duty diesel
engine.
• The sizes and microstructures of diesel particulates were measured at various engine-operating conditions andtheoretically verified their accuracy.
• Analysis for fractal geometry of diesel particulates standardized the morphology and shape by measuring fractaldimensions.
• The motion pictures of an aggregate particle were first demonstrated to reveal the real three-dimensional shapesof an aggregate particle.
Future Direction• Investigate the effects of diesel engine exhaust components and fuel properties on particle morphology and
sizes.
• Characterize the morphology of gasoline engine particulates.

Heavy Vehicle Systems Optimization Program FY 2003 Annual Report
132
IntroductionAccurate analysis of diesel particulate matter is animportant issue to diesel engine and aftertreatmentsystem manufacturers, and government agencies thatregulate particulate emission standards or manageenergy-efficient engine/vehicle-developmentprograms. Undoubtedly, the impacts of dieselparticulate matter on human health have broughtincreasing concerns to the public in recent years.Upon increasing needs for detailed research on thesechallenging issues, numerous investigators haveattempted to analyze the sizes and structures ofdiesel particulates in several different ways [1–4].
However, most of commercially developed sizemeasurement instruments have uncertainties inmeasurement accuracy. Over the measurementaccuracy issue, an important question is also broughtto technical communities; do the particle sizesmeasured by commercial size measurementinstruments represent the actual dimensions of dieselparticulates? Indeed, most of them provide particledimensions, based on aerodynamic behaviors ofsampling particles, which assumes the particles inmeasurement are perfectly spherical in shape [5].
In this project, therefore, the physical dimensions ofdiesel particulates were measured in terms of theradius of gyration of aggregate particles and thediameter of near-spherical primary particles. Fractalanalysis was performed to standardize themorphology of particulates emitted from a light-dutyturbocharged DI diesel engine. All these analyseswere carried out, owing to the successfuldevelopment of a novel thermophoretic samplingsystem and an image processing/data acquisitionsystem that can be applied to internal combustionengines. The detailed internal microstructures ofdiesel particulates were observed at high TEMmagnifications, and further analyzed to find theatomic structures of graphitic soot particles by usinga Raman scattering spectroscope.
Experimental DescriptionsThermophoretic Sampling ApparatusFor particulate sampling, a series of thermophoreticsampling system was installed on a rigid platformnear the exhaust manifold. A custom-designedsampling chamber was connected to the exhaust
manifold through a stainless steel tube and an on/offshutter valve that controls the release of exhaustemissions from the engine to the sampling chamber.Fine TEM sampling grids were used to collect sootparticles, which were attached to a grid holder on thetip of probe. The sampling system was thenactivated by controlling a series of solenoid valveand electronic timing/trigger unit. The samplercollects particulates from the exhaust stream withina specific residence time, which was optimized tocollect a sufficient number of particles for analysis,and to avoid possible particle overlapping onsamples.
Diesel particulates were sampled at engine speeds of675 rpm (idling), 1,000 rpm, 2,500 rpm, and4,000 rpm with various loading conditions from 0%to 100%. EGR rates and equivalence ratios were alsomonitored to maintain constant values during eachexperiment. Particulates were then collected on thesampling grid by thermophoresis effects, which aredriven by the temperature gradient generatedbetween the hot exhaust stream and the near-roomtemperature grid surface.
TEM AnalysisThe particulate samples were observed andphotographed using a Philips CM30 TEM. The TEMmicrographs were then digitized with a high-resolution closed-coupled device (CCD) camera anda customized image processing/data acquisitionsystem to analyze detailed morphological properties,such as the primary particle diameter, radius ofgyration, and fractal dimension. Detaileddescriptions of this analysis technique can be foundelsewhere [6,7].
Results and DiscussionParticulate MorphologyFigures 1 (a) and (b) are TEM photographs of thediesel particulates sampled at 1000 rpm and 25%,75% engine loads. As seen in the figures, dieselparticulates appeared to consist of an agglomerationof numerous spherical primary particles. Theseaggregate particles represented a variety of differentshapes, from near spherical to stretched chain-like.The aggregate particles were distributed in a widerange of size — from tens of nanometers to a fewmicrons. It is quite challenging to measure the sizes

Heavy Vehicle Systems Optimization Program FY 2003 Annual Report
133
(a)
(b)
Figure 1. TEM photographs of particulates sampled at1,000 rpm at (a) 25% load, (b) 75% load (magnificationof 17,000X)
of those stretched chain-like particles with anapproximation that they represent the sameaerodynamic behaviors as spherical particles.Indeed, commercial instruments use theapproximation.
Significant differences in morphology wereobserved depending on the engine load. Figures 2(a)and (b) show typical TEM micrographs of dieselparticulates sampled at 780 rpm/0% load (idling)and 2,500 rpm/70% load. At the low load, manyparticles appeared to be nebulous in morphology. Itis speculated that these amorphous soot particlesmay contain a significant amount of soluble organiccompounds (SOC). On the other hand, theparticulates sampled at the high engine loadappeared to be more distinct in morphology. Thistrend is quite common in diesel particulates, as
(a)
(b)
Figure 2. TEM photographs of particulates sampled at(a) 780 rpm/0% load, and (b) 2,500 rpm/70% load(magnification of 89,000X)
reported for heavy-duty diesel particulates in ourprevious literature [8–10].
Graphitic Structure of Diesel ParticulatesA majority of particles sampled at high engineloading conditions appeared to be graphitic, whilethe particulates produced at low loading seemed tobe amorphous. To validate the observation, Ramanscattering spectroscopy was used, whichcharacterizes the sizes, crystal structures, anddisorder of graphitic carbon materials [11–13].Figure 3 shows a Raman spectrum obtained for theparticulates sampled at 2500 rpm and 100% load.The spectrum shows two distinct peaks, G peak(1,580 cm-1–1,600 cm-1) and D peak (1,350 cm-1).The G peak results from the interaction betweencarbon atoms during the in-plane stretching
780rpm / 0%
2500rpm/70%

Heavy Vehicle Systems Optimization Program FY 2003 Annual Report
134
vibrational mode and the D peak from the oneduring the breathing vibrational mode [11]. With theRaman data, we calculated an average crystal size of5.5 nm for the particulates sampled at 2,500 rpm/100% load. With further theoretical analysis [14], itwas found that a carbon layer in a graphiticcrystallite consists of 864 carbon atoms, and theinterlayer distance between carbon layers and thedistance between carbon atoms were calculated to be0.34 and 0.141 nm, respectively. The correspondingdistances of typical carbon graphite are known to be0.3354 and 0.1422, respectively. This result impliesthat the internal microstructures of these dieselparticulates closely resemble those of typicalgraphite.
-1000
0
1000
2000
3000
4000
5000
500100015002000
G-peak(1596.8, 2867.7)
FWHM=86.4
2500 rpm-100% load
Inte
nsity
(arb
. uni
t)
Raman Shift (cm-1)
D-peak(1364.1, 2280.1)FWHM=182.2
ID/I
G=0.795
Figure 3. Raman spectrum of the dieselparticulates sampled at 2,500 rpm/100% load
Primary Particle SizeTable 1 shows the particulate measurement data weobtained at various engine-operating conditions. Foreach experiment, the exhaust temperature, EGR rate,and equivalence ratio were recorded to find theireffects on particulate properties. The sizes ofprimary particles were measured at various engine-operating conditions, and at each condition anaverage value of primary particles were evaluated bymeasuring the diameters of more than 200 primaryparticles randomly selected from differentaggregates. As shown in the Table 1, averageprimary particle diameters (dp) were measured in arange of 19.4 nm and 32.5 nm through the entireengine conditions. These diameters were smallerthan those measured for heavy-duty diesel
particulates (28.5 nm to 34.4 nm) in our previousstudy [8–10].
Figure 4 shows primary particle size distributions asa function of exhaust temperature for both light-dutyand heavy-duty diesel engines. In general, theprimary particle sizes decrease both in the heavy-duty [8–10] and light-duty engines as the exhausttemperature increases. The smallest average primaryparticle of 19.4 nm was measured to the light-dutyengine at 2,500 rpm and 100% load. For the light-duty diesel engine, the particle formation wassignificantly affected by EGR modes, as described innext section.
In the particulate formation mechanism, primaryparticles experience a series of chemical and thermalprocesses, in which precursor particles nucleate,grow through coagulation and agglomeration withother primary particles, and oxidize to reduce thehydrogen/carbon (H/C) ratio. A major parameter tocontrol these processes is known to be thecombustion temperature. A higher combustiontemperature enhances both particle nucleation andoxidation. Thus, the existence of a primary particlein the combustion field depends on competition ofthese two events. In the low temperature rangeshown in the figure, particle nucleation and growthare predominant and subsequently produce slightlylarger particles as temperature increases.
10
20
30
40
50
0 200 400 600
Light-dutyHeavy-duty
d p (nm
)
Texh
(oC)
Figure 4. Primary particle size (dp) as afunction of exhaust temperature

Heavy Vehicle Systems Optimization Program FY 2003 Annual Report
135
Table 1. Engine operating conditions and particulate measurement data
EngineRPM
EngineTorque(Nm)
EngineLoad(%)
ExhaustTemperature
(oC)
EGRRate(%)
EquivalenceRatio
dp(nm)
Rg(nm)
Df
675 0 0 140.0 0 N/A 28.6 N/A N/A1000 31 25 212.9 21.7 0.606 24.9 85.4 1.521000 62 50 300.5 11.4 0.638 27.6 98.0 1.481000 93 75 362.0 0.5 0.93 25.4 119.5 1.482500 18.8 10 264.3 28.7 0.379 29.6 77.4 1.702500 47 25 348.5 21.9 0.562 30.0 96.3 1.462500 94 50 468.6 11.9 0.627 32.5 94.2 1.602500 131.6 70 526.2 1.0 0.603 24.6 85.5 1592500 188 100 598.7 0.5 0.816 19.4 95.0 1.634000 40 25 382.8 0 0.406 21.1 96.7 1.574000 79 50 504.4 0 0.594 23.4 134.1 1.464000 118.5 75 626.3 0 0.724 19.6 83.7 1.61
Effects of Exhaust Gas Recirculation (EGR)Our light duty diesel engine was mapped to operateat different EGR modes, depending on engine speedsand loads. The sizes of average primary particles atthree different engine speeds were displayed as afunction of exhaust temperature in Figure 5. Thepercentage rate of EGR at each condition was notedon each data point. As shown in the figure, theprimary particle diameters at 1,000 rpm and2,500 rpm were overall larger than those at4,000 rpm where EGR was inactive. This trendsuggests that EGR should increase the primaryparticle size consistently. In a comparison of datameasured at approximately the same EGR rates for1,000 rpm and 2,500 rpm, the primary particlediameters at 2,500 rpm appeared to be larger thanthose at 1,000 rpm. Note that the fuel-airequivalence ratios of the counterpart data (atapproximately same EGR rates) are comparable eachother (see Table 1). However, exhaust temperatureswere higher at 2,500 rpm for both 25% and 50%loads. The higher temperatures seemed to increaseprimary particles sizes at 2,500 rpm. In this case,therefore, the enhanced particle nucleation andgrowth seemed to dominate over particle oxidation.Furthermore, the residence time available foroxidation should decrease at the higher enginespeed.
Figure 5. Effects of EGR on primaryparticle size as a function of engine load
Aggregate Particle SizeMost of diesel particulates were found to be astretched chain-like shape in morphology, asdescribed above. To represent the physicaldimension of these complex particles mostaccurately, we measured the radii of gyration (Rg’s)of aggregates at various engine conditions. Asshown in Figure 6, the magnitude of radius ofgyration was distributed in a range of 77.4 nm to134.1 nm for the entire engine conditions. Thesevalues appeared to be quite larger than the
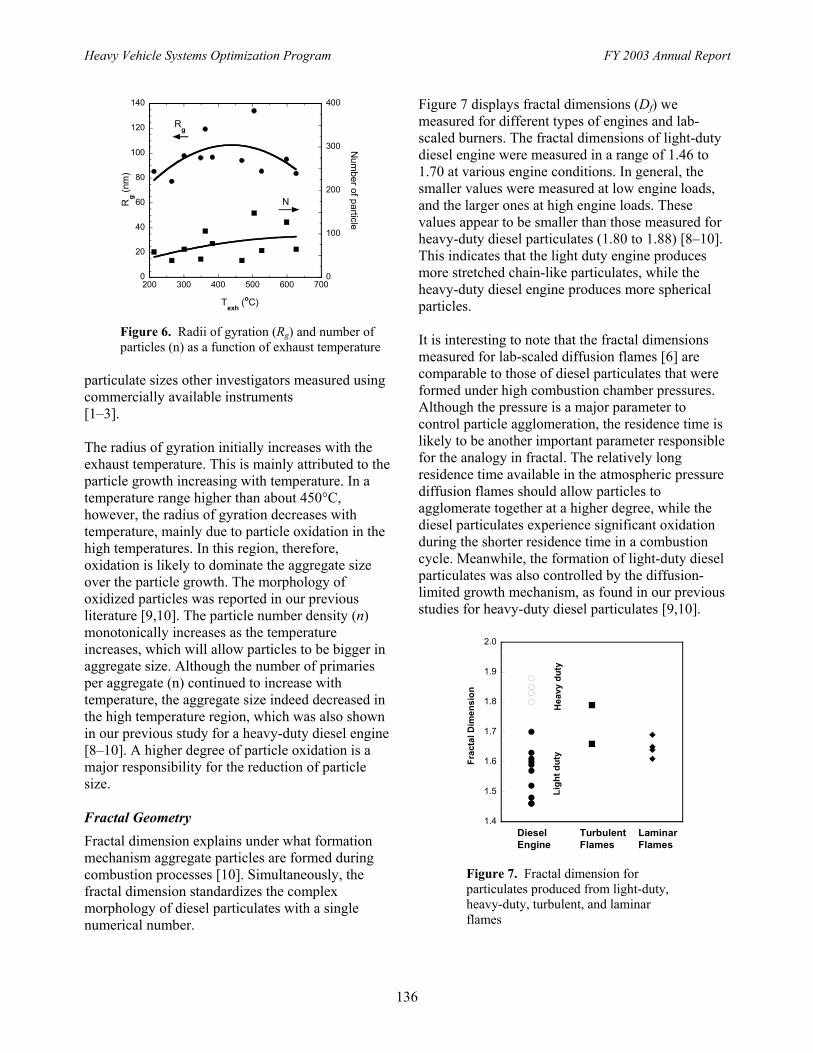
Heavy Vehicle Systems Optimization Program FY 2003 Annual Report
136
0
20
40
60
80
100
120
140
0
100
200
300
400
200 300 400 500 600 700
Rg (n
m)
Num
ber of particle
Texh
(oC)
N
Rg
Figure 6. Radii of gyration (Rg) and number ofparticles (n) as a function of exhaust temperature
particulate sizes other investigators measured usingcommercially available instruments[1–3].
The radius of gyration initially increases with theexhaust temperature. This is mainly attributed to theparticle growth increasing with temperature. In atemperature range higher than about 450°C,however, the radius of gyration decreases withtemperature, mainly due to particle oxidation in thehigh temperatures. In this region, therefore,oxidation is likely to dominate the aggregate sizeover the particle growth. The morphology ofoxidized particles was reported in our previousliterature [9,10]. The particle number density (n)monotonically increases as the temperatureincreases, which will allow particles to be bigger inaggregate size. Although the number of primariesper aggregate (n) continued to increase withtemperature, the aggregate size indeed decreased inthe high temperature region, which was also shownin our previous study for a heavy-duty diesel engine[8–10]. A higher degree of particle oxidation is amajor responsibility for the reduction of particlesize.
Fractal GeometryFractal dimension explains under what formationmechanism aggregate particles are formed duringcombustion processes [10]. Simultaneously, thefractal dimension standardizes the complexmorphology of diesel particulates with a singlenumerical number.
Figure 7 displays fractal dimensions (Df) wemeasured for different types of engines and lab-scaled burners. The fractal dimensions of light-dutydiesel engine were measured in a range of 1.46 to1.70 at various engine conditions. In general, thesmaller values were measured at low engine loads,and the larger ones at high engine loads. Thesevalues appear to be smaller than those measured forheavy-duty diesel particulates (1.80 to 1.88) [8–10].This indicates that the light duty engine producesmore stretched chain-like particulates, while theheavy-duty diesel engine produces more sphericalparticles.
It is interesting to note that the fractal dimensionsmeasured for lab-scaled diffusion flames [6] arecomparable to those of diesel particulates that wereformed under high combustion chamber pressures.Although the pressure is a major parameter tocontrol particle agglomeration, the residence time islikely to be another important parameter responsiblefor the analogy in fractal. The relatively longresidence time available in the atmospheric pressurediffusion flames should allow particles toagglomerate together at a higher degree, while thediesel particulates experience significant oxidationduring the shorter residence time in a combustioncycle. Meanwhile, the formation of light-duty dieselparticulates was also controlled by the diffusion-limited growth mechanism, as found in our previousstudies for heavy-duty diesel particulates [9,10].
1.4
1.5
1.6
1.7
1.8
1.9
2.0
Frac
tal D
imen
sion
Hea
vy d
uty
Ligh
t dut
y
Diesel Engine
TurbulentFlames
Laminar Flames
Figure 7. Fractal dimension forparticulates produced from light-duty,heavy-duty, turbulent, and laminarflames

Heavy Vehicle Systems Optimization Program FY 2003 Annual Report
137
ConclusionsThe morphology, sizes, internal microstructures, andfractal geometry of light-duty diesel particulateswere characterized in detail. The analyses revealedthat the light-duty diesel engine produces variousshapes of particles from near spherical to stretchedchain-like through the entire engine conditions. Itwas also found that the particulates produced at alow engine load were nebulous, and the onesproduced at high engine loads were distinct inmorphology and represented graphitic structures.Raman spectra and subsequent mathematicalanalyses revealed that these diesel soot particlesclosely resemble the typical carbon graphite in termsof atomic structures.
The mean values of primary particle diameter rangedfrom 19.4 nm and 32.5 nm through the entire engineoperating conditions. They were significantlyaffected by the engine speed and load, EGR mode,and equivalence ratio. The decreasing trend ofprimary particle sizes with engine loads, similarly toheavy-duty diesel particulates, was mainly attributedto particle oxidation dominated by the highcombustion temperature. EGR also increasedprimary particle sizes significantly in most enginespeed and load conditions. Larger primary particlesat 2,500 rpm than those sampled at 1,000 rpm arelikely to result from the dominant effects of particlenucleation and growth exceeding oxidation. Theradius of gyration was measured in a range of 77 nmto 134 nm, and the fractal dimensions wereevaluated at 1.5–1.7. These fractal dimensions aresmaller than those of heavy-duty diesel engineparticulates, which suggests that the light-duty dieselengine produces more chain-like particles than doesthe heavy-duty diesel engine.
References1. Vuk, C.T.; Jones, M.A.; Johnson, J.H., SAE
760131.2. Carpenter, K.; Johnson, J.H., SAE 790815.3. Baumgard, K.J.; Kittelson, D.B., SAE 850009.4. Abdul-Khalek, I.S.; Kittelson, D.B.; Graskow,
B. R.; Wei, Q.; Brear, F., SAE 980525.5. Willeke, K., and Baron, P.A.: Aerosol
Measurement, Van Nostrand Reinhold, NewYork, 1993.
6. Lee, K.O.; Megaridis, C.M.; Zelepuga, S.;Kennedy, L.A., Combust. Flame, 121:323–333(2000).
7. Guenç, A.; Megraidis, C.M.; Campbell, A.;Lee, K.O.; Choi, M. Y., Combust. Sci. Technol.171:71–88 (2002).
8. Lee, K.O.; Cole, R.; Sekar, R.; Choi, M.Y.; Zhu,J., U.S. Section Second Joint Meeting of theCombustion Institute, Oakland, CA, March26–28 (2001).
9. Lee, K.O.; Cole, R.; Sekar, R.; Choi, M.Y.; Zhu,J.; Kang, J.; Bae, C., SAE 2001-01-3572.
10. Lee, K.O.; Cole, R.; Sekar, R.; Choi, M.Y.;Kang, J; Bae, C.S., Shin, H.D., 29th Proc.Comb. Inst. (2002).
11. Tuinstra, F.; Koenig, J. L., J. Chem. Phys.53:1126–1130 (1970).
12. Knight, D. S.; White, W. B., J. Mater. Res.4:385–393 (1989).
13. Ferrari, A. C.; Robertson, J., Phys. Rev. B61:14095–14107 (2000).
14. Belenkov, E. A., Inorganic Materials, 37:928–934 (2001).

Heavy Vehicle Systems Optimization Program FY 2003 Annual Report
138

Heavy Vehicle Systems Optimization Program FY 2003 Annual Report
139
X. Brake Materials
Ceramic Braking Materials Development for Commercial Vehicles
Principal Investigator: P. GrayPower Systems Composites, LLC400 Bellevue Road, Newark, DE 19713(302) 631-1319; fax: (302) 631-1320; [email protected]
Technology Development Manager: Sid Diamond(202) 586-8032; [email protected] Program Manager: Jules Routbort(630) 252-5065; [email protected]
Contractor: DOE Office of Heavy Vehicle Technology (DOE-OHVT)Contract No.: DE-FC04-2000AL66778
Objective• Develop a cost-effective C/SiC brake rotor for Class 7 and 8 with improved performance over incumbent
systems.
• Performance goals include decreased fade, weight reduction, stable friction coefficient and decreased wear at aprice competitive with cast iron rotors and organic bonded pads.
Approach• Utilize PSC/ ALS chopped fiber preform technology with PSC melt infiltration (MI) expertise.
• Perform sub-scale dynamometer testing at Greening Laboratories on both incumbent and developmentalsystems.
• Refine material system to achieve desired friction and wear properties.
• Measure material properties of downselected system.
• Perform full scale dynamometer testing at Bendix-CVS test facility and report results.
Accomplishments• Showed that organic pads are unsuitable on C/SiC rotors; must use C/SiC pad/rotor couples.
• Demonstrated that C/SiC pad/ rotor couples resulted in stable friction coefficients of 0.5-0.6 with wear rateswhich were 20% that of conventional cast iron rotor/ organic pad couples.
• Demonstrated molded rotor preform technology which protected carbon fibers from molten silicon attackduring MI.
• Performed scale-up trials with culminated in production of full-sized 17 inch C/SiC test rotor.
Future Direction• Perform mechanical properties testing on pad and rotor materials.
• Work with Bendix-CVS to integrate C/SiC material into existing metal-backed pad design.

Heavy Vehicle Systems Optimization Program FY 2003 Annual Report
140
• Finalize dynamometer test plan and evaluate performance of full-sized rotor/pad couples at Bendix CVS.
• Possible vehicle testing at Bendix CVS if program resources allow.
IntroductionThe DOE-OHVT Ceramic Brake Developmentprogram is part of the Department ofTransportation’s 21st Century Truck Initiative. Onegoal of this initiative is to drastically reduce theaerodynamic drag of the nation’s freight-haulingfleet thus reducing fuel costs. As drag is reduced, theenergy dissipated by the braking systems increases.Incumbent cast iron rotor/ bonded organic padbraking systems do not have the braking reservesnecessary to implement these drag-reductionsystems in current heavy vehicles.
Power Systems Composites (PSC), LLC (formerlyHoneywell Advanced Composites Inc.) utilized itsexperience in both carbon-carbon materialsdevelopment and silicon melt infiltration to design asuitable carbon fiber reinforced SiC brake pad androtor material system. The key to producing thesesystems was to prevent fiber and interface attackduring silicon melt infiltration.
Friction and wear screening tests on an 8-inch-dynamometer were used to optimize the pad androtor characteristics. The program as written,initially planned to use commercially-availableorganic-bonded pads or SiC/Al2O3 (DIMOX)composite with the C/SiC rotors. The commercialpads were found to have low friction coefficient(mu) and high wear in contact with several types ofC/SiC. The SiC/Al2O3 had reasonable mu but at awear rate about twice that of the commercial pad oncast iron. PSC then tested several combinations ofC/SiC pads and rotors they had previously made andgenerally found the C/SiC pad/ rotor combinationsgave stable mu with lower wear than ironrotor/organic pad couples.
Full-sized C/SiC rotors were made from thedownselected system during the fall of 2003. Thesale of Bendix CVS from Honeywell to Knorr-Bremese stalled the full-scale testing of these rotorsduring Q2-Q3, 2003. The test program has been re-initiated and the full-scale rotor/ pad testing isexpected to be initiated late in Q4 2003 andcompleted early in 2004.
Results and DiscussionTable 1 summarizes the friction and wear resultsobtained on the test matrix of cast iron baseline andthree types of C/SiC rotors versus commercialorganic pads, the SiC/Al2O3 (DIMOX) compositeand the type 034 C/SiC.
Table 1. Friction and wear test results on candidate rotor/pad combinations.
Rotor Type Pad Type
Wear Rate(cu in/hp-hr*0.001)
FrictionCoeff.
Cast Iron Jurid 539 3.9 0.35-0.55Cast Iron Texstar T7400 4.2 0.27-0.70
C/SiC 034 Dimox I 300 <0.2C/SiC 034 Dimox II 11.6 0.50-0.30C/SiC 034 C/SiC 034 1.4 0.050-0.55C/SiC 010 Dimox I 3.2 0.45-0.60C/SiC 010 Dimox II 12 0.40-0.30C/SiC 010 C/SiC 034 0.7 0.55-0.50C/SiC 028 Dimox I 21.6 <0.2C/SiC 028 Dimox II 8.8 0.40-0.60C/SiC 028 C/SiC 034 0.7 0.6-0.55
The friction and wear testing was performed byGreening Test Labs on their Friction AssessmentScreening Test (FAST) dynamometer. The test wasconducted for 90 minutes and applies a varying loadto maintain a constant torque on the rotor. Theresults are plotted as lining pressure, which isinversely proportional to mu, versus time.
The friction and wear performance of the organic(Jurid) pad on C/SiC is shown in Figure 1. Note thelining normal pressure exceeds the maximumobtainable on the FAST machine as the mu dropsbelow 0.2 about half-way through the test.
Similar results were obtained on the other types ofC/SiC with both the Jurid and Textron pads. Thesewere unacceptable rotor/pad couples for furtherconsideration.

Heavy Vehicle Systems Optimization Program FY 2003 Annual Report
141
Figure 1. Friction behavior of Jurid organic pad on type029 C/SiC rotor.
Figure 2 shows the behavior of the baseline Juridorganic pad on a cast iron rotor. The mu increasedfrom 0.3 to 0.6 over the 90-minute test. Ideally, flatmu versus time is a desirable test attribute. The padsample thickness was measured after testing and thereduction in thickness used with the normal pressureto calculate a wear rate as cu-in/hp-hr × 0.001. Thisgradual increase in mu over the test duration wastypical for the organic pads on cast iron. Wear ratesfor these couples averaged 4 cubic inches/ hp-hr ×0.001.
Figure 2. Friction behavior of commercial Jurid pad oncast iron rotor
Figure 3 shows the frictional behavior of thedownselected C/SiC pad and rotor couple. Note thestable mu throughout the testing period.
Figure 3. Friction behavior of downselected C/SiC padon C/SiC rotor
Measured wear rates on the C/SiC pad materialtested in Figure 3 were about a factor of 5 lower thanthe incumbent cast iron/ organic pad couple.
Much thought was given to the fabricationtechniques needed to make both pads and rotors. Alow cost chopped fiber molding compound (CFMC),previously developed at HACI, was targeted to makethe rotors. This material has the advantage of beingable to be made into complex shapes such as ventedrotors. Figure 4 is an example of a 10-inch subscalevented rotor made using this process. Moldingprocesses allow complex shapes to be made withminimal preform machining.
Figure 4. Melt infiltrated C/SiC brake rotor sub-element made using CFMC developed at PSC(size is 10" diameter)
Jurid Pad on
FAST
FAST
Jurid Pad on
C/SiC Pad on
FAST

Heavy Vehicle Systems Optimization Program FY 2003 Annual Report
142
The full-sized, 17 inch test rotors, which will betested at Bendix-CVS, were also made using theCFMC approach. These rotors consisted of a diskwith lugs on the rotor ID which were designed tomate with the hub design used by Bendix-CVS totest conventional cast iron rotors. No attempt wasmade to introduce venting holes into the C/SiCbrake rotor at this time. Should venting be required,these features could be machined into the rotorduring the preform stage prior to MI. Figure 5 showsthe completed full-sized rotor mounted on themetallic hub at Bendix-CVS.
Figure 5. Completed full-sized rotor on hubassembly at Bendix-CVS
PSC is working with Bendix-CVS to develop adynamometer test plan for the full-scale rotors.Bendix-CVS has supplied PSC with drawings for thebrake pad assemblies as well as some sample padassemblies used on cast iron rotors. The goal is forPSC to deliver C/SiC pad assemblies to Bendix-CVSby the end of 2003.
Mechanical testing of the rotor and pad materialswill be performed late in 2003 in parallel with thedynamometer testing. The goal is to perform somesimple finite element modeling to predict suchfactors as lug tear-out torque and burst speed.
ConclusionsThe OHVT Ceramic Truck Brake program hasperformed materials development and frictionscreening experiments on candidate C/SiC pads androtors. Early in the program, the use of commercialorganic disk brake pads as well as SiC/Al2O3composite pads with C/SiC rotors was found toexhibit unacceptable friction and wear performance.
Friction and wear performance of C/SiC pads androtors in screening tests was excellent. The frictioncoefficient measured during the testing was constantand ranged from about 0.5 to 0.6. Pad wear ratesalso measured during the sub-scale dynamometertesting were a factor of 4–5 lower than the baselineorganic pads on cast iron rotors.
Sub-scale and full scale rotor fabrication usingchopped fibers in a thermosetting resin matrixcompound was successfully demonstrated. Several17-inch full-sized truck brake rotors were fabricatedfor dynamometer testing at Bendix-CVS.
The program is currently working on integrating theC/SiC pad materials into the current metal-backedorganic matrix pads. Dynamometer testing andmechanical properties testing should beginJanuary 2004.

Heavy Vehicle Systems Optimization Program FY 2003 Annual Report
143
XI. Off-Highway Vehicles
Advanced Hybrid Propulsion and Energy Management System for High-Efficiency, Off-Highway, 320-Ton Class, Diesel Electric Haul Trucks
Field Project Manager: L. SalasooGE Global Research1 Research Circle, Niskayuna, NY 12309(518) 387-5000; fax: (518) 387-6675; [email protected]
Technology Development Manager: Sid Diamond (202) 586-8032; [email protected] Technical Manager: Jules Routbort (630) 252-5065; [email protected]
Contractor: GE Global ResearchContract No: DE-FC04-2002AL68080
IntroductionThis program addresses the “Off-Highway ThermalManagement/Systems Efficiency Technologies”objective as given in the “Research and developmentto increase engine efficiency, reduce emissions, andimprovement in systems efficiency for off-highwayvehicles, including construction, agriculture andmining equipment” solicitation. In particular, theprogram will demonstrate improved mine haul truckefficiency in terms of energy efficiency by utilizingthe recovery and reuse of braking energy whichwould otherwise be wasted as heat. The brakingenergy is utilized by adding a hybrid energy storagesystem to the architecture of the diesel-electric minehaul truck as shown in Figure 1. Initial analysissuggests 18% energy saving in a typical mission.
The program progresses in three stages: the first, todevelop the hybrid energy storage subsystem (ESS)and hybrid energy management subsystem (EMS),the second to evaluate and test these systems first ona subscale level in the laboratory and then on a fullscale static test; and the third to integrate the hybridenergy storage and hybrid energy managementsubsystems to a 320-ton-class mine haul truck, anddemonstrate the operation of the hybrid truck. In the2003 project year the initial system studies havebeen done, and the ESS and EMS subsystems havebeen defined, evaluated and bench-scale tested. The
bench scale demonstration and evaluation of thecombined ESS and EMS system has been initiated.
Configuration and System Studies toDetermine System RequirementsA team visited the Komatsu Proving Ground,located in Green Valley, Arizona for familiarizationwith the proving ground and the 320-ton 930Emining haul truck. The proving ground is a formercopper mine that is no longer active, with two pitswhich had haul roads spiraling to the bottom of eachpit, as well as office space and workshops (seeFigure 2 aerial photo). At present, one usable mineroad is maintained, which descends part-way into amine pit. In addition there is a constant 10% testgrade section.
The mine road was inspected by driving a 930Emine haul truck over the route and electronicallyrecording data on truck performance (includingspeed, power, torque) on several runs in both uphilland downhill directions, loaded and unloaded. Sincethe proving ground is not an operating mine, it waspossible for each of the visiting team members todrive the mine haul truck. A mine haul truck wasinspected (Figure 3) and candidate locations forinstallation of the hybrid system were identified. Apotential total of approx. 560 cu. ft. was identified.

Heavy Vehicle Systems Optimization Program FY 2003 Annual Report
144
Figure 1. Top level system block diagram of the 320-ton hybrid minehaul truck demonstrator
Figure 2. Mine haul truck proving ground
Figure 3. GE team with 930E mine haul truck
The datalogs and mine topographical data wereanalyzed to derive the mine road grade and elevationprofiles (Figure 4). Two distinct missions areenvisaged to be used in the demonstration of thehybrid mine haul truck: one will use the 10% grade(“termed the simple grade mission”), and the other(“composite grade mission”) was selected from thetotal mine road, to run 6,500 ft between the lowestpoint, where a stone crushing plant is located, and a
Figure 4. Mine road grade and elevation profiles
junction with another mine road which has aconvenient stopping and turnaround location. Thecomposite grade mission has approx. 7% averagegrade. One of the key variables in the hybrid truckdemonstration will be the driving style of the truckoperator, how he approaches curves, how heanticipates the need to brake and so forth. Operationon the simple grade mission will simplify theoperator’s task and eliminate many of the drivingstyle judgment calls he needs to make, yielding avery reproducible performance that will be used toverify and calibrate analysis and model predictions.
Operation on the composite grade mission willprovide a realistic scenario of operation in theoperating mine environment and provide data toassess hybrid performance in the operating minesetting.
Hybrid mine haul truck performance was analyzedusing mission analysis (MA) models. These models

Heavy Vehicle Systems Optimization Program FY 2003 Annual Report
145
handle the mine haul truck equations of motion, andpower flow between diesel engine prime mover,auxiliary loads, traction system (both motoring andretarding) and the hybrid energy storage. Given themission profile (grade vs. distance), mine haul truckparameters (weight, subsystem efficiencies andcapabilities), driving commands (such as speed limitvs. distance) and hybrid system parameters (energystorage capability and energy management strategy),the MA model simulates the dynamic performanceof the vehicle (speed, position, power flows andaccumulated energies vs time). The output is post-processed to yield parameters such as diesel primemover input, mission time, and hybrid system storedenergy. Validation was performed against thedatalogs obtained at the mine visit.
To guide sizing of the mine haul truck hybridsystem, a benefits assessment study for an uphillhaul composite grade cycle was done. The MAmodel was used to analyze the unloaded downhill(hybrid system charging from the retarding power)and loaded uphill (hybrid system discharging toaugment traction power) runs. The downhill speedlimit was varied: faster speeds reduced total cycletime but led to higher available retard power forshorter periods. The energy storage kW charge anddischarge limit was varied. The hybrid mine haultruck charged up energy storage on downhill run,and on uphill run combined diesel 2700GHP powerwith stored energy to get higher traction power,which sped the uphill run and lowered cycle time.For each combination of parameters, the MAanalysis provided the total cycle time and kWhenergy provided by the diesel prime mover.
For the mine operator, key performance parametersare productivity (ton-miles hauled per hour) and fuelefficiency (ton-miles hauled per gallon). In thisbenefits assessment study, prime mover energyefficiency (ton-miles hauled per kWh) was used as aproxy for fuel efficiency. The results of the studywere analyzed to show variation of relativeefficiency and productivity vs a baseline cycle with24-mph average downhill speed and 17 min. cycletime. As an example, a hybrid system with 800kWcharging and discharging power capability, that isoperated over the composite grade mission with18mph average downhill speed, will display baselineproductivity and 15% energy efficiencyimprovement.
The benefits assessment enabled the determinationof hybrid system requirements. The hybrid systemcharging power rating is the key parameter thatdrives the energy efficiency improvement. Allenergy storage battery options that meet the powerrequirement have ample energy storage capacity tomeet energy capacity requirements. The other keyrequirements relate to the mine haul truck operatingenvironment, in particular the high ambienttemperature operating capability. The truckmanufacturer’s specification requires operation in a55ºC ambient temperature, and the climate data forTucson, AZ (Figure 5) indicates that the provingground summer temperature may approach the upperspecification.
Figure 5. Tucson, Arizona, climatic data
System Specifications DevelopmentA detailed survey of available energy storagetechnologies and vendors has been carried out, andthe capabilities in terms of performance (energy andpower densities), environmental capability, technicalmaturity, and battery management requirementshave been evaluated.
As shown in Figure 1, the hybrid mine haul truckESS concept has 2 energy storage banks and anEMS to control power interchange with the truckmain electric bus. The EMS hardware configurationwill be based on available GE TransportationSystems hardware, with projected capability tocharge and discharge the ESS at rates up to 400 kW.More detailed design analysis is required toprecisely evaluate the charging power limit. TheESS will be rated for 500 kW charging power and40 kWh operating energy storage range.
A mix of two energy storage technologies will beused, in order to reduce risk in the hybrid mine haultruck demonstration task. Figure 6 shows the

Heavy Vehicle Systems Optimization Program FY 2003 Annual Report
146
Figure 6. Mine haul truck uphill haul cycle: singlebattery bank terminal power demand
composite grade mission uphill haul duty cycle foreach of the two. Nickel-cadmium technology will bethe baseline element of the mix. The GE team has alot of experience and confidence in this technology,which however has lower energy and power densitythan more advanced energy storage technologies. Ahigher-density advanced energy storage technologywill be utilized together with the baselinetechnology; its demonstration in the program willdevelop required data and experience to enable useof the advanced technology for optional follow-ontasks in this program. The baseline and advancedenergy storage systems will be separately controlled.Together they will supply the total power and energyrequirements of the hybrid mine haul truckdemonstration.
A detailed assessment of available technicalsolutions for energy storage battery thermalmanagement was carried out, to support energystorage technology selection for the demonstration.The ESS will be operated at very high charge anddischarge rates, leading to significant losses. Thepower duty cycle is significantly higher and moreintensive than for on-road hybrid vehicle. For thesereasons, aggressive cooling will be required, but foroperation in the mining environment, the coolingsystem must be simple and rugged. It wasdetermined that passive cooling systems will nothave adequate performance, while active coolingtechniques of refrigeration and forced air coolingmerited further consideration. Three types of high-capacity refrigeration are available — stationarychilled-water systems, transportation air-conditioning units, and transportation refrigerationunits. However their significant size, cost, andengineering effort required to integrate with the ESSdrove the selection to forced air cooling.
All but one of the candidates (“ambient-temperaturebatteries”) have maximum recommended operatingtemperatures between 50–70°C, quite close to the45°C maximum environmental temperaturesexpected in the demonstration (see Figure 5). All theambient temperature technologies have nominaloperating temperatures 25–30°C, and operationabove the nominal temperatures leads to prematuredegradation in battery long-term performance asshown by reduced cycle life. Thus reliance onambient-temperature forced air cooling willinevitably result in degraded longterm cycle life.However sodium-nickel chloride (Na-NiCl2)technology has an operating temperature around300°C. Here ambient-temperature forced-air coolingwill be effective in dissipating battery losses withoutdegradation in cycle life, and therefore the high-temperature battery technology is preferred from thethermal management viewpoint.
Based on performance, density, technology maturity,thermal performance and demonstration riskreduction, a mix of nickel-cadmium and Na-NiCl2technologies was selected for the hybrid mine haultruck demonstration.
Design and Fabrication of Hybrid SystemComponentsPerformance testing of the nickel cadmium energystorage battery system was carried out to establish itsbaseline performance. Figure 7 shows the recordedvoltages during controlled discharge for one batterybox plotted against the discharged ampere-hours.The batteries performed according to manufacturer’sspecification.
Figure 7. NiCd battery box performance test results

Heavy Vehicle Systems Optimization Program FY 2003 Annual Report
147
Detailed design was carried out of the Na-NiCl2system capability to operate in the haul truck highvoltage environment, with respect to maximumterminal voltages, and control connection voltagereferencing. Protection and isolation concepts havebeen addressed. The control interface between theNa-NiCl2 system and the truck system utilizes CAN-bus.
A rigorous testing program was carried out to verifymanufacturer’s specifications for a Na-NiCl2 batterysubsystem and to determine internal parametersrequired for accurate modeling and prediction ofhybrid mine haul truck system efficiency andbenefits, such as open circuit voltage and internalresistance (Figure 8). High voltage compatibilitywas tested and cycling performance testing isongoing. It was verified that there will be adequatecycle life to perform over the whole hybrid minehaul truck demonstration.
Candidate locations for the energy storage systemwere reviewed with Komatsu and specific mountinglocations were decided. The energy storage batteryassemblies will be mounted in several enclosures toprovide structural support, electrical isolation andphysical protection. A battery enclosurespecification has been prepared to define detaileddesign and fabrication requirements.
Hybrid energy management strategies to coordinatethe two energy storage banks and for temperaturecontrol were developed, implemented, tested andverified. The initial implementation was carried outin an interactive dynamic simulation softwareenvironment. Subsequently, battery and powerconversion hardware was brought into the loop, totest out the strategies on physical batteries. Thehardware-in-the-loop operation was under dynamic
Figure 8. Na-NiCl2 battery open circuit voltage
simulation software control, via a rapid controlprototyping software interface module to control thebattery controller gate drives. In particular,capabilities of power sharing between two energystorage banks, and temperature compensation havebeen verified. Figure 9 illustrates control oflaboratory battery temperature using the compen-sation algorithm.
Subscale DemonstrationA subscale demonstration of the energy managementsystem and energy storage system was prepared forthe 100-hp level. The system incorporatesrepresentative modules of nickel-cadmium energystorage and Na-NiCl2 energy storage interfacedthrough a power flow controller to the system dcbus. The dc bus is fed from an engine-alternatoremulator, and also connected to a bidirectionaltraction drive emulator. The system models theelectrical system of a diesel-electric mine truck. Theperformance of the hybrid during the uphill anddownhill composite grade hauls was modeled todemonstrate the performance of the hybrid minehaul truck system. Analysis of the results is inprogress.
ConclusionThe successful first project year has seen theselection of the demonstration hybrid mine trucksystem concept, architecture and energy storagetechnologies. The size of the energy storage wasselected based on a system benefits study. Subscaletesting of representative energy storage modules andenergy management algorithms has been carried out,and a subscale laboratory demonstration of thecombined ESS and EMS hybrid system is inprogress. The team looks forward to an excitingsecond project year, with the completion of thesubscale demonstration, procurement of the full-power hybrid system hardware and full-power statictesting.

Heavy Vehicle Systems Optimization Program FY 2003 Annual Report
148
Figure 9. Battery temperature control

Heavy Vehicle Systems Optimization Program FY 2003 Annual Report
149
XII. Long-Life Oil Filtration System
Real-World Testing of an Advanced Filtration System
Principal Investigator: J.M. CousineauCo-Investigators: K.S. Aerts, A.J. Holmio, and E.M. AlankoEngineered Machined Products, Inc.2701 North 30th Street, Escanaba, MI 49829(906) 789-7497; [email protected]
Technology Development Manager: Sid Diamond(202) 586-8032; [email protected] Program Manager: Jules Routbort(630) 252-5065; [email protected]
Contractor: Argonne National LaboratoryContract No.: 2E-00341
Objective• Test and evaluate the advanced filtration system technology and all of its components in order to obtain enough
design, bench testing, and field evaluation experience to get the technology prepared for commercialization.
• Realize the true benefits of this technology in real-world applications.
Approach• Individual system components will undergo performance and reliability testing.
• Full system development prototypes will be designed and fabricated.
• Prototypes will undergo performance and reliability testing.
• Development prototypes will be installed in test vehicles for real-world field testing.
• The test vehicles’ useful oil life will be measured by pulling oil samples weekly.
• The useful oil life will be compared to a baseline oil life to determine the performance of the filtrationtechnology.
Accomplishments• System components have been performance and reliability tested.
• The development prototypes have been designed and fabricated, as well as performance tested.
• Baseline oil analysis studies on two test vehicles have been completed.
• Two full-system development prototypes have been installed on the two test vehicles and the field testing hasbegun.
Future Direction• Continue to pull oil samples and monitor the system prototype performance on the test vehicles.
• Complete field testing and determine the overall performance of the filtration technology.

Heavy Vehicle Systems Optimization Program FY 2003 Annual Report
150
• Install and field test systems on other applications, such as new engines equipped with EGR technology.
• Develop and put strategy in place to commercialize the technology.
IntroductionCurrent oil filtration technology has been aroundsince the late 1950s. This technology is the full-flow, spin-on, filter. The full-flow filter is typicallylocated after the oil pump on the engine. Therefore,100% of the engine’s oil flow passes through thefilter. The filter is then designed to remove only thelarge particles from the oil because the filter mustnot restrict the oil flow. In turn the filteringeffectiveness is extremely limited. Current full-flowfilters are only efficient in controlling particles20 microns and larger. 95% of the contaminationgenerated within the engine is below 10 microns.This current filtration technology leads to short oilchange intervals. Frequent oil changes areexpensive, time consuming, and generate atremendous amount of waste from the disposal of oiland oil filters. Fleet owners and operators arepushing the limits on extending these oil changeintervals to reduce operating costs. Oil levels and oiladditives can get dangerously low causing excessiveengine wear.
The industry’s solution to the inadequate oilfiltration thus far has been the advent of bypassfilters. Bypass filters are being installed on enginesin parallel to the full-full filter. These filterscontinuously divert a side stream of 10–15% of theengine oil flow, filter it more efficiently through theuse of finer filtration, and then return it back to theoil pan. Tests have proven that the addition ofbypass filters will extend the useful oil life andlengthen full-flow filter life. However, bypass filtersdo have limitations. Bypass filters typically haveshorter change intervals than the full-flow filters dueto their smaller size and finer filtering capability.Even though the oil change interval is beingextended, filters are still being changed frequentlyleading to little if any reduction in filter change anddisposal costs as well as no reduction in waste. Withmore soot being deposited in the oil due to EGR, thisproblem will be even more evident. Anotherproblem associated with by-pass filters, is theintroduction of oil pressure parasitic losses. Becausebypass filters divert approximately 10% of anengines total oil stream, an oil pressure parasitic loss
can be introduced. Diversion of this amount of oilcan lead to starvation of certain engine componentsof necessary lubrication.
Engineered Machined Products, Inc. (EMP) has asubstantial amount of experience in oil management.EMP has spent the last several years developing anadvanced filtration system (AFS) for diesel engineapplications. The intent of the system is to extend oillife as well as the full-flow filter life to100,000 miles allowing for a reduction inmaintenance intervals to one per year. This willdramatically reduce the consumption of oil, as wellas the generation of waste from the disposal of oiland oil filters.
Other benefits include reduced engine wear,increased fuel economy, and finally reducedemissions. These benefits of applying finer filtrationto engine applications have been well documentedby the Society of Automotive Engineers. It has beenfound that improving filtration from 40 microns to15 microns can yield as much as 70% reduction inengine wear [1]. Studies have shown reductions infuel consumption from 3–5% by controlling oilquality with finer filtration [2,3]. It has also beenfound that diesel exhaust emissions correlate to theamount of suspended solids in the engine oil [4].Studies have shown reductions in emissions from17–30% using finer filtration to clean the oil [5,6].
The Advanced Filtration System (AFS) is anauxiliary advanced engine filtration systemconsisting of an electric oil transfer pump,replaceable/recyclable filtering cartridge, a self-indexing system to continuously advance in cleanfiltering medium, and a housing to enclose it all.This system operates independently of an engine’smain lubrication system and applies a continuousfiltering method to the engine oil. The reel-to-reelconfiguration enables the filtration device toautomatically replace used or dirty filtering mediumin a controlled and continuous fashion (Figure 1).The AFS provides greatly expanded oil filtering andcontaminant retention over a set service interval. As

Heavy Vehicle Systems Optimization Program FY 2003 Annual Report
151
Figure 1. AFS cross-section showing the“reel-to-reel” filtering method
a result, the filtering operation can remove the largeamount of soot introduced to the lube oil by exhaustgas re-circulation (EGR), a pollution-reductiontechnique used in many heavy-duty truck engines.
The reel-to-reel principle is based upon themonitoring of the pressure differential between theupstream side and the downstream side of thefiltering medium. When a high pressure differentialexists due to the build-up of particles on the filteringmedium, the system sends signals to the transferpump to cease oil flow to the filter, and to the self-indexing system to advance clean filtering mediumto the oil flow from a supply reel. Simultaneously,the self-indexing system ejects the dirty filteringmedium from the oil flow to a take-up reel. Thetransfer pump then initiates oil flow back throughthe filtering device. The process repeats until adesirable pressure differential is achieved. When therecommended service interval is reached, thefiltering cartridge can be removed and replaced witha new cartridge.
There are two key features that distinguish the AFSfrom existing technology. First, it uses an electrictransfer pump to take fluid from a reservoir andtransfer it to the filtration device. This allows thefilter system to function independently of the systemit is protecting (Figure 2). In addition, the transferpump allows for automated draining and filling ofoil during servicing and provides the capability topre- and post-lube the engine. Second, the system’sunique “reel-to-reel” filtering method automaticallyexchanges used or plugged filtering medium for newor clean filtering medium as needed. This filteringmethod allows for an unlimited supply of filteringmedium as well as more efficient use of the filteringmedium.
Figure 2. System diagram showing theindependent arrangement in regard to theengine it is protecting
Results and DiscussionAs stated, the objective of this phase II program wasto determine the true real world benefits throughfield testing. Several tasks had to be completedbefore field testing of the AFS could begin. First, thedevelopment prototypes had to be designed andconstructed. The design process consisted ofdesigning an oil pump, a filter cartridge, a housing toenclose it all, and a control unit (Figures 3–6).
Figure 3. The electric oil transfer pumpconstructed out of aluminum 6061-T6 billet
Figure 4. The filter unit housingconstructed out of aluminum 356-T6 sandcastings

Heavy Vehicle Systems Optimization Program FY 2003 Annual Report
152
Figure 5. The filter cartridge constructed outof fiberglass compression molding and nylon6/6 inner components
Figure 6. The electronic controlunit to control the system, providediagnostics and data acquisition
The next step was to put the system together in thelab for bench testing. Performance and reliabilitywas to be tested. Also, the system algorithm neededto be debugged. Two issues arose during the benchtesting of the system prototype. The first issue waswith one of the filter unit components. Thiscomponent was the inflatable seal device. Thefunction of this sealing device is to ensure a positiveseal between the upstream and downstream cavities.A positive seal yields very efficient filtration. Also,the seal prevents the filter housing from filling withoil. This ensures that the engines lube system retainsits original capacity. When the system is firstpowered up the seal must be filled with oil from thetransfer pump. This oil flow and pressure cause theseal to inflate axially to seal off the upstream anddownstream cavities. When it is determined that thefilter window is plugged, the oil pressure inside theseal is released allowing for the seal to deflate andthus the filtering media to advance through theopening. During the bench testing several sealfailures were encountered. The seal would fatigueafter about 200 cycles of inflation/deflation causinga tear in the seal. The solution was to fabricreinforce the seal material to increase its fatiguestrength.
The second issue which was encountered during thebench testing of the system prototype was with thefiltering medium. Under pressure the filteringmedium would produce tears. It turns out that thetears were due to the media supports deflecting ordoming into the downstream cavity when underpressure. This in turn caused the filtering medium tobe stretched and eventually torn. The solution to thisissue was a redesign of the media support. Theoriginal media support was simply a wire mesh. Itsreplacement was a waffle grid pattern extruded to athickness to prevent any deflection due to the oilpressure.
While the system bench testing and debugging wasgoing on, the baseline testing of the test vehicles wasalso happening. The test vehicles chosen were twoclass 8 trucks. The Kenworth trucks are equippedwith 1998 Detroit Diesel Series 60 engines. Bothtrucks were lent to EMP from a local trucking fleet,Niagara Logistics, who deliver EMP parts aroundthe Midwest. Both trucks have consistent routes andaverage about 2,500 miles a week. Pressure portsampling valves were installed on both engines. Forthe baseline, weekly oil samples were taken for aperiod of about six months. The samples were sentto an outside analysis lab. Many characteristics ofthe oil were measured. The characteristics measuredare as follows:
• Viscosity• Water content• Glycol content• Fuel content• Soot content• Total base number• Wear metals• Oxidation
The data received from the analysis lab was recordedin a spreadsheet. This allowed for trending of thedata. Typically, the oil characterictics either go up orthey go down with increasing oil age. The followingbaseline data show these trends (Figures 7 and 8).Data were collected for a period of six months orapproximately 60,000 miles. The remaining datahave been projected out to one year.

Heavy Vehicle Systems Optimization Program FY 2003 Annual Report
153
Iron Content vs. Oil Age
0
10
20
30
40
50
0 20000 40000 60000 80000 100000 120000Total Baseline Mileage
Iron
in th
e oi
l (pp
m)
Figure 7. Trending of the iron content in one of the testvehicles. As the oil ages the iron content increases. Thesharp drop in iron content represents an oil change.
TBN Depletion vs. Oil Age
4.0
5.0
6.0
7.0
8.0
9.0
10.0
11.0
0 20000 40000 60000 80000 100000 120000Total Baseline Mileage
TBN
mgK
OH
/g
Figure 8. Trending of the Total Base Number (TBN).This number represents the ability of the oil to neutralizeacids. As the oil ages the TBN decreases.
The results expected once the AFS is installedclearly need to reflect an extension of the oil age.This means when looking at the analysis trends thatthere are no saw tooth patterns. For an upwardtrending characteristic, the data with the AFS shouldreflect a long gradual increase over the 120,000miles never exceeding the baseline maximum datapoints (Figure 9). For a downward trendingcharacteristic, the data with the AFS should reflect along gradual decrease over the 120,000 miles neverexceeding the baseline minimum data points(Figure 10). Also, it should be noted that at somepoint the AFS should provide a stable level ofcontamination.
Once the vehicle baseline testing and the prototypeperformance testing were completed, it was time toinstall the prototype units into their respectivevehicles. The installations took several days each ascustom brackets had to be fabricated to mount theunits to the trucks. Also, electrical and fluid
TBN Depletion vs. Oil Age
4.0
5.0
6.0
7.0
8.0
9.0
10.0
11.0
0 20000 40000 60000 80000 100000 120000Total Baseline Mileage
TBN
mgK
OH
/g
Figure 9. Expected iron content (dashed line) with AFSinstalled. Trend showing long gradual increase andeventually reaching a stable limit.
Iron Content vs. Oil Age
0
10
20
30
40
50
0 20000 40000 60000 80000 100000 120000Total Baseline Mileage
Iron
in th
e oi
l (pp
m)
Figure 10. Expected TBN (dashed line) with AFSinstalled. Trend showing long gradual decrease. At somepoint it will reach a minimum limit at which the oil willneed to be changed or additives replenished.
connections had to be made. The filter units wereinstalled under the hood on the cold side of theengine. The transfer pumps were installed along sidethe oil pan. This allowed for easy priming of thepump.
Once the AFS units were installed on the testvehicles (Figure 11) it took several weeks to debugthe systems. There were electrical and softwarealgorithm changes that needed to take place in orderfor the system to function properly. The system isinitialized by the ignition of the vehicle. Once thesystem is powered up it waits until the oil reachesthe desired temperature of 150°F. There is athermistor placed in the oil pan to monitor the oiltemperature. When the thermistor reads the value of150, the pump is activated sending oil flow to theunit. The system then goes through a warm-upperiod of 4 minutes and oil is circulated through the

Heavy Vehicle Systems Optimization Program FY 2003 Annual Report
154
Figure 11. Installation of AFS on test vehicle.Kenworth truck equipped w/1998 DDC S60 engine.
unit to continue to warm the oil. After the warm-upcycle the seal is inflated and filtration begins. Whenthe ignition is turned off the AFS will continue torun until 4 minutes later when it times out and thethen goes into sleep mode until the ignition is on.The cycle then starts again.
To date, there has been only one issue experiencedduring the field testing. Again, an issue related to theinflatable seal (Figures 12 and 13). Over time as thefilter medium would collect contaminants thepressure internal to the upstream cavity wouldincrease, as expected. This pressure however wasgreat enough to force the seal out of its retaininggroove. When the pre-determined pressuredifferential across the filter medium was achieved,the medium could not be advanced because the sealwas pinching the medium up against its supportcausing a binding issue. To resolve this issue, theinflatable seal was redesigned to incorporate a bettermeans of retaining the seal.
Figure 12. Shows the original seal designand its retaining feature. Internal pressurewould force the seal out of its groove.
Figure 13. Shows the new seal designwith its improved retaining feature
As can be seen from the figure, the new seal designallows for the seal to be physically clamped into aretainer ring. This greatly enhances it retention. Thisnew seal design also allows for more improvementsin functionality. Its mode for inflation is now moreof a shape changing phenomenon versus a stretchingof the material phenomenon. This will increase itsfatigue strength even more. Also, there is now lessmaterial which will reduce the component cost of theseal. Finally, a valve stem is no longer needed to fillthe seal with oil. The entire bottom surface of theseal is open to allow oil to enter. This will quickenthe inflation and deflation times of the seal. Becauseof this component switch the field tests had to bestarted over.
ConclusionsThe field testing is now successfully underway.There have been about three samples collected oneach of the test vehicles. We should have a goodidea on how the system is performing by the end ofthe year (2003). The process has also been started toinstall test units on other applications as well. Abaseline test has begun for an off-road end loader.Many more applications will follow includingengines equipped with EGR.
While the field testing is occurring, a strategy tobring this system to market is also currently beingput into place. This work done in phase II hasallowed us to take the next step with this technology:commercialization.
This technology will make a big impact in thetrucking industry as well as other industries. Withthe AFS, trucks that typically average 5–6maintenance intervals per year related to oil andfilter changes (at an average cost of $180 per
Filter Unit
Controller
Pump
Sealretaining

Heavy Vehicle Systems Optimization Program FY 2003 Annual Report
155
service) will now require only 1–2 oil changes peryear, resulting in an annual average per-trucksavings of $540–900. Across the entire U.S. heavy-duty truck fleet, the savings could add up to morethan 30 million gallons of lube oil per year.
References1. David R. Staley, “Correlating Lube Oil
Filtration Efficiencies with Engine Wear,” SAE881825 (1988).
2. Gordon E. Andrews, Jie Xu, M.H. Jones, JamesHall, A.A. Rahman, “The Influence of an On-line Oil Recycler on Oil Quality from a Bus inService Using Synthetic Oil,” SAE 2001-01-1969 (2001).
3. Gordon E. Andrews, Hu Li, James Hall,A.A. Rahman, S. Saykali, M.H. Jones,“Improvements in Lubricating Oil Quality by anOn-line Oil Recycler for a Refuse Truck Usingin Service Testing,” SAE 2001-01-0669 (2001).
4. Vincent D. Pellegrin, Alvin Lowi Jr,“Correlation of Smoke Levels with Engine-Lubricating-Oil Solids in Metropolitan TransitBuses,” SAE 872251 (1987).
5. Gordon E. Andrews, Jie Xu, James Hall,A.A. Raham, P. Mawson, “The Influence of anOn-line Oil Recycler on Emissions From a LowEmission Di Diesel Engine as a Function of OilAge,” SAE 2001-01-3617 (2001).
6. Gordon E. Andrews, Hu Li, James Hall,A.A. Rahman, S. Saykali, “The Influence of anOil Recycler on Emissions with Oil Age for aRefuse Truck Using in Service Testing,” SAE2001-01-0623 (2001).