Embed Size (px)
Citation preview

1
Heavy Metal Migration from the Savannah River Site Frank Carl, PhD
Executive Director Savannah Riverkeeper, Inc.
Supported by a grant from the Citizens’ Monitoring and Technical Assessment Fund
Executive Summary: In addition to the radioactive waste for which the Savannah River Site is famous, there have been tons of potentially toxic heavy metals and thousands of gallons of organic solvents discarded on the Site, much of it in unlined ditches or in constructed depressions called seepage basins. With little containment many of these toxins have reached the groundwater and some have reached Four Mile Branch. The DOE is attempting to monitor the migration of the toxins and to slow their contamination of both the groundwater and the surface water on the Site. Since the heavy metal contamination on the Site has not received as much attention as the radioactive contamination, the Savannah Riverkeeper has examined the migration of these metals into the mobile biosphere by analyzing heavy metal concentrations in several animal species. Comparisons have been made between animals that have been exposed to waters on the Site with animals from similar habitats but not exposed to the waters from the Site. Results of these studies indicate that migration of the heavy metals from the Site in animal species is not currently a serious problem. However, the quantity of uncontained metals discarded on the Site and their presence in the groundwater is cause for concern. The Savannah Riverkeeper recommends that monitoring of the waters and the local biosphere be continued indefinitely or until such time as the Site is cleaned up and the metals disposed of properly. Background: The Savannah River Site is a 310 square mile nuclear weapons facility located on South Carolina side of the Savannah River about 15 miles southeast of Augusta, Georgia and 10 miles south of Aiken, South Carolina (Figure 1). South Carolina Route 125 wends a 19-mile passage through the Site crossing most of the major streams on the Site downstream of the primary points of contamination on the Site (Figure 2). Since construction began at the Savannah River Site in 1951, there have been many unusual and dangerous elements and chemicals used on the Site. In the early rush to produce nuclear weapons little thought was given to disposal of the wastes generated from their production. Unwanted items were dumped haphazardly in an unlined series of trenches between F Area and H Area on the Site. Consequently, no one is quite sure what wastes might have been disposed of in this Old Burial Ground. Its use was abandoned in 1974, but the wastes remain. In application for their RCRA permit in 2001, Site officials have estimated that there were 50 tons of lead, 12 tons of mercury, 3500 lbs of cadmium, and several tons of aromatic organic solvents (carcinogens) disposed of in the Old Burial Ground.

2
Another historical practice that has led to significant environmental contamination at the Site is the use of seepage basins. Seepage basins (Fig. 3) have been used in association with the separations facilities in F Area and H Area, metallurgical research in M Area, and energy production in D Area. Energy production on this nuclear weapons facility, surprisingly, comes from coal. The basic concept of a seepage basin is that contaminated solutions, like byproducts

3
from the separations process, or solutions from cleaning contaminated equipment, or coal ash dumped in a basin to be dispersed by rainwater, are allowed to seep into the ground hoping that
the soil will remove the contaminants before they reach the ground water. An estimate of the toxic substances that have been released to the H Area seepage basin alone include nearly two
4
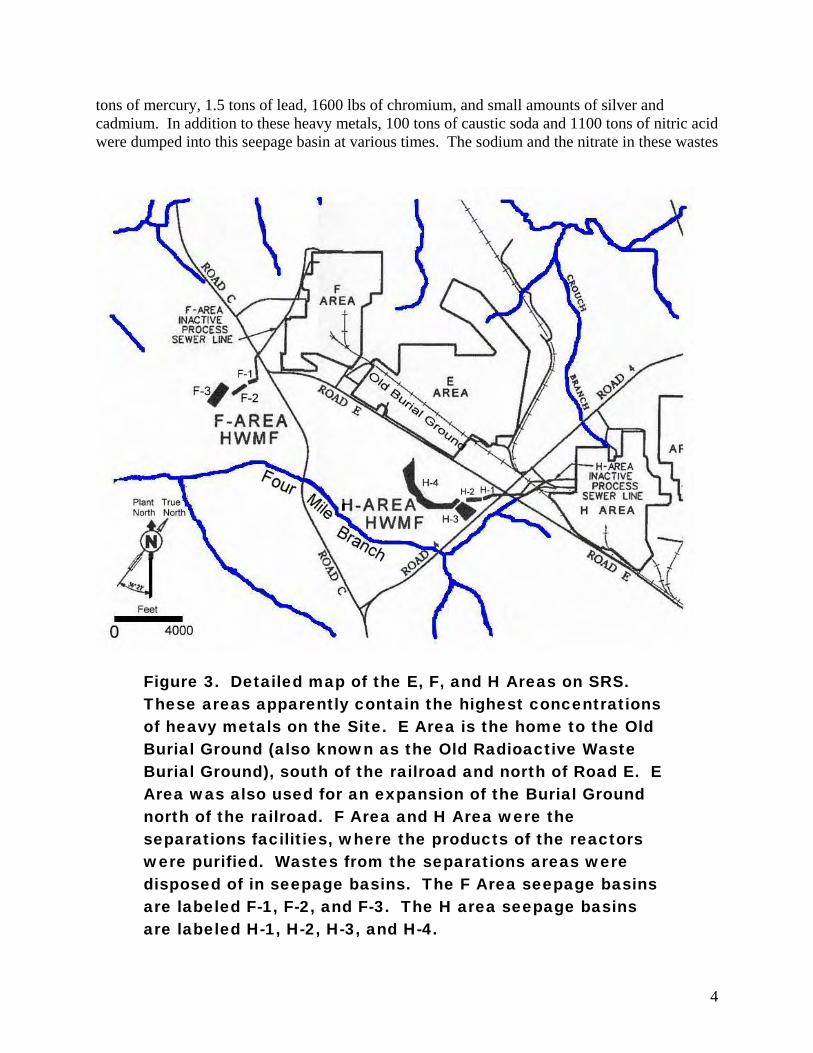
tons of mercury, 1.5 tons of lead, 1600 lbs of chromium, and small amounts of silver and cadmium. In addition to these heavy metals, 100 tons of caustic soda and 1100 tons of nitric acid were dumped into this seepage basin at various times. The sodium and the nitrate in these wastes
Figure 3. Detailed map of the E, F, and H Areas on SRS. These areas apparently contain the highest concentrations of heavy metals on the Site. E Area is the home to the Old Burial Ground (also known as the Old Radioactive Waste Burial Ground), south of the railroad and north of Road E. E Area was also used for an expansion of the Burial Ground north of the railroad. F Area and H Area were the separations facilities, where the products of the reactors were purified. Wastes from the separations areas were disposed of in seepage basins. The F Area seepage basins are labeled F-1, F-2, and F-3. The H area seepage basins are labeled H-1, H-2, H-3, and H-4.

5
are much more mobile than heavy metals, but the wide ranges of pH introduced by strong acids and strong bases could contribute to increased mobility of the heavy metals as well. During the active phases of the reactors in F Area and H Area, liquid wastes in the form of organic solvents or aqueous solutions were piped directly via a sewer line to the seepage basin in the respective areas (Fig. 3). Figure 4 shows a diagram of the sewer line running from the F Area reactor building to the seepage basins on the other side of Road C. The sewer line from H Area carried similar liquid wastes under Road E and Road 4 to the seepage basins in H-1 through H-4 (Fig. 3). These liquids generally were cleaning solvents or solutions and contained
Figure 4. F-Area Seepage Basin and Sewer Line. Using the F Seepage Basin as an example, the liquid wastes (aqueous solutions and organic solvents) from the separations process or cleaning were allowed to flow down the sewer line to the basins, F-1, F-2, and F-3, where the liquids were allowed to soak into the ground or evaporate. This process was widely used in the early days of the SRS facility leaving tons of contaminants in the soil.
6
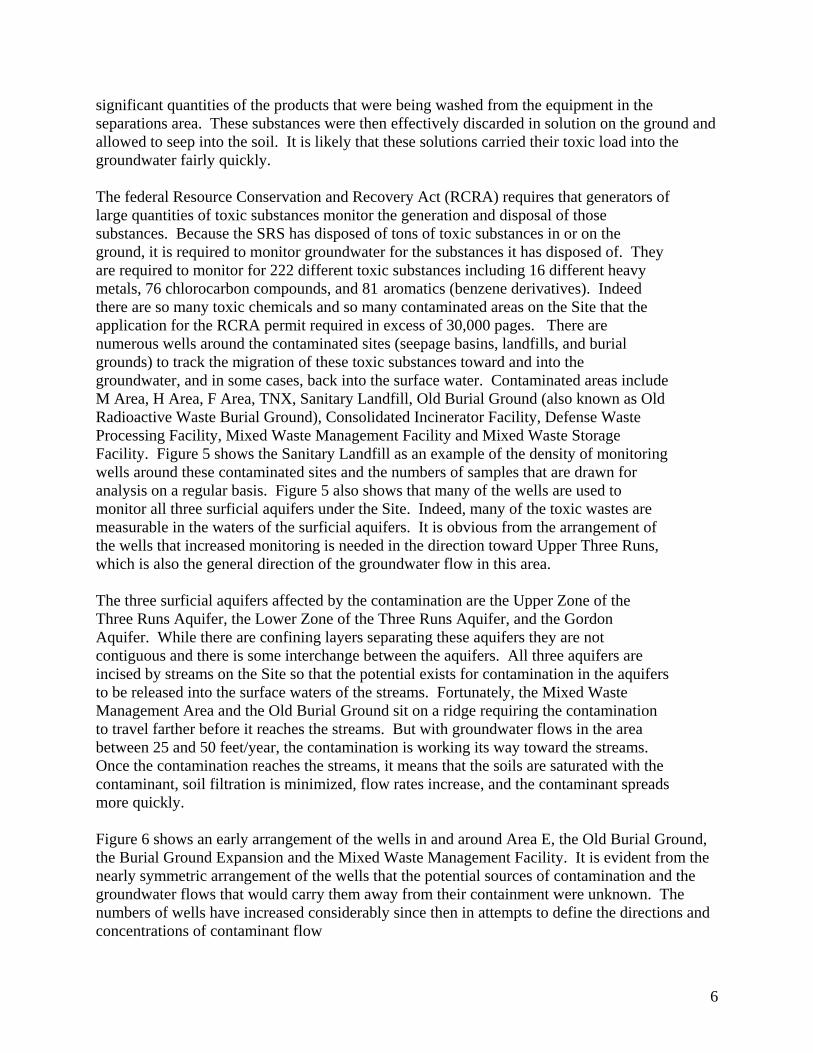
significant quantities of the products that were being washed from the equipment in the separations area. These substances were then effectively discarded in solution on the ground and allowed to seep into the soil. It is likely that these solutions carried their toxic load into the groundwater fairly quickly. The federal Resource Conservation and Recovery Act (RCRA) requires that generators of large quantities of toxic substances monitor the generation and disposal of those substances. Because the SRS has disposed of tons of toxic substances in or on the ground, it is required to monitor groundwater for the substances it has disposed of. They are required to monitor for 222 different toxic substances including 16 different heavy metals, 76 chlorocarbon compounds, and 81 aromatics (benzene derivatives). Indeed there are so many toxic chemicals and so many contaminated areas on the Site that the application for the RCRA permit required in excess of 30,000 pages. There are numerous wells around the contaminated sites (seepage basins, landfills, and burial grounds) to track the migration of these toxic substances toward and into the groundwater, and in some cases, back into the surface water. Contaminated areas include M Area, H Area, F Area, TNX, Sanitary Landfill, Old Burial Ground (also known as Old Radioactive Waste Burial Ground), Consolidated Incinerator Facility, Defense Waste Processing Facility, Mixed Waste Management Facility and Mixed Waste Storage Facility. Figure 5 shows the Sanitary Landfill as an example of the density of monitoring wells around these contaminated sites and the numbers of samples that are drawn for analysis on a regular basis. Figure 5 also shows that many of the wells are used to monitor all three surficial aquifers under the Site. Indeed, many of the toxic wastes are measurable in the waters of the surficial aquifers. It is obvious from the arrangement of the wells that increased monitoring is needed in the direction toward Upper Three Runs, which is also the general direction of the groundwater flow in this area. The three surficial aquifers affected by the contamination are the Upper Zone of the Three Runs Aquifer, the Lower Zone of the Three Runs Aquifer, and the Gordon Aquifer. While there are confining layers separating these aquifers they are not contiguous and there is some interchange between the aquifers. All three aquifers are incised by streams on the Site so that the potential exists for contamination in the aquifers to be released into the surface waters of the streams. Fortunately, the Mixed Waste Management Area and the Old Burial Ground sit on a ridge requiring the contamination to travel farther before it reaches the streams. But with groundwater flows in the area between 25 and 50 feet/year, the contamination is working its way toward the streams. Once the contamination reaches the streams, it means that the soils are saturated with the contaminant, soil filtration is minimized, flow rates increase, and the contaminant spreads more quickly. Figure 6 shows an early arrangement of the wells in and around Area E, the Old Burial Ground, the Burial Ground Expansion and the Mixed Waste Management Facility. It is evident from the nearly symmetric arrangement of the wells that the potential sources of contamination and the groundwater flows that would carry them away from their containment were unknown. The numbers of wells have increased considerably since then in attempts to define the directions and concentrations of contaminant flow
7
Figure 5. Groundwater monitoring wells at the Sanitary Landfill on the Savannah River Site. The density of the wells is relatively high in the small area of the Sanitary Landfill, an area where groundwater contamination has been verified, but not to the extent that it is seen in the E, F and H Areas, which cover a much larger area than the Sanitary Landfill (see Fig. 2). Monitoring wells have also been drilled in other areas of SRS to monitor groundwater. Thus hundreds of monitoring wells have been drilled on the Site. Note that if two or three labels are associated with a well, then that well is used to monitor two or three surficial aquifers.

8
Figure 6. An early diagram of the monitoring wells of Area E, where most of the heavy metal waste on the Site is buried. The numbers of monitoring wells have expanded considerably since this early arrangement.
In the diagram (Figure 7) estimating the migration of the plumes of tritium and trichloroethylene away from the Burial Grounds Complex by 2000, there is a definite pattern of migration. Unfortunately, plumes of contaminants from the F and H Area seepage basins and the Old Burial Ground have reached Four Mile Creek on the Site and plumes from the Mixed Waste Management Facility are headed toward Upper Three Runs (Figure 7). Because the tritium in the waste gets incorporated into the water molecules it will be the first detectable contaminant in the plume front, which is generally associated with the uppermost aquifer, in this case the Upper

9
Figure 7. An estimate (from 2000) of the plumes of tritium and trichloroethylene emanating from the Burial Ground Complex in Area E. The Southwest Plume has reached Four Mile Branch (2004). The engineers at SRS have designed a containment system to block the flow of contaminated groundwater from the burial ground to the creek, creating a pond in the area near the tip of the Southwest Plume. The Northeast Plume is migrating toward a tributary of Upper Three Runs. Based on the distance and the velocity of groundwater flow, it is estimated that the Northeast Plume will reach surface waters in the next couple of decades.

10
Zone of the Upper Three Runs Aquifer. Therefore, the detection of the plume front is generally fairly easy, simple detection of a rise in tritium concentrations in the most accessible aquifer. However, monitoring the migration of contaminants becomes pretty complicated after that. The SRS has constructed an underground levee to slow the plumes headed toward Four Mile Branch. Currently the levee backs up a pond behind it. SRS sprays the contents of that pond back into the contaminated area hoping to reduce the contamination by evaporation and by assimilation into the vegetation. This will work to reduce contaminant concentrations in the ground water as long as the contaminants are volatile and taken up readily by the plants. Tritium and trichloroethylene, two of the front running contaminants, can be reduced in this way, even though evaporation of a chlorocarbon is not good for the ozone layer. Heavy metals unfortunately are neither volatile nor readily taken up by plants, although specific plants can be used to concentrate some heavy metals. But to decrease the heavy metal contamination in the area the plants would have to be removed periodically or the metals would simply be recycled. In addition, the complexity of the contamination (heavy metals, degreasers, caustic soda, nitric acid, hydrocarbons, and organic solvents) and the diversity of soils under the Site complicate any analysis of the migration of specific toxins. Nevertheless, the SRS has undertaken a modeling approach to predict the migration of different chemical species in the various aquifers under the Site (RCRA application, 2001). The ultimate problem, of course, is the introduction of these toxins into the organisms to which they are toxic. Contamination of animal species would also facilitate the migration of the toxic substances off the Site. To examine the extent of migration of toxic substances across the Site borders a study was designed to examine animal tissues and animal hair for heavy metals. Of the many toxic chemicals originating on the Site in relatively large quantities, the heavy metals are the easiest to detect in animals. Heavy metals are incorporated into the animal’s hair from its blood as the hair grows. Hair concentrations are a composite of the exposure of the animal to that metal over the time the hair is growing. Tissue concentrations, on the other hand, are a measure of more acute exposure depending on the turnover of the metal in the tissue and the body as a whole. Methods: The SRS holds deer hunts on the Site periodically to control the deer population. Because there are no natural predators of deer left with the exception of the human, it has become necessary to allow the public access under strictly controlled conditions to harvest significant numbers of deer. When a hunter shoots a deer, he tags it and then the SRS takes the deer to test it for radioactive cesium. If an unacceptable level of radioactive cesium is found, the deer is destroyed, but if the level of radioactive cesium is acceptable, then the deer is turned over to the hunter at the entrance to SRS. At the deer distribution random hunters were asked to provide a sample of the hair of the deer that had been harvested. With permission hair was clipped from the back of the neck of each deer. Each hunter was asked where on the Site his deer was shot and the sex and approximate weight of the deer. The information was recorded. It should be

11
noted here that the SRS administration and its security contractor were not particularly cooperative with this activity. Control deer were harvested in similar terrain at least 10 miles removed from the SRS. Populations were matched for sex and weight and time of kill (within two weeks) and hair samples were collected from the back of the neck.
Photograph Credit Kevin Lammi
The hair samples from SRS and control deer were packaged and sent to Trace Elements, Inc., Addison, TX, where the samples were washed thoroughly, digested with acid, and analyzed for concentrations of calcium, magnesium, sodium, potassium, copper, zinc, phosphorus, iron, manganese, chromium, selenium, boron, cobalt, molybdenum, sulfur, uranium, arsenic, beryllium, mercury, cadmium, lead, aluminum, germanium, barium, lithium, nickel, platinum, vanadium, strontium, tin, tungsten, and zirconium. These metals were measured in a Health and Human Services certified clinical laboratory by inductively-coupled plasma mass spectrometry (ICPMS). A request for permission to retrieve possum and raccoon road kill from the Site was denied (note no trespassing sign). Instead, possum and raccoon were enticed off the Site along the river and trapped on the pilings lining the river in many places (see picture below). The trapped animals

12
were subdued and hair was removed from the nape of the neck for elemental analysis. Neither sex nor weight was recorded. Analyses were performed by Trace Elements, Inc as previously described.
Photograph Credit Stephen Berend Photograph Credit Stephen Berend Catfish were caught by standard means. The SRS population was harvested near the mouths of the streams flowing from SRS into the Savannah River. The control population was harvested near the mouths of streams draining basins similar in terrain to the SRS but wholly outside the boundaries of the SRS and upstream of the Site. The populations of bass were harvested in the
Channel Catfish Largemouth Bass

13
same way. Weights of all fish were recorded. Since at least one heavy metal is known to concentrate in larger fish, populations were compared both in total and after correcting for weight differences. Heavy metals were measured in muscle tissue of the fish by ICPMS in the Savannah River Ecology Laboratory, a certified laboratory for metal analysis in tissue. Analyses were run for beryllium, vanadium, chromium, manganese, cobalt, nickel, copper, zinc, arsenic, selenium, rubidium, strontium, molybdenum, cadmium, antimony, cesium, barium, mercury, thallium, lead, and uranium. Statistics: Metal concentrations were analyzed statistically using the two-tailed t-test. Distribution was assumed to be parametric. Values less than three standard deviations (of blanks) above background were considered undetectable. For statistical analysis values below detectability were excluded and the number of observations was decreased accordingly. If 50% or more of the observations were excluded in this manner the metal was considered to be not reliably detectable in the fish tissue matrix. In no case did the difference between the number of observations used for on-Site metal concentrations differ by more than two from the number of off-Site observations. In all cases that reached statistical significance, whether at the 95% or the 90% confidence level, the data sets were complete with at least 16 observations in each sample pool. Results: Many of the elements for which the ICPMS was set to detect were not present in detectable concentrations in deer hair. These elements include antimony, uranium, beryllium, mercury, cadmium, lead, bismuth, rubidium, lithium, platinum, tin, titanium, tungsten, and zirconium. Table 1 shows the concentrations of other elements in the hair of deer harvested from the SRS versus deer harvested in similar terrain off-Site. Note that at 95% confidence (p<0.05) the only significant differences are strontium (higher in deer on-Site) and molybdenum (higher in deer off-Site). But at a confidence of 90% (p<0.1) nickel, boron and selenium are added to the differences with nickel being higher off-Site and boron and selenium being higher on-Site. The elements that could not be detected in measurable quantities in sufficient numbers of raccoons to do statistics were lithium, lead, silicon, beryllium, silver, tin, zirconium, platinum and tungsten. Table 2 shows the concentrations of the other metals in the hair of raccoons trapped on the Savannah River near the mouths of the streams draining the Savannah River Site compared to raccoons trapped on the river upstream from the Site. Boron and vanadium were statistically different at 95% confidence between the SRS raccoons and the upstream raccoons with boron showing higher levels in the SRS raccoons and vanadium exhibiting higher levels in the raccoons trapped upstream. At 90% confidence rubidium, mercury, and arsenic also showed significant differences with rubidium and arsenic having higher concentrations in the hair of raccoons from the Site and mercury having a higher concentration in raccoons from upstream.
14
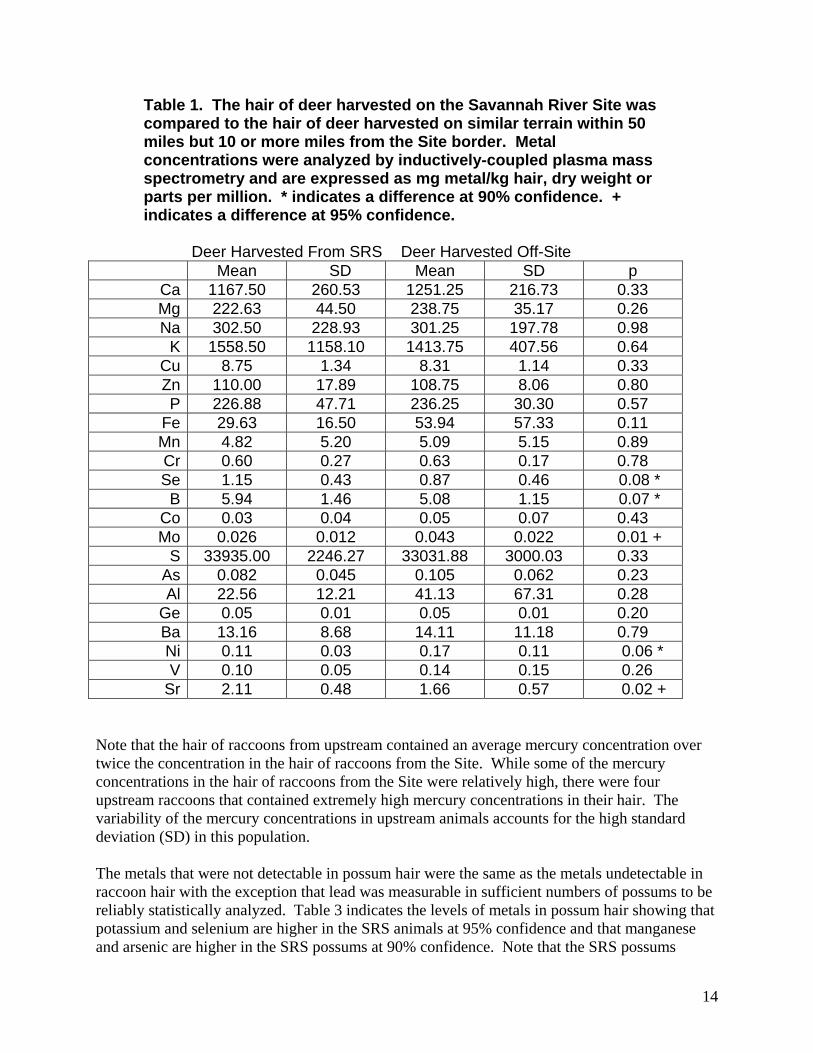
Table 1. The hair of deer harvested on the Savannah River Site was compared to the hair of deer harvested on similar terrain within 50 miles but 10 or more miles from the Site border. Metal concentrations were analyzed by inductively-coupled plasma mass spectrometry and are expressed as mg metal/kg hair, dry weight or parts per million. * indicates a difference at 90% confidence. + indicates a difference at 95% confidence.
Deer Harvested From SRS Deer Harvested Off-Site Mean SD Mean SD p
Ca 1167.50 260.53 1251.25 216.73 0.33 Mg 222.63 44.50 238.75 35.17 0.26 Na 302.50 228.93 301.25 197.78 0.98
K 1558.50 1158.10 1413.75 407.56 0.64 Cu 8.75 1.34 8.31 1.14 0.33 Zn 110.00 17.89 108.75 8.06 0.80 P 226.88 47.71 236.25 30.30 0.57
Fe 29.63 16.50 53.94 57.33 0.11 Mn 4.82 5.20 5.09 5.15 0.89 Cr 0.60 0.27 0.63 0.17 0.78 Se 1.15 0.43 0.87 0.46 0.08 * B 5.94 1.46 5.08 1.15 0.07 *
Co 0.03 0.04 0.05 0.07 0.43 Mo 0.026 0.012 0.043 0.022 0.01 +
S 33935.00 2246.27 33031.88 3000.03 0.33 As 0.082 0.045 0.105 0.062 0.23 Al 22.56 12.21 41.13 67.31 0.28
Ge 0.05 0.01 0.05 0.01 0.20 Ba 13.16 8.68 14.11 11.18 0.79 Ni 0.11 0.03 0.17 0.11 0.06 * V 0.10 0.05 0.14 0.15 0.26
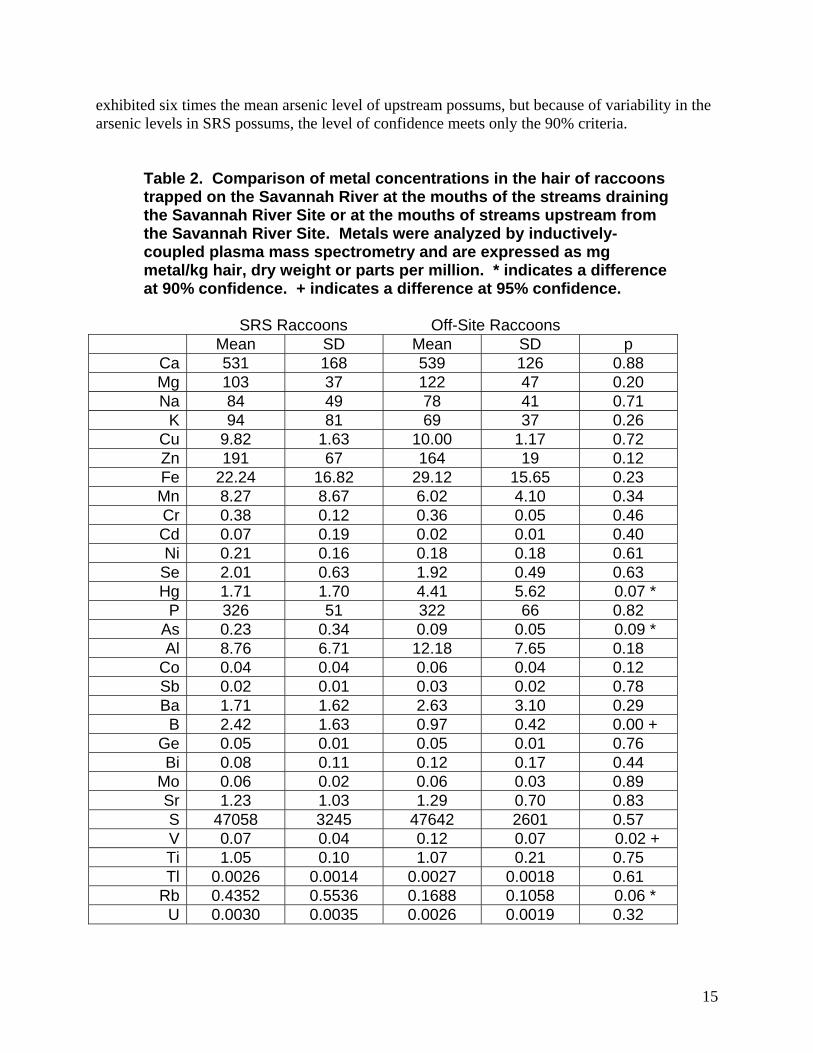
Sr 2.11 0.48 1.66 0.57 0.02 + Note that the hair of raccoons from upstream contained an average mercury concentration over twice the concentration in the hair of raccoons from the Site. While some of the mercury concentrations in the hair of raccoons from the Site were relatively high, there were four upstream raccoons that contained extremely high mercury concentrations in their hair. The variability of the mercury concentrations in upstream animals accounts for the high standard deviation (SD) in this population. The metals that were not detectable in possum hair were the same as the metals undetectable in raccoon hair with the exception that lead was measurable in sufficient numbers of possums to be reliably statistically analyzed. Table 3 indicates the levels of metals in possum hair showing that potassium and selenium are higher in the SRS animals at 95% confidence and that manganese and arsenic are higher in the SRS possums at 90% confidence. Note that the SRS possums
15
exhibited six times the mean arsenic level of upstream possums, but because of variability in the arsenic levels in SRS possums, the level of confidence meets only the 90% criteria.
Table 2. Comparison of metal concentrations in the hair of raccoons trapped on the Savannah River at the mouths of the streams draining the Savannah River Site or at the mouths of streams upstream from the Savannah River Site. Metals were analyzed by inductively-coupled plasma mass spectrometry and are expressed as mg metal/kg hair, dry weight or parts per million. * indicates a difference at 90% confidence. + indicates a difference at 95% confidence.
SRS Raccoons Off-Site Raccoons
Mean SD Mean SD p Ca 531 168 539 126 0.88 Mg 103 37 122 47 0.20 Na 84 49 78 41 0.71
K 94 81 69 37 0.26 Cu 9.82 1.63 10.00 1.17 0.72 Zn 191 67 164 19 0.12 Fe 22.24 16.82 29.12 15.65 0.23 Mn 8.27 8.67 6.02 4.10 0.34 Cr 0.38 0.12 0.36 0.05 0.46 Cd 0.07 0.19 0.02 0.01 0.40 Ni 0.21 0.16 0.18 0.18 0.61
Se 2.01 0.63 1.92 0.49 0.63 Hg 1.71 1.70 4.41 5.62 0.07 *
P 326 51 322 66 0.82 As 0.23 0.34 0.09 0.05 0.09 * Al 8.76 6.71 12.18 7.65 0.18
Co 0.04 0.04 0.06 0.04 0.12 Sb 0.02 0.01 0.03 0.02 0.78 Ba 1.71 1.62 2.63 3.10 0.29 B 2.42 1.63 0.97 0.42 0.00 +
Ge 0.05 0.01 0.05 0.01 0.76 Bi 0.08 0.11 0.12 0.17 0.44
Mo 0.06 0.02 0.06 0.03 0.89 Sr 1.23 1.03 1.29 0.70 0.83 S 47058 3245 47642 2601 0.57 V 0.07 0.04 0.12 0.07 0.02 + Ti 1.05 0.10 1.07 0.21 0.75 Tl 0.0026 0.0014 0.0027 0.0018 0.61
Rb 0.4352 0.5536 0.1688 0.1058 0.06 * U 0.0030 0.0035 0.0026 0.0019 0.32

16
Table 3. Comparison of the metal concentrations in the hair from possums trapped on the Savannah River near the mouths of the streams draining the Site and those trapped near the mouths of streams upstream from the Site. Metals were analyzed by ICPMS and are expressed as mg metal/kg hair, dry weight or parts per million. * indicates a difference at 90% confidence. + indicates a difference at 95% confidence.
SRS Possums Upstream Possums
Mean SD Mean SD p Ca 805 239 809 195 0.96 Mg 168 52 180 55 0.50 Na 206 112 159 89 0.18
K 366 258 218 146 0.04 + Cu 11.3 2.2 11.2 2.2 0.82 Zn 151 21 149 23 0.82 Fe 23.67 30.19 17.56 7.28 0.41 Mn 11.01 7.04 7.61 3.89 0.08 * Cr 0.36 0.10 0.34 0.06 0.56 Cd 0.09 0.22 0.03 0.02 0.27 Pb 1.44 0.53 1.73 1.27 0.37 Ni 0.38 0.82 0.13 0.10 0.22
Se 1.26 0.35 1.01 0.25 0.02 + Hg 1.19 1.10 1.44 1.13 0.50
P 305.6 64.4 291.1 32.2 0.40 As 9.46 18.95 1.41 2.64 0.08 * Al 12.17 17.29 7.44 4.41 0.27
Co 0.04 0.03 0.02 0.01 0.15 Sb 0.04 0.03 0.06 0.08 0.22 Ba 2.12 1.21 1.95 1.22 0.68 B 4.96 1.90 3.45 3.35 0.11
Ge 0.05 0.01 0.05 0.00 0.21 Bi 0.11 0.16 0.09 0.10 0.51
Mo 0.09 0.03 0.09 0.02 0.40 Sr 1.59 0.72 1.98 1.09 0.21 S 41558 3083 40679 2329 0.34 V 0.15 0.21 0.07 0.03 0.12 Ti 1.31 1.05 1.01 0.18 0.25 Tl 0.0027 0.0015 0.0024 0.0014 0.46
Rb 1.24 1.05 0.79 0.80 0.17 U 0.0043 0.0058 0.0013 0.0006 0.23
In catfish and bass tissues, attempts were made only to measure the trace elements. Analyses for calcium, magnesium, sodium, potassium, phosphorus, and sulfur were not attempted. Other

17
elements known to be undetectable in fish tissue were also excluded from the analysis. Of the metals included in the analyses beryllium, molybdenum, cadmium, antimony, thallium, lead, and uranium were not present in sufficient quantities to provide sufficient data for statistical analysis. It should be noted in Table 4 that the catfish caught in the Savannah River at SRS were larger (both heavier and longer) than the fish caught upstream. Eliminating the five largest SRS fish and the five smallest upstream fish to yield a population with no significant differences in weight or length did not have an effect on the significant differences in metal concentrations found between the populations. Table 4 indicates that chromium and cesium are higher in the SRS fish than in the upstream fish and that barium is higher in the upstream fish at the 90% confidence level. There were no statistical differences in metal concentrations that reached 95% confidence.
Table 4. Comparison of metal concentrations in muscle tissue of catfish caught in the Savannah River near the mouths of the streams draining the Savannah River Site and catfish caught in the river near the mouths of streams draining basins upstream and wholly outside the Savannah River Site. Muscle tissue was sampled, weighed, freeze-dried, weighed again, digested and analyzed for metals by ICPMS. Metal concentrations are expressed as mg metal/kg tissue dry weight or parts per million dry weight. Mean tissue water weight was 78%. * indicates a difference at 90% confidence. + indicates a difference at 95% confidence.
SRS Catfish Upstream Catfish
Mean SD Mean SD p Weight (g) 1130 613 560 238 0.0006 +
Length (mm) 557 77 450 67 0.0000 + V 0.25 0.04 0.25 0.06 0.92
Cr 0.50 0.16 0.42 0.12 0.06 * Mn 0.80 0.40 0.73 0.22 0.53 Co 0.02 0.01 0.03 0.01 0.44 Ni 0.48 0.26 0.39 0.12 0.23
Cu 1.63 1.17 2.23 3.21 0.52 Zn 24.68 9.24 24.79 6.40 0.96 As 0.52 0.60 0.39 0.31 0.49 Se 0.97 0.31 0.99 0.33 0.87 Rb 49.49 13.24 44.67 11.62 0.27 Sr 0.50 0.13 0.55 0.26 0.52 Cs 0.22 0.08 0.18 0.07 0.08 * Ba 0.04 0.02 0.07 0.06 0.07 * Hg 1.59 0.79 1.65 1.09 0.87
Of the metals that were examined in bass only beryllium, molybdenum, antimony, and thallium did not yield sufficient levels to accomplish statistical analysis. Concentrations of the trace elements measured in bass muscle are reported in Table 5. Like catfish, the bass caught near the
18
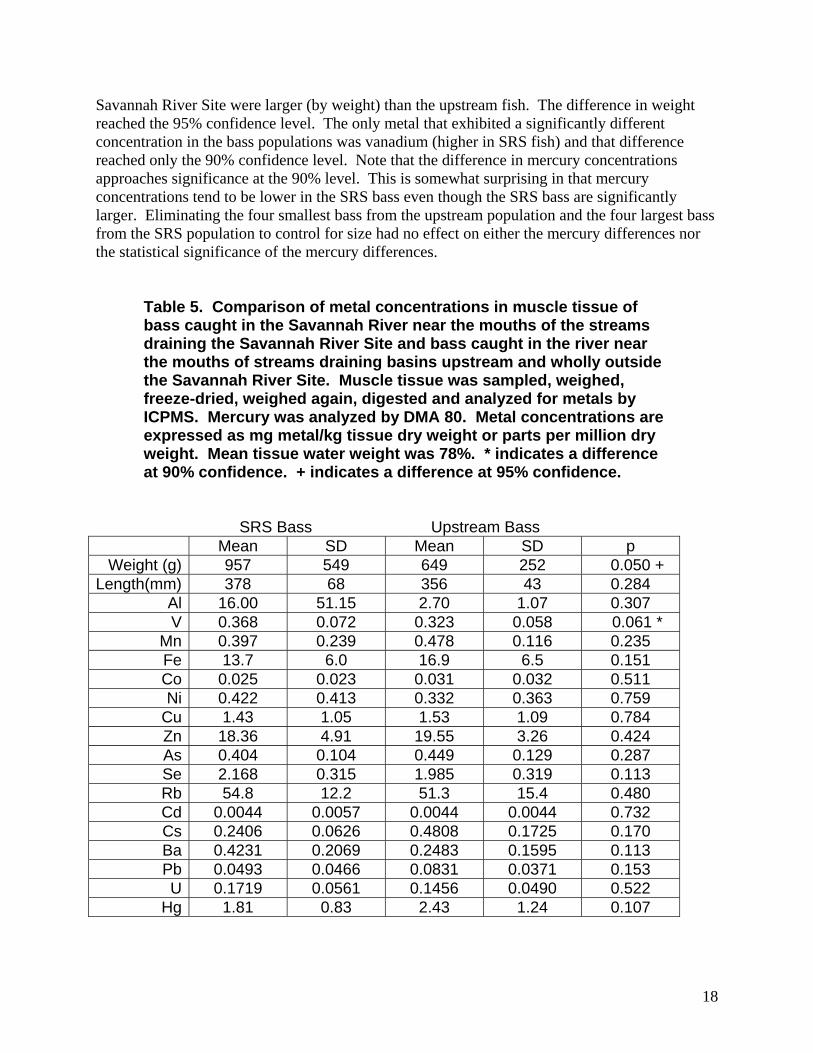
Savannah River Site were larger (by weight) than the upstream fish. The difference in weight reached the 95% confidence level. The only metal that exhibited a significantly different concentration in the bass populations was vanadium (higher in SRS fish) and that difference reached only the 90% confidence level. Note that the difference in mercury concentrations approaches significance at the 90% level. This is somewhat surprising in that mercury concentrations tend to be lower in the SRS bass even though the SRS bass are significantly larger. Eliminating the four smallest bass from the upstream population and the four largest bass from the SRS population to control for size had no effect on either the mercury differences nor the statistical significance of the mercury differences.
Table 5. Comparison of metal concentrations in muscle tissue of bass caught in the Savannah River near the mouths of the streams draining the Savannah River Site and bass caught in the river near the mouths of streams draining basins upstream and wholly outside the Savannah River Site. Muscle tissue was sampled, weighed, freeze-dried, weighed again, digested and analyzed for metals by ICPMS. Mercury was analyzed by DMA 80. Metal concentrations are expressed as mg metal/kg tissue dry weight or parts per million dry weight. Mean tissue water weight was 78%. * indicates a difference at 90% confidence. + indicates a difference at 95% confidence.
SRS Bass Upstream Bass
Mean SD Mean SD p Weight (g) 957 549 649 252 0.050 +
Length(mm) 378 68 356 43 0.284 Al 16.00 51.15 2.70 1.07 0.307 V 0.368 0.072 0.323 0.058 0.061 *
Mn 0.397 0.239 0.478 0.116 0.235 Fe 13.7 6.0 16.9 6.5 0.151 Co 0.025 0.023 0.031 0.032 0.511 Ni 0.422 0.413 0.332 0.363 0.759
Cu 1.43 1.05 1.53 1.09 0.784 Zn 18.36 4.91 19.55 3.26 0.424 As 0.404 0.104 0.449 0.129 0.287 Se 2.168 0.315 1.985 0.319 0.113 Rb 54.8 12.2 51.3 15.4 0.480 Cd 0.0044 0.0057 0.0044 0.0044 0.732 Cs 0.2406 0.0626 0.4808 0.1725 0.170 Ba 0.4231 0.2069 0.2483 0.1595 0.113 Pb 0.0493 0.0466 0.0831 0.0371 0.153 U 0.1719 0.0561 0.1456 0.0490 0.522
Hg 1.81 0.83 2.43 1.24 0.107

19
Discussion: Most of the findings of this study make sense when considered in context. It is reasonable that deer from the Site might exhibit a 21% higher strontium level than deer from off the Site. Strontium, of course, is a byproduct of the nuclear activities on the Site and might therefore be expected to exhibit increased levels in animals that live on the Site. Animals trapped just outside the borders of the Site and fish caught within yards of the Site borders did not have increased strontium levels. And, it is unlikely that strontium levels minimally increased like those in deer from the Site will have a significant biological effect. The observation that molybdenum is higher in the hair of deer harvested off Site was very likely a product of one of the sites of collection of our control population. Some of the deer for the control population were harvested on the lands of a hunting camp in Burke County, Georgia close to the farms where Augusta City sludge was spread several years ago. Analysis of that sludge indicated high concentrations of molybdenum. It is assumed that the deer harvested from that site had access to the plants growing on the land to which the sludge had been applied. While a reasonable explanation can be provided for the increased molybdenum in off Site deer, no such explanation is available for the differences in nickel in deer hair, or rubidium in raccoon hair, or the higher levels of barium in the upstream catfish. With 114 separate metal comparisons about 11 random significant differences would be expected to occur at the 90% level of confidence. The study has identified 18 significant differences at the 90% level of confidence or better. Thus, it is likely that some of the differences are real and others are the attributable to the randomness of observation. Two other elements of concern, arsenic and selenium are known to be present in coal ash, particularly the ash from the Savannah River Site (Roe et al., 2005). Potassium, vanadium, chromium, and manganese are also components of coal ash. Boron, a more volatile metal, is known to be a component of fly ash after the combustion of most coals (Rowe et al., 2002). Considering these facts most of the remaining differences could be due to the proximity of a coal fired power plant. Surprisingly, the Savannah River Site, a nuclear weapons facility, is powered by an on-site coal-fired power plant. Interestingly, the plant is located in D-Area near the river where its ash basins could have contributed considerably to the animals sampled. Indeed, the metal in the coal ash have been shown to have adverse metabolic effects on the amphibians living in or near the ash basins (Rowe and Hopkins, 2003). And finally, the tendency of mercury to be higher in raccoon hair and fish tissue from upstream animals might be explained by the presence of a mercury catalyzed chlor-alkali plant on the river about 25 miles upstream. Indeed, preliminary results from a study of mercury in the sediment in the river above and below the chlor alkali plant indicate that mercury concentrations in the sediment below the plant are three to six times the concentrations above the plant. It appears that, in spite of the tons of mercury buried on or seeped into the Site, the chlor-alkali plant is a more potent current source of mercury contamination than the Savannah River Site. The basic conclusion of this study is that the operators of the Savannah River Site are doing a credible job containing huge amounts of highly toxic heavy metals within the confines of the

20
Site. The small differences seen in some of the metals between upstream animals and Site animals are not biologically significant. In the one instance, mercury, where concentrations reach biological significance, the primary source appears to be elsewhere. Indeed, teasing out the separate sources of mercury, the chlor-alkali plant, the power plants, and the Savannah River Site could be a challenge. It is important that the operators of the Site continue to contain the waste on the Site. Since there are plumes of waste that have already reached Four Mile Creek and threaten Upper Three Runs, it will be necessary to continue to monitor and contain the mobility of the waste for many years to come. While the government calls the activities at the Site environmental clean up, their actions to this point have been aimed more at containment than clean up. Considering the extent of the problem, containment may be the better approach. At any rate, for the foreseeable future containment will require a continuing commitment if the wastes are to be kept out of the river. That commitment will involve continuous funding. The recently recommended funding cuts to the containment program along with the new nuclear programs, MOX assembly and trigger production, spell bad news for the river, more waste, less containment. References: Roe, JH, Hopkins, WA, and Jackson, BP (2005) Species- and stage –specific differences in trace element tissue concentrations in amphibians: implications for the disposal of coal combustion wastes. Environmental Pollution 136, 353-363. Rowe, CL and Hopkins WA (2003) Anthropogenic activities producing sink habitats for amphibians in the local landscape: a case study of lethal and sublethal effects of coal combustion residues in the aquatic environment. In: Amphibian Decline: An Integrated Analysis of Multiple Stressor Effects. Pub. Society of Environmental Toxicology and Chemistry, pp 271-282. Rowe, CL, Hopkins, WA, and Congdon, JD (2002) Ecotoxicological implications of aquatic disposal of coal combustion residues in the United States: a review. Environmental Monitoring Assessment 80, 207-276. SRS RCRA Permit Application (2001) Prepared by Westinghouse Savannah River Company for the US Department of Energy under contract DE-AC09-96SR18500. Submitted to US EPA 2001. Volumes 1-8, 10, 23 and 25.