Embed Size (px)
Citation preview

August 2011
NASA/TM–2011-217168
Heavy Lift Vehicle (HLV) Avionics Flight Computing Architecture Study Robert F. Hodson and Yuan Chen Langley Research Center, Hampton, Virginia
Dwayne R. Morgan Wallops Flight Facility, Wallops Island, Virginia
A. Marc Butler, Joseph M. Schuh, and Jennifer K. Petelle Kennedy Space Center, Kennedy Space Center, Florida
David A. Gwaltney, Lisa D. Coe, and Terry G. Koelbl Marshall Space Flight Center, Marshall Space Flight Center, Alabama
Hai D. Nguyen Johnson Space Center, Houston, Texas
https://ntrs.nasa.gov/search.jsp?R=20110014793 2018-05-18T22:38:20+00:00Z
NASA STI Program . . . in Profile
Since its founding, NASA has been dedicated to the advancement of aeronautics and space science. The NASA scientific and technical information (STI) program plays a key part in helping NASA maintain this important role.
The NASA STI program operates under the auspices of the Agency Chief Information Officer. It collects, organizes, provides for archiving, and disseminates NASA’s STI. The NASA STI program provides access to the NASA Aeronautics and Space Database and its public interface, the NASA Technical Report Server, thus providing one of the largest collections of aeronautical and space science STI in the world. Results are published in both non-NASA channels and by NASA in the NASA STI Report Series, which includes the following report types:
TECHNICAL PUBLICATION. Reports of
completed research or a major significant phase of research that present the results of NASA programs and include extensive data or theoretical analysis. Includes compilations of significant scientific and technical data and information deemed to be of continuing reference value. NASA counterpart of peer-reviewed formal professional papers, but having less stringent limitations on manuscript length and extent of graphic presentations.
TECHNICAL MEMORANDUM. Scientific
and technical findings that are preliminary or of specialized interest, e.g., quick release reports, working papers, and bibliographies that contain minimal annotation. Does not contain extensive analysis.
CONTRACTOR REPORT. Scientific and
technical findings by NASA-sponsored contractors and grantees.
CONFERENCE PUBLICATION. Collected
papers from scientific and technical conferences, symposia, seminars, or other meetings sponsored or co-sponsored by NASA.
SPECIAL PUBLICATION. Scientific,
technical, or historical information from NASA programs, projects, and missions, often concerned with subjects having substantial public interest.
TECHNICAL TRANSLATION. English-
language translations of foreign scientific and technical material pertinent to NASA’s mission.
Specialized services also include creating custom thesauri, building customized databases, and organizing and publishing research results. For more information about the NASA STI program, see the following: Access the NASA STI program home page at
http://www.sti.nasa.gov E-mail your question via the Internet to
[email protected] Fax your question to the NASA STI Help Desk
at 443-757-5803 Phone the NASA STI Help Desk at
443-757-5802 Write to:
NASA STI Help Desk NASA Center for AeroSpace Information 7115 Standard Drive Hanover, MD 21076-1320
National Aeronautics and Space Administration Langley Research Center Hampton, Virginia 23681-2199
August 2011
NASA/TM–2011-217168
Heavy Lift Vehicle (HLV) Avionics Flight Computing Architecture Study Robert F. Hodson and Yuan Chen Langley Research Center, Hampton, Virginia
Dwayne R. Morgan Wallops Flight Facility, Wallops Island, Virginia
A. Marc Butler, Joseph M. Schuh, and Jennifer K. Petelle Kennedy Space Center, Kennedy Space Center, Florida
David A. Gwaltney, Lisa D. Coe, and Terry G. Koelbl Marshall Space Flight Center, Marshall Space Flight Center, Alabama
Hai D. Nguyen Johnson Space Center, Houston, Texas

Available from:
NASA Center for AeroSpace Information 7115 Standard Drive
Hanover, MD 21076-1320 443-757-5802
Acknowledgments
Thanks to the following individuals that for their support of the study:
・ Philip Youmans – Kenney Space Center
・ Mark Monaghan – Kennedy Space Center
・ Amanda Gillespie – Kennedy Space Center
・ Duane Pettit – Langley Research Center
・ Spence Hatfield – Marshall Space Flight Center
・ Robert Decoursey – Langley Research Center
Trade names and trademarks are used in this report for identification only. Their usage does not constitute an official endorsement, either expressed or implied, by the National Aeronautics and Space Administration.

1 of 88
Heavy Lift Vehicle (HLV) Avionics Flight Computing Architecture Study Core Study Team Dr. Robert Hodson, LaRC - Study Lead Dwayne Morgan, GSFC/Wallops Dr. Yuan Chen, LaRC – Reliability Lead Marc Butler, KSC – Mass/Power Lead David Gwaltney, MSFC Joe Schuh, KSC Lisa Coe, MSFC Jen Petelle, KSC – Software Lead Hai Nguyen, JSC Terry Koelbl, MSFC - ex officio

HLV Avionics Flight Computing Architecture Study – 2011
2 of 88
Preface This study was performed in response to a potential future need to assess and/or design avionics architectures for a Heavy Lift Launch Vehicle (HLLV). It is recognized that this study’s assessments are in the context of an evolving Project. Several Project trade studies are ongoing and may affect the outcomes of this study activity.
HLV Avionics Flight Computing Architecture Study – 2011
3 of 88
Table of Contents
Acronyms _____________________________________________________________ 5
Executive Summary _____________________________________________________ 7
Purpose _______________________________________________________________ 9
Study Scope ____________________________________________________________ 9
Study Approach ________________________________________________________ 9
Design Reference Missions Requirements____________________________________ 9
Flight Computing Architecture Overview ___________________________________ 10
Architecture 1: Fully Cross‐Strapped Switched Triplex Voter (FCSSTV) _________________ 12
Architecture 2: Partially Cross‐Strapped Switched Triplex Voter (PCSSTV) ______________ 13
Architecture 3: Channelized Bussed Triplex Voter (CBTV) ___________________________ 14
Architecture 4: Fully Cross‐Strapped Self‐Checking (FCSSC) __________________________ 15
Architecture 5: Fully Cross‐Strapped Bussed Self‐Checking (FCSBSC) __________________ 16
Architecture 6: Self Checking Channelized Architecture_____________________________ 17
Reliability Analysis _____________________________________________________ 17
Data Network Harness Mass _____________________________________________ 21
Power Analysis ________________________________________________________ 23
Redundancy Management Approaches ____________________________________ 24
Conclusions ___________________________________________________________ 26
Appendix A: Architecture Data Flows ______________________________________ 28
Appendix A List of Figures ____________________________________________________ 28
Fully Cross‐Strapped Self‐Checking Architecture (Orion‐like) ________________________ 29
Fully Cross‐Strapped Switched Voter ____________________________________________ 33
Self Checking Cross‐Strapped Bus Master/Slave Architecture (Atlas‐like) ______________ 37
Partially Switched Triplex Voter ________________________________________________ 41
Bussed Triplex Voter (vote at FCs) Ares/Delta‐like _________________________________ 45
Self Checking Channelized Architecture _________________________________________ 48
Cross Channel Data Link (CCDL) Functionality _____________________________________ 53
Appendix B: Reliability Analysis ___________________________________________ 57
Appendix B List of Figures _____________________________________________________ 57
Appendix B List of Tables _____________________________________________________ 57
Reliability Analysis Scope _____________________________________________________ 57

HLV Avionics Flight Computing Architecture Study – 2011
4 of 88
Reliability Assumptions ______________________________________________________ 57
Reliability Block Diagram Analysis ______________________________________________ 58
Cut Set Analysis _____________________________________________________________ 69
Importance Analysis _________________________________________________________ 70
Conclusion _________________________________________________________________ 72
Appendix C: Power Analysis ______________________________________________ 73
Appendix C List of Figures _____________________________________________________ 73
Appendix C List of Tables _____________________________________________________ 73
Appendix D: Mass Analysis ______________________________________________ 77
Appendix D List of Figures ____________________________________________________ 77
Appendix E: Redundancy Management Approaches __________________________ 88 List of Figures Figure 1. Fully Cross‐Strapped Switched Triplex Voter. ________________________________________ 12 Figure 2 Partially Switched Triplex Voter ___________________________________________________ 13 Figure 3. Channelized Bussed Triplex Voter _________________________________________________ 14 Figure 4 Fully Cross‐strapped Self‐Checking architecture ______________________________________ 15 Figure 5 Fully Cross‐Strapped Bussed Self‐Checking __________________________________________ 16 Figure 6 Self‐Checking Channelized architecture _____________________________________________ 17 Figure 7. Reliability plot for the six architectures. ____________________________________________ 19 Figure 8 Number of 2‐fault combinations __________________________________________________ 20 Figure 9 The probability contributions of each of functional unit ________________________________ 21 Figure 10 Total data network harness mass contributions for each architecture ____________________ 22 Figure 11. Power estimates for each flight computing architecture. ______________________________ 23 List of Tables Table 1 Functional units and quantities ........................................................................................................ 11 Table 2 Avionics reliability of a single stage for 12 minute, 24 hour and 6 month cases ............................. 19 Table 3 Percentage of mass for the data network relative to total stage harness mass ............................. 22 Table 4. Power assumptions for functional units, buses, and switches. ....................................................... 23 Table 5 Summary of redundancy management approaches for existing architectures ............................... 26
HLV Avionics Flight Computing Architecture Study – 2011
5 of 88
Acronyms
BCE -Bus Control Element BIU -Bus Interface Unit CBTV -Channelized Bussed Triplex Voter CBSC -Channelized Bussed Self-Checking CCDL -Cross-Channel Data Link COTS -Commercial Off-The-Shelf CRC -Cyclic Redundancy Check DAU -Data Acquisition Unit DRM -Design Reference Missions ECU -Engine Control Unit EIU -Engine Interface Unit ELV -Expendable Launch Vehicle FC -Flight Computer FCRM -Flight Computer Redundant Management FCSBSC -Fully Cross-Strapped Bussed Self-Checking FCSSC -Fully Cross-Strapped Switched Self-Checking FCSSTV -Fully Cross-Strapped Switched Triplex Voter FDIR -Fault Detection, Isolation, and Recovery FPGA -Field Programmable Gate Array FSW -Flight Software FT -Fault Tolerant FTINU -Fault Tolerant Inertial Navigation Unit FTPP -Four-Fault Tolerant Parallel Processor FTSS -Fault Tolerant System Services GNC -Guidance Navigation and Control GPC -General Purpose Computer GSFC -Goddard Space Flight Center GVSC -Generic VHSIC Spaceborne Computer HCU -Hydraulic Control Unit HLV -Heavy Lift Vehicle HW -Hardware ICC -Intercomputer Communication INU -Inertial Navigation unit IPR -Input Problem Report JSC -Johnson Space Center KSC -Kennedy Space Center LaRC -Langley Research Center LEO -Low Earth Orbit LOC -Loss of Crew LOM -Loss of Mission LRU -Line Replacement Unit MPS -Main Propulsion System MSFC -Marshall Space Flight Center NE -Network Element OS -Operating System PCSSTV -Partially Cross-Strapped Switched Triplex Voter PE -Processing Elements PIC -Pyrotechnic Initiation Controller RBD -Reliability Block Diagram

HLV Avionics Flight Computing Architecture Study – 2011
6 of 88
RCSC -Reaction Control System Controller RGA -Rate Gyro Assembly RIFCA -Redundant Inertial Flight Control Assembly RM -Redundant Management RMU -Redundancy Management Units ROBUS -Reliable Optical Bus SBU -Sensitive But Unclassified SCP -Self Checking Pair SLS -Space Launch System SPIDER -Scalable Processor Independent Design for Electromagnetic Resilience SW -Software Synch -Synchronization TDMA -Time-Division Multiple Access TMR -Triple Modular Redundancy TTE -Time Triggered Ethernet TVC -Thrust Vector Controller ULA -United Launch Alliance
HLV Avionics Flight Computing Architecture Study – 2011
7 of 88
Executive Summary
A multi-Center study team was assembled from LaRC, MSFC, KSC, JSC and WFF to examine potential flight computing architectures for a Heavy Lift Vehicle (HLV) to better understand avionics’ drivers. The study examined Design Reference Missions (DRMs) and vehicle requirements that could impact the vehicles’ avionics. The study considered multiple self-checking and voting architectural variants and examined reliability, fault-tolerance, mass, power, and redundancy management impacts. Furthermore, a goal of the study was to develop the skills and tools needed to rapidly assess additional architectures should requirements or assumptions change. After examination of multiple DRMs and requirement documents, high-level driving requirements were determine to be: The avionics architecture shall be human-rateable, The avionics architecture shall, at a minimum, be fail-operational after one
arbitrary fault, The avionics architecture shall, at a minimum, be fail-safe (for abort initiation)
after a second arbitrary fault, The avionics architecture shall be highly reliable to meet Loss of Crew (LOC) and
Loss of Mission (LOM) for various NASA missions.
It should be noted that common cause failure and backup systems requirements were not a part of this study as this topic was thoroughly addressed by a previous Ares 1 study. Twelve architectures were initially assessed and six were selected for detailed study. The selected architectures include three self-checking architectures and three voting architectures with various levels of cross-strapping. Both bussed and switched architectures were also considered. Architectures were also chosen due to similarity to existing launch vehicle designs. The avionics of a representative HLV stage was modeled of each computing architecture for comparative purposes. Reliability models, mass models, and power models were developed based on existing LV data obtained from Ares 1 and other databases. Reliability analysis showed all architectures except one were at a reliability level of least 0.9999 for short duration (i.e. 24 hour, preflight plus time to orbit) reliability but varied significantly (0.3576 to 0.6669) if a longer duration (i.e. 9 month, departure stage for Mars DRM) was needed. For all architectures, the flight computers were the largest contributor to failure. Reliability analysis assumed all architectures to be 1-fault tolerant by design but the number of 2-fault cases varied from 21 to 160 depending on the chosen architecture. The reliability of the architectures is related directly to the level of cross-strapping in the various architectures. Power consumption was analyzed for each of the architectures and compared. Power varied from 1758 W to 1935 W or roughly 7% depending on the architecture selected. Voting architectures tended to score slightly better from a power perspective but this was not considered to be significant given the small change. Since cross-strapping varied significantly in some architectures, harness mass was also analyzed. Harness mass for the data network was the only harness mass considered in this analysis. The data harness mass for a generic LV stage varied from 16 lbs to 105

HLV Avionics Flight Computing Architecture Study – 2011
8 of 88
lbs. This was estimated to be between 2% to 9% of the total avionics harness mass. Bussed architectures tended to score best for harness mass but the change in mass (~89 lbs) between the various architectures was not considered to be a driver on a 100 metric ton class vehicle. Lastly, a survey of existing vehicle architectures was performed from a redundancy management perspective. Approaches varied widely in both hardware and software implementations. It was also noted that synchronization and interactive consistency exchanges can be complicated and challenging whether implemented in hardware and/or software and should be carefully examined in any design. In conclusion, based on the analyses performed, all architectures but one are considered reasonable approaches for a short duration launch vehicle mission although some did exhibit improved robustness over others for longer duration missions and for multi-fault scenarios. In an actual launch vehicle implementation, assumptions (failure rates, power, mass, etc) would require validation and full systems level reliability analysis would need to be performed to verify requirements.

HLV Avionics Flight Computing Architecture Study – 2011
9 of 88
Purpose
The purpose of the study is to assess potential flight computing architectures for a Heavy Lift Vehicle (HLV) and identify avionics performance drivers. A goal of the study is develop tools and skills to rapidly assess additional architectures should requirements or assumptions change.
Study Scope
The Heavy Lift Vehicle Flight Computing Architecture study scope included the following:
Study of the current DRMs and requirements to best determine key driving requirements for the flight computing architecture.
Examination of multiple launch vehicle avionics architectures to explore the trade space considering reliability, fault-tolerance, mass, and other factors.
o Self-checking and voting architectural variants will be traded. The following topics are explicitly considered out of scope:
Backup-Flight Systems Developmental Flight Instrumentation Flight Termination Systems Communications, Systems Power systems
Study Approach
The following process was used during this study:
Review of applicable Design Reference Missions (DRMs) High level requirements review to identify avionics drivers Review Ares V “straw-man” architecture Simplify the Ares V architecture and use as a basis for instrumentation and a
baseline architecture for comparison Develop candidate set of computing architectures
Various voting & self-checking configurations Various types and levels of interconnect
Assess/Analyze Architectures Fault tolerant characteristics (integrity, multi-fault characteristics) Reliability Mass (harness complexity) Power Software/Hardware redundancy management implementation options
Design Reference Missions Requirements
High level design reference missions and requirement guidance were reviewed from several sources including:
Proposed HEFT Crewed NEO Missions MARS reference Missions

HLV Avionics Flight Computing Architecture Study – 2011
10 of 88
Space Launch Systems (SLS) Requirements Analysis Cycle guidance Constellation Avionics Driving Requirements Commercial Crew Transportation Systems Certification Requirements NASA Human-Rating Requirements for Space Systems
From this information, informal high level avionics driving requirements were derived to help direct the study team. Key driving requirements included:
The avionics architecture shall be human-rateable The avionics architecture shall, at a minimum, be fail-operational after one
arbitrary fault. The avionics architecture shall, at a minimum, fail-safe (for abort initiation) after a
second arbitrary fault. The avionics architecture shall be highly reliable to meeting Loss of Crew (LOC)
and Loss of Mission (LOM) for various NASA missions.
The human-rateable requirement recognizes that the first variant of a heavy lift vehicle may not initially require human rating certification but eventually for crewed systems this is required. For reliability calculations, a 24 hour time interval was deemed acceptable to cover prelaunch and launch on-time for avionics systems. It was recognized that if a earth departure stage or kick stage is required for long duration missions that this duration may have significant impact on LOC/LOM.
Flight Computing Architecture Overview
A challenge in assessing flight computing architectures is to cull the set of possible architectures to a manageable set of acceptable architectures worthy of further analysis and refinement. A second challenge is to perform the architecture comparison in an unbiased way that allows for apples-to-apples comparisons. To reduce the trade space of potential architectures, a two step processed was used. First, a relatively large set of twelve architectures were considered. This included self-checking variants, voting variants, varying degrees of cross-strapping, and switched and bussed configurations. All of these architectures were consistent with the high-level avionics requirements. Furthermore, the set of architectures analyzed deliberately included variants with similarity to Atlas, Delta, Ares and Orion architectures. The complete list of architectures considered was:
1. Fully Cross-Strapped Switched Triplex Voter 2. Partially Cross-Strapped Switched Triplex Voter 3. Triplex Voter with Self-Checking Switches 4. Channelized Bussed Triplex Voter 5. Bussed Triplex Voter without Cross-strap 6. Channelized Bussed Triplex Voter 7. Fully Cross-Strapped Switched Self-Checking 8. Fully Cross-Strapped Bussed Self-Checking 9. Channelized Bussed Self-Checking 10. Self-checking Processors with separate Busses 11. Self-check Processors (high level network processors) 12. Bussed Triplex Voter

HLV Avionics Flight Computing Architecture Study – 2011
11 of 88
From this architecture set a smaller set was chosen for further analysis. This set included:
1. Fully Cross-Strapped Switched Triplex Voter (FCSSTV) 2. Partially Cross-Strapped Switched Triplex Voter (PCSSTV) 3. Channelized Bussed Triplex Voter (CBTV) 4. Fully Cross-Strapped Switched Self-Checking (FCSSC) 5. Fully Cross-Strapped Bussed Self-Checking (FCSBSC) 6. Channelized Bussed Self-Checking (CBSC)
The rationale for this selection was that it was desired to have a sampling of highly-crossed and highly channelized architectures, a mix of self-checking/voting architectures, and switch/bussed architectures. To perform a fair comparison of these architectures, instrumentation for a representative launch vehicle stage was used with the various flight computing configurations. In this way analysis would not be biased by specific architecture implementations. The following instrumentation was used in comparing all architectures. Unit Acronym Unit Name Quantity Function RGA Rate Gyro Assembly 3 Provides pitch and yaw rate measurements INU Inertial Navigation Unit 3 Provides acceleration in three axes and angular
rates for roll pitch and yaw DAU Data Acquisition Unit 2 Provides excitation/measurement for sensors for
critical system control and monitoring. Since there are only 2 DAUs, for sensor measurements, lower level redundancy is assume to ensure sufficient data integrity.
ECU Engine Control Unit 2 Receives Commands from the Flight Computer (FC) for engine control and provides the FC with pertinent data for engine control and monitoring
TVC Thrust Vector Controller 3 Receives commands from the FC to command the thrust vector control actuators to the proper position. Provides the FC with pertinent data for TVC actuator control and monitoring
MPS Main Propulsion System 2 Receives commands from FC to control flow of fuel and oxidizer. Provides the FC with pertinent data for MPS control and monitoring.
RCSC Reaction Control System Controller
2 Receives commands from FC to control reaction control jets. Provides the FC with pertinent data for RCS control and monitoring
PIC Pyro Initiation Controller 2 Receives commands from the FC to initiate pyro events. Provides the FC with pertinent data for pyro circuit monitoring
HCU Hydraulic Control Unit 2 Receives commands from the FC to control hydraulic power generation for the TVC actuator. Provides the FC with pertinent data for Hydraulic Power system control and monitoring
Table 1 Functional units and quantities Each of the architectures is depicted in the following diagrams. When elements in the diagrams are duplicated, they represent self-checking (redundant) elements. In the case of controllers (TVC, PIC, etc) only the controller’s interface is assumed to have self-check redundancy when this is depicted. Some of the architectures have a Cross-
HLV Avionics Flight Computing Architecture Study – 2011
12 of 88
Channel Data Link (CCDL). This does not assume a specific implementation although it is assumed that it is capable of performing fault-tolerant data exchanges and system synchronization. When a CCDL is not explicitly shown in an architecture diagram, it is assumed the CCDL functionality exists in the current interconnect elements between flight computers with the associated software for consistent data transfer and synchronization.
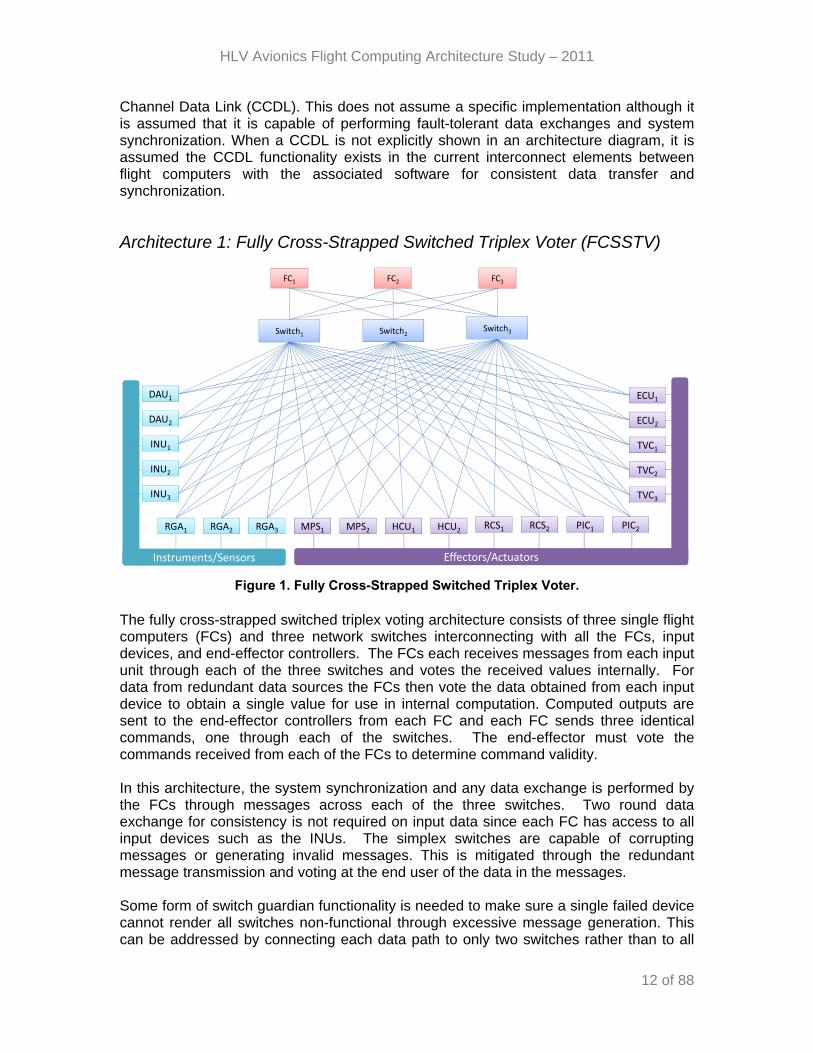
Architecture 1: Fully Cross-Strapped Switched Triplex Voter (FCSSTV)
Instruments/Sensors Effectors/Actuators
FC2FC1
Switch1Switch3
INU1
INU3
INU2
TVC1
TVC3
TVC2
DAU1
DAU2
ECU1
HCU1MPS1
ECU2
HCU2MPS2RGA1 RGA3RGA2
Switch2
PIC1RCS1 PIC2RCS2
FC3
Figure 1. Fully Cross-Strapped Switched Triplex Voter.
The fully cross-strapped switched triplex voting architecture consists of three single flight computers (FCs) and three network switches interconnecting with all the FCs, input devices, and end-effector controllers. The FCs each receives messages from each input unit through each of the three switches and votes the received values internally. For data from redundant data sources the FCs then vote the data obtained from each input device to obtain a single value for use in internal computation. Computed outputs are sent to the end-effector controllers from each FC and each FC sends three identical commands, one through each of the switches. The end-effector must vote the commands received from each of the FCs to determine command validity. In this architecture, the system synchronization and any data exchange is performed by the FCs through messages across each of the three switches. Two round data exchange for consistency is not required on input data since each FC has access to all input devices such as the INUs. The simplex switches are capable of corrupting messages or generating invalid messages. This is mitigated through the redundant message transmission and voting at the end user of the data in the messages. Some form of switch guardian functionality is needed to make sure a single failed device cannot render all switches non-functional through excessive message generation. This can be addressed by connecting each data path to only two switches rather than to all
HLV Avionics Flight Computing Architecture Study – 2011
13 of 88
three. A separate Cross Channel Data Link for the FCs may be needed to address this issue, as well as to support synchronization.
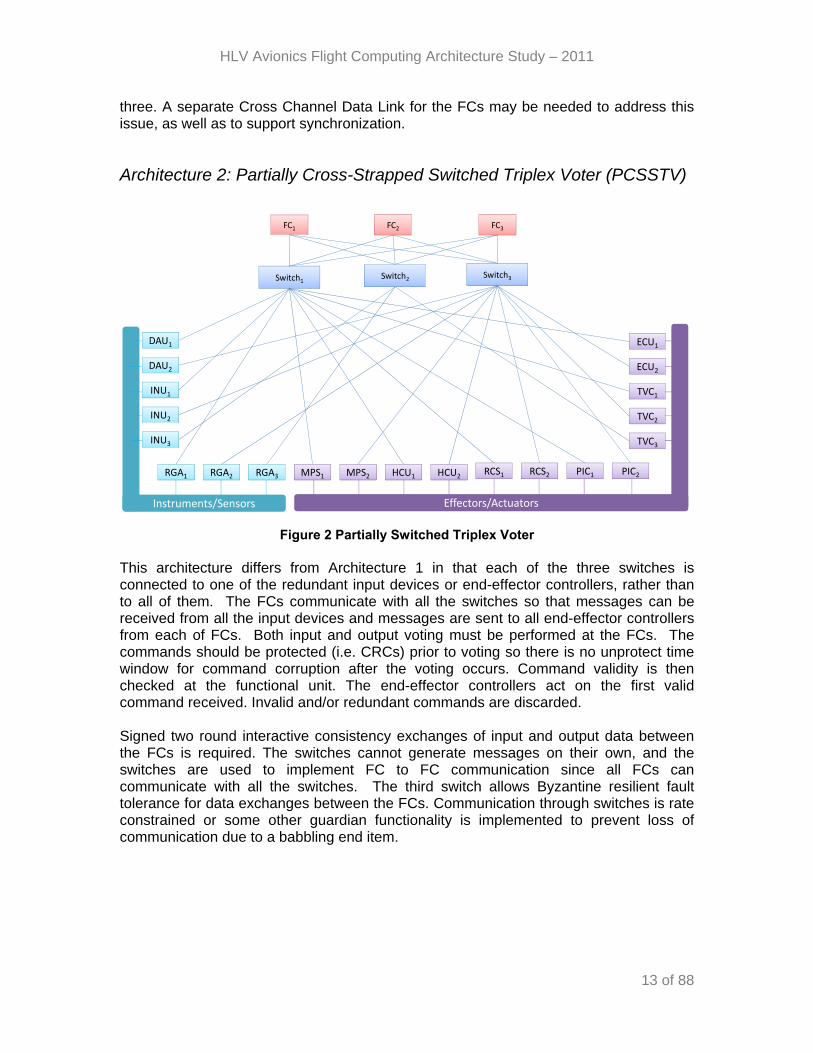
Architecture 2: Partially Cross-Strapped Switched Triplex Voter (PCSSTV)
Instruments/Sensors Effectors/Actuators
FC2FC1
Switch1Switch3
INU1
INU3
INU2
TVC1
TVC3
TVC2
DAU1
DAU2
ECU1
HCU1MPS1
ECU2
HCU2MPS2RGA1 RGA3RGA2PIC1RCS1 PIC2RCS2
FC3
Switch2
Figure 2 Partially Switched Triplex Voter
This architecture differs from Architecture 1 in that each of the three switches is connected to one of the redundant input devices or end-effector controllers, rather than to all of them. The FCs communicate with all the switches so that messages can be received from all the input devices and messages are sent to all end-effector controllers from each of FCs. Both input and output voting must be performed at the FCs. The commands should be protected (i.e. CRCs) prior to voting so there is no unprotect time window for command corruption after the voting occurs. Command validity is then checked at the functional unit. The end-effector controllers act on the first valid command received. Invalid and/or redundant commands are discarded. Signed two round interactive consistency exchanges of input and output data between the FCs is required. The switches cannot generate messages on their own, and the switches are used to implement FC to FC communication since all FCs can communicate with all the switches. The third switch allows Byzantine resilient fault tolerance for data exchanges between the FCs. Communication through switches is rate constrained or some other guardian functionality is implemented to prevent loss of communication due to a babbling end item.

HLV Avionics Flight Computing Architecture Study – 2011
14 of 88
Architecture 3: Channelized Bussed Triplex Voter (CBTV)
INU1 INU3INU2
TVC3 TVC1TVC2
ECU2ECU1
DAU2
HCU1 HCU2
MPS2
PIC1
RCS1
PIC2
RCS2
MPS1
CCDL
RGA2 RGA3RGA1
BUS
BUS
BUS
FC2FC1 FC3
DAU1
Figure 3. Channelized Bussed Triplex Voter Rather than using a networked communication system like Architectures 1 and 2, bussed communications in a highly channelized (no cross-strapping) approach is used. Each FC can only communicate with the input devices and end-effectors that are connected to the bus to which that FC has access. Input data is received from one redundant source by each FC and then shared across the CCDL. Two round interactive consistency exchanges of input and output data between the FCs is required. Each FC sends the voted command to the end-effectors connected to the bus it controls. Exact match voting should be performed on output commands. The commands should be protected (i.e. CRCs) prior to voting so there is no unprotect time window for command corruption after the voting occurs. Synchronization of the FCs is implemented through data exchange on the CCDL. From the perspective of the other FCs, failure of one FC results in loss of access to the avionics units on the bus it controls.

HLV Avionics Flight Computing Architecture Study – 2011
15 of 88
Architecture 4: Fully Cross-Strapped Self-Checking (FCSSC)
Instruments/Sensors Effectors/Actuators
FC2FC1
Switch1Switch2
INU1
INU3
INU2
TVC1
TVC3
TVC2
DAU1
DAU2
ECU1
ECU2
RGA1 RGA3RGA2 HCU1 HCU2MPS2 PIC1RCS1 PIC2RCS2MPS1
Figure 4 Fully Cross-strapped Self-Checking architecture
This architecture is based on extensive use of self-checking components. Each flight computer (FC) is self-checking and uses the interconnection through the self-checking switches to implement reliable FC to FC communication. The switches are assumed to provide the fault-tolerant synchronization of the FCs and the system components. Only the controller in the input devices and the end-effector control units are self-checking. All self-checking components fail-silent on miscompares. The switches handle much of the functionality required for fault containment and system synchronization. The switches generate and distribute the fault tolerant system time. Only two, self-checking switches are required because the following is assumed: Switches cannot corrupt a message being transmitted by FCs, input devices, or
end-effector interface units. Switches cannot generate a valid message and initiate communication on their
own Switches provide the bus guardian function to prevent fault propagation from a
data source
The FCs read data from input devices through both switches and accepts the first valid result, since the path is self-checking. The FCs both receive data from all the input devices. Input voting is performed on both FCs simultaneously and commands are sent to the end-effector control units by both FCs. The point-to-point communication links between switches and flight computers or functional units are assumed to carry CRC protection to detect any potential link errors that may occur during signal propagation. The first valid command is accepted by the controller. The FC-to-FC communication is a single round exchange because the switches and FCs will fail-silent upon miscompare of message data.

HLV Avionics Flight Computing Architecture Study – 2011
16 of 88
Architecture 5: Fully Cross-Strapped Bussed Self-Checking (FCSBSC)
Instruments/Sensors Effectors/Actuators
FC2FC1
INU1
INU3
INU2
TVC1
TVC3
TVC2
DAU1
DAU2
ECU1
ECU2
RGA1 RGA3RGA2 HCU1 HCU2MPS2 PIC1RCS1 PIC2RCS2MPS1
CCDL
Primary Secondary
BUS A
BUS B
Figure 5 Fully Cross-Strapped Bussed Self-Checking
This architecture is characterized by the use of a redundant data communication bus with self-checking at the two FCs only. There is no self-checking in the input devices or the end-effector controllers. FC1 is designated the primary (or master) and FC2 is designated the secondary (or slave) which operates in hot backup to the primary. During nominal operation, both FC1 and FC2 receive the same data from the input devices and use it to generate appropriate commands, but only FC1 is able to transmit those commands to the vehicle avionics system. The bus interface for FC2 is initially in a bus monitor configuration rather than a bus controller configuration, and despite using the same data FC1 is using, the outputs are not permitted to be transmitted on the busses unless there is a critical fault that results in a switchover to FC2. When this occurs the FC1 bus interface is disabled and the FC2 bus interface changes to the bus controller and allows FC2 to send commands to the vehicle avionics system. When FC1 detects a mis-compare or another critical fault that warrants a switchover, the role of the primary FC is transferred to the secondary. FC1 is not allowed to become primary FC again after the switchover to FC2 occurs, even if the detected critical fault is transient in nature. If a critical fault is detected on FC2, and FC2 has not become the primary, the ability for FC1 to transfer the role of primary FC to FC2 is inhibited. Both the FCs has access to both the communication busses, and the primary FC may communicate with the input devices and end-effector controllers over either bus at any time. The end-effector controllers accept valid messages delivered over either bus. Validity is determined through message format and CRC. Data is exchanged between the two FCs over a direct CCDL between the two. This data exchange includes system control states needed to provide a bump-less switchover from the FC1 to FC2 in the event of a fault in the FC1 processor. Synchronization of the two FCs is maintained through the CCDL as well. The control system must be designed to accommodate the worst case time for switchover by being capable of maintaining the

HLV Avionics Flight Computing Architecture Study – 2011
17 of 88
current end-effector state throughout the period of no communication from the FCs while the switchover is occurring.
Architecture 6: Self Checking Channelized Architecture
BUS 2
Instruments/Sensors Effectors/Actuators
CCDL
BUS 1
BUS 2
BUS 1
RGA1 RGA3RGA2 HCU1 HCU2MPS2 PIC1RCS1 PIC2RCS2MPS1
INU1
INU3
INU2
DAU1
DAU2
TVC1
TVC3
TVC2
ECU1
ECU2
FC2FC1
Figure 6 Self-Checking Channelized architecture
In this architecture, each FC communicates with input devices and end-effector controllers over a dual (self-checking) bus controlled by that FC only. All end items are self-checking, and one identical message is sent over each of the buses simultaneously for all communication. FC to FC data communication and synchronization is over the CCDL and not the buses. In the case where there are three input sources or three controllers, one source or controller is connected to both busses to makes sure each FC receives redundant input and can access redundant controllers. Input data is exchanged across the CCDL to make sure both FCs act on the same data. Input data is then voted by each FC individually and no exchange of voted data occurs. The controller receiving command messages from both FCs selects the first valid received. Output commands from the FCs are not exchanged since they are self-checking. Since the architecture is highly channelized failure of one FC or bus results in loss of access to all avionics units only connected to the bus or FC. These high-level architecture diagrams and descriptions depicted the basic topologies that were studied. More detailed dataflow of these architectures are given in Appendix A.
Reliability Analysis
For each of the architectures, reliability analysis was performed to develop the Reliability Block Diagram (RBD) models for reliability comparison and cut set analysis of all the architectures. Relex® was used as the primary reliability modeling tool with some analytical modeling to cross check results.
HLV Avionics Flight Computing Architecture Study – 2011
18 of 88
The failure rates for the functional units in the architectures were estimated based on the existing reliability databases of the avionics systems. The same failure rates were assumed for the same type of functional units, while the interconnections and topologies were varied for the six architectures. The reliability analysis assumed one fault tolerance for all function unit groups, namely more than one failure in any single type of functional unit group was deemed to be a system failure. For example, more than one of the three INUs or more than one of the two DAU would result in a system failure. In addition, only hard or non-recoverable failures of the functional units were considered in the analysis. It was assumed that for the flight computers or switches or buses, the self-checking pair consists of two flight computers or two switches or two buses. For other functional units, self-checking pair was assumed to consist of one functional unit plus additional hardware to represent a self-checking network interface logic. The reliability analysis was performed for a time period of up to nine months. The nine month mission was considered for two reasons. First, there are some mission scenarios that could potentially require an Earth departure stage that would require long mission duration. Second, by extending the mission duration, the relative differences of the architectures is magnified. This can be thought of as a measure of robustness of architecture to remain operational under a great number of component failure scenarios. RBD models were developed for all the architectures. Figure 7 shows the reliability of each architecture for mission duration from 0 to 9 months. Results were calculated using Monte-Carlo simulation with 1,000,000 iterations. Confidence level was set at 95%. From the graph it can be inferred that several architectures may be suitable for short duration missions but as mission time increases some architectures have a distinct reliability advantage over others. To first order, these reliability differences are the result of different levels of cross-strapping associated with the various architectures. Please note that the reliability of the system shown in this report is only for one stage of the computing system and, therefore, the reliability of the computing system of a mission will be the reliability of the one stage of the computing system to the power of three if three stages are required for the success of the mission.

HLV Avionics Flight Computing Architecture Study – 2011
19 of 88
Figure 7. Reliability plot for the six architectures.
Table 2 shows the reliability of the various architectures for the 12 minutes, 24 hours, and 9 month cases. Several architectures (FCSSTV, PCSSTV, FCSSC, FCSBSC) show “9 nines” and “5 nines” for the 12 minute and 24 hour cases, respectively. Voting, self-checking, switched, and bussed architectures are in this group indicating that it is possible to achieve highly reliable launch vehicle systems with each of these classes of architectures. As mission times increase the impacts on reliability due to the various topologies and hardware failure rates become more exaggerated as the curves diverge. Of the architectures modeled, the FCSSTV is the most reliable due to the high level of cross-strapping that improves availability and less hardware and thus a lower fault arrival rate than some of the other schemes. But it should always be remembered that hardware reliability is only one facet of a system design and other considerations (i.e. low power modes, backup modes, software maturity, etc) could ultimately lead to other architectural choices.
Architecture/Reliability R (12 Minutes) R (24 Hours) R (9 Months)
FCSSTV 0.99999999951 0.999993 0.666999
PCSSTV 0.99999999939 0.999991 0.613596
CBTV 0.99999999856 0.999979 0.464581
FCSSC 0.99999999946 0.999992 0.648547
FCSBSC 0.99999999946 0.999992 0.646730
CBSC 0.99998621550 0.998334 0.357675
Table 2 Avionics reliability of a single stage for 12 minute, 24 hour and 6 month cases Cut Set Analysis was performed for further analysis on the architectures. A cut set is a collection of the functional units such that, if all the functional units in that cut set were to
0.35
0.45
0.55
0.65
0.75
0.85
0.95
0 1000 2000 3000 4000 5000 6000
Reliability
Time (Hrs)
FCSSTV
PCSSTV
CBTV
FCSSC
FCSBSC
CBSC

HLV Avionics Flight Computing Architecture Study – 2011
20 of 88
fail, the system would fail. A minimum cut set is a smallest collection of the functional units, which, if they all fail, causes the failure of the system. Figure 8 and Figure 9 show the results of the Cut Set Analysis. Figure 8 gives the numbers of the minimum cut sets for each architecture. In this analysis, the cut sets are the number of 2-fault failure combinations for each of the architectures. For example, in the PCSSTV architecture, a failure of SWITCH3 and a failure of ECU1 would result in a system failure (since neither ECU1 or ECU2 are controllable). But the same failure would not result in a system failure of FCSSTV due to the additional cross-strapping of the fully cross-strapped architecture. Thus the ECU1-SWITCH1 failure combination would be counted in the PCSSTV cut-set analysis but not in the FCSSTV analysis. The cut-set analysis is one measure of robustness of architecture for failure modes beyond the one fault requirement. As expected, the architectures with full cross-strapping of components are having the fewest 2-fault failure combinations of the functional units.
Figure 8 Number of 2-fault combinations Figure 9 gives the probability contributions of each of the functional units in the modeled architectures. The figure also shows contributions for cables and connectors, and buses or switches, depending on the architecture. In all architectures, the flight computers are the largest contributor to system failure in the probability analysis. Therefore, improving the reliability of the flight computers would yield the greatest improvement in system reliability compared to other functional units. This graph depicts the rationale for choosing a highly reliable flight computer for a launch vehicle. In addition, the different distribution of the failure probability contribution from function units indicates different reliability improvement path for the architectures. For example, the contribution of switches appears to have much more impact for PCSSTV compared to FCSSTV and FCSSC. It should also be noted that the architectures used representative failure rates for each of the functional units but for actual implementations failure rates may differ based on component grade, screening, and other factors.
21
51
132
23 25
160
0
20
40
60
80
100
120
140
160
180
FCSSTV PCSSTV CBTV FCSSC FCSBSC CBSC
Number of 2‐fau
lt failure
combinations

HLV Avionics Flight Computing Architecture Study – 2011
21 of 88
Figure 9 The probability contributions of each of functional unit In summary, reliability analyses, including Reliability Block Diagram, Cut Set Analysis and Importance Analysis, were performed on the architectures selected. In order for comparison, the same failure rates were assumed for the same types of the functional units and the same failure criteria were applied to all the functional units. There is no significant difference observed between the selected voter and self-checking architectures at the first order, with significantly lower reliability for channelized voter and self-checking architectures. Different distributions of the failure probability contribution from function units indicates different reliability improvement path for the architectures. Additional details of the reliability analysis including failure rates, reliability diagrams and failure rate sensitivity analysis can be found in Appendix B: Reliability Analysis.
Data Network Harness Mass
For each of the architectures an analysis of potential data network harness mass was performed based on data bus lengths, connector and switch masses. The baseline analysis assumed a generic core stage inline heavy lift design with the similar core stage dimensions of the proposed Ares V heavy lift vehicle. This core stage incorporates an upper stage avionics ring; lower stage/aft skirt avionics ring; and a specific number of functional avionic units necessary for ascent to Low Earth Orbit (LEO). The functional units are listed in the Table 1. Lastly, no additional avionics or functional units for boosters or 2nd stage/payloads were considered for this analysis. During the analysis the functional units were positioned based on the Ares V functional avionic locations in both the upper and lower avionic rings. Each of the architectures analyzed used the same location for each functional unit to perform a comparative
0%
5%
10%
15%
20%
25%
30%
35%
40%
45%
BUS
CCDL
DAU
ECU FC
HCU
INU
MPS
PIC
RCS
RGA
Switch
TVC
Cables &
Connectors
FCSSTV PCSSTV CBTV FCSSC FCSBSC CBSC

HLV Avionics Flight Computing Architecture Study – 2011
22 of 88
analysis. The only difference was the wiring positions for cabling and the location of the switches. In order to determine mass for wiring lengths, an assumption was made to use 1000BASE-T Twisted-pair cabling (Cat-5, Cat-5e, Cat-6, or Cat-7) at a 100 meter max drive length for the architectures that utilized a switched network. The nominal weight for Cat-5e (1000Base-T) is 22 lbs/1000 feet was assumed. In addition, the second assumption was to use 1553 as the bus for the bussed architectures. The nominal weight for 1553 used in this study is 12.5 lbs/1000 feet. The nominal weight for a 1553 connector, .0289 lbs, and the weight of a 1553 coupler, 1.5 ounces (based on shuttle 1553 connectors and couplers specs), was used for the calculations. Once the cable lengths were determined for the architectures the weight was calculated using the respective ratios for switched and bussed networks. Results are shown in Figure 10.
Figure 10 Total data network harness mass contributions for each architecture In addition to determining the data network harness mass for the avionic architectures, the harness mass was determined as a percent of total harness mass for a representative HLV cable set (Upper Stage Instrument Unit, Aft Skirt Instrument Unit, and System Tunnel). The representative HLV cable set was based on Ares1 data and with a scaled systems tunnel due to its greater length. Using this approach a HLV cable set was estimated to be 1169 lbs. With this as the basis of total stage cable mass the percentages in Table 3 were computed for each architecture. More details of the mass analysis are shown in Appendix D: Mass Analysis
Architecture Data network percent of total cable set mass FCSSTV 9% PCSSTV 3.65% CBTV 1.69% FCSSC 4.86% FCSBSC 1.4% CBSC 2.4%
Table 3 Percentage of mass for the data network relative to total stage harness mass
0
20
40
60
80
100
120
FCSSTV PCSSTV CBTV FCSSC FCSBSC CBSC
Data Netw
ork Harness M
ass (LBS)

HLV Avionics Flight Computing Architecture Study – 2011
23 of 88
Power Analysis
In order to better understand the power consumption for each architecture, an analysis of total power was calculated based on the individual component (functional units, busses, and switches) energy requirements and the integration of those components. Table 4 displays the individual energy requirements for the components based on Ares I functional units, 1553 busses, and Ethernet switches.
Device Power (Watts)
RGA Rate Gyro Assembly 23
INU Inertial Navigation Unit 30
DAU Data Acquisition Unit 15
ECU Engine Control Unit 60
TVC Thrust Vector Controller 60
MPS Main Propulsion System 30
RCSC Reaction Control System Controller 87
PIC Pyro Initiation Controller 10
HCU Hydraulic Control Unit 365
FC Flight Computer 38
CCDL Cross Channel Data Link 18
I/F Interface Card 3
SW Switch size dependent
SW Port 1.5
Bus Port 3.6
Table 4. Power assumptions for functional units, buses, and switches. A straight forward power model was built using EXCEL. The model incorporated functions units, and switches or buses based on the architecture being modeled. Power was doubled for self-checking units. Switch and network interface power scaled with the number of ports required by the architecture. The computed power estimates for each architecture are shown in Figure 11. More detailed information for the power analysis is included in Appendix C: Power Analysis.
Figure 11. Power estimates for each flight computing architecture.
0250500750100012501500175020002250
FCSSTV PCSSTV CBTV FCSSC FCSBSC CBSC
Power Watts (Single Stage)

HLV Avionics Flight Computing Architecture Study – 2011
24 of 88
Redundancy Management Approaches
A survey of existing flight computing architectures was performed to examine the architectural, hardware, and software approaches to redundancy management. Six different architectures were studied that included both voting and self-checking approaches with varied levels of hardware/software implementation. Table 5 summarizes the information gathered on each of the architectures. More detailed information concerning the architectures surveyed is included in

HLV Avionics Flight Computing Architecture Study – 2011
25 of 88
Appendix E: Redundancy Management Approaches. Architecture Type Synchronization Flight Computer
Redundant Mgmt (FCRM)
Sensor Redundant Mgmt
X‐38 Quad Voter: Three Computers have Processing Elements(PE) and Network Element (NE) and 4
th only serves as
NE, Tested only in lab environment
HW & SW: NE implements protocols for synch of PEs by micro‐coded FPGAs
HW & SW: Bitwise voting of exchanged output data in Network Element, Fault Detection, Isolation, Recovery (FDIR) implemented in SW.
HW & SW: Bitwise voting of input data in Network Element, FDIR implemented in SW.
Shuttle’s GPC (General Purpose Computer)
Quad Voter: Fully cross‐strapped, complex bus configuration, 30 year maturity
SW: Multiple synch points at different cycle rates. This also serves as FCRM. Synch points have code/definition of fail‐to‐synch failure
SW: All based on synch points, Outputs not exchanged. Some LRUs compare data, some do not. Each LRU has a commanding GPC
No input data exchanged and compared, all GPCs get all data from all LRUs, SW mid‐value selects input data from redundant LRUs
Ares FC (Flight Computer)
Triplex Voter: ARINC 653 Processor; No cross‐strapping, in development stage
Synchronization can be performed either by Hardware Redundancy Management or Software Based Redundancy Management HW: FPGA design, using synch pulses via signals on CCDL interface, SW: Application Software provides synchronization via CCDL message exchanges.
HW:CCDL performs data exchanges, SW voting (bit‐for‐bit) ensures a faulty FC will be masked. Sufficient redundancy coupled with exchange protocol prevent CCDL fault propagation to multiple FCs.
HW & SW: Application software provides all Sensor Redundancy Management. Data exchanged in a three round exchange process between Flight Computers via CCDL.
Commercial System A
Self Checking Pair (SCP): Fully cross‐strapped.
HW: Opto‐isolated, clock driven
HW: Bit for bit compare, critical faults FDIR managed by HW, none critical faults IR is SW managed
Sensor Inputs RM outside FC system and SW mid‐value selects GNC data
Commercial System B
Triplex Voter: Fully cross‐strapped
SW: Synch points, SW waits for synch message from other processors, if no response, logs and continues. 2 consecutive errors, fail‐to‐synch
SW: Select set of data exchanged and compared. Voting masks FC single faults
SW: Sensor Inputs exchanged and compared

HLV Avionics Flight Computing Architecture Study – 2011
26 of 88
Langley SPIDER Scalable Voter: Fully scalable, Verified and Validated in lab environment and formally.
Fault‐tolerant message‐based synch protocol implement by the network.
HW: All RM is removed from main processing element into HW units: BIU (Bus Interface Unit) and RMU (Redundant Mgmt Unit).
HW: All Data Exchange, Compare, and Reconfiguration Management are within these units implemented by FPGA design.
Orion Dual SCP: Time‐Triggered Ethernet comm, Backup flight computer, designed for human‐rate spacecraft
Fault‐tolerant message‐based synch protocol implement by the network (Time Triggered Ethernet)
Two SCPs that fail passive. The first valid command is used by the network interface controllers.
Inputs exchanged and voted. No voting on end effectors.
Table 5 Summary of redundancy management approaches for existing architectures Of the systems surveyed, it was observed that the hardware/software boundary for synchronization and fault management functions varied widely from implementation to implementation. Competing design philosophies exist for both architectural approaches and the hardware/software boundary. For example hardware-based fault-diagnostics and synchronization can reduce software complexity but may increase hardware complexity and hinder the ability to easily make changes. Some argue limiting change in itself is an advantage. Others argue the contrary. The varied approaches to fault-tolerant computing indicate that multiple solutions can be reliably implemented, but the rationale of the architectural choices is unclear from this survey. As to the issue of what functions should be implemented in hardware versus software, this too is unclear. One suggestion from a system architect was to separate mechanisms from policy. For example detecting a fault may require a hardware mechanism such as a CRC check that requires hardware to be implemented in real-time for the fault detection operation; but the policy that defines what to do when a fault is detected is put in software. This is a logical boundary as it may be desirable to change policy in different applications or missions. For example on a crewed mission, abort may be appropriate after a second fault to ensure crew safety, but on a cargo mission degraded operation may be a more appropriate policy choice. Another observation from this survey was that fault detection, synchronization, fault-tolerant data exchanges, and other facets of redundancy management are non-trivial whether implemented in hardware or software. If not correctly implemented and verified through testing and analysis, failure of these systems can lead to common cause failure, potentially bringing down all flight computers. For these reasons it is desirable to leverage existing proven approaches and implementer’s with fault-tolerant computing experience. More information on the avionics systems studied can be found in Appendix E.
Conclusions
Six flight computing architecture were analyzed from reliability, fault-tolerance, mass, and power perspectives. All architectures, but one, appear to be reasonable approaches for a short duration launch vehicle mission although some did exhibit improved robustness over others for multi-fault scenarios. Power and mass difference in the

HLV Avionics Flight Computing Architecture Study – 2011
27 of 88
architectures were not significant drivers. From this analysis, reliability of the various architectures started to diverge significantly after about 20 days. This implies use of these architectures for longer duration missions would require further scrutiny. In an actual launch vehicle implementation, assumptions (failure rates, power, mass, etc) would require validation and full systems level reliability analysis would need to be performed to verify requirements.

HLV Avionics Flight Computing Architecture Study – 2011
28 of 88
Appendix A: Architecture Data Flows
Appendix A List of Figures Figure A‐ 1. Diagram of Fully Cross‐Strapped Self‐Checking Architecture ................................................................... 29 Figure A‐ 2. Flow diagram for data from input devices to FC1 .................................................................................... 30 Figure A‐ 3. Flow diagram for data from input devices to FC1 .................................................................................... 30 Figure A‐ 4. Voting Input Data at the FCs .................................................................................................................... 31 Figure A‐ 5. FC1 sends commands to the end effectors ............................................................................................... 31 Figure A‐ 6. FC 2 sends commands to the end effectors .............................................................................................. 32 Figure A‐ 7. The FCs communicate through the switches ............................................................................................ 32 Figure A‐ 8. Diagram of the Fully Cross‐Strapped Switched Voter ............................................................................... 33 Figure A‐ 9. FC1 data input flow .................................................................................................................................. 34 Figure A‐ 10. FC2 Data receipt ..................................................................................................................................... 34 Figure A‐ 11. FC to FC data exchange .......................................................................................................................... 35 Figure A‐ 12. Command data flow from FC1 ............................................................................................................... 35 Figure A‐ 13. Command data flow from FC2 ............................................................................................................... 36 Figure A‐ 14. Command data flow from FC3 ............................................................................................................... 36 Figure A‐ 15. Diagram of the Self Checking Cross‐Strapped Bus Master/Slave architecture ....................................... 37 Figure A‐ 16. Data input flow to FC1 ............................................................................................................................ 38 Figure A‐ 17. Data input flow to FC2 ............................................................................................................................ 38 Figure A‐ 18. Voting of received data .......................................................................................................................... 39 Figure A‐ 19. FC1 sends commands when it is Master ................................................................................................. 39 Figure A‐ 20. FC2 Sends commands when FC1 fails silent ........................................................................................... 40 Figure A‐ 21. Cross channel communications .............................................................................................................. 40 Figure A‐ 22. Diagram of the Partially Switched Triplex Voter .................................................................................... 41 Figure A‐ 23. Input data flow to FC1 ............................................................................................................................ 41 Figure A‐ 24. Input data flow to FC2 ............................................................................................................................ 42 Figure A‐ 25. FC to FC communication ......................................................................................................................... 42 Figure A‐ 26. Individual FCs process inputs and generate commands ........................................................................ 43 Figure A‐ 27. FCs exchange commands and then vote ................................................................................................ 43 Figure A‐ 28. Data Flow for commands to TVC1 .......................................................................................................... 44 Figure A‐ 29. Data Flow for Commands to TVC2 ......................................................................................................... 44 Figure A‐ 30. Bussed Triplex voter ............................................................................................................................... 45 Figure A‐ 31. Input Data Flow ...................................................................................................................................... 46 Figure A‐ 32. Data exchange via CCDL ......................................................................................................................... 46 Figure A‐ 33. Data processing and command generation. .......................................................................................... 47 Figure A‐ 34. Command exchange and voting ............................................................................................................ 47 Figure A‐ 35. Command data flow ............................................................................................................................... 48 Figure A‐ 36. Diagram of the Self‐Checking Channelized Architecture ........................................................................ 49 Figure A‐ 37. Data input to FC1 ................................................................................................................................... 49 Figure A‐ 38. Data Input to FC2 ................................................................................................................................... 50 Figure A‐ 39. Data exchange between FCs .................................................................................................................. 50 Figure A‐ 40. Data is internally voted by the FCs. ........................................................................................................ 51 Figure A‐ 41. Each FC processes data and generates commands ................................................................................ 51 Figure A‐ 42. FC1 command data flow......................................................................................................................... 52 Figure A‐ 43. FC2 command data flow......................................................................................................................... 52 Figure A‐ 44. Typical network topology. ...................................................................................................................... 53 Figure A‐ 45. Clock synch messages are periodically sent out. .................................................................................... 53 Figure A‐ 46. Interfaces perform mid‐value select on the three times......................................................................... 54 Figure A‐ 47. Redundancy Management Units perform mid‐value select on times. ................................................... 54

HLV Avionics Flight Computing Architecture Study – 2011
29 of 88
Figure A‐ 48. Flight computer data is forwarded to RMUs. ......................................................................................... 55 Figure A‐ 49. Values messages are forwarded to other flight computers. .................................................................. 55 Figure A‐ 50. Data from different paths is voted and the majority is sent on.............................................................. 56 This appendix includes diagrams and data flow descriptions to help illustrate how the different architectures function. In each case, if there is an existing system using this architecture, or a similar implementation, the system is identified and the functional description draws significantly from the way that system is operated.
Fully Cross-Strapped Self-Checking Architecture (Orion-like)
Figure A- 1. Diagram of Fully Cross-Strapped Self-Checking Architecture
The following assumptions apply to the architecture in Figure A-1; 1) Flight Computers (FC) are self-checking 2) Switches are self-checking 3) Only the controller in the input devices and end-effector controllers are self-checking, i.e.
Navigation Sensors are not duplicated in each INU and TVC actuators are not duplicated for TVC effectors
4) Data integrity on links is assumed to be by CRC (links are not duplicated and checked). 5) Only 2 switches are required since it is assumed that Switches
a) cannot corrupt a message in transit b) cannot generate a valid message on its own c) provide guardian against fault propagation from data source.
6) Switches can be used for reliable FC to FC communications. 7) Switches with network end-points are assumed to provide fault-tolerant synch capability (this
is consistent with the Orion approach) 8) DAUs are assumed to have self-checking or sufficient redundant sensor to ensure data
integrity in 1 of 2 operation.
Instruments/Sensors Effectors/Actuators
FC2FC1
Switch1Switch2
INU1
INU3
INU2
TVC1
TVC3
TVC2
DAU1
DAU2
ECU1
ECU2
RGA1 RGA3RGA2 HCU1 HCU2MPS2 PIC1RCS1 PIC2RCS2MPS1

HLV Avionics Flight Computing Architecture Study – 2011
30 of 88
Figure A- 2. Flow diagram for data from input devices to FC1
Data flow when FC1 reads data from an INU is shown in Figure A-2. Reading of data from each input device is performed sequentially by each FC. Data flow for input devices to FC2 is shown in Figure A-3. In Orion the INU values received at the switches are routed out to both FC1 and FC2, so both FC receive the same INU three values. If there are only 2 input devices (i.e. DAUs) it is assumed that 1 of 2 is needed therefore one DAU must supply sufficient knowledge to make a decision in the presence of fault. This can be accomplished with self-checking or triplex sensors within the DAU.
Figure A- 3. Flow diagram for data from input devices to FC1
HLV Avionics Flight Computing Architecture Study – 2011
31 of 88
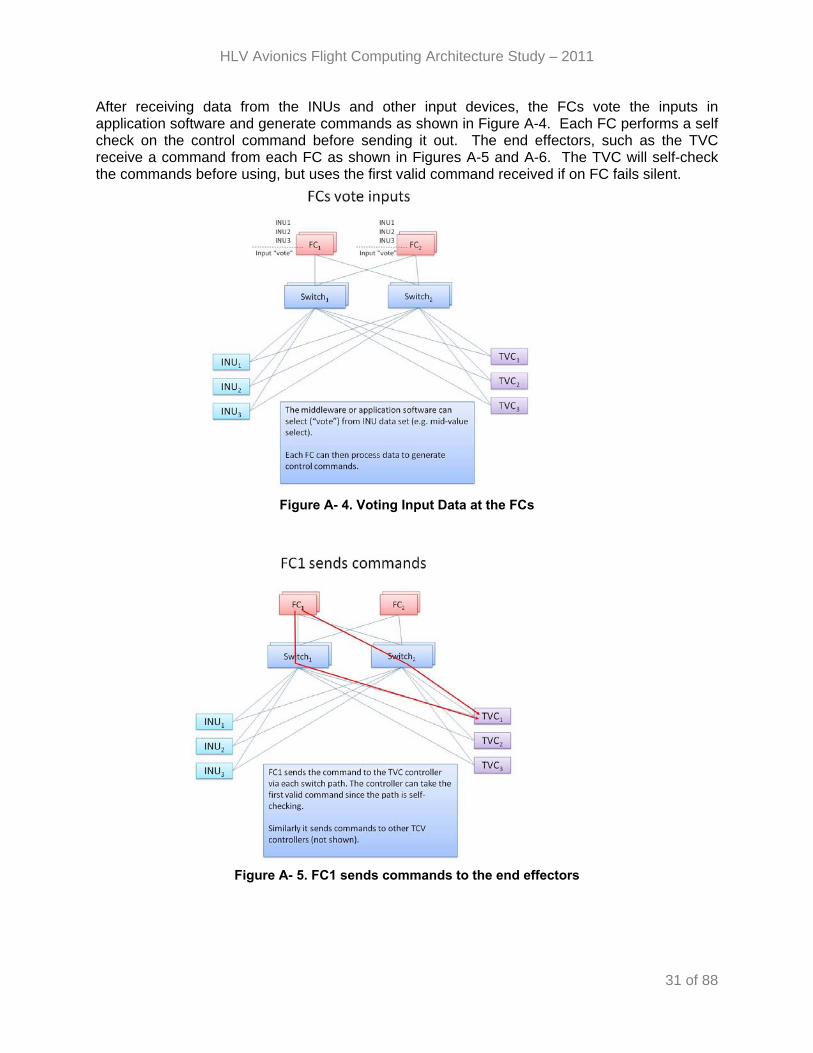
After receiving data from the INUs and other input devices, the FCs vote the inputs in application software and generate commands as shown in Figure A-4. Each FC performs a self check on the control command before sending it out. The end effectors, such as the TVC receive a command from each FC as shown in Figures A-5 and A-6. The TVC will self-check the commands before using, but uses the first valid command received if on FC fails silent.
Figure A- 4. Voting Input Data at the FCs
Figure A- 5. FC1 sends commands to the end effectors

HLV Avionics Flight Computing Architecture Study – 2011
32 of 88
Figure A- 6. FC 2 sends commands to the end effectors
The FCs communicate with each other through the switches. Both switches are used and the receiving FC can use the first valid data received since it cannot be modified by the switches and the switches are unable to generate valid messages on their own. See Figure A-7 for an illustration of this communication.
Figure A- 7. The FCs communicate through the switches

HLV Avionics Flight Computing Architecture Study – 2011
33 of 88
Fully Cross-Strapped Switched Voter
Figure A- 8. Diagram of the Fully Cross-Strapped Switched Voter
The following assumptions apply to the architecture shown in Figure A-8;
1) Input voting occurs at FCs 2) Output voting occurs at the effector’s controller 3) Switches may corrupt a message or generate an invalid message 4) Some switch guardian functionality is required to ensure a single input device cannot
render all switches non-functional by continuously sending messages or babbling. This can be addressed by connecting each input to only 2 switches, but the same problem can exist on the FC side. From a practical stand point a separate Cross Channel Data Link (CCDL) may be desired to address this issue as well as synch.
5) Two round interactive consistency exchanges assumed 6) Synch performed with switches and FCs (may be desirable to have separate CCDL, see
note 4) Data is received from input devices through each switch. This means that FC1 gets three INU1 data messages, one from each switch. FC2 and FC3 also receive three messages from each switch. This is illustrated in Figures A-9 and A-10. Once all the data messages are received, the data is voted internally by the FCs. Since each FC has paths to each INU or other data input device, there is not a requirement for cross-channel data exchange between FCs on input data.
Instruments/Sensors Effectors/Actuators
FC2FC1
Switch1Switch3
INU1
INU3
INU2
TVC1
TVC3
TVC2
DAU1
DAU2
ECU1
HCU1MPS1
ECU2
HCU2MPS2RGA1 RGA3RGA2
Switch2
PIC1RCS1 PIC2RCS2
FC3

HLV Avionics Flight Computing Architecture Study – 2011
34 of 88
Figure A- 9. FC1 data input flow
Figure A- 10. FC2 Data receipt
Once the data is voted it can be exchanged between the FCs through the switches to implement a CCDL for interactive consistency. Likewise, after commands are formulated, they will also be exchanged prior to sending out in order to provide a consistent command from all three FCs. In this case, since simpler switches are assumed, not high integrity switches, it may be desirable to implement a separate high integrity CCDL between the FCs for data exchange.

HLV Avionics Flight Computing Architecture Study – 2011
35 of 88
Figure A- 11. FC to FC data exchange
After the commands are formulated and the necessary exchanges are performed, the commands are sent to the end effectors via all three switches, as shown in Figures A-12 and A-13. The commands received are can be voted by the end effectors as long as two of three consistent commands are received.
Figure A- 12. Command data flow from FC1

HLV Avionics Flight Computing Architecture Study – 2011
36 of 88
Figure A- 13. Command data flow from FC2
Figure A- 14. Command data flow from FC3

HLV Avionics Flight Computing Architecture Study – 2011
37 of 88
Self Checking Cross-Strapped Bus Master/Slave Architecture (Atlas-like)
Figure A- 15. Diagram of the Self Checking Cross-Strapped Bus Master/Slave architecture The assumptions for the architecture shown in Figure A-15 are as follows;
1) FCs are self checking 2) No self checking in controllers 3) Data integrity on links is assumed to be by CRC (links are not duplicate and checked). 4) FC to FC communication is through the CCDL and not the busses. 5) DAUs are assumed to have sufficient redundant sensor to ensure data integrity in 1 of 2
operation. 6) Bus A and Bus B both carry data and commands to end effectors during nominal
operations. 7) Miscompare or other critical fault causes FC1 or FC2 to fail itself. If FC1 fails,
switchover to FC2 occurs. Cannot switch back to FC1, even if fault is transient. 8) CCDL data includes FC health/state data for telemetry (both transmit to the other),
timing and sequence phase, specific parameters related to flight control. These are updated each minor frame. Vehicle attitude and navigation data is NOT included.
The Master FC, always starts as FC1, communicates with the data input devices over both of the busses, while FC2 monitors the bus for the received data. FC2 is in hot backup and receives the same data as FC1 from the data input devices. Internally, FC2 believes it is controlling the communication bus as it is operating in a hot standby configuration with its BIU transmitter disabled as long as FC1 is operating nominally with no mis-compares. As shown in Figures A-16 and A-17, FC1 can communicate with input devices over both busses and may use one bus exclusively for a particular input device, unless that bus fails.
Instruments/Sensors Effectors/Actuators
Self Checking Cross‐Strapped Bus Master/Slave Architecture
FC2FC1
INU1
INU3
INU2
TVC1
TVC3
TVC2
DAU1
DAU2
ECU1
ECU2
RGA1 RGA3RGA2 HCU1 HCU2MPS2 PIC1RCS1 PIC2RCS2MPS1
CCDL
Primary Secondary
BUS A
BUS B

HLV Avionics Flight Computing Architecture Study – 2011
38 of 88
For instance, with fault free busses, INU1 nominally communicates over Buss A. INU2 would communicate over Bus B and INU3 would communicate over either Bus A or Bus B with a selection to divide overall system communication between the two.
Figure A- 16. Data input flow to FC1
Figure A- 17. Data input flow to FC2
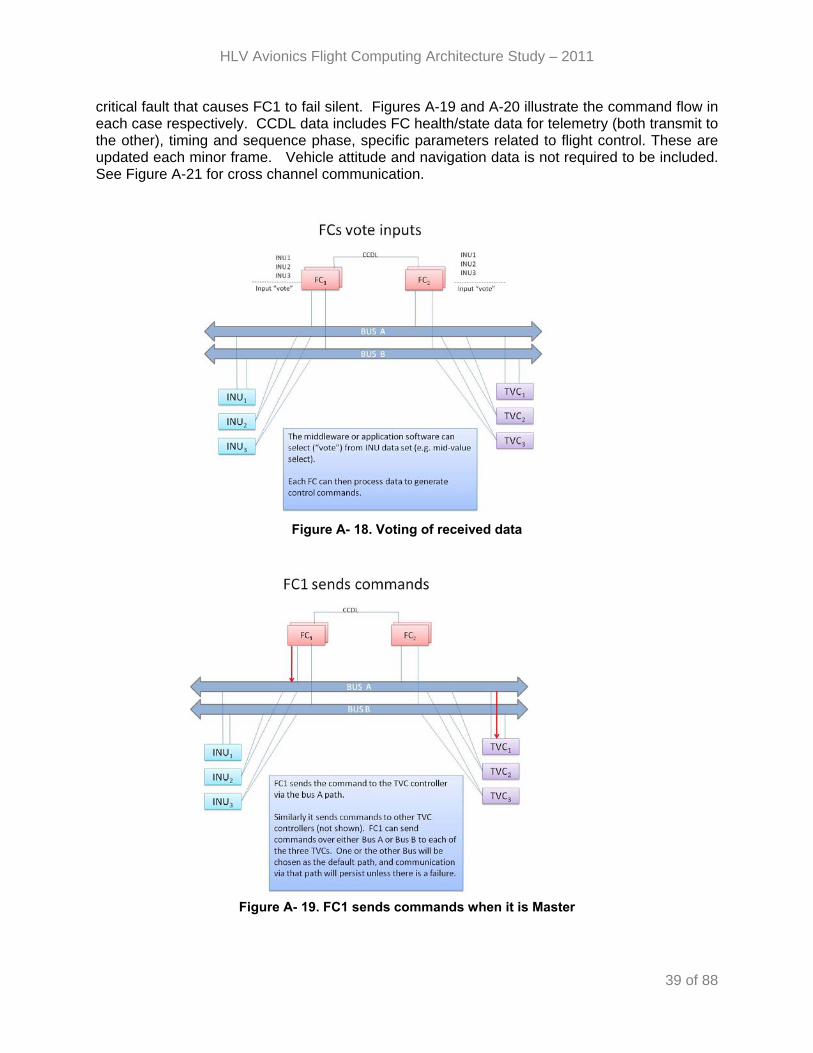
Once all the input data is received each FC votes the inputs internally and performs a self check of the results (see Figure A-18). In a fault free case, FC1 is the master and sends out the commands if they pass the internal self check. FC2 only sends commands in the event of a
HLV Avionics Flight Computing Architecture Study – 2011
39 of 88
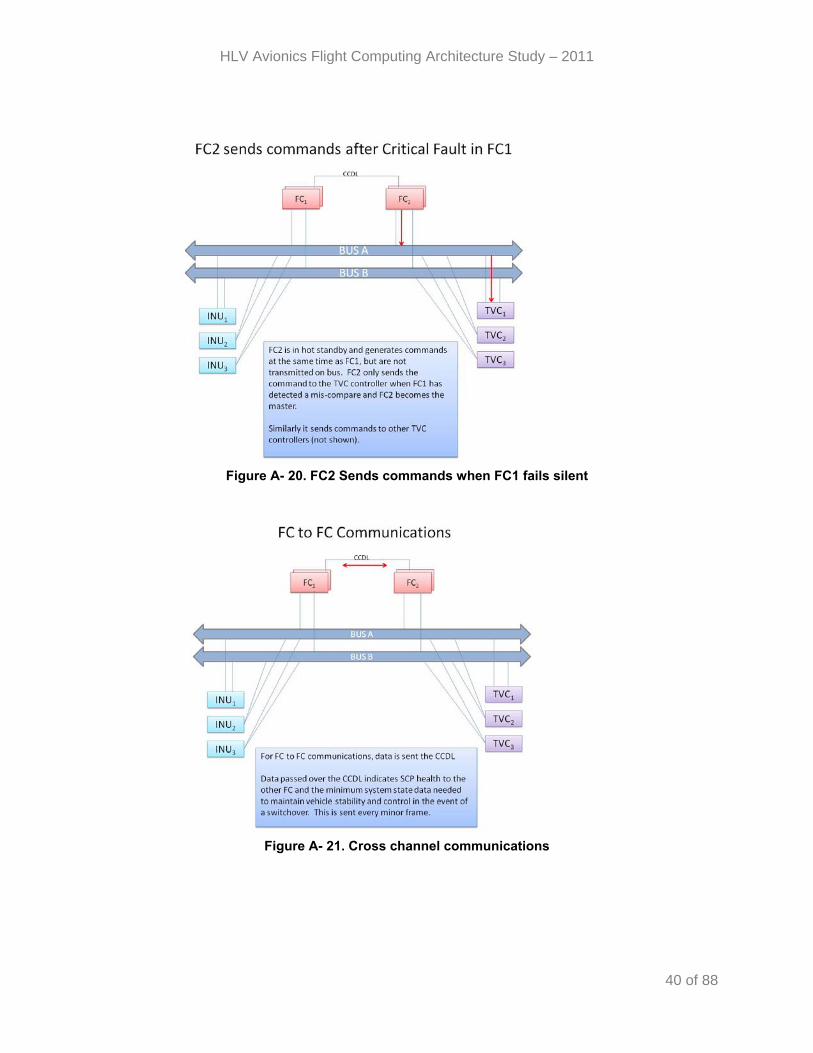
critical fault that causes FC1 to fail silent. Figures A-19 and A-20 illustrate the command flow in each case respectively. CCDL data includes FC health/state data for telemetry (both transmit to the other), timing and sequence phase, specific parameters related to flight control. These are updated each minor frame. Vehicle attitude and navigation data is not required to be included. See Figure A-21 for cross channel communication.
Figure A- 18. Voting of received data
Figure A- 19. FC1 sends commands when it is Master
HLV Avionics Flight Computing Architecture Study – 2011
40 of 88
Figure A- 20. FC2 Sends commands when FC1 fails silent
Figure A- 21. Cross channel communications

HLV Avionics Flight Computing Architecture Study – 2011
41 of 88
Partially Switched Triplex Voter
Figure A- 22. Diagram of the Partially Switched Triplex Voter
The assumptions for the architecture depicted in Figure A-22 are;
1) Input voting occurs at FCs 2) Output voting occurs at the FCs 3) Communication between FCs and end items uses CRCs that are not affected by
processing through the switches 4) Switches cannot generate commands 5) Two round interactive consistency exchanges assumed 6) FC to FC communication is through switches, there is no additional CCDL 7) Communication through switches is rate constrained or some other guardian
functionality to prevent loss of communication due to a babbling end item.
Figure A- 23. Input data flow to FC1
Instruments/Sensors Effectors/Actuators
FC2FC1
Switch1Switch2
INU1
INU3
INU2
TVC1
TVC3
TVC2
DAU1
DAU2
ECU1
HCU1MPS1
ECU2
HCU2MPS2RGA1 RGA3RGA2PIC1RCS1 PIC2RCS2
FC3
Switch3

HLV Avionics Flight Computing Architecture Study – 2011
42 of 88
The data from input devices is read through the switch to which it is connected. All FCs have access to each of the three switches. See Figure A-23 and A-24 for examples of data flow from input devices to the FCs. Two round data exchange is used to ensure consistency. The FCs use the connections through the switches for data exchange and synchronization as shown in Figure A-25.
Figure A- 24. Input data flow to FC2
Figure A- 25. FC to FC communication

HLV Avionics Flight Computing Architecture Study – 2011
43 of 88
Figure A- 26. Individual FCs process inputs and generate commands
After the data exchange, the individual FCs process the data and generate commands. The commands must be exchanged and voted (See Figures A-26 and A-27). The voted commands are sent to the end effector controllers via the switch connected to that controller. Each one receives three commands, one from each computer. As shown in Figures A-28 and A-29, the end effector controllers can use the first valid command received since the FCs voted the outputs prior to sending them.
Figure A- 27. FCs exchange commands and then vote

HLV Avionics Flight Computing Architecture Study – 2011
44 of 88
Figure A- 28. Data Flow for commands to TVC1
Figure A- 29. Data Flow for Commands to TVC2

HLV Avionics Flight Computing Architecture Study – 2011
45 of 88
Bussed Triplex Voter (vote at FCs) Ares/Delta-like For the architecture depicted in A-30, the following assumptions apply
1) Input voting occurs at FCs 2) Output voting occurs at the FCs 3) Two round interactive consistency exchanges assumed 4) Data exchange and synchronization is performed through the CCDL 5) Integrity of commands must be ensured with a CRC and other mechanisms (i.e.
sequence number, timestamp, source id, etc) after the output vote.
Figure A- 30. Bussed Triplex voter
For input data, each FC communicates only with the data input device connected to the bus it controls (See Figure A-31). The received data is exchanged through the CCDL so each FC has a copy of all received data and it is verified all FCs are using the same data. This is shown in Figure A-32. The data is voted by the individual FCs after the exchange
INU1 INU3INU2
TVC3 TVC1TVC2
ECU2ECU1
DAU2
HCU1 HCU2
MPS2
PIC1
RCS1
PIC2
RCS2
MPS1
CCDL
RGA2 RGA3RGA1
BUS
BUS
BUS
FC2FC1 FC3
DAU1
p

HLV Avionics Flight Computing Architecture Study – 2011
46 of 88
Figure A- 31. Input Data Flow
Figure A- 32. Data exchange via CCDL

HLV Avionics Flight Computing Architecture Study – 2011
47 of 88
Figure A- 33. Data processing and command generation.
After the data is voted and processed internally, each FC generates a command. The commands are exchanged via CCDL and voted internally after it is verified each FC has the same set of commands. Figures A-33 and A-34 show this data flow. Figure A-35 depicts the flow of commands from each FC to the end effectors on the data bus they control.
Figure A- 34. Command exchange and voting

HLV Avionics Flight Computing Architecture Study – 2011
48 of 88
Figure A- 35. Command data flow
Self Checking Channelized Architecture The assumptions for the architecture depicted in Figure A-36 are as follows;
1) FCs are self checking 2) Self checking in controllers 3) Dual buses send two copies of data 4) FC to FC communication is through the CCDL and not the busses. 5) DAUs are assumed to have sufficient redundant sensor to ensure data integrity in 1 of 2
operation.

HLV Avionics Flight Computing Architecture Study – 2011
49 of 88
Figure A- 36. Diagram of the Self-Checking Channelized Architecture
The FCs communicate with data input devices that are connected to the busses they control. Each FC controls a dual redundant bus, and can only communicate with end items on the bus it controls. The data input flow for FC1 and FC2 are shown in Figure A-37 and A-38. The FCs do not have access to all three data input devices. FC1 can communicate with INU1 and INU2 only. FC2 can communicate with INU2 and INU3 only.
Figure A- 37. Data input to FC1

HLV Avionics Flight Computing Architecture Study – 2011
50 of 88
Figure A- 38. Data Input to FC2
Figure A- 39. Data exchange between FCs
The FCs exchange data via a cross channel data link to provide each FC with a copy of all the data received. Once each FC has a copy of all the data, each FC votes the input data. This data flow is shown in Figure A-39 and A-40

HLV Avionics Flight Computing Architecture Study – 2011
51 of 88
Figure A- 40. Data is internally voted by the FCs.
Each FC then processes the data and generates commands. The commands are self-checked by each FC before sending out to the end effector controllers. The FCs do not exchange commands. Command data flow is depicted in Figure A-42 and A-43. FC1 sends commands to TVC1 and TVC2. FC2 Sends commands to TVC2 and TVC3. Since TVC2 gets commands from both FCs, it can choose to use the first valid set of commands received. The end effector controllers self check commands received from the bus when two valid commands are received. The controllers will accept a valid command from one bus if the other communication path has failed.
Figure A- 41. Each FC processes data and generates commands

HLV Avionics Flight Computing Architecture Study – 2011
52 of 88
Figure A- 42. FC1 command data flow
Figure A- 43. FC2 command data flow

HLV Avionics Flight Computing Architecture Study – 2011
53 of 88
Cross Channel Data Link (CCDL) Functionality This section describes the typical data transfer and synchronization capability of a Cross Channel Data Link (CCDL). The depicted transfers represent an architecture and protocol that would be fault-tolerant for one asymmetric fault.
Clock Synchronization Transfers
Figure A- 44. Typical network topology.
Figure A- 45. Clock synch messages are periodically sent out.
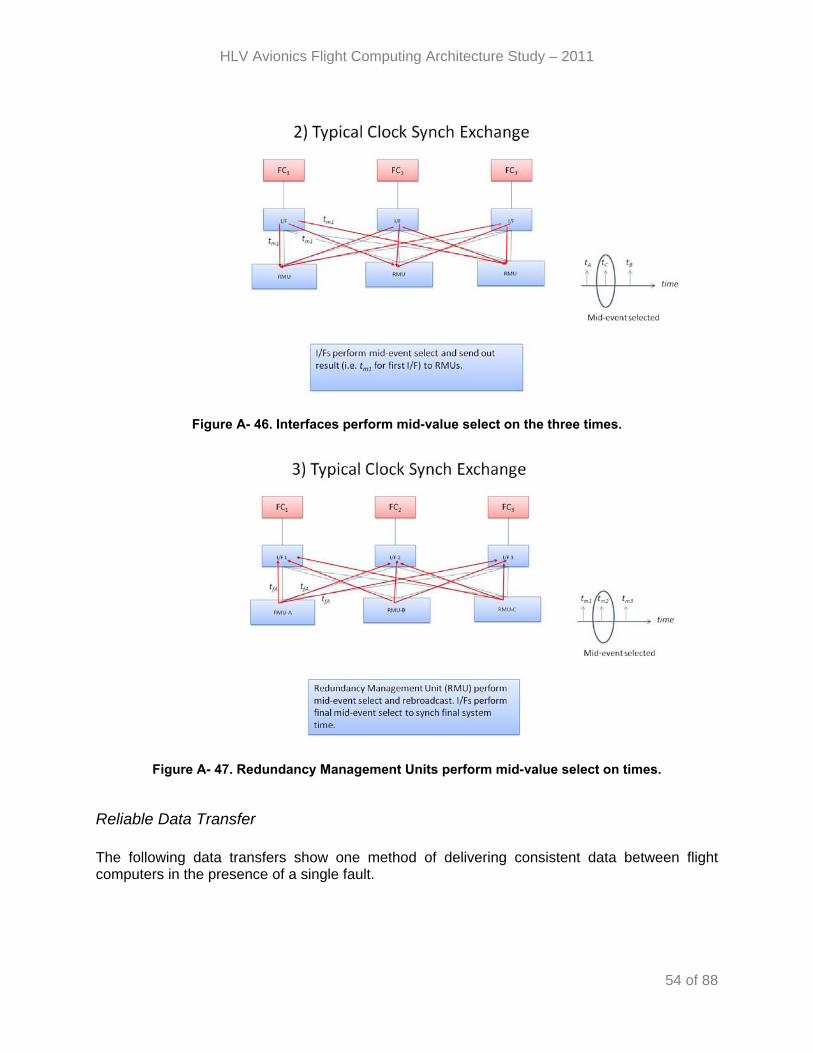
HLV Avionics Flight Computing Architecture Study – 2011
54 of 88
Figure A- 46. Interfaces perform mid-value select on the three times.
Figure A- 47. Redundancy Management Units perform mid-value select on times.
Reliable Data Transfer The following data transfers show one method of delivering consistent data between flight computers in the presence of a single fault.

HLV Avionics Flight Computing Architecture Study – 2011
55 of 88
Figure A- 48. Flight computer data is forwarded to RMUs.
Figure A- 49. Values messages are forwarded to other flight computers.

HLV Avionics Flight Computing Architecture Study – 2011
56 of 88
Figure A- 50. Data from different paths is voted and the majority is sent on.

HLV Avionics Flight Computing Architecture Study – 2011
57 of 88
Appendix B: Reliability Analysis
Appendix B List of Figures Figure B‐ 1. FCSSTV without Cable ............................................................................................................................... 60 Figure B‐ 2. FCSSTV with Cable .................................................................................................................................... 60 Figure B‐ 3. PCSSTV without Cable ............................................................................................................................... 61 Figure B‐ 4. PCSSTV with Cable .................................................................................................................................... 62 Figure B‐ 5. CBTV without Cable .................................................................................................................................. 63 Figure B‐ 6. CBTV with Cable........................................................................................................................................ 64 Figure B‐ 7. FCSSC without Cable ................................................................................................................................. 65 Figure B‐ 8. FCSSC with Cable ...................................................................................................................................... 65 Figure B‐ 9. FCSBSC without Cable ............................................................................................................................... 66 Figure B‐ 10. FCBSC with Cable .................................................................................................................................... 67 Figure B‐ 11. CBSC without Cable ................................................................................................................................ 68 Figure B‐ 12. CBSC with Cable ...................................................................................................................................... 68 Figure B‐ 13. Number of Cut Sets per Architecture without Cabling ............................................................................ 70 Figure B‐ 14. Functional Element Unreliability Contribution using F‐V Measure ......................................................... 72
Appendix B List of Tables Table B‐ 1. Failure Rates of the Functional Units ......................................................................................................... 58 Table B‐ 2. FCSSTV Results Table ................................................................................................................................. 61 Table B‐ 3. PCSSTV Results Table ................................................................................................................................. 62 Table B‐ 4. CBTV Results Table ..................................................................................................................................... 64 Table B‐ 5. FCSSC Results Table ................................................................................................................................... 66 Table B‐ 6. FCSBSC Results Table ................................................................................................................................. 67 Table B‐ 7. CBSC Results Table ..................................................................................................................................... 69 Table B‐ 8. Summary of RBD results ............................................................................................................................ 69 Table B‐ 9. Reliability for Architectures without Cabling Compared to Number of Cut Sets ........................................ 70 Table B‐ 10. Example of Component Grouping for Importance Measure Comparison ................................................ 71
Reliability Analysis Scope This Appendix documents the reliability engineering methodology developed for reliability comparison and reliability improvement recommendations on the flight computing architectures for heavy lift launch vehicles. The reliability analyses performed in this study include Reliability Block Diagram analysis, Cut Set Analysis, and Importance Analysis.
Reliability Assumptions Failure Rates: The failure rates for the functional units in the architectures were estimated based on the existing reliability databases of the avionics systems. The same failure rates were assumed for the same type of functional units, interconnects, and topologies for the six architectures. Table B-1 summarizes the failure rates used for this reliability study.

HLV Avionics Flight Computing Architecture Study – 2011
58 of 88
Unit Acronym & Name Failure Rate (λ)@ 1-HR Data Bus (1553) 1.26E-07
DAU-Data Acquisition Unit 1.67E-05
ECU-Engine Control Unit 4.18E-05
FC-Flight Computer 3.33E-05 HCU-Hydraulic Control Unit 4.00E-05
INU-Inertial Navigation Unit 2.00E-05 MPS-Main Propulsion System 1.25E-05 PIC-Pyro Initiation Controller 5.00E-05
RCSC-Reaction Control System Controller
1.25E-05
RGA-Rate Gyro Assembly 2.00E-05 TVC-Thrust Vector Controller 2.00E-06
Switch 5.04E-06 CCDL 2.00E-06 Self-Checking logic 1.00E-06
Cables + 2 38999 Connectors 1.30E-06
Table B- 1. Failure Rates of the Functional Units
Fault tolerance: The reliability analysis assumed one fault tolerance for all function unit groups, namely more than one failure in any single type of functional unit group was deemed to be a system failure. For example, more than one of the three INUs or more than one of the two DAU would result in a system failure. In addition, only hard or non-recoverable failures of the functional units were considered in the analysis. Self-checking Pair Configuration: It was assumed that, for the flight computers or switches or buses, the self-checking pair consists of two flight computers or two switches or two buses. For other functional units, self-checking pair was assumed to consist of one functional unit plus a self-checking logic. Mission Duration: The reliability analysis was performed for a time period of up to nine months for mission scenarios that could potentially require an Earth departure stage that would require long mission duration.
Reliability Block Diagram Analysis A Reliability Block Diagram (RBD) is a pictorial representation of a system’s reliability performance. The RBD demonstrates a logical connection of (functioning) assemblies needed for system success. The assemblies are comprised of multiple components. The particular assemblies identified by the RBD blocks identify system operational functions. The RBDs created for the flight computing architecture systems are assumed to be non-repairable and reflect system success dependant on one or more assemblies. The connections of these blocks reflect the logical behavior of the system. The RBD model does not demonstrate physical configuration, cannot predict mass, does not estimate power consumption, and cannot guarantee the reliability values demonstrated are capable of being achieved.

HLV Avionics Flight Computing Architecture Study – 2011
59 of 88
The flight computing architecture RBD predictions take into account the objectives and related engineering defined aspects of each system configuration without assessment of risk, but, from an assessment of operational success. The RBD is assembled in a success path for the system. The series representation indicates a system in which each block is dependent upon the success of the system. Parallel block configurations indicate a group of blocks that provide active redundancy or standby redundancy. RELEX© was used as the primary reliability modeling tool. The various flight computing architectures were modeled into different RBD configurations using the failure rates as identified in Table B1. By using the same failure rates, the only variance in results would be due to the RBD configurations identifying the variant in configuration of the architectures. This allows for a normalized comparison of the architectures. In the RELEX© model the operation simulation (OpSim) model was used to depict the RBD’s. Results were calculated using Monte-Carlo simulation with 1,000,000 iterations. Confidence level was set at 95%. The time periods for these data analysis was provided as 12-minutes, 24-hours, and 9-months (6480-hours).
Cable Modeling in the Flight Computing Architecture RBD The different architectures were modeled with and without cabling as part of the RBD analysis. The request to model cabling was made in order to identify a potential difference when cabling is installed into the models. The cable input to the component or assembly was modeled as having their own (individual) failure properties. The cabling assembly RBD block was assumed to be comprised of the cable, supports, and connectors. The cable assembly was assumed to be routed from the source to the destination individually.
Fully Cross-Strapped Switched Triplex Voter (FCSSTV) RBD The depiction of the FCSSTV RBD was made without cabling (Figure B-1) and with cabling (Figures B-2). The FCSSTV RBD identifies that the three flight computers (FC-1, FC-2, and FC-3) are configured in a 2-of-3 redundancy configuration, which would mean that any 2 of the 3 flight computers must be operational. The flight computers utilize a multiple 2 of the 3 switch configuration for success of the system. The remaining components or assemblies are arranged in a 1-of-2 or 2-of-3 configurations depending on the number of available units.

HLV Avionics Flight Computing Architecture Study – 2011
60 of 88
Figure B- 1. FCSSTV without Cable
Figure B- 2. FCSSTV with Cable

HLV Avionics Flight Computing Architecture Study – 2011
61 of 88
The analysis results indication the results for FCSSTV RBD in Table B-2.
Architecture R (12 min) R (24 hrs) R (9 months) FCSSTV without Cable 0.99999999951 0.999993 0.667433 FCSSTV with Cable 0.99999999951 0.999993 0.666999
Table B- 2. FCSSTV Results Table
Partially Cross-Strapped Switched Triplex Voter (PCSSTV) RBD The depiction of the PCSSTV RBD was made without cabling (Figures B-3) and with cabling (Figures B-4). The PCSSTV RBD the three flight computers (FC-1, FC-2, and FC-3) are configured in a 2-of-3 redundancy configuration, which would mean that any 2 of the 3 flight computers must be operational. The flight computers utilize an individual 3 switch configuration. Each switch is dedicated to a separate group of assemblies or components. The remaining components or assemblies are arranged in a 1-of-2 or 2-of-3 configuration depending on the number of available units.
Figure B- 3. PCSSTV without Cable

HLV Avionics Flight Computing Architecture Study – 2011
62 of 88
Figure B- 4. PCSSTV with Cable
The analysis results indication the results for PCSSTV RBD in Table B-3.
Architecture R (12 min) R (24 hrs) R (9 months) PCSSTV without Cable 0.99999999939 0.999991 0.629892 PCSSTV with Cable 0.99999999939 0.999991 0.613596
Table B- 3. PCSSTV Results Table
Channelized Bussed Triplex Voter (CBTV) RBD The depiction of the CBTV RBD was made without cabling (Figures B-5) and with cabling (Figures B-6). The CBTV RBD identifies that the three flight computers (FC-1, FC-2, and FC-3) connected directly to three Cross Channel Data Links (CCDL-1, CCDL-2, and CCDL-3) and three Data Bus assemblies (Bus-A, Bus-B, and Bus-C) respectfully. The FC-CCDL-BUS assemblies are configured to a dedicated group of assemblies or components. The components or assemblies are arranged in a 1-of-2 or 2-of-3 configuration depending on the number of units.

HLV Avionics Flight Computing Architecture Study – 2011
63 of 88
Figure B- 5. CBTV without Cable

HLV Avionics Flight Computing Architecture Study – 2011
64 of 88
Figure B- 6. CBTV with Cable The analysis results indication the results for CBTV RBD in Table B-4.
Architecture R (12 min) R (24 hrs) R (9 months) CBTV without Cable 0.99999999856 0.999981 0.482388 CBTV with Cable 0.99999999856 0.999979 0.464581
Table B- 4. CBTV Results Table
Fully Cross-Strapped Switched Self-Checking (FCSSC) RBD The depiction of the FCSSC RBD was made without cabling (Figures B-7) and with cabling (Figure B-8). The FCSSC RBD identifies that two pairs of flight computers (FC-1 to FC-3 and FC-2 to FC-4) and Cross-Channel Link (CCDL) are connected in parallel. The bus switch units are connected to a redundant set of bus switches. The flight computers assemblies and bus switch are configured to a dedicated group of assemblies or components. The components or assemblies are arranged in a 1-of-2 or 2-of-3 configuration depending on the number of units.

HLV Avionics Flight Computing Architecture Study – 2011
65 of 88
Figure B- 7. FCSSC without Cable
Figure B- 8. FCSSC with Cable

HLV Avionics Flight Computing Architecture Study – 2011
66 of 88
The analysis results indication the results for FCSSC RBD in Table B-5.
Architecture R (12 min) R (24 hrs) R (9 months) FCSSC without Cable 0.99999999946 0.999992 0.648662 FCSSC with Cable 0.99999999946 0.999992 0.648547
Table B- 5. FCSSC Results Table
Fully Cross-Strapped Bussed Self-Checking (FCSBSC) RBD The depiction of the FCSBSC RBD was made without cabling (Figures B-9) and with cabling (Figures B-10). The FCSBSC RBD identifies that two pairs of flight computers (FC-1 to FC-3 and FC-2 to FC-4) and Cross-Channel Link (CCDL) are connected in parallel. The flight computer units are connected to a redundant bus. The flight computers assemblies and bus are configured to a dedicated group of assemblies or components. The components or assemblies are arranged in a 1-of-2 or 2-of-3 configuration depending on the number of units.
Figure B- 9. FCSBSC without Cable

HLV Avionics Flight Computing Architecture Study – 2011
67 of 88
Figure B- 10. FCBSC with Cable
The analysis results indication the results for FCSBSC RBD in Table B-6.
Architecture R (12 min) R (24 hrs) R (9 months) FCSBSC without Cable 0.99999999946 0.999992 0.646862 FCSBSC with Cable 0.99999999946 0.999992 0.646730
Table B- 6. FCSBSC Results Table
Channelized Bussed Self-Checking (CBSC) RBD The depiction of the CBSC RBD was made without cabling (Figures B-11) and with cabling (Figure B-12). The CBSC RBD identifies that two pairs of flight computers (FC-11 & FC-12 and FC-21 & FC-22) each dependant on a Cross-Channel Link (CCDL) and two Data Buses. The flight computers, CCDL and bus are configured to a dedicated group of assemblies or components. The components or assemblies are arranged in a 1-of-2 or 2-of-3 configuration depending on the number of units.

HLV Avionics Flight Computing Architecture Study – 2011
68 of 88
Figure B- 11. CBSC without Cable
Figure B- 12. CBSC with Cable
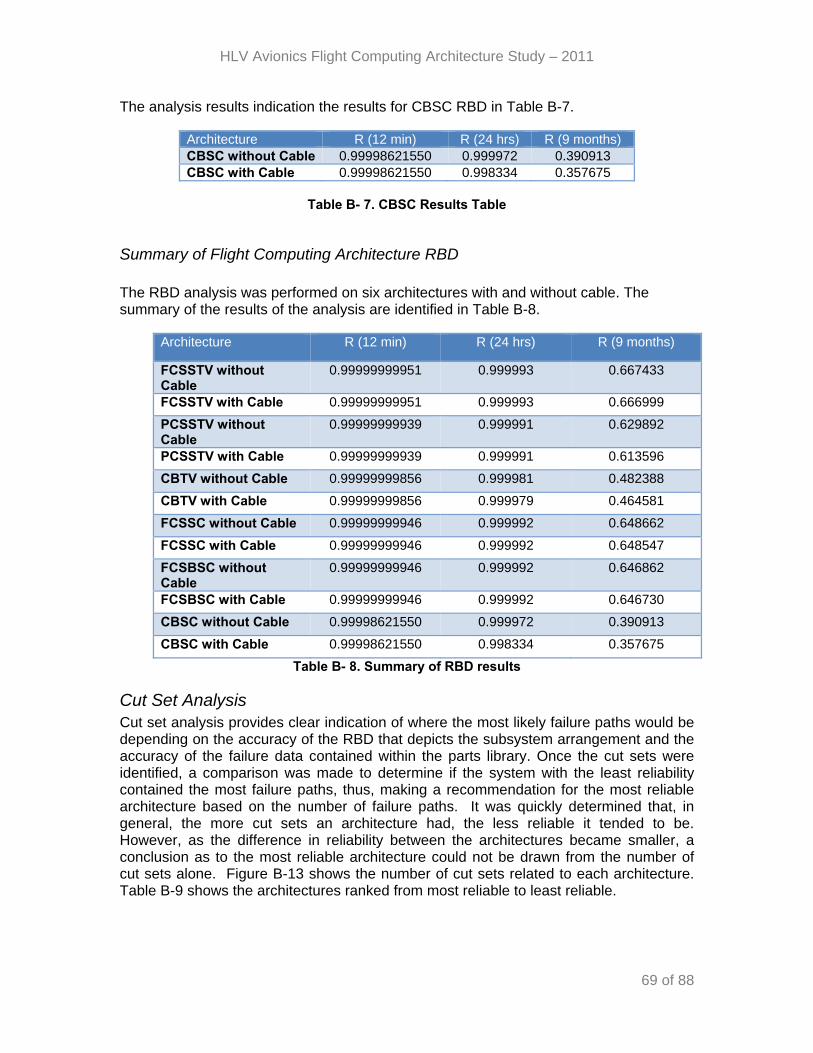
HLV Avionics Flight Computing Architecture Study – 2011
69 of 88
The analysis results indication the results for CBSC RBD in Table B-7.
Architecture R (12 min) R (24 hrs) R (9 months) CBSC without Cable 0.99998621550 0.999972 0.390913 CBSC with Cable 0.99998621550 0.998334 0.357675
Table B- 7. CBSC Results Table
Summary of Flight Computing Architecture RBD
The RBD analysis was performed on six architectures with and without cable. The summary of the results of the analysis are identified in Table B-8.
Architecture R (12 min) R (24 hrs) R (9 months)
FCSSTV without Cable
0.99999999951 0.999993 0.667433
FCSSTV with Cable 0.99999999951 0.999993 0.666999
PCSSTV without Cable
0.99999999939 0.999991 0.629892
PCSSTV with Cable 0.99999999939 0.999991 0.613596
CBTV without Cable 0.99999999856 0.999981 0.482388
CBTV with Cable 0.99999999856 0.999979 0.464581
FCSSC without Cable 0.99999999946 0.999992 0.648662
FCSSC with Cable 0.99999999946 0.999992 0.648547
FCSBSC without Cable
0.99999999946 0.999992 0.646862
FCSBSC with Cable 0.99999999946 0.999992 0.646730
CBSC without Cable 0.99998621550 0.999972 0.390913
CBSC with Cable 0.99998621550 0.998334 0.357675
Table B- 8. Summary of RBD results
Cut Set Analysis Cut set analysis provides clear indication of where the most likely failure paths would be depending on the accuracy of the RBD that depicts the subsystem arrangement and the accuracy of the failure data contained within the parts library. Once the cut sets were identified, a comparison was made to determine if the system with the least reliability contained the most failure paths, thus, making a recommendation for the most reliable architecture based on the number of failure paths. It was quickly determined that, in general, the more cut sets an architecture had, the less reliable it tended to be. However, as the difference in reliability between the architectures became smaller, a conclusion as to the most reliable architecture could not be drawn from the number of cut sets alone. Figure B-13 shows the number of cut sets related to each architecture. Table B-9 shows the architectures ranked from most reliable to least reliable.

HLV Avionics Flight Computing Architecture Study – 2011
70 of 88
Figure B- 13. Number of Cut Sets per Architecture without Cabling
Architecture R (12 min) R (24 hrs) R (9 months) # Cut Sets
FCSSTV 0.99999999951 0.999993 0.666999 21
FCSSC 0.99999999946 0.999992 0.648547 23
FCSBSC 0.99999999946 0.999992 0.646730 25
PCSSTV 0.99999999939 0.999991 0.613596 51
CBTV 0.99999999956 0.999979 0.464581 132
CBSC 0.99998621550 0.998334 0.357675 160
Table B- 9. Reliability for Architectures without Cabling Compared to Number of Cut Sets
Importance Analysis In order to identify the individual component’s contribution to the unavailability of the system, the components were ranked using importance measure values. There are several different importance measures that can be used. The importance measure value method used for this analysis was the Fussell-Vesely method. The Fussell-Vesely importance measure indicates a components contribution to the system unavailability. Change in the failure rates of the components with high importance values (or adding redundancy to account for the high failure rate) will have the most significant effect on increasing system reliability. The implementation of the Fussell-Vesely importance measure to compare components within the different architectures proved somewhat more involved than typically seen. Most architectures contained redundancy with two or more of the same component functions within each; however, there was not a one-to-one correspondence. For example, the voter architectures contained three Flight Controllers (FCs), while the self-

HLV Avionics Flight Computing Architecture Study – 2011
71 of 88
checking pair architectures contained four FCs. Therefore, the component functions were grouped for comparison by summing the contributions of all like-components in the architecture. Table B-10 shows the example of how this was done for FCs. Overall, though, this worked to determine which components were most likely to cause a failure. The results are shown in Figure B-14 below.
Architecture FC-# % Contribution
FC Overall FC % Contribution
FCSSTV FC-1 9.12% FC 27.36%
FC-2 9.12%
FC-3 9.12%
PCSSTV FC-1 6.66% FC 19.98%
FC-2 6.66%
FC-3 6.66%
CBTV FC-1 15.83% FC 39.29%
FC-2 7.63%
FC-3 15.83%
FCSSC FC-11 8.35% FC 33.39%
FC-12 8.35%
FC-21 8.35%
FC-22 8.35%
FCSBSC FC-11 8.51% FC 34.04%
FC-12 8.51%
FC-21 8.51%
FC-22 8.51%
CBSC FC-11 9.59% FC 43.66%
FC-12 9.59%
FC-21 12.24%
FC-22 12.24%
Table B- 10. Example of Component Grouping for Importance Measure Comparison

HLV Avionics Flight Computing Architecture Study – 2011
72 of 88
Figure B- 14. Functional Element Unreliability Contribution using F-V Measure The cut set contributions and component importance measures provide the designer with more information than a single reliability calculation comparison may provide. As architecture selection is made based not only on reliability calculations, but on weight, space, cost, risk to the mission, etc, and allow the designer to make more informed trade decisions with the most accurate data available.
Conclusion In summary, reliability analyses, including Reliability Block Diagram, Cut Set Analysis and Importance Analysis, were performed on the architectures selected. In order for comparison, the same failure rates were assumed for the same types of the functional units and the same failure criteria were applied to all the functional units. There is no significant difference observed between the selected voter and self-checking architectures at the first order, with significant low reliability for channelized voter and self-checking architectures. Different distribution of the failure probability contribution from function units indicates different reliability improvement path for the architectures. Intermediate states can be modeled as a follow-on work to include the impact of reconfigurable and data integrity on the reliability and integrity of the architectures.
0%
5%
10%
15%
20%
25%
30%
35%
40%
45%
BUS
CCDL
DAU
ECU FC
HCU
INU
MPS PIC
RCS
RGA
Switch
TVC
Cables &
Connectors
FCSSTV PCSSTV CBTV FCSSC FCSBSC CBSC

HLV Avionics Flight Computing Architecture Study – 2011
73 of 88
Appendix C: Power Analysis
Appendix C List of Figures Figure C‐ 1. Power Watts for all 6 Architectures........................................................................................... 76
Appendix C List of Tables Table C‐ 1. Fully Cross‐Strapped Switched Triplex Voting Architecture ........................................................ 73 Table C‐ 2. Partially Cross‐Strapped Switched Triplex Voting Architecture .................................................. 74 Table C‐ 3. Channelized Bussed Triplex Voter ‐ Ares‐like .............................................................................. 74 Table C‐ 4. Full Cross‐Strapped Switched Self‐Checking Architecture ‐ Orion‐like ........................................ 75 Table C‐ 5. Self‐Checking Cross‐Strapped Bus Master/Slave Architecture ‐ Atlas‐like .................................. 75 Table C‐ 6. Self‐Checking Channelized Bus .................................................................................................... 76 Approach First we determined the individual component power specifications for all components utilized within the data bus network (functional units, 1553 Busses, Switches). Second, the team determined the number of components and calculated total integrated architecture power consumption using Excel. All the data was populated into Excel and the results graphed. The following tables present the data analysis. Table C- 1. Fully Cross-Strapped Switched Triplex Voting Architecture Device Quantity Ports 2 SC otherwise 1 Power (Watts)
FC 3 3 1 136.5
CCDL 0 N/A N/A 0
SW 3 24 1 108
INU 3 2 1 87
RGA 3 2 1 108
DAU 2 2 1 42
ECU 2 2 1 132
TVC 3 2 1 198
MPS 2 2 1 72
RCSC 2 2 1 186
PIC 2 2 1 32
HCU 2 2 1 742
1843.5

HLV Avionics Flight Computing Architecture Study – 2011
74 of 88
Table C- 2. Partially Cross-Strapped Switched Triplex Voting Architecture Device Quantity Ports 2 SC otherwise 1 Power (Watts)
FC 3 3 1 136.5
CCDL 0 N/A N/A 0
SW 3 12 1 54
INU 3 1 1 82.5
RGA 3 1 1 103.5
DAU 2 1 1 39
ECU 2 1 1 129
TVC 3 1 1 193.5
MPS 2 1 1 69
RCSC 2 1 1 183
PIC 2 1 1 29
HCU 2 1 1 739
1758
Table C- 3. Channelized Bussed Triplex Voter - Ares-like Device Quantity Ports 2 SC otherwise 1 Power (Watts)
FC 3 1 1 133.8
CCDL 1 N/A N/A 18
SW 0 0 1 0
INU 3 1 1 88.8
RGA 3 1 1 109.8
DAU 2 1 1 43.2
ECU 2 1 1 133.2
TVC 3 1 1 199.8
MPS 2 1 1 73.2
RCSC 2 1 1 187.2
PIC 2 1 1 33.2
HCU 2 1 1 743.2
1763.4
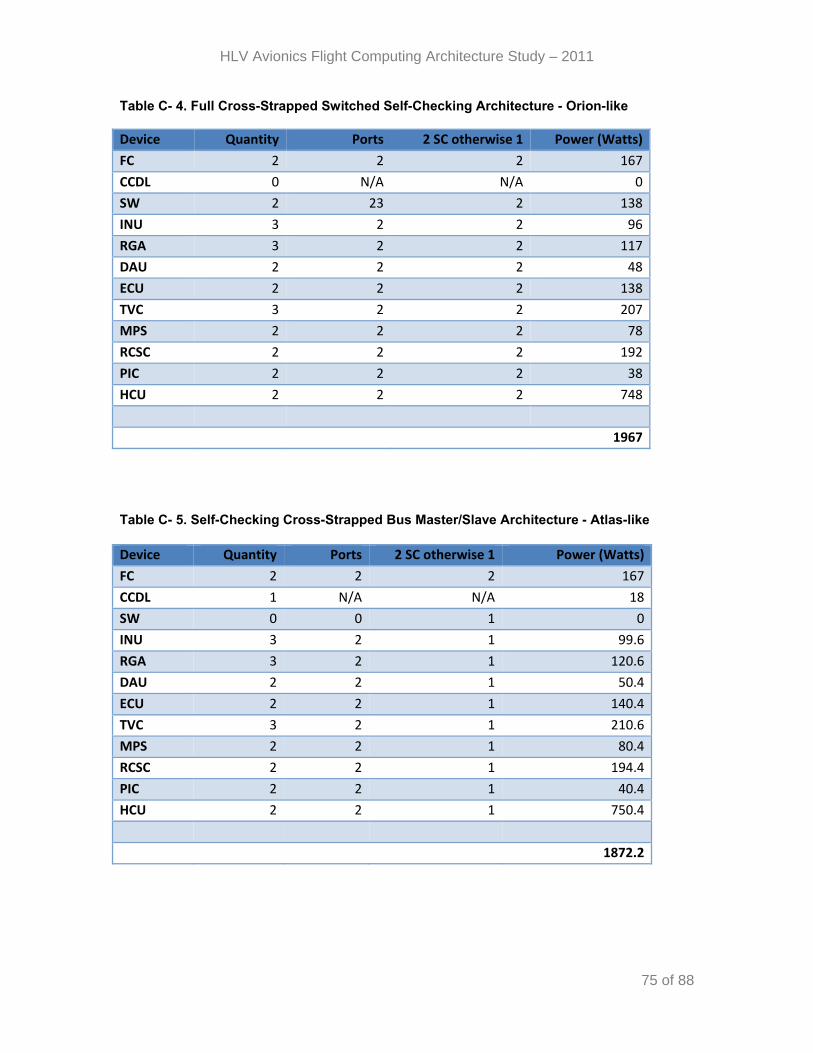
HLV Avionics Flight Computing Architecture Study – 2011
75 of 88
Table C- 4. Full Cross-Strapped Switched Self-Checking Architecture - Orion-like Device Quantity Ports 2 SC otherwise 1 Power (Watts)
FC 2 2 2 167
CCDL 0 N/A N/A 0
SW 2 23 2 138
INU 3 2 2 96
RGA 3 2 2 117
DAU 2 2 2 48
ECU 2 2 2 138
TVC 3 2 2 207
MPS 2 2 2 78
RCSC 2 2 2 192
PIC 2 2 2 38
HCU 2 2 2 748
1967
Table C- 5. Self-Checking Cross-Strapped Bus Master/Slave Architecture - Atlas-like Device Quantity Ports 2 SC otherwise 1 Power (Watts)
FC 2 2 2 167
CCDL 1 N/A N/A 18
SW 0 0 1 0
INU 3 2 1 99.6
RGA 3 2 1 120.6
DAU 2 2 1 50.4
ECU 2 2 1 140.4
TVC 3 2 1 210.6
MPS 2 2 1 80.4
RCSC 2 2 1 194.4
PIC 2 2 1 40.4
HCU 2 2 1 750.4
1872.2
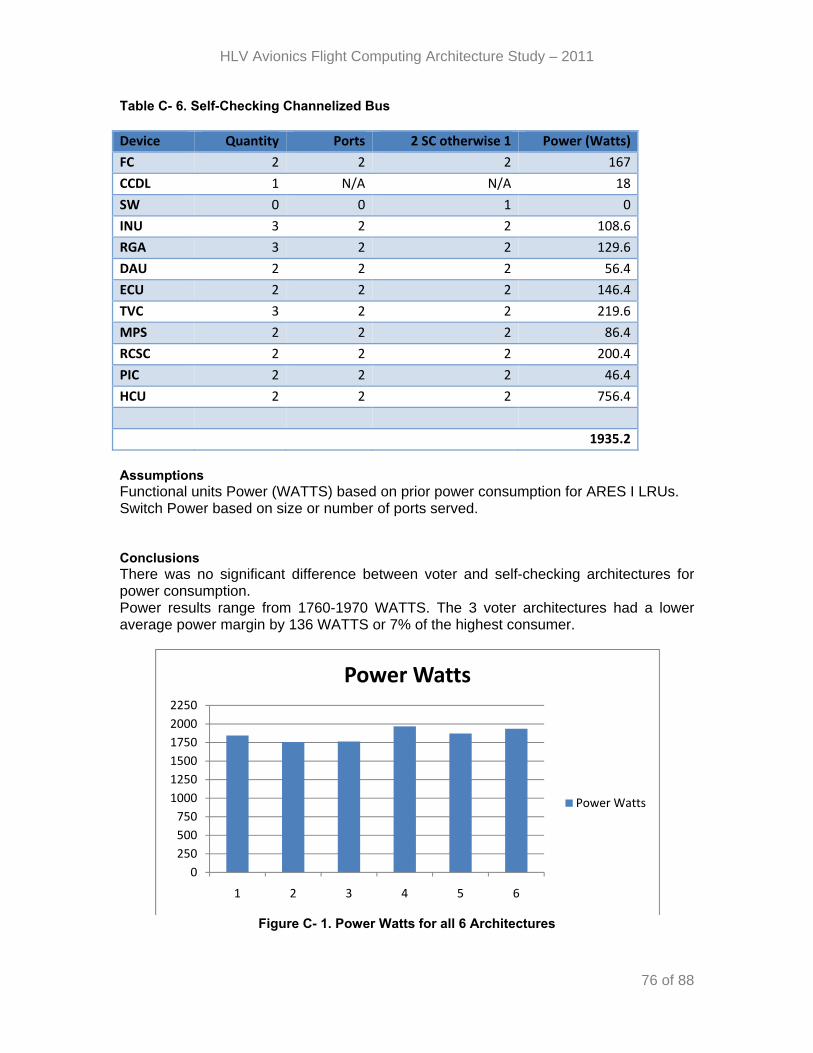
HLV Avionics Flight Computing Architecture Study – 2011
76 of 88
Table C- 6. Self-Checking Channelized Bus Device Quantity Ports 2 SC otherwise 1 Power (Watts)
FC 2 2 2 167
CCDL 1 N/A N/A 18
SW 0 0 1 0
INU 3 2 2 108.6
RGA 3 2 2 129.6
DAU 2 2 2 56.4
ECU 2 2 2 146.4
TVC 3 2 2 219.6
MPS 2 2 2 86.4
RCSC 2 2 2 200.4
PIC 2 2 2 46.4
HCU 2 2 2 756.4
1935.2
Assumptions Functional units Power (WATTS) based on prior power consumption for ARES I LRUs. Switch Power based on size or number of ports served.
Conclusions There was no significant difference between voter and self-checking architectures for power consumption. Power results range from 1760-1970 WATTS. The 3 voter architectures had a lower average power margin by 136 WATTS or 7% of the highest consumer.
Figure C- 1. Power Watts for all 6 Architectures
0
250
500
750
1000
1250
1500
1750
2000
2250
1 2 3 4 5 6
Power Watts
Power Watts

HLV Avionics Flight Computing Architecture Study – 2011
77 of 88
Appendix D: Mass Analysis
Appendix D List of Figures Figure D‐ 1. Full Cross Strapped Switched Triplex Voter Layout ................................................................... 77 Figure D‐ 2. Full Cross Strapped Switched Triplex Voter Cable Lengths. ....................................................... 78 Figure D‐ 3. Full Cross Strapped Switched Triplex Voter Input Cable Lengths. ............................................. 78 Figure D‐ 4. Full Cross Strapped Switched Triplex Voter Aft Output Cable Lengths. ..................................... 79 Figure D‐ 5. Switched Triplex Voter Aft Output Cable Length Calculations. ................................................. 79 Figure D‐ 6. Full Cross Strapped Switched Triplex Voter FWD Output Cable Lengths. .................................. 80 Figure D‐ 7. Full Cross Strapped Switched Triplex Voter FWD Output Cable Length .................................... 80 Figure D‐ 8. Data cabling mass summary ..................................................................................................... 87 Appendix D List of Tables Table D‐ 1. Full Switched Triplex Voter Mass Calculations ........................................................................... 81 Table D‐ 2. Partially Switched Triplex Voter Mass Calculations .................................................................... 82 Table D‐ 3. Bussed Triplex Voter Mass Calculations ..................................................................................... 83 Table D‐ 4. SCP Full Cross Strapped Switched Mass Calculations ................................................................. 84 Table D‐ 5. SCP Cross Strapped Bussed Mass Calculations ........................................................................... 85 Table D‐ 6. SCP Channelized Bussed Mass Calculations ............................................................................... 86 Approach Model a generic core stage inline heavy lift design with cores stage circular dimensions; (Vertical Length of 215.3’ and a Diameter 27.5’) for each architecture analyzed. Each model incorporates an upper stage avionics ring; lower stage/aft skirt avionics ring; and a specific number of functional avionic units necessary for ascent to LEO. Position fundamental avionic units for the upper and lower avionic rings and calculate the cable lengths based on the 6 fundamental architecture layouts. Analytical calculation within Excel to determine mass: Graph Results. Figures D-1 through D-7, document the model and the process taken to determine the length and mass of cabling for the Full Crossed Strapped Triplex Voter. The remaining 5 other models are not included within this appendix however the data generated from the models are represented in the Tables D-1 through D-6.
FC1
FC2
Switch1
EFFECTOR
FC3 DU EFFECTORSwitch3
Switch2
EFFECTORDU
DU
Figure D- 1. Full Cross Strapped Switched Triplex Voter Layout

HLV Avionics Flight Computing Architecture Study – 2011
78 of 88
Figure below sums the lengths of cabling from the FC to the switches based on perimeter lengths.
27.5’
System Tunnel
r=(.5*27.5’)=13.75’
1
2
FC2 to Sw1 = 43.2’FC2 to Sw2 = 43.2’
FC1 to Sw2 = 21.6’FC1 to Sw1 = 21.6’
FC3 to Sw2 = 21.6’FC3 to Sw3 = 21.6’
Switches (SW)
6 Connectors (FC to SW)
Switch Triplex Voter
Total Harness Length = 259.2’(FC to SW)
FC1
FC3
FC2
3
FC2 to Sw3 = 43.2’
FC3 to Sw1 = 21.6’
FC1 to Sw3 = 21.6’
Figure D- 2. Full Cross Strapped Switched Triplex Voter Cable Lengths.
12
System Tunnel RGA1/3 RGA2
90deg 180deg
INU1/3 INU2
DAU1/2
Input Lengths (All located within I.U. Ring)
Switches
FC1/3 FC2(8 GbE Wires to each switch1/2 = 16 total CAT5 wires) 1’
1’
1’
SW1 to RGA3 = 22.6’SW1 to RGA2 = 44.2’SW1 to RGA1 = 22.6’
1’
1’
SW2 to RGA3 = 22.6’SW2 to RGA2 = 44.2’SW2 to RGA1 = 22.6’
SW1 to INU3 = 50.2’SW1 to INU2 = 48.2’SW1 to INU1 = 46.2’
SW2 to INU3 = 50.2’SW2 to INU2 = 48.2’SW2 to INU1 = 46.2’
SW1 to DAU1 = 26.6’
SW1 to DAU2 = 26.6’SW1 to DAU1 = 26.6’
SW2 to DAU2 = 26.6’
Total GbE Cable length for FWD (Input) LRU’s to SW= 862.2’
268.8’
433.8’
159.6’
SW3 to RGA1 = 22.6’ SW3 to RGA2 = 44.2’ SW3 to RGA3 = 22.6’
SW3 to INU1 = 46.2’SW3 to INU2 = 48.2’SW3 to INU3 = 50.2’
SW3 to DAU1 = 26.6’SW3 to DAU2 = 26.6’
3
Figure D- 3. Full Cross Strapped Switched Triplex Voter Input Cable Lengths.
The model construct, placed the fundamental avionic units for the upper and lower avionic rings against the outer mold line and calculated the cable lengths based on the 6 network layouts analyzed, 2 Cross Strapped, 2 Partially Cross Strapped, and 2 Single String.

HLV Avionics Flight Computing Architecture Study – 2011
79 of 88
FWD SW1/2/3
AFT SW1/2/3
FC1
FC3
FC2
ECU1
ECU3
ECU2
ECU4
ECU5
System TunnelLength = 215.3’Based on Ares V –LOX Dome FWD (233.6’) to Base of Aft Core Stage (18.3’)
SW1,2, 3
SW1,2,3
9 X 215.3’
Assumption: Using 1000BASE‐T Twisted‐pair cabling (Cat‐5, Cat‐5e, Cat‐6, or Cat‐7) ‐ 100 meters max drive length.
MPS1
MPS2
HPU1
HPU2
Output Functions – AFT
3’
Total Length to Aft SW1,2,3 – FWD FC to Tunnel + Tunnel Length =
(9X 215.3’) + (259.2’) = 2196.9’
3 GbE lines per FC to Tunnel per switch(259.2’)
9 Total Cables
Figure D- 4. Full Cross Strapped Switched Triplex Voter Aft Output Cable Lengths.
The figure below sums all the cable lengths from each aft component to the switches.
ASW1 ‐>ECU1= 21.6 + 1 = 22.6ASW2 ‐>ECU1= 21.6 + 1 = 22.6
ASW1 ‐>ECU3= 21.6 ASW2 ‐>ECU3= 21.6
ASW1 ‐>ECU2= 21.6 + 1 = 22.6 ASW2 ‐>ECU2= 21.6 + 1 = 22.6
ASW1 ‐>ECU4= 21.6ASW2 ‐>ECU4= 21.6
ASW1 ‐>ECU5= 43.2ASW2 ‐>ECU5= 43.2
Total Length = 394.8’
ASW1 ‐> MPS2 = 21.6’+3’=24.6’ ASW2 ‐> MPS2 = 21.6’+3’=24.6’
ASW2 ‐> MPS1 = 21.6’+3’=24.6’ASW1 ‐> MPS1 = 21.6’+3’=24.6’
Total Length = 147.6’
ASW2 ‐> HPU2 = 43.2’+1’=44.2’
ASW2 ‐> HPU1 = 43.2’+3’=46.2’ASW1 ‐> HPU1 = 43.2’+3’=46.2’
Total Length = 271.2’
ASW1 ‐> HPU2 = 43.2’+1’=44.2’
Total GbE Cable length for AFT (Output) LRU’s to SW= 813.6’
ASW3 ‐>ECU1= 21.6 + 1 = 22.6
ASW3 ‐>ECU3= 21.6
ASW3 ‐>ECU2= 21.6 + 1 = 22.6
ASW3 ‐>ECU4= 21.6
ASW3 ‐>ECU5= 43.2
ASW3 ‐> MPS2 = 21.6’+3’=24.6’
ASW3 ‐> MPS1 = 21.6’+3’=24.6’
ASW2 ‐> HPU2 = 43.2’+1’=44.2’
ASW2 ‐> HPU1 = 43.2’+3’=46.2’
Figure D- 5. Switched Triplex Voter Aft Output Cable Length Calculations.

HLV Avionics Flight Computing Architecture Study – 2011
80 of 88
AFT SW1/2/3
FC1
FC3
FC2
RGA1
RGA3SW1,2
Assumption: Using 1000BASE‐T Twisted‐pair cabling (Cat‐5, Cat‐5e, Cat‐6, or Cat‐7) ‐ 100 meters max drive length.
INU1
RGA2
Output Functions – FWD Avionics Ring (LRU’s Denoted in White)
3’
DAU1
DAU2
TVC1
TVC3
PIC2
PIC1RSCS1
RSCS2
5’
7’
9’
3’
1’
INU2
TVC2
INU3
LRU’s
Figure D- 6. Full Cross Strapped Switched Triplex Voter FWD Output Cable Lengths.
The figure below sums all the cable lengths from each FWD component to the switches. The total of all the cable lengths for each part of the model is summed.
SW1 ‐>TVC1= 21.6 + 7 = 28.6’SW2 ‐>TVC1= 21.6 + 1 = 28.6’
SW1 ‐> TVC2= 43.2 +7 = 50.2’ SW2 ‐> TVC2= 43.2 +7 = 50.2’
SW1 ‐>TVC3= 21.6 + 7 = 28.6’ SW2 ‐>TVC3= 21.6 + 7 = 28.6’
Total Length = 322.2’
SW1 ‐> RCSC2 = 21.6’+9’=30.6’SW2 ‐> RCSC2 = 21.6’+9’=30.6’
SW2 ‐> RCSC1 = 21.6’+9’=30.6’ SW1 ‐> RCSC1 = 21.6’+9’=30.6’
Total Length = 183.6’
SW2 ‐> PIC2 = 21.6’+3’=24.6’
SW2 ‐> PIC1 = 21.6’+3’=24.6’ SW1 ‐> PIC1 = 21.6’+3’=24.6’
Total Length = 147.6’
SW1 ‐> PIC2 = 21.6’+3’=24.6’
Total GbE Cable length for FWD (Output) LRU’s to SW= 653.4’
Total GbE Cable length for Full Switched Voter = 259.2’ + 862.2’ + 2196.9’+ 813.6’ + 653.4’= 4785.5’Nominal Weight of CAT‐5e (1000BASE‐T) = 22lbs/1000’ ‐> Weight Cabling = 105.27 lbs (Minus Connectors weight)
SW3 ‐>TVC3= 21.6 + 7 = 28.6’
SW3 ‐> TVC2= 43.2 +7 = 50.2’
SW3 ‐>TVC1= 21.6 + 1 = 28.6’
SW3 ‐> RCSC2 = 21.6’+9’=30.6’
SW3 ‐> RCSC1 = 21.6’+9’=30.6’
SW3 ‐> PIC2 = 21.6’+3’=24.6’
SW3 ‐> PIC1 = 21.6’+3’=24.6’
Figure D- 7. Full Cross Strapped Switched Triplex Voter FWD Output Cable Length Calculations.

HLV Avionics Flight Computing Architecture Study – 2011
81 of 88
Finally, all of the cable lengths for the independent architecture components are inserted into an Excel calculation and the mass is determined. The results are as follows: Table D- 1. Full Switched Triplex Voter Mass Calculations
Flight Computer 1/2/3 To Switch 1/2/3 259.2
Upper Stage Inputs
Switch 1/2/3 to RGA 1/2/3 268.8
Switch 1/2/3 to INU 1/2/3 433.9
Switch 1/2/3 to DAU 1/2 159.6
Total 862.3
Upper Stage Outputs
Switch 1/2/3 to TVC 1/2/3 322.2
Switch 1/2/3 to RCS 1/2 183.6
Switch 1/2/3 to PIC 1/2 147.6
Total 653.4
System Tunnel Cabling 2196.9
Aft Output Function
Switch 1/2/3 to ECU 1/2/3/4/5 394.8
Switch 1/2/3/ to MPS 1/2 147.6
Switch 1/2/3 HPU1/2 271.2
Total 813.6
Total Cable Length (ft) 4785.4
Total Cable Weight (lbs) 105.2788
Normalized Percent 100

HLV Avionics Flight Computing Architecture Study – 2011
82 of 88
Table D- 2. Partially Switched Triplex Voter Mass Calculations
Flight Computer 1/2/3 To Switch 1/2/4 259.2
Upper Stage Inputs
Switch 1/2/3 to RGA 1/2/3 89.4
Switch 1/2/3 to INU 1/2/3 144
Switch 1/2/3 to DAU 1/2 53.2
Total 286.6
Upper Stage Outputs
Switch 1/2/3 to TVC 1/2/3 107.4
Switch 1/2/3 to RCS 1/2 61.2
Switch 1/2/3 to PIC 1/2 49.2
Total 217.8
System Tunnel Cabling 905.1
Aft Output Function
Switch 1/2/3 to ECU 1/2/3/4/5 131.6
Switch 1/2/3/ to MPS 1/2 49.2
Switch 1/2/3 HPU1/2 90.4
Total 271.2
Total Cable Length (ft) 1939.9
Total Cable Weight (lbs) 42.6778
Normalized Percent 40.53789

HLV Avionics Flight Computing Architecture Study – 2011
83 of 88
Table D- 3. Bussed Triplex Voter Mass Calculations
Flight Computer 1/2/3 To BUS 1/2/3 259.2
Upper Stage Inputs
Bus 1/2/3 to RGA 1/2/3 3
Bus 1/2/3 to INU 1/2/3 15
Bus 1/2/3 to DAU 1/2 10
Total 28
Upper Stage Outputs
Bus 1/2/3 to TVC 1/2/3 23
BUS 1/2/3 to RCS 1/2 18
BUS 1/2/3 to PIC 1/2 6
Total 47
System Tunnel Cabling 645.9
Aft Busses 1/2/3 259.2
Aft Output Function
Bus 1/2/3to ECU 1/2/3/4/5 9
Bus 1/2/3 to MPS 1/2 10
Bus 1/2/3 to HPU1/2 6
Total 25
Total Cable Length (ft) 1264.3
Total Cable Weight (lbs) 15.80375
Total Weight with Couplers (lbs) 19.80375
Normalized Percent 18.81077

HLV Avionics Flight Computing Architecture Study – 2011
84 of 88
Table D- 4. SCP Full Cross Strapped Switched Mass Calculations
Flight Computer 1/2/3 To Switch 1/2 86.4
Upper Stage Inputs
Switch 1/2 to RGA 1/2/3 178.8
Switch 1/2 to INU 1/2/3 289.2
Switch 1/2 to DAU 1/2 106.4
Total 574.4
Upper Stage Outputs
Switch 1/2/3 to TVC 1/2/3 214.8
Switch 1/2/3 to RCS 1/2 122.4
Switch 1/2/3 to PIC 1/2 98.4
Total 435.6
System Tunnel Cabling to Aft Switch 947.6
Aft Output Function
Switch 1/2/3 to ECU 1/2/3/4/5 263.2
Switch 1/2/3/ to MPS 1/2 98.4
Switch 1/2/3 HPU1/2 180.8
Total 542.4
Total Cable Length (ft) 2586.4
Total Cable Weight (lbs) 56.9008
Normalized Percent 54.04773

HLV Avionics Flight Computing Architecture Study – 2011
85 of 88
Table D- 5. SCP Cross Strapped Bussed Mass Calculations
Flight Computer 1/2 To BUS 1/2/ 172.8
Upper Stage Inputs
Bus 1/2 to RGA 1/2/3 6
Bus 1/2 to INU 1/2/3 30
Bus 1/2 to DAU 1/2 20
Total 56
Upper Stage Outputs
Bus 1/2/3 to TVC 1/2/3 46
BUS 1/2/3 to RCS 1/2 36
BUS 1/2/3 to PIC 1/2 12
Total 94
System Tunnel Cabling 430.6
Aft Busses 1/2/3 172.8
Aft Output Function
Bus 1/2/3to ECU 1/2/3/4/5 18
Bus 1/2/3 to MPS 1/2 20
Bus 1/2/3 to HPU1/2 16
Total 54
Total Cable Length (ft) 980.2
Total Cable Weight (lbs) 12.2525
Total Weight with Couplers (lbs) 16.2525
Normalized Percent 15.43758

HLV Avionics Flight Computing Architecture Study – 2011
86 of 88
Table D- 6. SCP Channelized Bussed Mass Calculations
Flight Computer 1/2 To BUS 1/2/ 345.6
Upper Stage Inputs
Bus 1A/1B,2A/2B to RGA 1/2/3 8
Bus 1A/1B,2A/2B to INU 1/2/3 40
Bus 1A/1B,2A/2B to DAU 1/2 20
Total 68
Upper Stage Outputs
Bus 1A/1B,2A/2B to TVC 1/2/3 64
Bus 1A/1B,2A/2B to RCS 1/2 36
Bus 1A/1B,2A/2B to PIC 1/2 12
Total 112
System Tunnel Cabling 861.2
Aft Busses 1/2/3 345.6
Aft Output Function
Bus 1A/1B,2A/2B to ECU 1/2/3/4/5 36
Bus 1A/1B,2A/2B to MPS 1/2 20
Bus 1A/1B,2A/2B to HPU1/2 16
Total 72
Total Cable Length (ft) 1804.4
Total Cable Weight (lbs) 22.555
Total Weight with Couplers (lbs) 28.555
Normalized Percent 27.12322 Assumptions No additional avionics or functional units for boosters or 2nd stage/payloads were considered for the analysis. The model utilized 1000BASE-T Twisted-pair cabling (Cat-5, Cat-5e, Cat-6, or Cat-7) at a 100 meter max drive length for the architectures that utilized a switched network. The model utilized 1553 cabling as the bus for the bussed architectures Conclusions Mass ranges determined were between 16 lbs to 105lbs, which is 2% to 9% percent of the total estimated cable/harness weight for a heavy lift vehicle (Approx 1200lbs)*. Cable weight was a function of cross strapping and not a function of the Flight Computer (SCP vs Voter).

HLV Avionics Flight Computing Architecture Study – 2011
87 of 88
Figure D- 8. Data cabling mass summary
0
20
40
60
80
100
120
FCSSTV PCSSTV CBTV FCSSC FCSBSC CBSC
Data Netw
ork Harness M
ass (LBS)

HLV Avionics Flight Computing Architecture Study – 2011
88 of 88
Appendix E: Redundancy Management Approaches
This appendix has been removed from the non-SBU version of this document due to vendor proprietary data.

REPORT DOCUMENTATION PAGEForm Approved
OMB No. 0704-0188
2. REPORT TYPE
Technical Memorandum 4. TITLE AND SUBTITLE
Heavy Lift Vehicle (HLV) Avionics Flight Computing Architecture Study 5a. CONTRACT NUMBER
6. AUTHOR(S)
Hodson, Robert F.; Chen, Yuan; Morgan, Dwayne R.; Butler, A. Marc; Schuh, Joseph M.; Petelle, Jennifer K.; Gwaltney, David A.; Coe, Lisa D.; Koelbl, Terry G.; Nguyen, Hai D.
7. PERFORMING ORGANIZATION NAME(S) AND ADDRESS(ES)
NASA Langley Research CenterHampton, VA 23681-2199
9. SPONSORING/MONITORING AGENCY NAME(S) AND ADDRESS(ES)
National Aeronautics and Space AdministrationWashington, DC 20546-0001
8. PERFORMING ORGANIZATION REPORT NUMBER
L-20049
10. SPONSOR/MONITOR'S ACRONYM(S)
NASA
13. SUPPLEMENTARY NOTES
12. DISTRIBUTION/AVAILABILITY STATEMENTUnclassified - UnlimitedSubject Category 19Availability: NASA CASI (443) 757-5802
19a. NAME OF RESPONSIBLE PERSON
STI Help Desk (email: [email protected])
14. ABSTRACT
A NASA multi-Center study team was assembled from LaRC, MSFC, KSC, JSC and WFF to examine potential flight computing architectures for a Heavy Lift Vehicle (HLV) to better understand avionics’ drivers. The study examined Design Reference Missions (DRMs) and vehicle requirements that could impact the vehicles’ avionics. The study considered multiple self-checking and voting architectural variants and examined reliability, fault-tolerance, mass, power, and redundancy management impacts. Furthermore, a goal of the study was to develop the skills and tools needed to rapidly assess additional architectures should requirements or assumptions change.
15. SUBJECT TERMS
Avionics; Computing architecture; Fault tolerance; Launch vehicles; Reliability
18. NUMBER OF PAGES
93
19b. TELEPHONE NUMBER (Include area code)
(443) 757-5802
a. REPORT
U
c. THIS PAGE
U
b. ABSTRACT
U
17. LIMITATION OF ABSTRACT
UU
Prescribed by ANSI Std. Z39.18Standard Form 298 (Rev. 8-98)
3. DATES COVERED (From - To)
5b. GRANT NUMBER
5c. PROGRAM ELEMENT NUMBER
5d. PROJECT NUMBER
5e. TASK NUMBER
5f. WORK UNIT NUMBER
604746.02.23.03.01.01.04
11. SPONSOR/MONITOR'S REPORT NUMBER(S)
NASA/TM-2011-217168
16. SECURITY CLASSIFICATION OF:
The public reporting burden for this collection of information is estimated to average 1 hour per response, including the time for reviewing instructions, searching existing data sources, gathering and maintaining the data needed, and completing and reviewing the collection of information. Send comments regarding this burden estimate or any other aspect of this collection of information, including suggestions for reducing this burden, to Department of Defense, Washington Headquarters Services, Directorate for Information Operations and Reports (0704-0188), 1215 Jefferson Davis Highway, Suite 1204, Arlington, VA 22202-4302. Respondents should be aware that notwithstanding any other provision of law, no person shall be subject to any penalty for failing to comply with a collection of information if it does not display a currently valid OMB control number.PLEASE DO NOT RETURN YOUR FORM TO THE ABOVE ADDRESS.
1. REPORT DATE (DD-MM-YYYY)
08 - 201101-