Embed Size (px)
Citation preview
e-ISSN: 2582-5208 International Research Journal of Modernization in Engineering Technology and Science
( Peer-Reviewed, Open Access, Fully Refereed International Journal )
Volume:03/Issue:10/October-2021 Impact Factor- 6.752 www.irjmets.com
www.irjmets.com @International Research Journal of Modernization in Engineering, Technology and Science
[285]
HEAVE, UNCOUPLED PITCH MOTION AND MOTION SICKNESS INDEX
OF A TANKER VESSEL
Olusegun, Samuel Dare*1, Longjohn, Anthony Erekosima*2, Elakpa, Ada Augustine*3 *1,2,3Department Of Marine Engineering, Nigeria Maritime University Okerenkoko, Delta State, Nigeria.
ABSTRACT
This research work is aimed the computation of vessel Heave, uncoupled pitch vessel response and motion
sickness of a tanker vessel. Most tanker vessel are associated with motion sickness as a result of heave and
pitch motion of the vessel. Owing to this fact this research work was carried out to act as a guide of the about of
motion sickness index that is available onboard a tanker. This was achieved by the computation of the
hydrodynamics potentials of added mass, damping coefficients of each required modes of motions, their
retardation functions, the total excitation forces, which comprises of the instantaneous time varying Froud-
krylov forces, restoring and diffraction forces for each motion mode of coupled heave and pitch. Also, the
formulation of the heave and pitch response amplitude operator, the vessel motion response equation and the
motion sickness index were computed. The Runge-Kutta numerical solution was use to solved equations that
were developed and attempts were made with these solutions in testing and validating the results against those
from the commercial software (Ansys-Aqwa software). The results gotten from the validation can be said to be
impressive as an error of less than 0.001 and 0.01 were recorded for the heave and pitch response amplitude
operator respectively.
Keywords: Response Amplitude Operator; Heave; Pitch; Motion; Motion Sickness Index; Wave Frequency;
Time.
I. INTRODUCTION
The seakeeping analysis of any floating structure is a very important analysis in the design phase of offshore
structures. This has received little attention until recently in the last two centuries. Since the days of St Denis
and Pierson, ship motion has not been given considerable attention, more especially after the former’s pro-
posals of application of the principles of motion superposition. The preliminary motion prediction of vessels
before making necessary design decisions has become paramount, as the safety of the crew personnel and the
operational abilities of the facility need to perform within certain risk-free states.
Seakeeping analysis is ‘the seaworthiness’ of a vessel in calm and disturbed seaway conditions as the vessel
goes through the seaway. This analysis has had its challenges ever since the design of ships was proposed along
the design stages. The common ways of predicting seakeeping analyses were either through experiments or
some adapted designs approach of old varying results. Increasingly, experiments actually produce more
accurate results but its time consuming and a lot of resources and energies directed towards it. On the other
hand, the analytical methods and tools used in producing the same prediction has yielded a-lot closer values
with experiments which saves a lot of time and energy for the naval architects and ship project engineers in
making design decisions. All thanks to the fast-super computers we have these days. Some approaches have
been proposed for the prediction of these motions amongst which are the popular panel method, and strip
theory. The strip theory, has given some realistic results over the years in the entire circle of ship motion
computations ranging from the computations of the sectional hydrodynamics added masses and damping and
its restoring coefficients [1].
Other considerations were with regards to the domain of computations, which are further subdivided basically
into the frequency domain and time domain. While the former explored the computations of the response
amplitude operators and makes of the frequency dependency techniques, it has produced fairly accurate results
and the computation time is fairly fast. The frequency domain on the other hand has its shortcomings as it does
not cover non-linear effects and real time analysis of these floating structures. These deficiencies are made up
for much more with the time domain approach, which tries to capture the non-linear effects and gives a historic
time motion of a vessel with regards to a given time. With regards to the vessel linear dimensions, considering
the length along the longitudinal section, beam and depth, the motion of a vessel tends to express its two degree
e-ISSN: 2582-5208 International Research Journal of Modernization in Engineering Technology and Science
( Peer-Reviewed, Open Access, Fully Refereed International Journal )
Volume:03/Issue:10/October-2021 Impact Factor- 6.752 www.irjmets.com
www.irjmets.com @International Research Journal of Modernization in Engineering, Technology and Science
[286]
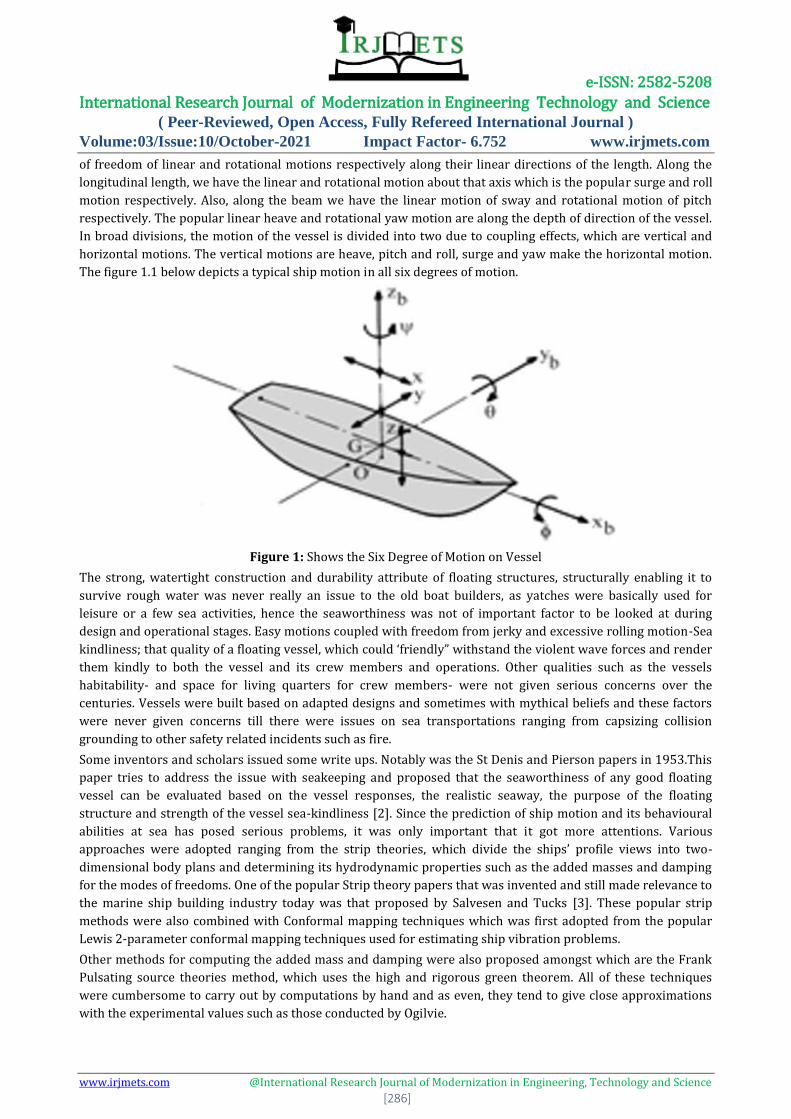
of freedom of linear and rotational motions respectively along their linear directions of the length. Along the
longitudinal length, we have the linear and rotational motion about that axis which is the popular surge and roll
motion respectively. Also, along the beam we have the linear motion of sway and rotational motion of pitch
respectively. The popular linear heave and rotational yaw motion are along the depth of direction of the vessel.
In broad divisions, the motion of the vessel is divided into two due to coupling effects, which are vertical and
horizontal motions. The vertical motions are heave, pitch and roll, surge and yaw make the horizontal motion.
The figure 1.1 below depicts a typical ship motion in all six degrees of motion.
Figure 1: Shows the Six Degree of Motion on Vessel
The strong, watertight construction and durability attribute of floating structures, structurally enabling it to
survive rough water was never really an issue to the old boat builders, as yatches were basically used for
leisure or a few sea activities, hence the seaworthiness was not of important factor to be looked at during
design and operational stages. Easy motions coupled with freedom from jerky and excessive rolling motion-Sea
kindliness; that quality of a floating vessel, which could ‘friendly” withstand the violent wave forces and render
them kindly to both the vessel and its crew members and operations. Other qualities such as the vessels
habitability- and space for living quarters for crew members- were not given serious concerns over the
centuries. Vessels were built based on adapted designs and sometimes with mythical beliefs and these factors
were never given concerns till there were issues on sea transportations ranging from capsizing collision
grounding to other safety related incidents such as fire.
Some inventors and scholars issued some write ups. Notably was the St Denis and Pierson papers in 1953.This
paper tries to address the issue with seakeeping and proposed that the seaworthiness of any good floating
vessel can be evaluated based on the vessel responses, the realistic seaway, the purpose of the floating
structure and strength of the vessel sea-kindliness [2]. Since the prediction of ship motion and its behavioural
abilities at sea has posed serious problems, it was only important that it got more attentions. Various
approaches were adopted ranging from the strip theories, which divide the ships’ profile views into two-
dimensional body plans and determining its hydrodynamic properties such as the added masses and damping
for the modes of freedoms. One of the popular Strip theory papers that was invented and still made relevance to
the marine ship building industry today was that proposed by Salvesen and Tucks [3]. These popular strip
methods were also combined with Conformal mapping techniques which was first adopted from the popular
Lewis 2-parameter conformal mapping techniques used for estimating ship vibration problems.
Other methods for computing the added mass and damping were also proposed amongst which are the Frank
Pulsating source theories method, which uses the high and rigorous green theorem. All of these techniques
were cumbersome to carry out by computations by hand and as even, they tend to give close approximations
with the experimental values such as those conducted by Ogilvie.
e-ISSN: 2582-5208 International Research Journal of Modernization in Engineering Technology and Science
( Peer-Reviewed, Open Access, Fully Refereed International Journal )
Volume:03/Issue:10/October-2021 Impact Factor- 6.752 www.irjmets.com
www.irjmets.com @International Research Journal of Modernization in Engineering, Technology and Science
[287]
Motion Sickness Index
When a fishing boat is sailing at high speed, its longitudinal overturning moment is bigger and its restoring
moment is smaller, which results in a larger heave and pitch range of the hull and seriously affects its
navigation performance. Moreover, the severe heave and pitch motion will also produce excessive longitudinal
acceleration, which will cause seasickness and seriously reduce work efficiency. Therefore, reducing the
longitudinal motion amplitude and seasickness rate of fishing boats has become a core issue in the design of
fishing vessels. An important indicator of seaworthiness is Motion Sickness Incidence (MSI), which is the
percentage of seasickness after two hours of voyage. MSI is less than 10% for passenger ships [4]. In order to
improve the stability of longitudinal motion of fishing vessels and reduce the rate of seasickness, anti-rolling
appendages must be installed. Among them, T-wing is widely used to improve the added mass and damping of
ships as anti-rolling appendages, but as a longitudinal anti-rolling device, T-wing may increase navigation
resistance. Therefore, it is necessary to combine with the wave plate to ensure that the resistance will not
increase while the rolling is reduced.
The study of seasickness rate, [5] used a mathematical expression to define the percentage of subjects who
vomited within two hours after experimentation over 300 personnel under the name of MSI. [6]. studied
operability index of ships using seakeeping analysis and performed such method on catamaran case study
comparing to human comfort criteria. [7] studied the longitudinal motion of high-speed ferry controlled by T-
wing; [8] studied the change of motion performance and seasickness rate of trimaran with or without T-wing;
[9] studied the longitudinal motion stability of catamaran controlled by T-wing. [10] discusses the influence of
those environmental conditions on the human being that may cause motion sickness incidence. [11] with T-
wing and wave plate as anti-rolling devices, the longitudinal motion amplitude of the hull can be reduced by
36% and the MSI amplitude by 45% for 40 speed high-speed boats under 5-class sea conditions. [12] studied
the effects of roll motion on a MSI of a small boat and to access the comfort of passenger on board cruises based
on wave energy spectrum. [13]; [14] studied the improvement of MSI by ship hull form modification of the
training ship. [15] analysed the MSI of the changing factors of the ship operational environment. From the
above research, most scholars use T-wing for motion control, without considering the drag increase and wave
drift caused by T-wing while improving its motion performance. Therefore, on the basis of summarizing the
previous research results, taking a fishing boat as an example, based on the theory of regular wave and
irregular wave potential flow, the panel method is used to install T-wing and its mother type respectively. The
6DOF Response Amplitude Operators (RAO) curves, wave drift force and seasickness rate before and after
modification was compared. The results show that the motion amplitude of the ship with T-wing and flap is
obviously improved, and the seasickness rate is obviously reduced. The research method in this paper can
provide technical support for the improvement of the motion performance of the same ship.
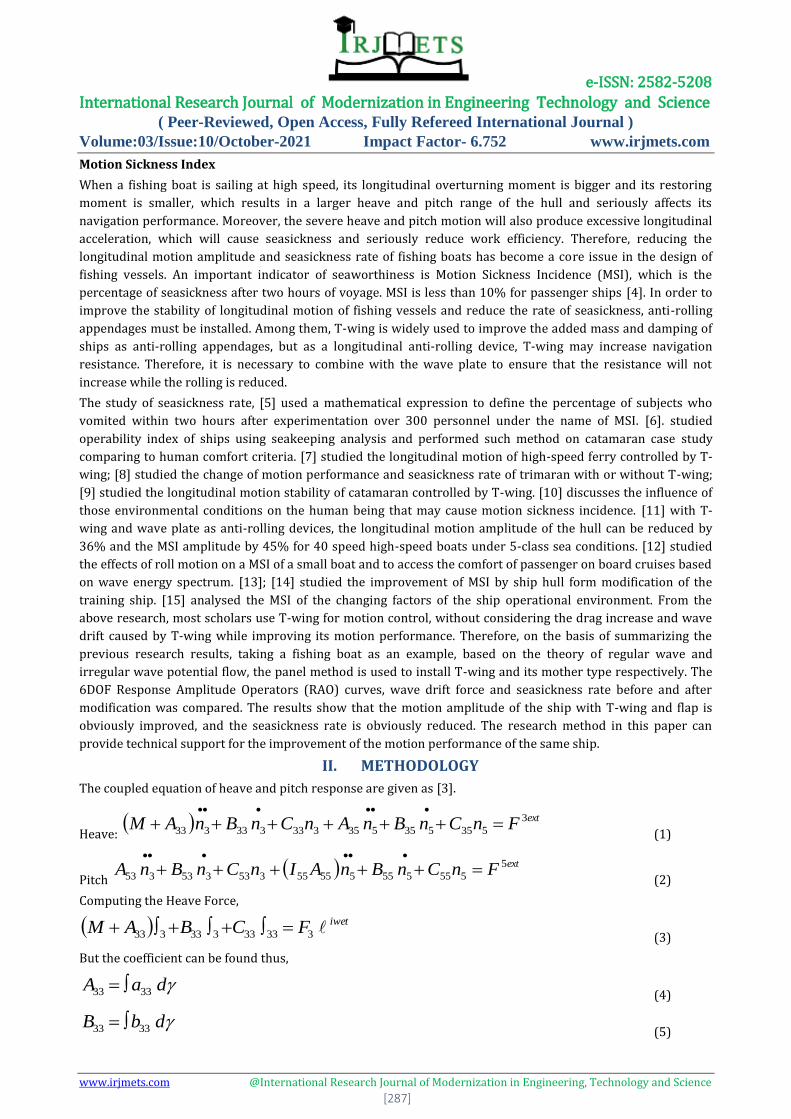
II. METHODOLOGY
The coupled equation of heave and pitch response are given as [3].
Heave: extFnCnBnAnCnBnAM 3
535535535333333333
(1)
Pitch (2)
Computing the Heave Force,
iwetFCBAM 33333333333 (3)
But the coefficient can be found thus,
daA 3333 (4)
dbB 3333 (5)
extFnCnBnAInCnBnA 5
55555555555353353353

e-ISSN: 2582-5208 International Research Journal of Modernization in Engineering Technology and Science
( Peer-Reviewed, Open Access, Fully Refereed International Journal )
Volume:03/Issue:10/October-2021 Impact Factor- 6.752 www.irjmets.com
www.irjmets.com @International Research Journal of Modernization in Engineering, Technology and Science
[288]
WgAbdgC 33 (6)
Also, the sectional coefficient can be further express as
22
00
2
332 BA
ANBMba
(7)
24
22
334 BA
bb
(8)
33ais added mass
33bis section damping
2.1 Numerical Solution
The heave and pitch motion equation 1 and 2 will be resolve using the Runge-kutta fourth order solution.
Assuming an ordinary differential equation that defines value of
⁄ in form of and , also the initial value
of , i.e.,
(9)
The formula below is used to compute next value of from the previous value . The value of n are 0, 1, 2,
3, ……………..
⁄
Where h is step height and
(10)
(11)
(12)
(13)
(14)
(15)
is the increment based on the slope at the beginning of the interval using
is the increment based on the slope at the midpoint of the interval using
is the increment based on the slope at the midpoint of the interval using
is the increment based on the slope at the midpoint of the interval using
is the local truncation error
2.2 Equation of Motion Sickness Index
Motion sickness is one of the important parameters that need to be investigated since they have a great effect
on the crew’s performance and also on passengers’ comfort. MSI indicates the percentage of people
experiencing vomiting when exposed to motion for a certain of time. The method uses a statistically-based,
response surface which models the laboratory observations form two landmark parametric studies on motion
induced sickness.
The MSI index (Motion Sickness Incidence) is commonly used for assessing possible occurrence of the illness
[16]:
[ (
)] (16)
where:
e-ISSN: 2582-5208 International Research Journal of Modernization in Engineering Technology and Science
( Peer-Reviewed, Open Access, Fully Refereed International Journal )
Volume:03/Issue:10/October-2021 Impact Factor- 6.752 www.irjmets.com
www.irjmets.com @International Research Journal of Modernization in Engineering, Technology and Science
[289]
MSI – motion sickness incidence index;
erf – error function;
av – mean value of vertical accelerations at a selected point;
– parameter calculated from this equation:
(17)
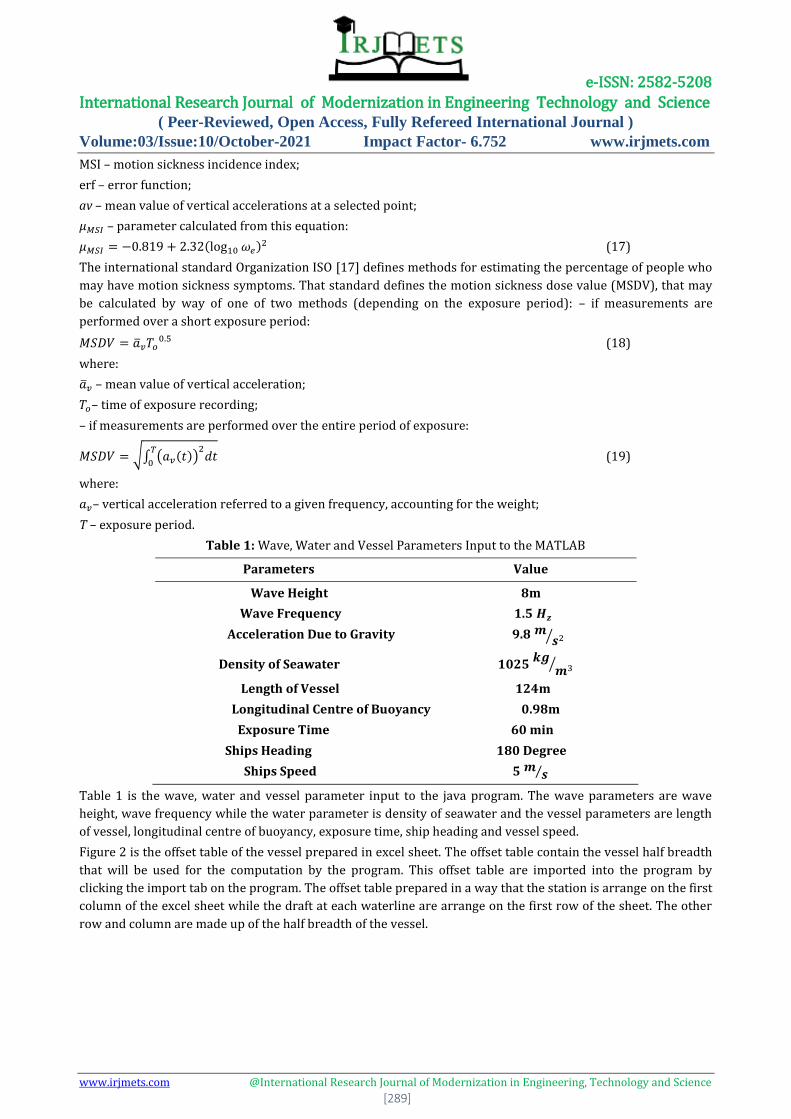
The international standard Organization ISO [17] defines methods for estimating the percentage of people who
may have motion sickness symptoms. That standard defines the motion sickness dose value (MSDV), that may
be calculated by way of one of two methods (depending on the exposure period): – if measurements are
performed over a short exposure period:
(18)
where:
– mean value of vertical acceleration;
– time of exposure recording;
– if measurements are performed over the entire period of exposure:
√∫ ( )
(19)
where:
– vertical acceleration referred to a given frequency, accounting for the weight;
T – exposure period.
Table 1: Wave, Water and Vessel Parameters Input to the MATLAB
Parameters Value
Wave Height 8m
Wave Frequency 1.5
Acceleration Due to Gravity 9.8 ⁄
Density of Seawater 1025
⁄
Length of Vessel 124m
Longitudinal Centre of Buoyancy 0.98m
Exposure Time 60 min
Ships Heading 180 Degree
Ships Speed 5 ⁄
Table 1 is the wave, water and vessel parameter input to the java program. The wave parameters are wave
height, wave frequency while the water parameter is density of seawater and the vessel parameters are length
of vessel, longitudinal centre of buoyancy, exposure time, ship heading and vessel speed.
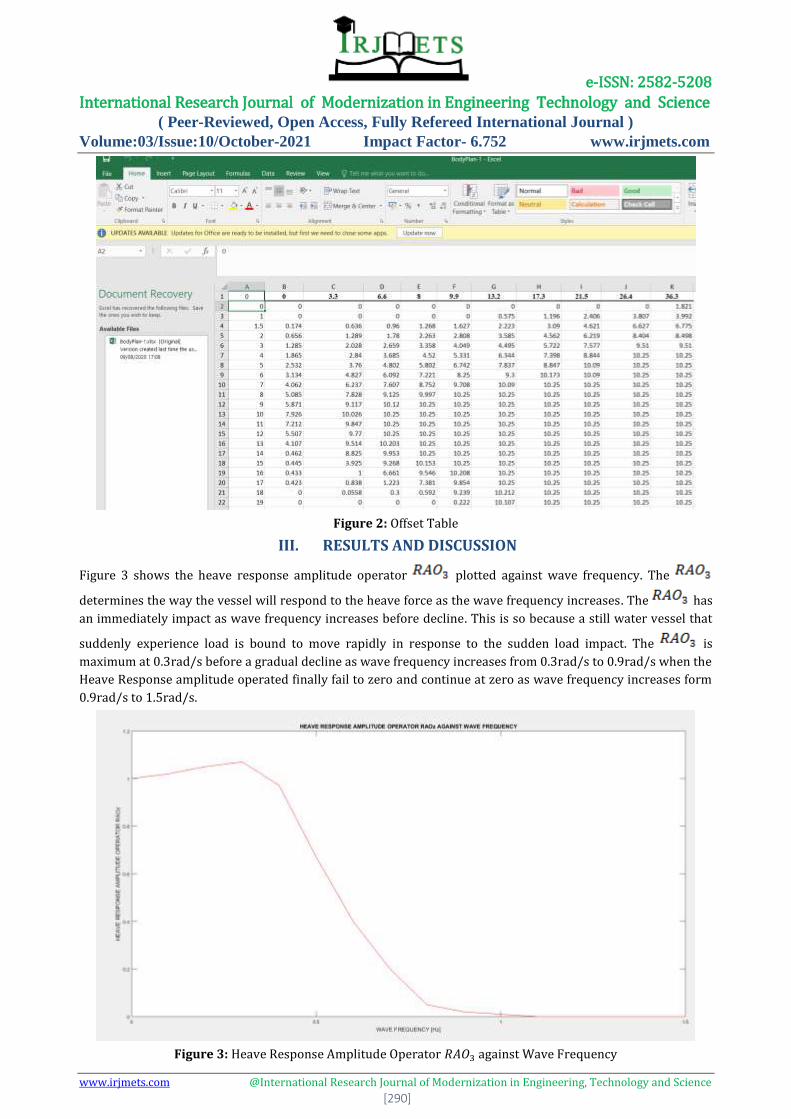
Figure 2 is the offset table of the vessel prepared in excel sheet. The offset table contain the vessel half breadth
that will be used for the computation by the program. This offset table are imported into the program by
clicking the import tab on the program. The offset table prepared in a way that the station is arrange on the first
column of the excel sheet while the draft at each waterline are arrange on the first row of the sheet. The other
row and column are made up of the half breadth of the vessel.
e-ISSN: 2582-5208 International Research Journal of Modernization in Engineering Technology and Science
( Peer-Reviewed, Open Access, Fully Refereed International Journal )
Volume:03/Issue:10/October-2021 Impact Factor- 6.752 www.irjmets.com
www.irjmets.com @International Research Journal of Modernization in Engineering, Technology and Science
[290]
Figure 2: Offset Table
III. RESULTS AND DISCUSSION
Figure 3 shows the heave response amplitude operator plotted against wave frequency. The
determines the way the vessel will respond to the heave force as the wave frequency increases. The has
an immediately impact as wave frequency increases before decline. This is so because a still water vessel that
suddenly experience load is bound to move rapidly in response to the sudden load impact. The is
maximum at 0.3rad/s before a gradual decline as wave frequency increases from 0.3rad/s to 0.9rad/s when the
Heave Response amplitude operated finally fail to zero and continue at zero as wave frequency increases form
0.9rad/s to 1.5rad/s.
Figure 3: Heave Response Amplitude Operator against Wave Frequency
e-ISSN: 2582-5208 International Research Journal of Modernization in Engineering Technology and Science
( Peer-Reviewed, Open Access, Fully Refereed International Journal )
Volume:03/Issue:10/October-2021 Impact Factor- 6.752 www.irjmets.com
www.irjmets.com @International Research Journal of Modernization in Engineering, Technology and Science
[291]
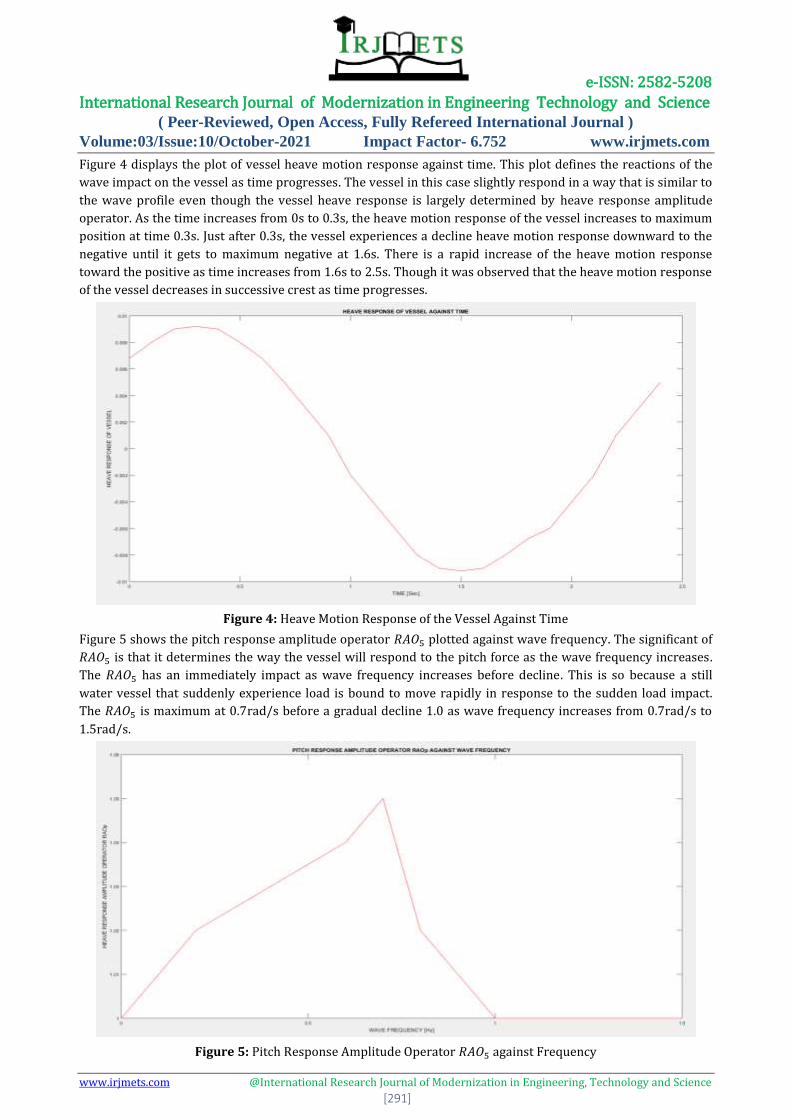
Figure 4 displays the plot of vessel heave motion response against time. This plot defines the reactions of the
wave impact on the vessel as time progresses. The vessel in this case slightly respond in a way that is similar to
the wave profile even though the vessel heave response is largely determined by heave response amplitude
operator. As the time increases from 0s to 0.3s, the heave motion response of the vessel increases to maximum
position at time 0.3s. Just after 0.3s, the vessel experiences a decline heave motion response downward to the
negative until it gets to maximum negative at 1.6s. There is a rapid increase of the heave motion response
toward the positive as time increases from 1.6s to 2.5s. Though it was observed that the heave motion response
of the vessel decreases in successive crest as time progresses.
Figure 4: Heave Motion Response of the Vessel Against Time
Figure 5 shows the pitch response amplitude operator plotted against wave frequency. The significant of
is that it determines the way the vessel will respond to the pitch force as the wave frequency increases.
The has an immediately impact as wave frequency increases before decline. This is so because a still
water vessel that suddenly experience load is bound to move rapidly in response to the sudden load impact.
The is maximum at 0.7rad/s before a gradual decline 1.0 as wave frequency increases from 0.7rad/s to
1.5rad/s.
Figure 5: Pitch Response Amplitude Operator against Frequency
e-ISSN: 2582-5208 International Research Journal of Modernization in Engineering Technology and Science
( Peer-Reviewed, Open Access, Fully Refereed International Journal )
Volume:03/Issue:10/October-2021 Impact Factor- 6.752 www.irjmets.com
www.irjmets.com @International Research Journal of Modernization in Engineering, Technology and Science
[292]
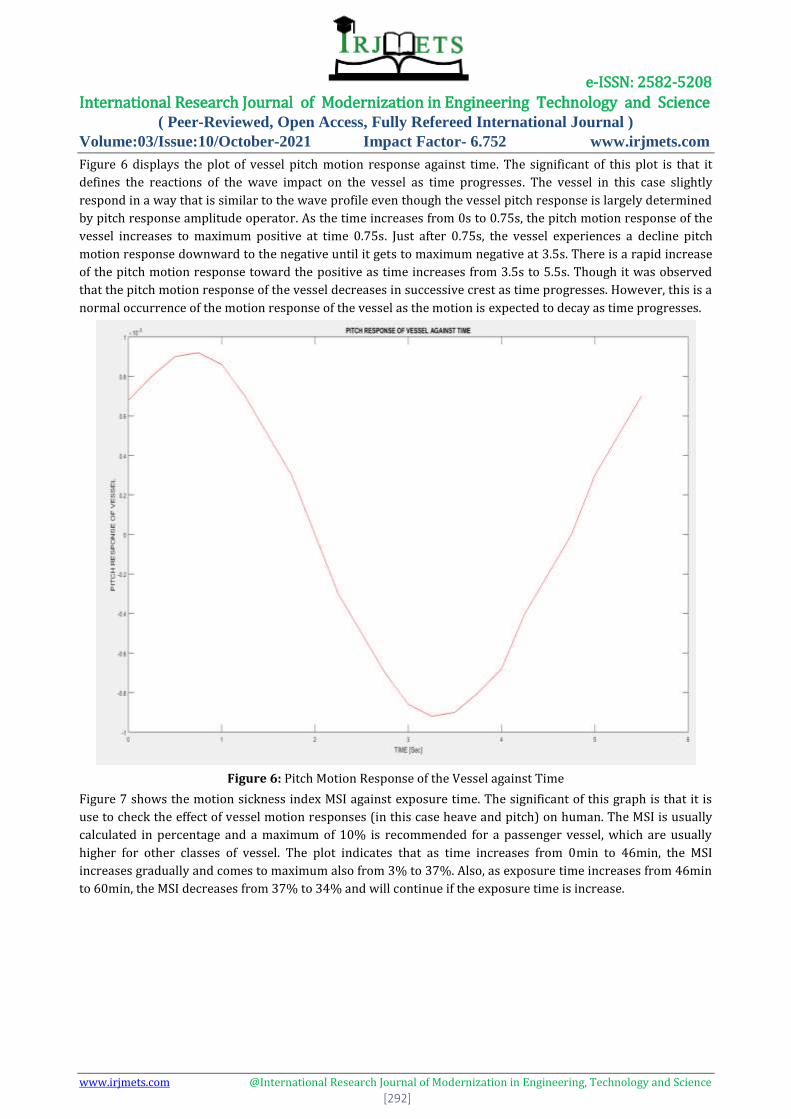
Figure 6 displays the plot of vessel pitch motion response against time. The significant of this plot is that it
defines the reactions of the wave impact on the vessel as time progresses. The vessel in this case slightly
respond in a way that is similar to the wave profile even though the vessel pitch response is largely determined
by pitch response amplitude operator. As the time increases from 0s to 0.75s, the pitch motion response of the
vessel increases to maximum positive at time 0.75s. Just after 0.75s, the vessel experiences a decline pitch
motion response downward to the negative until it gets to maximum negative at 3.5s. There is a rapid increase
of the pitch motion response toward the positive as time increases from 3.5s to 5.5s. Though it was observed
that the pitch motion response of the vessel decreases in successive crest as time progresses. However, this is a
normal occurrence of the motion response of the vessel as the motion is expected to decay as time progresses.
Figure 6: Pitch Motion Response of the Vessel against Time
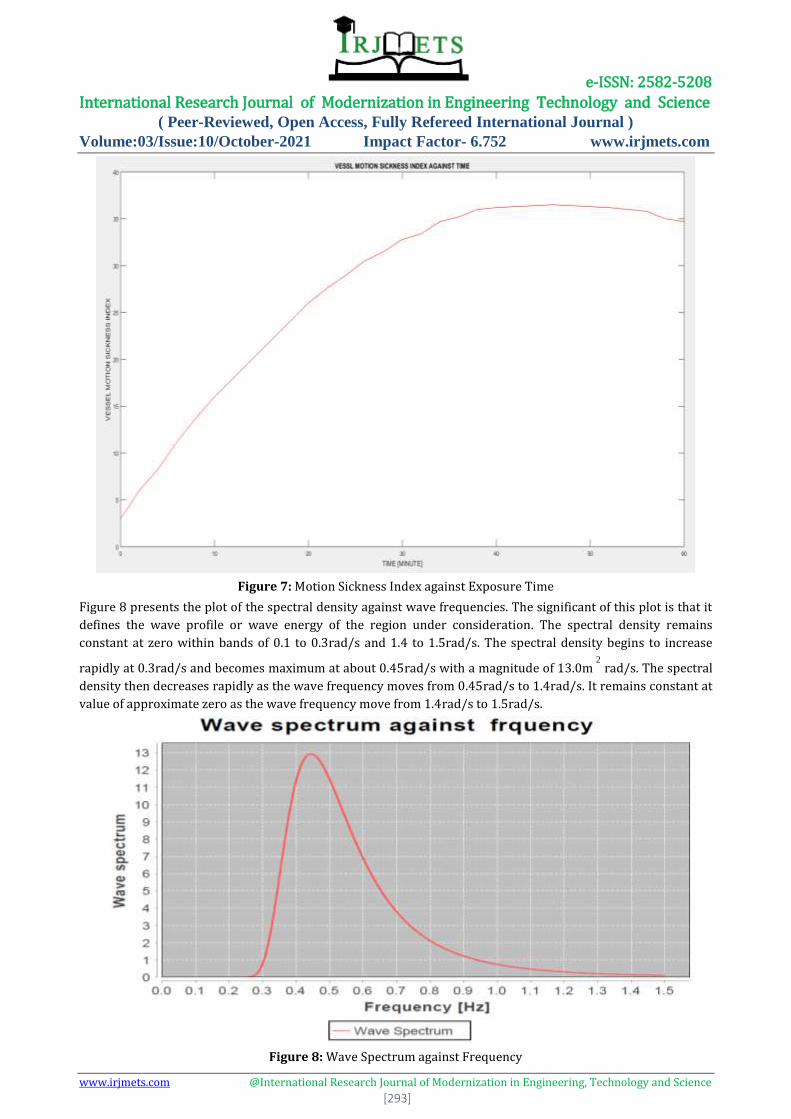
Figure 7 shows the motion sickness index MSI against exposure time. The significant of this graph is that it is
use to check the effect of vessel motion responses (in this case heave and pitch) on human. The MSI is usually
calculated in percentage and a maximum of 10% is recommended for a passenger vessel, which are usually
higher for other classes of vessel. The plot indicates that as time increases from 0min to 46min, the MSI
increases gradually and comes to maximum also from 3% to 37%. Also, as exposure time increases from 46min
to 60min, the MSI decreases from 37% to 34% and will continue if the exposure time is increase.
e-ISSN: 2582-5208 International Research Journal of Modernization in Engineering Technology and Science
( Peer-Reviewed, Open Access, Fully Refereed International Journal )
Volume:03/Issue:10/October-2021 Impact Factor- 6.752 www.irjmets.com
www.irjmets.com @International Research Journal of Modernization in Engineering, Technology and Science
[293]
Figure 7: Motion Sickness Index against Exposure Time
Figure 8 presents the plot of the spectral density against wave frequencies. The significant of this plot is that it
defines the wave profile or wave energy of the region under consideration. The spectral density remains
constant at zero within bands of 0.1 to 0.3rad/s and 1.4 to 1.5rad/s. The spectral density begins to increase
rapidly at 0.3rad/s and becomes maximum at about 0.45rad/s with a magnitude of 13.0m2
rad/s. The spectral
density then decreases rapidly as the wave frequency moves from 0.45rad/s to 1.4rad/s. It remains constant at
value of approximate zero as the wave frequency move from 1.4rad/s to 1.5rad/s.
Figure 8: Wave Spectrum against Frequency
e-ISSN: 2582-5208 International Research Journal of Modernization in Engineering Technology and Science
( Peer-Reviewed, Open Access, Fully Refereed International Journal )
Volume:03/Issue:10/October-2021 Impact Factor- 6.752 www.irjmets.com
www.irjmets.com @International Research Journal of Modernization in Engineering, Technology and Science
[294]
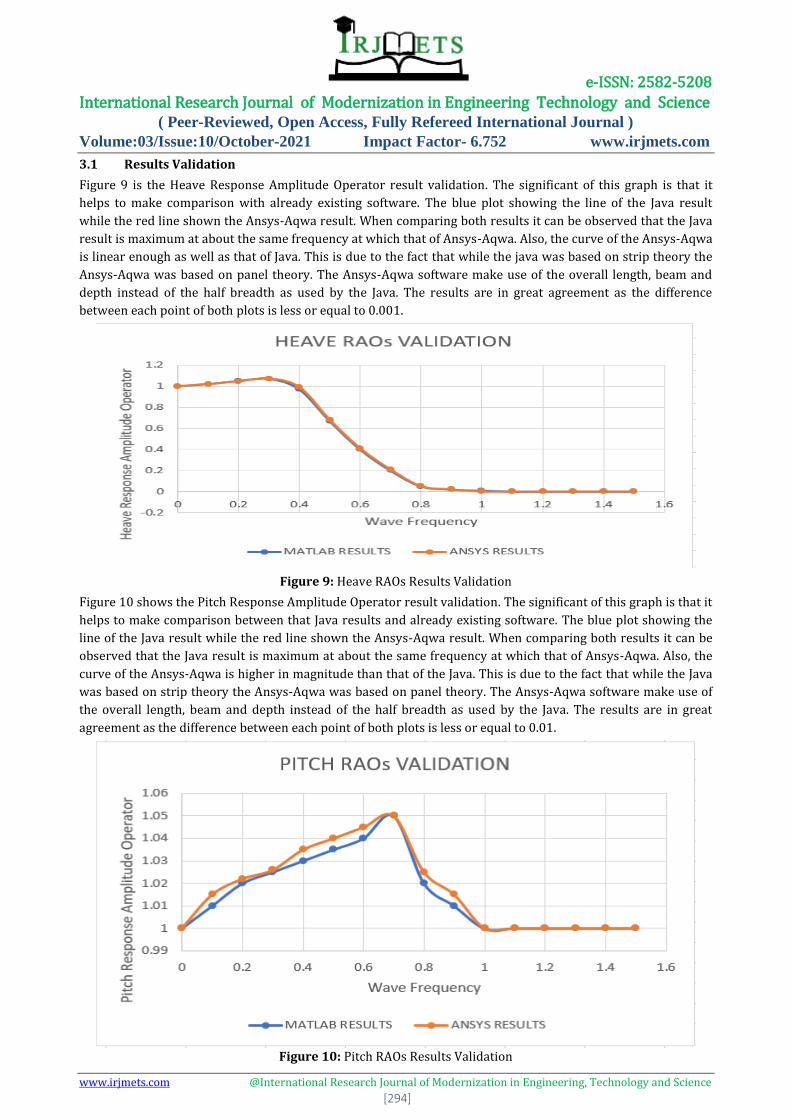
3.1 Results Validation
Figure 9 is the Heave Response Amplitude Operator result validation. The significant of this graph is that it
helps to make comparison with already existing software. The blue plot showing the line of the Java result
while the red line shown the Ansys-Aqwa result. When comparing both results it can be observed that the Java
result is maximum at about the same frequency at which that of Ansys-Aqwa. Also, the curve of the Ansys-Aqwa
is linear enough as well as that of Java. This is due to the fact that while the java was based on strip theory the
Ansys-Aqwa was based on panel theory. The Ansys-Aqwa software make use of the overall length, beam and
depth instead of the half breadth as used by the Java. The results are in great agreement as the difference
between each point of both plots is less or equal to 0.001.
Figure 9: Heave RAOs Results Validation
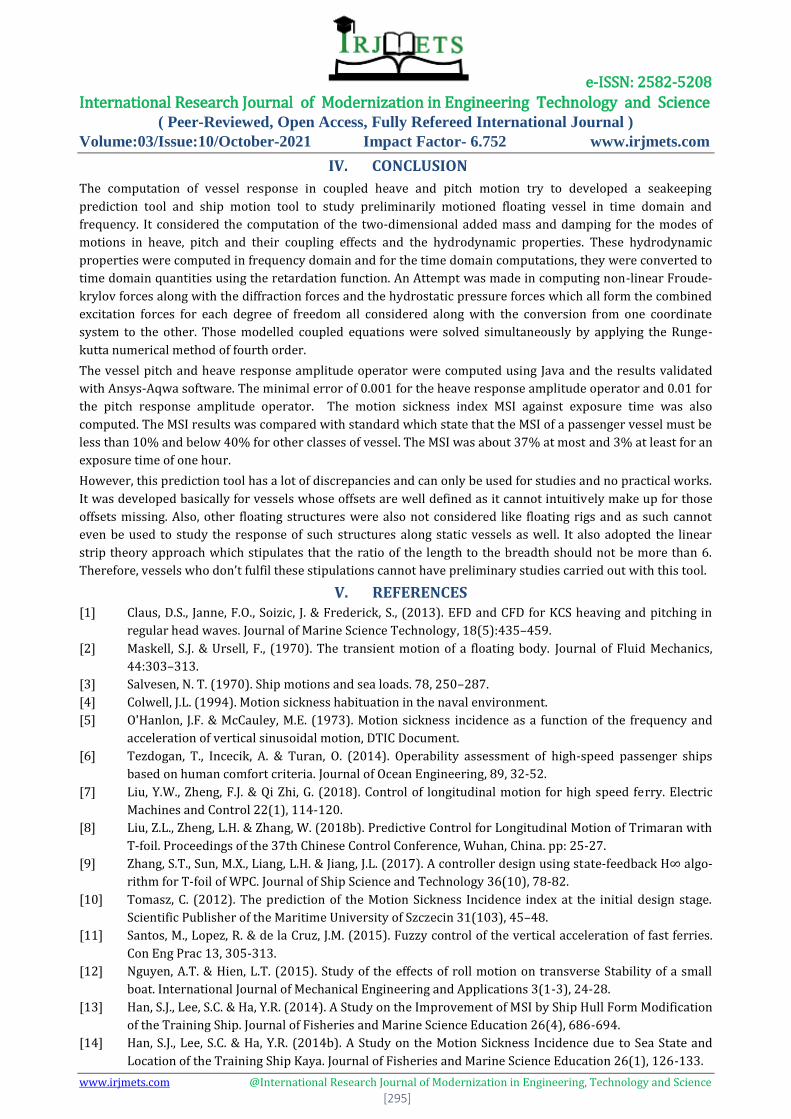
Figure 10 shows the Pitch Response Amplitude Operator result validation. The significant of this graph is that it
helps to make comparison between that Java results and already existing software. The blue plot showing the
line of the Java result while the red line shown the Ansys-Aqwa result. When comparing both results it can be
observed that the Java result is maximum at about the same frequency at which that of Ansys-Aqwa. Also, the
curve of the Ansys-Aqwa is higher in magnitude than that of the Java. This is due to the fact that while the Java
was based on strip theory the Ansys-Aqwa was based on panel theory. The Ansys-Aqwa software make use of
the overall length, beam and depth instead of the half breadth as used by the Java. The results are in great
agreement as the difference between each point of both plots is less or equal to 0.01.
Figure 10: Pitch RAOs Results Validation
e-ISSN: 2582-5208 International Research Journal of Modernization in Engineering Technology and Science
( Peer-Reviewed, Open Access, Fully Refereed International Journal )
Volume:03/Issue:10/October-2021 Impact Factor- 6.752 www.irjmets.com
www.irjmets.com @International Research Journal of Modernization in Engineering, Technology and Science
[295]
IV. CONCLUSION
The computation of vessel response in coupled heave and pitch motion try to developed a seakeeping
prediction tool and ship motion tool to study preliminarily motioned floating vessel in time domain and
frequency. It considered the computation of the two-dimensional added mass and damping for the modes of
motions in heave, pitch and their coupling effects and the hydrodynamic properties. These hydrodynamic
properties were computed in frequency domain and for the time domain computations, they were converted to
time domain quantities using the retardation function. An Attempt was made in computing non-linear Froude-
krylov forces along with the diffraction forces and the hydrostatic pressure forces which all form the combined
excitation forces for each degree of freedom all considered along with the conversion from one coordinate
system to the other. Those modelled coupled equations were solved simultaneously by applying the Runge-
kutta numerical method of fourth order.
The vessel pitch and heave response amplitude operator were computed using Java and the results validated
with Ansys-Aqwa software. The minimal error of 0.001 for the heave response amplitude operator and 0.01 for
the pitch response amplitude operator. The motion sickness index MSI against exposure time was also
computed. The MSI results was compared with standard which state that the MSI of a passenger vessel must be
less than 10% and below 40% for other classes of vessel. The MSI was about 37% at most and 3% at least for an
exposure time of one hour.
However, this prediction tool has a lot of discrepancies and can only be used for studies and no practical works.
It was developed basically for vessels whose offsets are well defined as it cannot intuitively make up for those
offsets missing. Also, other floating structures were also not considered like floating rigs and as such cannot
even be used to study the response of such structures along static vessels as well. It also adopted the linear
strip theory approach which stipulates that the ratio of the length to the breadth should not be more than 6.
Therefore, vessels who don’t fulfil these stipulations cannot have preliminary studies carried out with this tool.
V. REFERENCES [1] Claus, D.S., Janne, F.O., Soizic, J. & Frederick, S., (2013). EFD and CFD for KCS heaving and pitching in
regular head waves. Journal of Marine Science Technology, 18(5):435–459.
[2] Maskell, S.J. & Ursell, F., (1970). The transient motion of a floating body. Journal of Fluid Mechanics,
44:303–313.
[3] Salvesen, N. T. (1970). Ship motions and sea loads. 78, 250–287.
[4] Colwell, J.L. (1994). Motion sickness habituation in the naval environment.
[5] O'Hanlon, J.F. & McCauley, M.E. (1973). Motion sickness incidence as a function of the frequency and
acceleration of vertical sinusoidal motion, DTIC Document.
[6] Tezdogan, T., Incecik, A. & Turan, O. (2014). Operability assessment of high-speed passenger ships
based on human comfort criteria. Journal of Ocean Engineering, 89, 32-52.
[7] Liu, Y.W., Zheng, F.J. & Qi Zhi, G. (2018). Control of longitudinal motion for high speed ferry. Electric
Machines and Control 22(1), 114-120.
[8] Liu, Z.L., Zheng, L.H. & Zhang, W. (2018b). Predictive Control for Longitudinal Motion of Trimaran with
T-foil. Proceedings of the 37th Chinese Control Conference, Wuhan, China. pp: 25-27.
[9] Zhang, S.T., Sun, M.X., Liang, L.H. & Jiang, J.L. (2017). A controller design using state-feedback H∞ algo-
rithm for T-foil of WPC. Journal of Ship Science and Technology 36(10), 78-82.
[10] Tomasz, C. (2012). The prediction of the Motion Sickness Incidence index at the initial design stage.
Scientific Publisher of the Maritime University of Szczecin 31(103), 45–48.
[11] Santos, M., Lopez, R. & de la Cruz, J.M. (2015). Fuzzy control of the vertical acceleration of fast ferries.
Con Eng Prac 13, 305-313.
[12] Nguyen, A.T. & Hien, L.T. (2015). Study of the effects of roll motion on transverse Stability of a small
boat. International Journal of Mechanical Engineering and Applications 3(1-3), 24-28.
[13] Han, S.J., Lee, S.C. & Ha, Y.R. (2014). A Study on the Improvement of MSI by Ship Hull Form Modification
of the Training Ship. Journal of Fisheries and Marine Science Education 26(4), 686-694.
[14] Han, S.J., Lee, S.C. & Ha, Y.R. (2014b). A Study on the Motion Sickness Incidence due to Sea State and
Location of the Training Ship Kaya. Journal of Fisheries and Marine Science Education 26(1), 126-133.

e-ISSN: 2582-5208 International Research Journal of Modernization in Engineering Technology and Science
( Peer-Reviewed, Open Access, Fully Refereed International Journal )
Volume:03/Issue:10/October-2021 Impact Factor- 6.752 www.irjmets.com
www.irjmets.com @International Research Journal of Modernization in Engineering, Technology and Science
[296]
[15] Ku-Youn, K. (2012). Analysis for Motion Sickness Incidence (MSI) of the Changing Factors of the Ship
Operational Environment. Master's Thesis, Mokpo National Maritime University of Graduate School,
South Korea.
[16] Cepowski, T. (2010). Influence analysis of changes of design parameters of passenger-car ferries on
selected seakeeping qualities. Journal of Polish Maritime Research, 1(63), vol. 16, 25–33.
[17] International Standard Organization ISO (1997). Mechanical vibration and shock – Evaluation of
human exposure to whole body vibration. 2631–1.