Embed Size (px)
Citation preview

50th International Conference on Environmental Systems ICES-2021-247 12-15 July 2021
Copyright © 2021 Ryuta Hatakenaka, Japan Aerospace Exploration Agency
Heat-transfer Characteristics of a Spacer-type, Fin-
integrated PCM Device by Additive Manufacturing
Ryuta Hatakenaka 1
Japan Aerospace Exploration Agency, Tsukuba, Ibaraki, 305-8505, Japan
Masanori. Saitoh 2
Orbital Engineering Inc., Yokohama, Kanagawa, 221-0822, Japan
Takafumi Yamamoto 3
Toyama Industrial Technology Research and Development Center, Takaoka, Toyama, 933-0981, Japan
Takanori Kobayashi 4
Hokkaido Industrial Technology Center, Hakodate, Hokkaido, 041-0801, Japan
and
Hiroshi Yokozawa 5
NEC Corporation, Fuchu, Tokyo, 183-8501, Japan
A spacer-type heat storage device was fabricated via additive manufacturing and filled
with phase change material (PCM), sandwiched between a heat source and the spacecraft
structure. Vertically aligned internal fin layout was selected and its dimension was designed
to manage a heat flux up to 1.0W/cm2 for a maximum temperature difference of less than 10
K across the device. A promising PCM for use in electrical components is lithium nitrate
trihydrate (LiNO3-3H2O). This PCM has a melting point and equivalent latent heat similar to
octadecane (C18H38), which needs to be specially prepared. It also has double the density and
triple the thermal conductivity of octadecane. This paper compares the heat dissipation and
absorption characteristics of lithium nitrate trihydrate and octadecane during the solid-liquid
phase change using differential scanning calorimetry (DSC) and a 3-layer calorimeter. The
transient thermal response of separate devices each filled with one of the two PCMs was
evaluated under uniform heating, partial heating, and uniform cooling. The highly anisotropic
heat conduction of the fins has been shown to meet the requirement; however, the design
method needs to be modified to take into account the change in radial heat flux over time.
Nomenclature
afin = Side length of a columnar fin
p = Pitch of internal fins of the PCM device
H = Height of the device
hf = Latent heat of fusion of the PCM
L = Length of the device
Lex = Extended length of the device for partial heating
Nfin = Number of fins
Q = Heat load applied to the device
1 Associate Senior Researcher, Research and Development Directorate, 2-1-1 Sengen, Tsukuba-shi, Ibaraki. 2 Head, Engineering Group, 1-18-19 Nishikanagawa, Kanagawa-ku, Yokohama-shi, Kanagawa. 3 Associate Senior Researcher, Digital Manufacturing Section, 150 Futagamicho, Takaoka, Toyama. 4 Researcher, Applied Technology Group, R&D Div., 379 Kikyocho, Hakodate-shi, Hokkaido. 5 Assistant Manager, Space Systems Division, 1st Space Technology Department, 1-10 Nisshincho, Fuchu-shi, Tokyo.

International Conference on Environmental Systems
2
q = Heat flux applied to the device based on the area of contact with the heater
Ri = Area equivalent radius of column fin’s cross section
Ro = Area equivalent radius of the square region covered by a fin
Tm = Melting point of the PCM
Ts = Temperature of solidification of the PCM
tskin = Skin thickness of the device
W = Width of the device
fin = Area fraction of fins
AL = Thermal conductivity of aluminum
l = Thermal conductivity of the PCM in a liquid state
x, y = In-plane effective thermal conductivity of the PCM-fin composite
z = Out-of-plane effective thermal conductivity of the PCM-fin composite
l = Density of the PCM in a liquid state
T1 = Out-of-plane temperature difference
T2 = In-plane temperature difference between the PCM and the closest fin
T3 = In-plane temperature difference in the extended part of the device.
Ttot = Overall temperature drop between the top face of device and Tm when PCM becomes completely liquid
I. Introduction
eat storage is a crucial technology for space missions that involve re-entry, short-term high heat dissipation, or
insufficient radiator area (e.g., space suit and manned rover). Using a heat sink utilizing a phase change material
(PCM) is the most common method for heat storage in the space industry. A variety of PCM application to meet
various thermal requirements can be found in a thermal control handbook 1.
The major challenge in the thermal design of a PCM device is the heat transfer from the heated region of device
to PCM filled in it since its thermal conductivity is usually small. An additional heat conductive structure is installed
in the device to enhance the heat transfer; however, it reduces the amount of PCM given the fixed container dimension
leading to significant degradations of the heat storage capacity per unit mass or per unit volume. A PCM device is
usually tailor-made with specific thermal requirements; thus, comparing different PCM devices requires careful
considerations. Cognata et al. 2 have evaluated various interstitial materials in such forms as a honeycomb core, foam,
and fins and have established mathematical models to estimate their thermal performance. In general, small- pore
structure made from a material with high thermal conductivity and low density is suitable. In addition, carbon fiber
core 3-4, graphite fiber cores 5, and graphite foams 6-7 have been studied. The weight reduction of the air-tight container
is also important to mitigate the degradation of heat storage capacity. Knowles 3 introduced the composite cold plate
concept, in which the exterior casing and internal heat conductive fibers are bonded together. This structure reduces
the weight of the exterior skins due to the structural support by the fibers.
An excellent PCM device can be fabricated by additive manufacturing (AM) to achieve a high mass efficiency by
using a fin-integrated container and efficient columnar fins for heat diffusion 8. The design flexibility of AM enables
the creation of an outer shape that can fit into unused space and allows a device to be integrated into component casing,
structural parts 9, and so on. Embedding a PCM device into the casing of an electrical component or heat transport
device (e.g., fluid loop and heat pipes) eliminates contact thermal resistance, which leads to the higher overall thermal
performance; however, it requires a greater commitment by the engineers to the component and system-level thermal
control system of the spacecraft as a whole. In addition to the inevitable design complexity, the requirement for PCM
device or its necessity are supposed to be determined in the later stage of the spacecraft system design. Thus, it is
usually difficult to embed PCM device into the other devices or components in on-going projects unless it is planned
in advance. A spacer-type PCM device can be sandwiched between an electrical component and a structural panel –
this is one of the simplest ways to add heat storage to a system; it does not expand the existing footprint, provided the
system has sufficient height to accommodate a separately developed PCM device. The out-of-plane thermal resistance
of the device is a key parameter since it may spoil the heat transport efficiency from the component to the radiator.
The selection of a PCM is also significant. Grodzka 10 and Hale 11 have performed extensive investigations on
possible PCMs for use in space. N-paraffins (CnH2n+2) are now the most commonly used PCM since they have a wide
variety of melting points in increments of a few K depending on the number of carbon atoms in the molecule. The
material can provide a high latent heat of fusion per mass. It is chemically stable and compatible with many container
materials. It also shows good freeze-thaw cycle stability 12. However, its small thermal conductivity and low-density
lead to a small heat storage capacity per unit mass as a device. Another promising PCM category identified by Grodzka
H

International Conference on Environmental Systems
3
10 is the salt hydrates, especially lithium nitrate trihydrate (LiNO3-3H2O, Tm=29.8℃). It has an equivalent latent heat
of fusion and double the density of a paraffin (octadecane, C18H38, Tm=28℃) and has a similar melting point. These
characteristics lead to double the heat storage capacity per unit volume. Pauken et al. 6-7 reported an excellent heat
storage capacity of a PCM device charged with lithium nitrate trihydrate. However, there have been no further reports
since their work.
The current study used a spacer-type, fin-integrated PCM device (Figure 1(a)) designed to meet model thermal
control requirements: the very high heat flux of 1.0 W/cm2 and a maximum out-of-plane temperature drop of 10 K. A
vertically aligned fin layout was selected. Two different PCMs, octadecane and lithium nitrate trihydrate-based PCM,
were used in two test pieces with the same design. Rubitherm Technologies GmbH specially prepared the latter
material to reduce subcooling during freezing cycle. The heat absorption/dissipation characteristics were evaluated
via differential scanning calorimetry (DSC) and a 3-layer calorimeter method. The influence of the PCM’s thermal
properties on the device-level thermal performance is discussed based on the device-level testing consisting of a
uniform-heating test, partial heating test, and uniform cooling test.
II. Thermal Requirement for Spacer-type PCM Device
The thermal requirements considered in this paper are summarized in Table 1. The device is sandwiched between
an electrical component that dissipates a large heat in a short time period and the structural panel of the spacecraft, as
shown in Figure 1(a). The maximum heat flux of q = 1.0 W/cm2 and a typical operating temperature of electrical
component (-20∼+60℃) are considered. The height of device (H) should be within the maximum allowable size,
whereas the heat storage capacity should be larger than the requirement. These are determined for each application,
thus not specified here.
Taking into account a design margin (10 ℃) and temperature drop across the thermal filler between the component
and the PCM device (10 ℃ at 1000 W/m2K), the temperature of the top face of PCM device should be below 40 ℃
Figure 1. Overview of spacer-type, fin-integrated PCM device. (a) Application method to spacecraft system,
(b) Appearance of a test piece, (c) A port sealed via welding for vacuum condition (not used in this study).
Table 1. Thermal requirements for spacer-type PCM device Value Description
Maximum heat flux, q 1.0 W/cm2 Large value that will demands PCM
Operating temperature of component -20∼+60℃ Typical values for electronics
Maximum allowable temperature of the top face
of the device +40℃
+60℃ – design margin (10℃)
– temp. drop across filler (10℃)
Temperature drop across the device, Ttot < 10 ℃
Melting point of PCM, Tm < +35℃
Solidification point of PCM, Ts - Subcooling (Tm -Ts) should be as small
as possible.
Cycle stability > 20,000 Cyclic use in LEO (3 years)

International Conference on Environmental Systems
4
under the maximum heat flux. Given that the heat storage capacity is fully utilized, the temperature peaks at the
moment when the PCM in the device completely melts. The requirement for the maximum temperature drop across
the device (designated as Ttot) is influenced by the melting point (Tm) of the PCM. The lower Tm is, the larger Ttot
becomes acceptable. The choice of the solidification point (Ts) is crucial for cyclic use, since the PCM has a limited
time to solidify. The higher Ts is more convenient for the system, i.e., the subcooling (Tm – Ts) should be as small as
possible. Detailed requirement for subcooling will be specified for each application.
The requirement of thermal cycle stability also depends on mission requirement. It may be one time in case of
single-use rocket and reentry vehicle, whereas more than 20,000 cycles will be necessary for LEO satellite use over
three years. In this study, the target cycle life is set at 20,000 cycles aiming for a versatile device.
III. Selection and Evaluation of PCM
A. Selection of PCM
Candidate PCMs whose melting point (Tm) is around 30 ℃ are listed in Table 2 based on a literature survey10, 13.
The n-paraffins are the first choices because of their high latent heat of fusion (hf), chemical stability, and cycle
stability. The paraffins with odd number of C atoms have smaller hf than those with even C numbers. Therefore, the
best performance can be obtained at 8℃ intervals of Tm at this temperature range. The properties of fatty acids and
polyethylene glycol are less attractive than those of paraffins. Gallium has extremely high density and thermal
conductivity, while its latent heat per mass is small. It is useful for such applications as temperature stabilization of
high-accuracy sensors. Finding a solid-solid PCM that eliminates the need for a container is beyond the scope of this
study, but the properties for doped vanadium dioxide (VO2) 14-15 are shown for comparison. The thermal properties
may improve in the future; however, the current thermal performance is not competitive to a combination of the metal
fins and a solid-liquid PCM.
Salt hydrates are not often used in the space industry, but they are widespread in terrestrial PCM use. Four
candidates have excellent hf per volume due to their high densities and large thermal conductivities compared to n-
Table 2. PCM candidates (Tm~30℃) 10, 13-15
Tm
[℃] l
[kg/m3]
hf l
[W/mK] Note
[J/g] [J/cm3]
Solid-
liquid
n-paraffin
CnH2n+2
Octadecane(n=18) 28
780
243 190
0.15
Nonadecane(n=19) 32 187 146
Eicosane (n=20) 36 247 193
Fatty acid Caprylic acid 890 153 136 0.15
Polyethylene
glycol
Molecular
mass ~900 23 1123 169 190 0.38
Salt hydrates
LiNO3-3H2O 29.9 1400 296 414 - Congruent
Na2SO4-10H2O 32.35 1485 251.2 373 0.544 Incongruent
Na2CO3-10H2O 33 1460 247 360 - Semi-congruent
NaHPO4-12H2O 35.2 1442 279.6 403 0.476 Semi-congruent
Metal Gallium 29.8 6000 80.2 481 40.6
Solid-Solid
Doped vanadium
dioxide (VO2) 14 Adjust
able
4300 43 180 5 Average of Tm=
10℃ and 70℃
Metal + VO2 15 No data
No
data (100) (70)
Tm for the L and
l isn’t written
Figure 2. Schematic illustration of phase separation mechanism of salt hydrate
International Conference on Environmental Systems
5
paraffins. In general, the use of salt hydrates as a PCM requires additional attention for phase separation due to the
freeze-thaw cycle and the subcooling. A salt hydrate is a mixture of a salt and water in a particular molecular ratio.
The mixture forms various hydrates with different numbers of water molecules in a unit cell (e.g., anhydrous salt, 0.5
hydrate, trihydrate, and decahydrate) depending on the mass ratio and the temperature. The heat dissipated or absorbed
during a transition of the hydrate structure is utilized for heat storage. Each salt hydrate has its phase diagram for the
mass ratio and the temperature. Phase diagrams for a large variety of salt hydrates were summarized by Lane 13.
A schematic illustration of the phase separation mechanism of salt hydrate is shown in Figure 2. The phase
separation is triggered by segregation of anhydrous salt when the solidified salt hydrate releases liquid water (i.e.,
decomposition of the original salt hydrate) due to heat up. The segregation happens when the solubility of anhydrous
salt in water at the temperature is insufficient. The salt hydrates that show this phenomenon are described as
“incongruent”, whereas those that can dissolve all anhydrous salt in water are described as “congruent”. Segregated
anhydrous salt sediments at the bottom of the casing due to gravity, and only the top layer of the sedimentation forms
salt hydrate in the next cooling cycle as illustrated in Figure 2 (c-d), resulting in phase separation. Thickener or
gelation agent are usually used to mitigate the phase separation; however, a congruent salt hydrate that becomes a
complete liquid solution without any segregation is advisable. Only a few congruent salt hydrates are available at
room temperature, one of which is lithium nitrate trihydrate (LiNO3-3H2O). This compound has attracted much
attention in the space industry 6-7, 10-12, but no further investigation has been reported. Also, it is not used in terrestrial
application due to its high cost and the existence of alternative (incongruent) salt hydrates.
Another challenge to use of salt hydrates is determining effective nucleating additives to mitigate subcooling.
Pauken et al. 6-7 reported that zinc nitrate (ZnNO3) is effective as a nucleator; however, it is a powerful drug that
demands careful handling. In this study, another, safer nucleator material was selected by Rubitherm Technologies
GmbH. The newly developed, LiNO3-3H2O-based PCM including a nucleator is referred to “SP30L” in this paper.
B. Thermal Properties
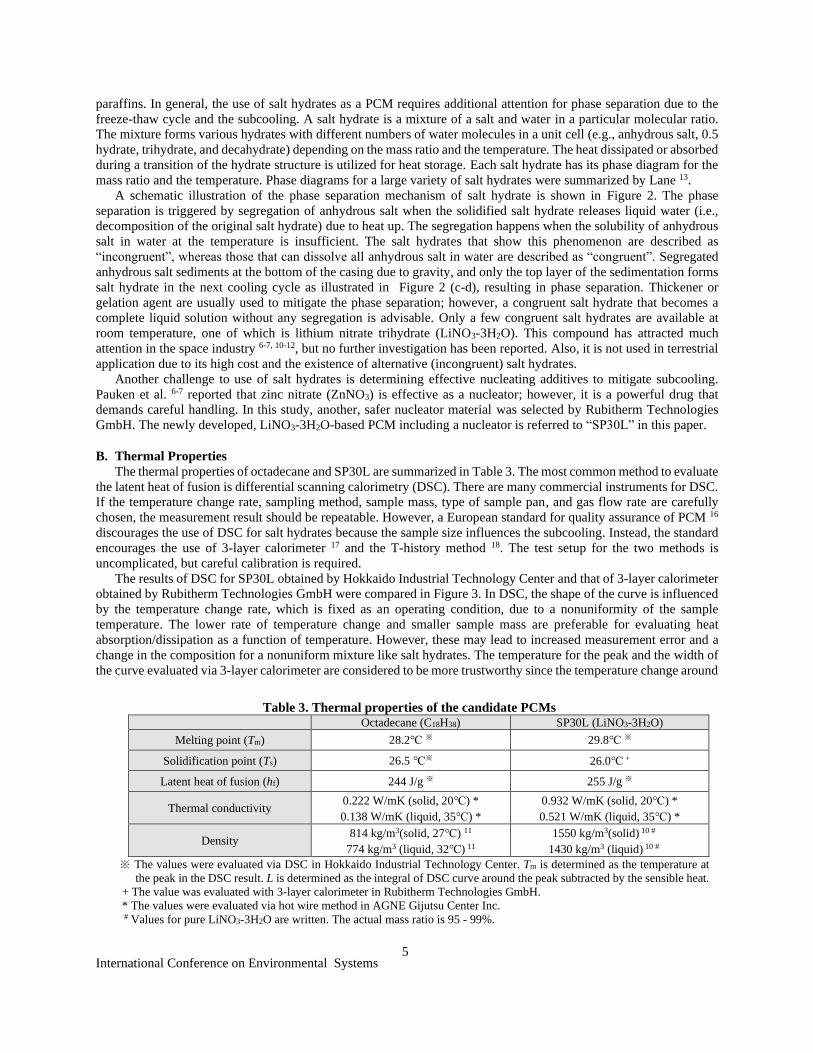
The thermal properties of octadecane and SP30L are summarized in Table 3. The most common method to evaluate
the latent heat of fusion is differential scanning calorimetry (DSC). There are many commercial instruments for DSC.
If the temperature change rate, sampling method, sample mass, type of sample pan, and gas flow rate are carefully
chosen, the measurement result should be repeatable. However, a European standard for quality assurance of PCM 16
discourages the use of DSC for salt hydrates because the sample size influences the subcooling. Instead, the standard
encourages the use of 3-layer calorimeter 17 and the T-history method 18. The test setup for the two methods is
uncomplicated, but careful calibration is required.
The results of DSC for SP30L obtained by Hokkaido Industrial Technology Center and that of 3-layer calorimeter
obtained by Rubitherm Technologies GmbH were compared in Figure 3. In DSC, the shape of the curve is influenced
by the temperature change rate, which is fixed as an operating condition, due to a nonuniformity of the sample
temperature. The lower rate of temperature change and smaller sample mass are preferable for evaluating heat
absorption/dissipation as a function of temperature. However, these may lead to increased measurement error and a
change in the composition for a nonuniform mixture like salt hydrates. The temperature for the peak and the width of
the curve evaluated via 3-layer calorimeter are considered to be more trustworthy since the temperature change around
Table 3. Thermal properties of the candidate PCMs Octadecane (C18H38) SP30L (LiNO3-3H2O)
Melting point (Tm) 28.2℃ ※ 29.8℃ ※
Solidification point (Ts) 26.5 ℃※ 26.0℃ +
Latent heat of fusion (hf) 244 J/g ※ 255 J/g ※
Thermal conductivity 0.222 W/mK (solid, 20℃) *
0.138 W/mK (liquid, 35℃) *
0.932 W/mK (solid, 20℃) *
0.521 W/mK (liquid, 35℃) *
Density 814 kg/m3(solid, 27℃) 11
774 kg/m3 (liquid, 32℃) 11
1550 kg/m3(solid) 10 #
1430 kg/m3 (liquid) 10 #
※ The values were evaluated via DSC in Hokkaido Industrial Technology Center. Tm is determined as the temperature at
the peak in the DSC result. L is determined as the integral of DSC curve around the peak subtracted by the sensible heat.
+ The value was evaluated with 3-layer calorimeter in Rubitherm Technologies GmbH.
* The values were evaluated via hot wire method in AGNE Gijutsu Center Inc.
# Values for pure LiNO3-3H2O are written. The actual mass ratio is 95 - 99%.

International Conference on Environmental Systems
6
the phase change decreased because of fixed environmental conditions. A typical sample mass for 3-layer calorimeter
is more than 100 g, a large enough amount to behave as “bulk”.
In the DSC measurement, an ultrasonic radiation was applied to a bottle of SP-30L in a water bath maintained
above the melting point. The bottle was shaken, then the sample was taken from the bottle immediately so that the
composition of the sample became as close as possible to that of the bulk amount. In the heating cycle shown in Figure
3 (a), the results of DSC agree well with that of 3-layer calorimeter. The result of SP-30L under 0.1 ℃/min, and 13mg
is consistent with that under 0.2 ℃/min, and 30 mg in terms of the total amount of latent heat. However, the shape of
the curve in the first case agrees better with the curve taken via 3-layer calorimeter. It is shown here that DSC can
precisely evaluate the heat absorption characteristics for salt hydrates. The result is repeatable; thus, the sampling
method is valid. On the other hand, the results of the two methods in the cooling phase were significantly different.
The solidification point (Ts) in the DSC measurement was not consistently repeatable, even in multiple runs taken
from the same sample. The variation among the different samples was even more significant. The solidification point
was lower than that observed in the 3-layer calorimeter. Evaluating Ts of salt hydrates via DSC has been confirmed to
be inappropriate even when the homogenization of the sample is carefully performed.
The thermal conductivities were measured via hot wire method 19 by Agne Gijutsu Center Inc. The thermal
conductivities of SP30L have been confirmed to be significantly larger than those of octadecane. The literature values
for the densities indicate that the volume changes due to phase change for octadecane and SP30L are 5% and 8%,
respectively. Note that SP30L decreases its volume when it solidified unlike solidification of pure water. The total
volume of the void becomes larger for SP30L than octadecane; however, it has only minor influence on the heat
transfer performance due to the fins, irrespective to if it is concentrated or dispersed.
C. Material compatibility and thermal cycle stability of SP30L
Lithium nitrate trihydrate has been identified as compatible with aluminum by Grodzka 10; however, the detail of
the compatibility test was not presented. The existence of the nucleator and the composition of aluminum alloy (Al-
Si10-Mg) may also influence the result, thus a long-time exposure test of the alloy to SP30L is on-going. Polished,
thin Al-Si10-Mg plates with the thickness of 0.1 - 0.2 mm are immersed in SP30L filled in polypropylene bottles
stored in an oven set at 60℃. The measurement of the plate mass and microscopic visual observation are performed
periodically. No significant changes were observed two months after the start.
The thermal cycle stability of lithium nitrate trihydrate is expected to be good because of its congruent feature (see
Sec. IIIA); however, the influence of thermal cycle on the effectiveness of nucleator has not been sufficiently studied.
One possible measure to improve the cycle stability is the addition of thickener or gelation agent, whereas the
determination and preparation of those involve a lot of effort. The thermal cycle is usually applied to the sample with
the highest frequency as possible, and then the detailed measurement is performed periodically in a different setup. It
requires special care in case of salt hydrates, since the loss/gain of water has significant influence on their
characteristics 20. The container for the PCM during thermal cycling must be sufficiently airtight. A thermal cycle test
for SP30L up to 370 cycles was performed by Rubitherm Technologies GmbH, where no degradation was identified
with the 3-layer calorimeter. A thermal cycling test up to 20,000 cycles accompanied by DSC is also in preparation.
Figure 3. Heat absorption and dissipation characteristics evaluated via DSC (Hokkaido Industrial
Technology Center, 0.2 ℃/min or 0.1 ℃/min) and 3-layer calorimeter (Rubitherm Technologies GmbH).
0
100
200
300
400
500
600
25 26 27 28 29 30 31 32
Ab
sorb
ed h
eat
per
mas
s/te
mp
. ch
ange
[J/
gK]
Sample Temperature[℃]
C18H38(DSC,0.2℃/min,13mg)
SP30L(DSC,0.2℃/min,30mg)
SP30L(DSC,0.1℃/min,13mg)SP30L(3-layer)
0
500
1000
1500
18 20 22 24 26 28 30 32
Dis
sip
ated
hea
t p
er m
ass/
tem
p. c
han
ge[J
/gK
]
Sample Temperature[℃]
C18H38(DSC,0.2℃/min,13mg)
SP30L(DSC,0.2℃/min,30mg)
SP30L(3-layer)
subcool
solidification
solidification
(a) (b)
-50
0
50
100
150
200
25 26 27 28 29 30

International Conference on Environmental Systems
7
IV. Test Piece Design
A. Specifications and Manufacturing
The specifications of the test pieces are summarized in Table 4. Six pipes are embedded in the device for the
attachment with M5 bolts. The exterior dimensions are 80 mm x 100 mm x 20 mm despite the PCM density difference
to simplify the discussion. Both the top and the bottom surfaces should meet the general requirements for thermal
interfaces (arithmetic mean roughness < 1.6, flatness < 0.001mm/1mm). These values are achieved via machining
after form with a 3D printer. The CAD-based skin thickness is 1.25 mm to ensure 1.0 mm as the minimum thickness
after machining.
Test pieces were manufactured by Toyama Industrial Technology R&D Center using a laser powder bed fusion
machine, an EOSINT-M280 (EOS GmbH), which is equipped with a 400 W class Yb-fiber laser for selective melting.
The aluminum alloy (Al-Si10-Mg) powder provided by EOS GmbH, whose diameter is 10 - 30µm, was used. Ten
ports in the side walls allow powder removal after fabrication. All external skins of the device were machined after
molding. Eight ports were closed with a set of O-rings and bolts in advance and the rest were used for filling PCM in
a liquid state.
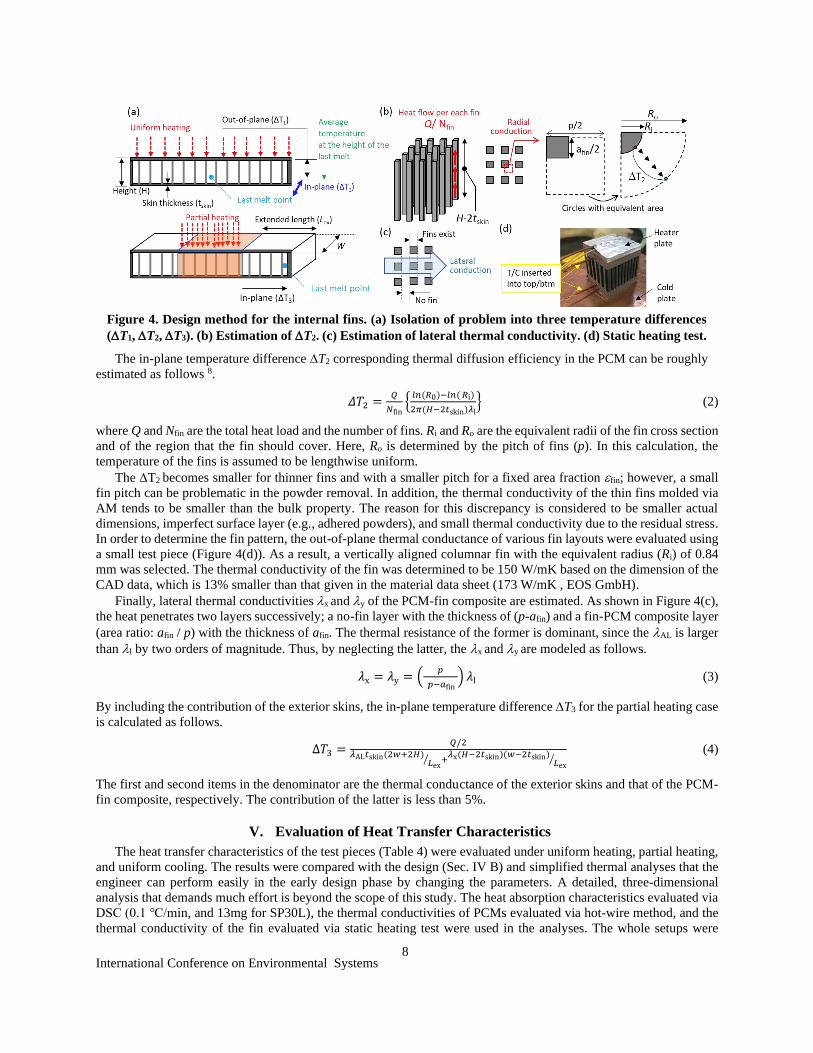
B. Design Method for Internal Fins
Since the amount of PCM filled in the device should be the minimum, the last melt point of PCM in the device,
which is usually the farthest from the heated region and from the fins, is the key factor to characterize the heat transfer
performance. The problem can be characterized by three temperature differences (T1, T2, and T3) as shown in
Figure 4 (a).
The out-of-plane temperature differences T1 can be roughly estimated as follows 8.
𝛥𝑇1 =𝑞( 𝐻−2𝑡skin)
λz=
𝑞 ( 𝐻−2𝑡skin)
𝜀fin𝜆𝐴𝐿+(1−𝜀fin)𝜆l (1)
where q, H, and fin are the applied heat flux, the height of the fins, and the area fraction of the fins. AL and l are
the thermal conductivities of the aluminum alloy (Al-Si10-Mg) and the filled PCM. Here, z is the effective out-of-
plane thermal conductivity when the PCM and the fins are regarded as solid objects, which is referred as “PCM-fin
composite” in this paper. The contributions of the side skins and the embedded pipes on the heat transfer at the
center is not significant, since the lateral thermal conductivity of the composite is very small as a result of vertically
aligned fin layout chosen in this study. Thus, z was calculated only with fin, AL and l.
Table 4. Specification of test pieces PCM-26(oct) PCM-26(SP30L) PCM-27(oct) PCM-27(SP30L)
PCM Octadecane SP30L Octadecane SP30L
External dimensions 80 mm (W) x 100 mm(L) x 20 mm (H) with six M5 bolt interfaces
Ports 10 ports sealed with O-ring and bolt
Skin thickness (tskin) Approx. 1.1 mm (1.25mm before machining)
Fin layout Vertically aligned (no lateral fins)
Area equivalent fin radius, Ri 0.84 mm
Fin pitch (p) 3.0 mm 4.0 mm
Fin area ratio (fin) 28.4% 16.0%
Effective thermal
conductivity [W/mK]
x, y 0.276 1.042 0.221 0.834
z+ 42.7 43.0 24.1 24.4
Additional out-of-plane thermal
conductance around the edges
Side skins: 3.89 W/K (in total. tskin = 1.1 mm is assumed.)
Embedded pipes: 2.84 W/K (in total)
Measured Mass [g]
Dry 200.0 200.8 165.8 164.2
PCM 61.2 (23.4 %) 121.2 (37.6 %) 70.4 (29.8 %) 135.3 (45.2 %)
Total 261.2 322.0 236.2 299.5
Latent heat of fusion (hf)*[kJ] 14.9 30.9 17.2 34.5
Heat storage efficiency*
[J/g] 57.0 96.0 72.8 115.2
[J/cm3] 93.0 193.1 107.5 215.6 +Calculated with AL =150W/mK determined via static heating test shown in Figure 4 (d).
*Calculated from material property measured and the measured PCM mass.
International Conference on Environmental Systems
8
The in-plane temperature difference T2 corresponding thermal diffusion efficiency in the PCM can be roughly
estimated as follows 8.
𝛥𝑇2 =𝑄
𝑁fin{
𝑙𝑛(𝑅0)−𝑙𝑛( 𝑅i)
2𝜋(𝐻−2𝑡skin)𝜆l} (2)
where Q and Nfin are the total heat load and the number of fins. Ri and Ro are the equivalent radii of the fin cross section
and of the region that the fin should cover. Here, Ro is determined by the pitch of fins (p). In this calculation, the
temperature of the fins is assumed to be lengthwise uniform.
The T2 becomes smaller for thinner fins and with a smaller pitch for a fixed area fraction fin; however, a small
fin pitch can be problematic in the powder removal. In addition, the thermal conductivity of the thin fins molded via
AM tends to be smaller than the bulk property. The reason for this discrepancy is considered to be smaller actual
dimensions, imperfect surface layer (e.g., adhered powders), and small thermal conductivity due to the residual stress.
In order to determine the fin pattern, the out-of-plane thermal conductance of various fin layouts were evaluated using
a small test piece (Figure 4(d)). As a result, a vertically aligned columnar fin with the equivalent radius (Ri) of 0.84
mm was selected. The thermal conductivity of the fin was determined to be 150 W/mK based on the dimension of the
CAD data, which is 13% smaller than that given in the material data sheet (173 W/mK , EOS GmbH).
Finally, lateral thermal conductivities x and y of the PCM-fin composite are estimated. As shown in Figure 4(c),
the heat penetrates two layers successively; a no-fin layer with the thickness of (p-afin) and a fin-PCM composite layer
(area ratio: afin / p) with the thickness of afin. The thermal resistance of the former is dominant, since the AL is larger
than l by two orders of magnitude. Thus, by neglecting the latter, the x and y are modeled as follows.
𝜆x = 𝜆y = (𝑝
𝑝−𝑎fin ) 𝜆l (3)
By including the contribution of the exterior skins, the in-plane temperature difference T3 for the partial heating case
is calculated as follows.
∆𝑇3 =𝑄/2
𝜆AL𝑡skin(2𝑤+2𝐻)𝐿ex
⁄ +𝜆x(𝐻−2𝑡skin)(𝑤−2𝑡skin)
𝐿ex⁄
(4)
The first and second items in the denominator are the thermal conductance of the exterior skins and that of the PCM-
fin composite, respectively. The contribution of the latter is less than 5%.
V. Evaluation of Heat Transfer Characteristics
The heat transfer characteristics of the test pieces (Table 4) were evaluated under uniform heating, partial heating,
and uniform cooling. The results were compared with the design (Sec. IV B) and simplified thermal analyses that the
engineer can perform easily in the early design phase by changing the parameters. A detailed, three-dimensional
analysis that demands much effort is beyond the scope of this study. The heat absorption characteristics evaluated via
DSC (0.1 ℃/min, and 13mg for SP30L), the thermal conductivities of PCMs evaluated via hot-wire method, and the
thermal conductivity of the fin evaluated via static heating test were used in the analyses. The whole setups were
Figure 4. Design method for the internal fins. (a) Isolation of problem into three temperature differences
(T1, T2, T3). (b) Estimation of T2. (c) Estimation of lateral thermal conductivity. (d) Static heating test.

International Conference on Environmental Systems
9
wrapped with foam insulation that is at least 60mm thick in all experiments. Thermal filler paste (1.35 W/mK) was
filled between the heater and test piece and between the test pieces and the cold plate.
A. Evaluation of device-level heat storage capacity
The test pieces were heated from room temperature to
approximately 50 ℃ at the heat flux of q = 0.5 W/cm2 with a thin
aluminum plate bonded with a polyimide sheet heater. The heat
storage capacities were calculated from the total heat input and the
change in the average temperature among the test piece and heater
before and two minutes later than the switching off, and then the
sensible heat was subtracted. The experimental results agree with the
designed value based on the PCM mass and the latent heat evaluated
via DSC. The significant improvement in the heat storage capacity
due to the employment of the salt hydrate (SP30L) has been
successfully demonstrated.
B. Melting Behavior under Uniform Heating
The test setup and thermocouple (T/C) locations are shown in Figure 6 (a, b). A thick aluminum heater block in
which four rod heaters are inserted was attached to the test piece using six PEEK bolts and SUS nuts. The temperature
distribution in the heater block is evaluated by T/Cs inserted into the holes in the vicinity of the thermal interface. The
temperature was the highest at the center, decreasing toward the edge. The difference between the center and the edge
was approximately 1.0 ℃. The temperature difference between the heater block and the top face of the device was
within 1.0 ℃ under the maximum heat flux (q = 1.0 W/cm2). The sheathed T/C inserted in the grooves (T/C #3),
which indicates an intermediate temperature of the heater and the top face of the device, is used in the calculations of
the overall temperature drop Ttot.
An example of temperature evolution is shown in Figure 6 (c). The T/C #22 starts to increase earlier than T/C #21
and T/C #20 due to the enhanced out-of-plane heat conduction through the side skins and embedded pipes. The
temperature difference between T/C #3 and Tm, and that between T/C #20 and Tm are considered to be close to Ttot
and T2 in Sec. IV B, respectively. The T1 was calculated as T1= Ttot - T2.
The time when the PCM completely melts in the experiment was determined from T/C #20 as follows. A thermal
analysis for a fin and the surrounding PCM was performed via Thermal Desktop ® as shown in Figure 7(a-b). The
top and bottom skins of the device were neglected in the analysis. The time when the PCM completely melts
corresponds to the time when the temperature of “PCM_BTM” starts to rise sharply. The first order and the second
order differentials (designated as dT/dt and d2T/dt2, respectively) of the fin temperature at the bottom (FIN_Btm) are
shown in Figure 7(b). The time for the peak of d2T/dt2 is closer to the time for the complete melt of PCM than that of
Figure 5 Heat storage capacity
excluding sensible heat.
0
10
20
30
40
Oct. SP30L Oct. SP30LLate
nt
he
at o
f fu
sio
n [
kJ]
Design
Test
PCM-26 PCM-27
Figure 6. Uniform heating experiment. (a) Setup. (b) Thermocouple locations. (c) An example of
temperature data (PCM-26, SP30L, Q = 80 W (1.0 W/cm2)).

International Conference on Environmental Systems
10
dT/dt. Thus, in the experiment, the time when d2T/dt2 of T/C #20 peaked was determined as the time for the complete
melt of PCM. The dT/dt and d2T/dt2 calculated with the raw temperature data have a high dispersion due to the small
temperature change around the Tm. Therefore, the moving averages of those were taken in the range of ± 20 s to smooth
the curve.
A comparison of Ttot among the design, analysis, and experiment are shown in Figure 7 (c). The contributions of
T1 and T2 are indicated by color. For the analysis, the differences between FIN_TOP and FIN_BTM and that
between FIN_BTM and PCM_BTM were taken as T1 and T2, respectively. Overall, both of the design and analysis
are confirmed to give good quantitative predictions. PCM-26 (oct), PCM-26 (SP30L), and PCM-27 (SP30L) have
been confirmed to meet the thermal requirement (Ttot < 10 K under q =1.0 W/cm2, Table 1).
The Ttot in the experiment remained in the similar values to those in the analysis, even though the influence of
the side skins and the embedded pipes were neglected in the analysis. In addition, a larger Ttot was observed in the
experiment than the analysis for PCM26 (SP30L). The out-of-plane thermal conductance of the skins and the pipes
are estimated as 3.89 W/K and 2.84 W/K in total, respectively. Those of the PCM-fin composite are estimated as 19.7
W/K (PCM-26) and 11.2 W/K (PCM-27). The PCM around the edge of the device melts earlier, and then the heat
conducts through the bottom skin from the edges to the center. However, the contribution of this in-plane conduction
is not significant compared to the out-of-plane conduction through the fin.
The difference between the two PCMs in the experiment was significantly smaller than expected in the design.
The mechanism can be explained as follows. In the analysis, a part of the heat input branches off from the axial heat
flow to the radial heat flow, resulting in a smaller T1 than the design (Eq. (1)). This effect is more pronounced when
the thermal conductivity of PCM is large. On the other hand, the T2 is underestimated in the design due to the
assumption of temperature uniformity in the height. The PCM at the top melts before the bottom of the fin starts to
heat up. In the late stage, PCM at the upper region has already melted, thus the heat input from the top mostly conducts
through the fin. The radial heat flux from the fin to PCM at the bottom becomes higher than the assumption under the
uniform temperature condition, resulting in a larger T2. This effect is also more pronounced when the thermal
conductivity of PCM is large, since the PCM at the upper region melts earlier. A larger fin radius (Ri) will suppress
this mechanism because the fin temperature becomes more uniform in the height; however, it also expands the fin
pitch (p) given the fixed fin area ratio (fin) leading to larger T2. There is no doubt that the adoption of a PCM with a
larger conductivity will improve the thermal performance of the device; however, improvement of design method is
necessary to use its potential.
C. Melting Behavior Under Partial Heating
The current fin layout is not intended for use under a partial heating condition. However, the footprint area of the
target and the allowable height for the PCM device may not be sufficient to meet the heat storage requirement. In that
case, the thermal engineer will consider a slight extension of the footprint of the PCM device. Another possibility of
partial heating is a very ununiform heat dissipation from the component. Therefore, the thermal modeling of the lateral
heat conduction of the device is also significant.
Figure 7. Thermal analysis for a fin and surrounding PCM with Thermal Desktop ®. (a) Temperature
contour at the time for complete melt. (b) Temperature evolution for PCM-26(oct), Q = 80 W (1.0 W/cm2).
(c) Comparison of the design, analysis, and experiment on Ttot= T1 + T2 for q = 1.0 W/cm2.

International Conference on Environmental Systems
11
The setup, T/C locations, and an example of the temperature evolution with the heat load Q = 80 W (q = 2.0
W/cm2) are shown in Figure 8(a, b, c), respectively. The temperature at the bottom center (T/C #20) start to increase
earlier than the those at the top edge (T/C #26, T/C #27).
A three-dimensional thermal analysis was performed as shown in Figure 9(a-b). The internal PCM-fin composite
excluding the skins and embedded pipes is modeled as a solid rectangular with an anisotropic thermal conductivity
(x, y, and z listed in Table 3). The density was set at the volume-average of those for the aluminum and the PCM in
a liquid state. The external skins were modeled as surfaces with the thickness of 1.1 mm. The comparison in the Ttot
among the design, 3D analysis, and experiment is shown in Figure 9(c). In the design, it was roughly estimated as
Ttot = T1 / 2 + T3. Overall, both of the design and the analysis are shown to give conservative estimations. The
possible reasons of small Ttot in the experiment are the thicker skin than the current assumption, the existence of
embedded pipes, the uncertainty of the skin thickness due to machining, and determination error of the time for the
complete melt of PCM.
D. Freezing Behavior under Uniform Cooling
The experimental setup and T/C locations are shown in Figure 10 (a, b). The test piece was attached to an aluminum
cold plate with six PEEK bolts. The cold plate was initially maintained at 40℃ via heater control. The fluid (a mixture
of water and Nybrine Z1) began circulating when the valve was opened.
Figure 8. Partial heating experiment. (a) Setup. (b) Thermocouple locations. (c) An example of temperature
data (PCM-26, SP30L, Q = 80 W (q = 2.0 W/cm2 when calculated with contact area).
Figure 9. Thermal Analysis via Thermal Desktop ®. (a) Example of temperature contour map. The location
of the nodes referred in (a) is also shown. (b) Example of temperature evolution, (c) Comparison with the
design and the experimental result on the temperature difference Ttot

International Conference on Environmental Systems
12
The result for PCM-26 (oct) is shown in Figure 10 (c). The temperatures of both the cold plate and the PCM device
started to increase when those reach 26.5 - 27.0 ℃, which is the sign of solidification. The solidification happened all
over the device within 0.5 min. The solidification point (Ts) agrees with the result of DSC (Figure 3).
The result for PCM-26 (SP30L) is shown in Figure 10 (d). The Ts was 24.5 - 25.0 ℃, which is slightly lower than
the result of 3-layer calorimeter (26.0 ℃). The solidification did not occur simultaneously, even though the in-plane
temperature variation in the cold plate was within ± 0.3 ℃. The solidification propagated from the bottom left to the
top right (based on Figure 10(b)). The temperature increased sharply when the solidification occurred, both in the cold
plate (e.g., #30) and the top skin of the device (e.g., T/C #23). It indicates that the solidification propagates rapidly in
vertical direction. Note that it is not clear whether the solidification at a point influences those in the neighborhood. It
is also possible that solidification is caused simply by the local temperature. The solidification of PCM dissipates a
large amount of heat, which may lead to temperature increase in the neighborhood. The actual phenomenon is
considered to be very complicated.
The solidification behavior is known to be influenced by the sample amount, cooling rate, and mechanical
disturbance, existence of nuclei, and so on. Since SP30L is not the pure material, the composition may be nonuniform
in the device, which may cause spatial variation in the solidification point. The thorough physical discussion is difficult
without knowing the PCM temperature itself. However, it is crucially important to know which temperature the cold
plate should take for solidification of the PCM device and how the solidification propagates, especially when the
Figure 10. Freezing experiment. (a) Setup. (b) Thermocouple locations. (c) Temperature evolution for
PCM-26 (Oct). (d) Temperature evolution for PCM-26 (SP30L). The graphs for the cold plate and the
PCM device in the same experiment are separated to improve visibility in (c) and (d).

International Conference on Environmental Systems
13
device is used cyclically in a short time period (e.g., observation instrument in an LEO satellite). Partial cooling
behavior should be also understood, since it happens when the device is cooled via a fluid loop or heat pipes.
The thermal analysis for cooling experiment has not been performed since the subcooling followed by a
temperature backlash during solidification cannot be modeled only with a standard function of Thermal Desktop ®.
An elaborated SINDA/Fluint code and a modeling of the thermal response are necessary in the future.
VI. Conclusion
A spacer-type PCM device made by additive manufacturing (AM) was designed, manufactured, and tested. A
highly anisotropic, vertically aligned fin layout was shown to meet a strict requirement for a high heat flux component,
up to 1.0 W/cm2. In addition, high-density lithium nitrate trihydrate-based PCM (SP30L, Rubitherm Technologies
GmbH) was introduced. Its heat absorption/dissipation characteristic was evaluated via DSC and 3-layer calorimeter;
the results were consistent except for solidification point. The device filled with SP30L showed a significantly higher
heat storage capacity than one filled with octadecane. The overall temperature drop Ttot was not significantly reduced
by adopting SP30L despite its large thermal conductivity. The problem is very complicated because the influences of
density and thermal conductivity are not separated. Further experimental and analytical works are necessary to
quantify the influence of each parameter. The solidification point for the device is a few K lower than the material
level. The difference may be crucial in cyclic use in an LEO satellite. Further development and testing of salt hydrates
are necessary, including thermal cycle stability and chemical compatibility.
Acknowledgments
We are grateful to Dr. E. Kieseritzky and Mr. G. Lindenberg in Rubitherm Technologies GmbH for helpful
discussions on the characteristics of salt hydrates and testing methods.
References 1 Guilmore D. G., Spacecraft thermal control handbook, 2nd ed., The Aerospace Press, El Segundo, 2002, volume 1, Chaps. 11. 2 T. J. Cognata et al., “A Review of the Experimental and Modeling Development of a Water Phase Change Heat Exchanger
for Future Exploration Support Vehicles,” 41st International Conference of Environmental Systems, AIAA-2011-5208, 2011. 3T. R. Knowles, “PCM Composite Cold Plate,” PL-TR-96-1104, Final Report, 1996 4C. L. Seaman et al., “Enhanced Thermal Conductance of ORU Radiant Fin Thermal Interface using Carbon Brush Materials,”
proceedings of Space Technology & Applications Forum (STAIF-99), 1999. 5G. Quinn, W. Beringer, B. Gleason, and Ryan Stephan, “Braze Development of Graphite Fiber for Use in Phase Change
Material Heat Sinks,” 41st International Conference of Environmental Systems, AIAA-2011-5230, 2011. 6 M. Pauken & N. Emis, “Thermal Energy Storage Devices,” TFAWS2006. 7 M. Pauken et al., “Thermal Energy Storage Technology Developments,” Space Technology and Applications International
Forum, 2007. 8 R. Hatakenaka et al. “Heat-transfer Characteristics of a Light-weight, Fin-integrated PCM Unit manufactured by Additive
Manufacturing,” 47th International Conference of Environmental Systems, ICES-2017-346, 2017. 9 D. Wild et al., “Thermal Characterization of additive manufactured Integral Structures for Phase Change Applications,” 50th
International Conference of Environmental Systems, ICES-2020-183, 2020. 10 P. G. Grodzka, “Space Thermal Control by Freezing and Melting,” NAS8-21123, 1969. 11 D.V. Hale et al., “Phase Change Materials HANDBOOK,” NASA CR-61363, 1971. 12 M. Rathod & J. Banerjee, “"Thermal stability of phase change materials used in latent heat energy storage systems: A review”,
Energy Conversion and Management, 18, 246-258, 2013. 13 G. A. Lane, Solar Heat Storage: Latent Heat Material, volume 2: Technology, CRC Press, 2018. 14 Kojundo Kagaku Inc. Website: https://www.kojundo.co.jp/dcms_media/other/smartec_hs_20150811.pdf 15 The National Institute of Advanced Industrial Science and Technology (AIST), website, news release (12 Oct. 2020),
https://www.aist.go.jp/aist_j/press_release/pr2020/pr20201012/pr20201012.html 16 RAL-GZ896, Phase Change Material Quality Assurance, 2018. 17 F. Kenfack and M. Bauer, “Innovative Phase Change Material (PCM) for heat storage for industrial applications,” Energy
Procedia 46, 310-316, 2014. (3-layer calorimeter) 18 A. Lazaro et al., “Verification of a T-history installation to measure enthalpy versus temperature curves of phase change
materials,” Meas. Sci. Technol., 17, 2168-2174, 2006. 19 A. Nagashima et al., Thermal Conductivity Mearsurement of Liquid via Transient Hot Wire Method (Part 1: Measurement
under Atmospheric Condition),” Transactions of the JSME (in Japanese), 43, 370, 2268-2277, 1977. 20 P. J. Shamberger & T. Reid, “Thermophysical Properties of Lithium Nitrate Trihydrate from 253-353K,” J. Chem. Eng. Data,
57, 1404-1411, 2012.